raps to eds collaboration: april 6, 2017 a data-driven ... neutral because the change in format was...
TRANSCRIPT

RAPS to EDS Collaboration:
A Data-Driven Analysis National Medicare Advantage Summit
April 6, 2017
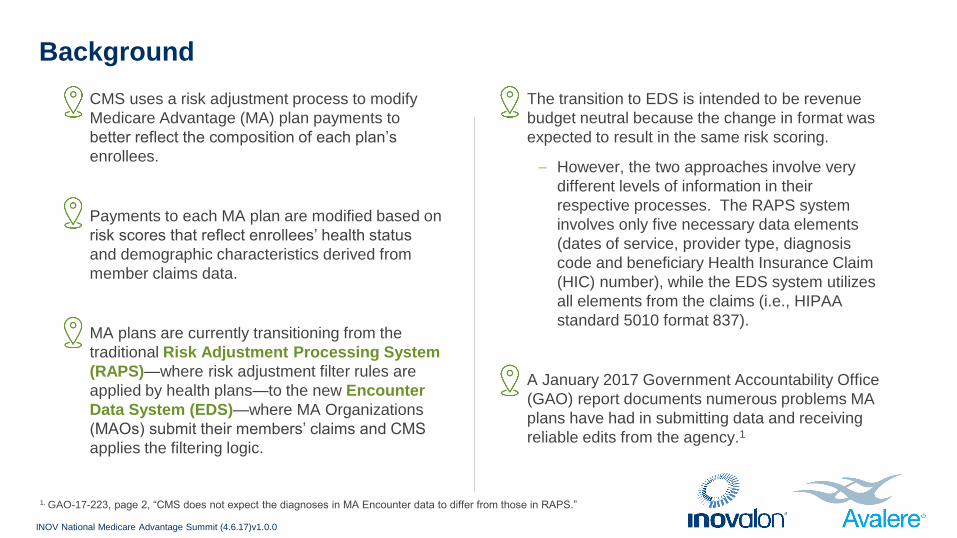
Background
CMS uses a risk adjustment process to modify
Medicare Advantage (MA) plan payments to
better reflect the composition of each plan’s
enrollees.
Payments to each MA plan are modified based on
risk scores that reflect enrollees’ health status
and demographic characteristics derived from
member claims data.
MA plans are currently transitioning from the
traditional Risk Adjustment Processing System
(RAPS)—where risk adjustment filter rules are
applied by health plans—to the new Encounter
Data System (EDS)—where MA Organizations
(MAOs) submit their members’ claims and CMS
applies the filtering logic.
The transition to EDS is intended to be revenue
budget neutral because the change in format was
expected to result in the same risk scoring.
– However, the two approaches involve very
different levels of information in their
respective processes. The RAPS system
involves only five necessary data elements
(dates of service, provider type, diagnosis
code and beneficiary Health Insurance Claim
(HIC) number), while the EDS system utilizes
all elements from the claims (i.e., HIPAA
standard 5010 format 837).
A January 2017 Government Accountability Office
(GAO) report documents numerous problems MA
plans have had in submitting data and receiving
reliable edits from the agency.1
1. GAO-17-223, page 2, “CMS does not expect the diagnoses in MA Encounter data to differ from those in RAPS.”
INOV National Medicare Advantage Summit (4.6.17)v1.0.0
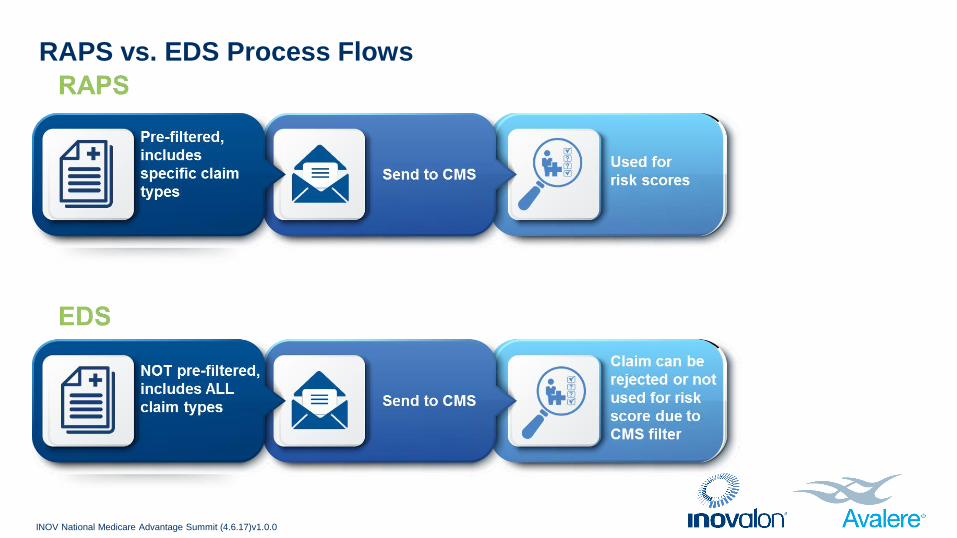
RAPS vs. EDS Process Flows
INOV National Medicare Advantage Summit (4.6.17)v1.0.0
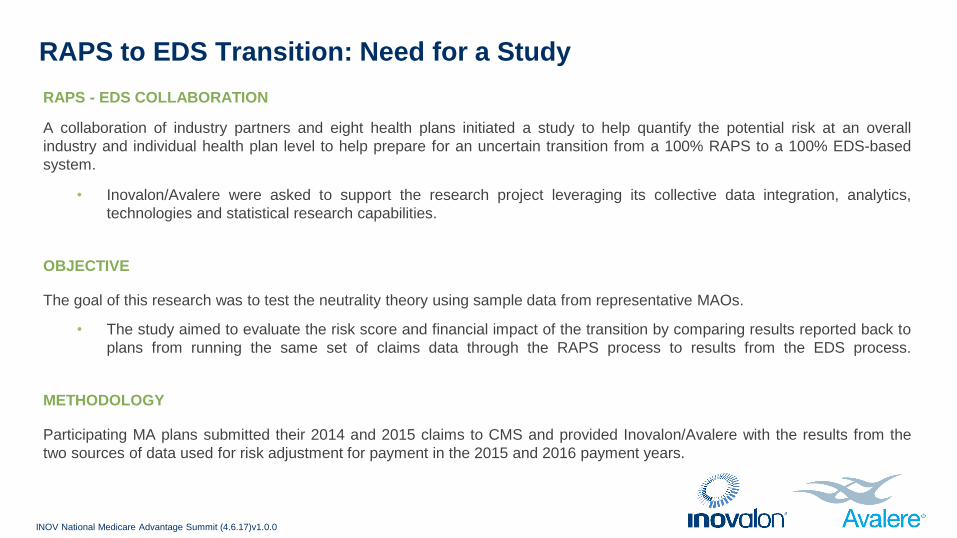
RAPS - EDS COLLABORATION
A collaboration of industry partners and eight health plans initiated a study to help quantify the potential risk at an overall
industry and individual health plan level to help prepare for an uncertain transition from a 100% RAPS to a 100% EDS-based
system.
• Inovalon/Avalere were asked to support the research project leveraging its collective data integration, analytics,
technologies and statistical research capabilities.
OBJECTIVE
The goal of this research was to test the neutrality theory using sample data from representative MAOs.
• The study aimed to evaluate the risk score and financial impact of the transition by comparing results reported back to
plans from running the same set of claims data through the RAPS process to results from the EDS process.
METHODOLOGY
Participating MA plans submitted their 2014 and 2015 claims to CMS and provided Inovalon/Avalere with the results from the
two sources of data used for risk adjustment for payment in the 2015 and 2016 payment years.
RAPS to EDS Transition: Need for a Study
INOV National Medicare Advantage Summit (4.6.17)v1.0.0
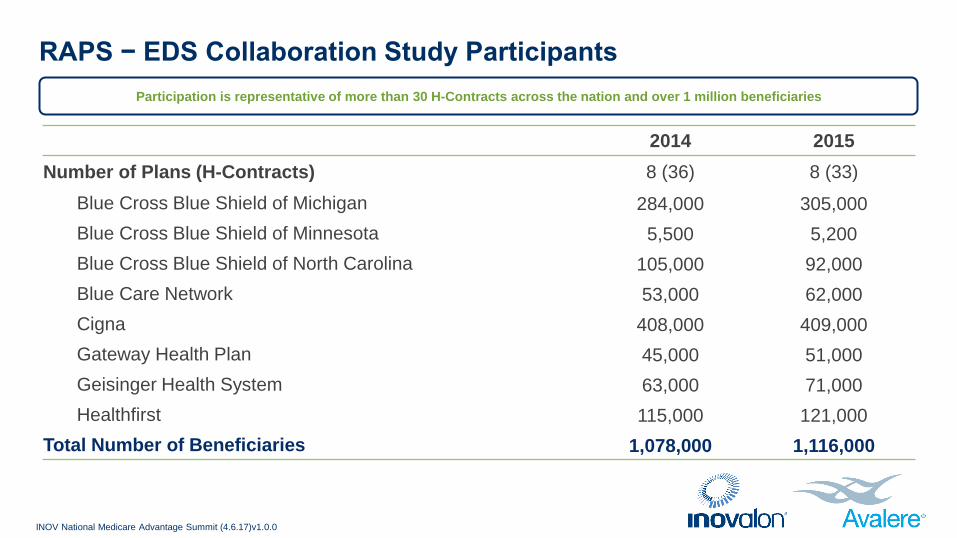
RAPS − EDS Collaboration Study Participants
INOV National Medicare Advantage Summit (4.6.17)v1.0.0
2014 2015
Number of Plans (H-Contracts) 8 (36) 8 (33)
Blue Cross Blue Shield of Michigan 284,000 305,000
Blue Cross Blue Shield of Minnesota 5,500 5,200
Blue Cross Blue Shield of North Carolina 105,000 92,000
Blue Care Network 53,000 62,000
Cigna 408,000 409,000
Gateway Health Plan 45,000 51,000
Geisinger Health System 63,000 71,000
Healthfirst 115,000 121,000
Total Number of Beneficiaries 1,078,000 1,116,000
Participation is representative of more than 30 H-Contracts across the nation and over 1 million beneficiaries
Research Questions
INOV National Medicare Advantage Summit (4.6.17)v1.0.0
Differences in Risk Scores: RAPS vs. EDS
Payment Impact Based on Transition Scenarios
Difference in HCCs Identified: RAPS vs. EDS
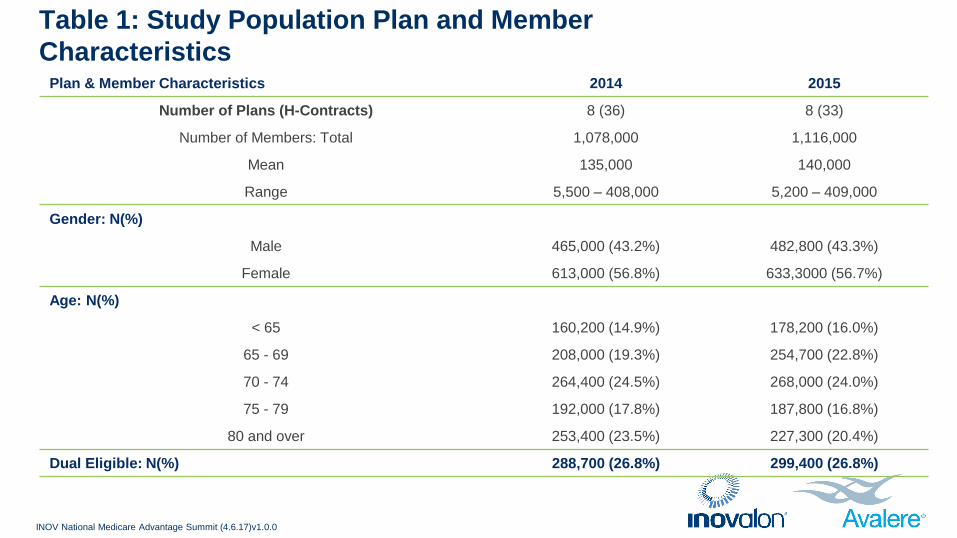
Table 1: Study Population Plan and Member
Characteristics
INOV National Medicare Advantage Summit (4.6.17)v1.0.0
Plan & Member Characteristics 2014 2015
Number of Plans (H-Contracts) 8 (36) 8 (33)
Number of Members: Total 1,078,000 1,116,000
Mean 135,000 140,000
Range 5,500 – 408,000 5,200 – 409,000
Gender: N(%)
Male 465,000 (43.2%) 482,800 (43.3%)
Female 613,000 (56.8%) 633,3000 (56.7%)
Age: N(%)
< 65 160,200 (14.9%) 178,200 (16.0%)
65 - 69 208,000 (19.3%) 254,700 (22.8%)
70 - 74 264,400 (24.5%) 268,000 (24.0%)
75 - 79 192,000 (17.8%) 187,800 (16.8%)
80 and over 253,400 (23.5%) 227,300 (20.4%)
Dual Eligible: N(%) 288,700 (26.8%) 299,400 (26.8%)
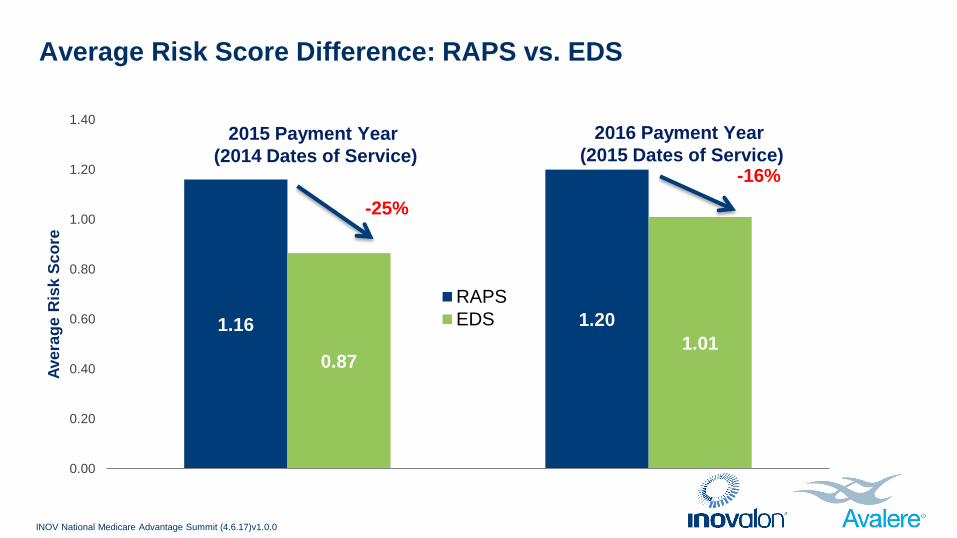
Average Risk Score Difference: RAPS vs. EDS
INOV National Medicare Advantage Summit (4.6.17)v1.0.0
1.16 1.20
0.87 1.01
0.00
0.20
0.40
0.60
0.80
1.00
1.20
1.40
Ave
rag
e R
isk
Sc
ore
RAPS
EDS
-25%
-16%
2015 Payment Year
(2014 Dates of Service)
2016 Payment Year
(2015 Dates of Service)
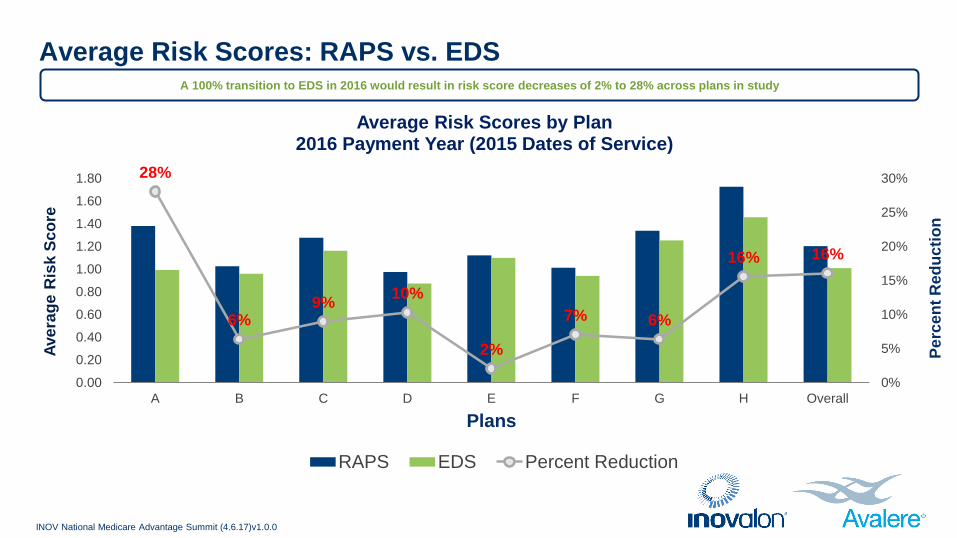
Average Risk Scores: RAPS vs. EDS
INOV National Medicare Advantage Summit (4.6.17)v1.0.0
28%
6% 9%
10%
2%
7% 6%
16% 16%
0%
5%
10%
15%
20%
25%
30%
0.00
0.20
0.40
0.60
0.80
1.00
1.20
1.40
1.60
1.80
A B C D E F G H Overall
Pe
rce
nt
Red
uc
tio
n
Ave
rag
e R
isk
Sc
ore
Plans
Average Risk Scores by Plan 2016 Payment Year (2015 Dates of Service)
RAPS EDS Percent Reduction
A 100% transition to EDS in 2016 would result in risk score decreases of 2% to 28% across plans in study
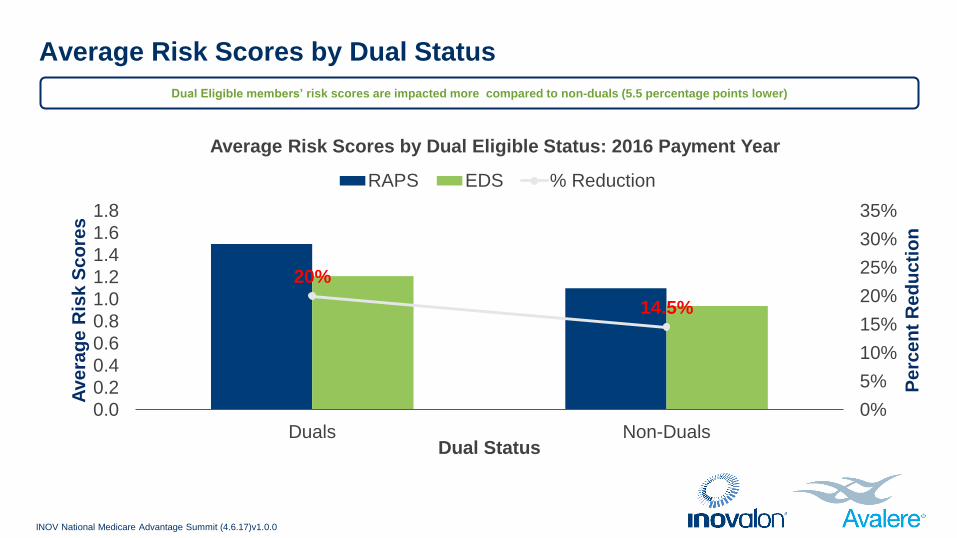
Average Risk Scores by Dual Status
INOV National Medicare Advantage Summit (4.6.17)v1.0.0
20%
14.5%
0%
5%
10%
15%
20%
25%
30%
35%
0.0
0.2
0.4
0.6
0.8
1.0
1.2
1.4
1.6
1.8
Duals Non-Duals
Pe
rce
nt
Re
du
cti
on
Ave
rag
e R
isk
Sc
ore
s
Dual Status
Average Risk Scores by Dual Eligible Status: 2016 Payment Year
RAPS EDS % Reduction
Dual Eligible members’ risk scores are impacted more compared to non-duals (5.5 percentage points lower)

Average Risk Scores by Age Group
INOV National Medicare Advantage Summit (4.6.17)v1.0.0
25%
28% 30% 29% 28%
19% 19% 18%
16% 14%
0%
5%
10%
15%
20%
25%
30%
35%
0.00
0.20
0.40
0.60
0.80
1.00
1.20
1.40
1.60
1.80
00-34 35-44 45-54 55-59 60-64 65-69 70-74 75-79 80-84 85+
Pe
rce
nt
Dif
fere
nce
Ave
rag
e R
isk
Sc
ore
Age Group
Average Risk Scores by Age Group 2016 Payment Year (2015 Dates of Service)
RAPS EDS Difference
Risk score differences between RAPS and EDS range from 14% to 30% across age groups but are greater for younger beneficiaries compared to
those age 65+
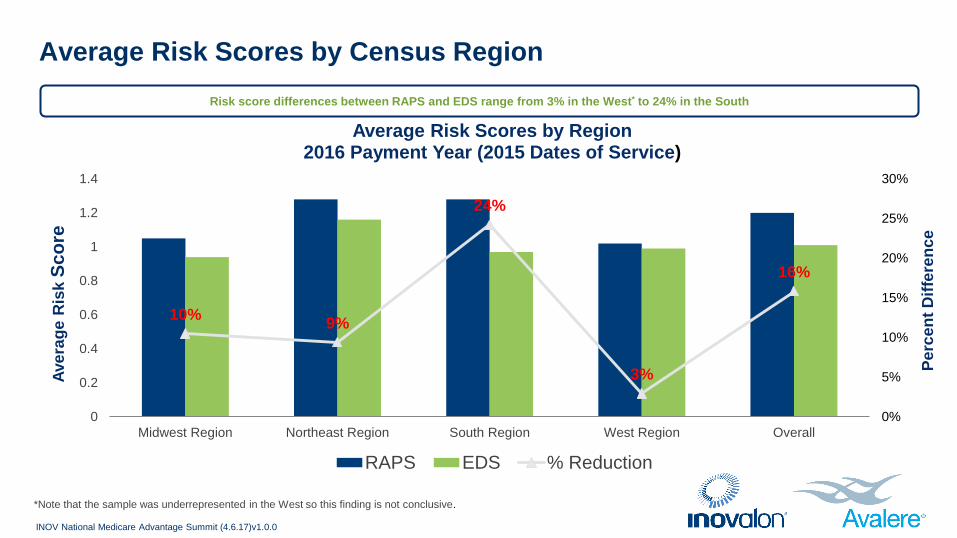
Average Risk Scores by Census Region
INOV National Medicare Advantage Summit (4.6.17)v1.0.0
10% 9%
24%
3%
16%
0%
5%
10%
15%
20%
25%
30%
0
0.2
0.4
0.6
0.8
1
1.2
1.4
Midwest Region Northeast Region South Region West Region Overall
Pe
rce
nt
Dif
fere
nce
Ave
rag
e R
isk
Sc
ore
Average Risk Scores by Region 2016 Payment Year (2015 Dates of Service)
RAPS EDS % Reduction
Risk score differences between RAPS and EDS range from 3% in the West* to 24% in the South
*Note that the sample was underrepresented in the West so this finding is not conclusive.
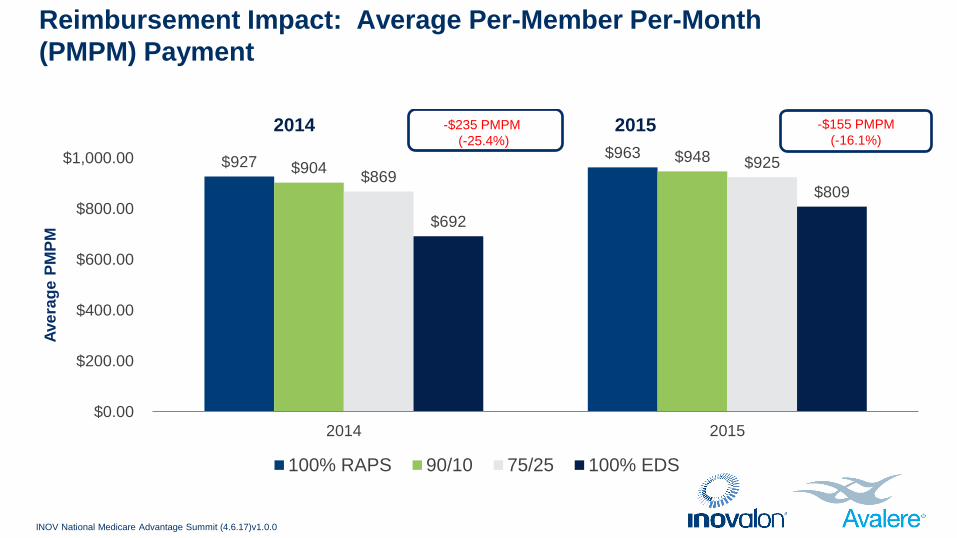
Reimbursement Impact: Average Per-Member Per-Month
(PMPM) Payment
INOV National Medicare Advantage Summit (4.6.17)v1.0.0
$927 $963
$904 $948
$869 $925
$692
$809
$0.00
$200.00
$400.00
$600.00
$800.00
$1,000.00
2014 2015
Ave
rag
e P
MP
M
2014 2015
100% RAPS 90/10 75/25 100% EDS
-$235 PMPM
(-25.4%)
-$155 PMPM
(-16.1%)

Distribution of HCCs Per Member: RAPS vs. EDS
INOV National Medicare Advantage Summit (4.6.17)v1.0.0
28.2%
39.3%
25.3%
24.7%
17.5%
15.3%
29.0% 20.7%
0%
10%
20%
30%
40%
50%
60%
70%
80%
90%
100%
RAPS EDS
Pe
rce
nt
of
Me
mb
ers
2015
3 or more
2
1
0
Number of HCCs
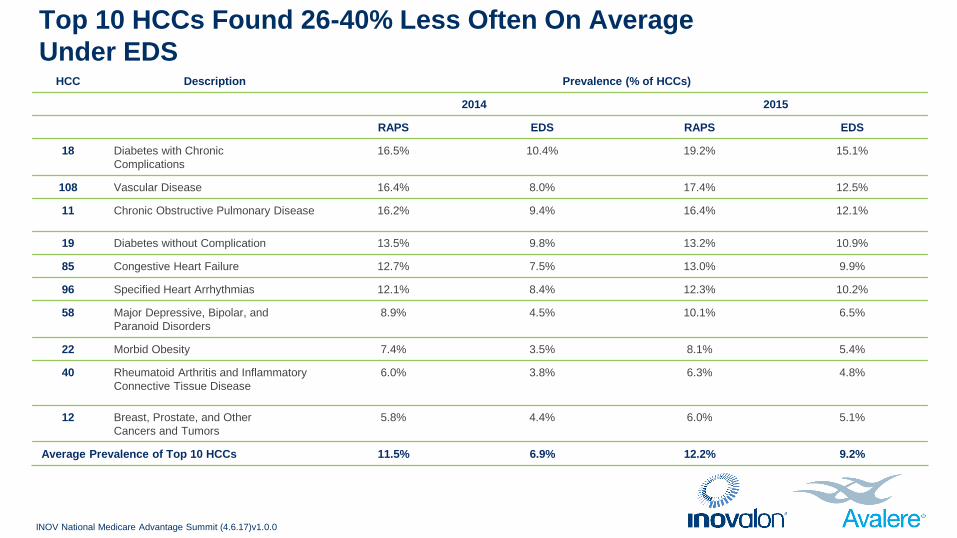
Top 10 HCCs Found 26-40% Less Often On Average
Under EDS
INOV National Medicare Advantage Summit (4.6.17)v1.0.0
HCC Description Prevalence (% of HCCs)
2014 2015
RAPS EDS RAPS EDS
18 Diabetes with Chronic
Complications
16.5% 10.4% 19.2% 15.1%
108 Vascular Disease 16.4% 8.0% 17.4% 12.5%
11 Chronic Obstructive Pulmonary Disease 16.2% 9.4% 16.4% 12.1%
19 Diabetes without Complication 13.5% 9.8% 13.2% 10.9%
85 Congestive Heart Failure 12.7% 7.5% 13.0% 9.9%
96 Specified Heart Arrhythmias 12.1% 8.4% 12.3% 10.2%
58 Major Depressive, Bipolar, and
Paranoid Disorders
8.9% 4.5% 10.1% 6.5%
22 Morbid Obesity 7.4% 3.5% 8.1% 5.4%
40 Rheumatoid Arthritis and Inflammatory
Connective Tissue Disease
6.0% 3.8% 6.3% 4.8%
12 Breast, Prostate, and Other
Cancers and Tumors
5.8% 4.4% 6.0% 5.1%
Average Prevalence of Top 10 HCCs 11.5% 6.9% 12.2% 9.2%
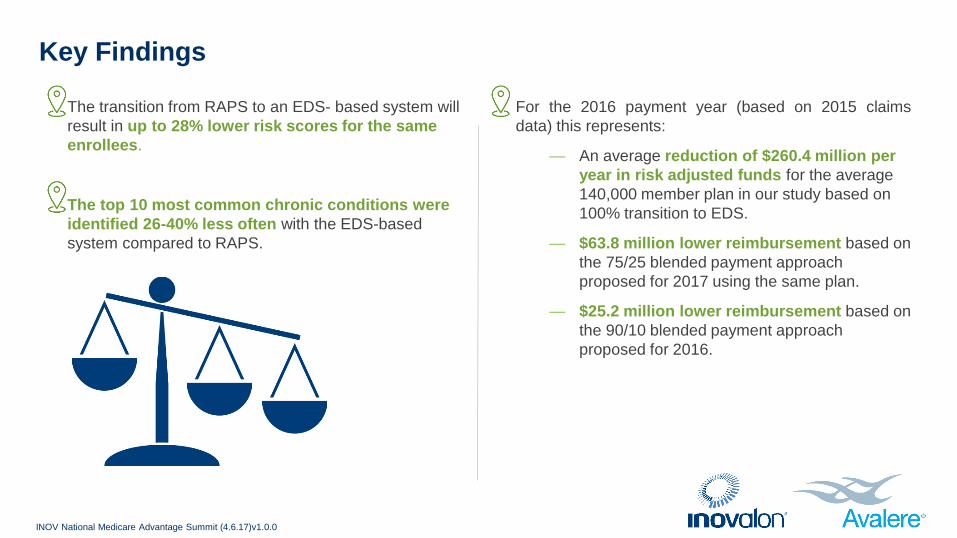
Key Findings
INOV National Medicare Advantage Summit (4.6.17)v1.0.0
The transition from RAPS to an EDS- based system will
result in up to 28% lower risk scores for the same
enrollees.
The top 10 most common chronic conditions were
identified 26-40% less often with the EDS-based
system compared to RAPS.
For the 2016 payment year (based on 2015 claims
data) this represents:
— An average reduction of $260.4 million per
year in risk adjusted funds for the average
140,000 member plan in our study based on
100% transition to EDS.
— $63.8 million lower reimbursement based on
the 75/25 blended payment approach
proposed for 2017 using the same plan.
— $25.2 million lower reimbursement based on
the 90/10 blended payment approach
proposed for 2016.

As MAOs work with CMS to submit encounter data, outlined below are the following best practices to ensure a smooth
transition from RAPS to EDS.
Health Plans
• Understanding that EDS submission involves a good workflow and not necessarily a tool for submission.
• Designing workflows with a combination of tools which help with submission, error correction and reporting.
• Building a strong team internally that understands claims data and the flow of data through EDS.
• Keeping informed of CMS system changes and edits.
CMS Partnership
• Working with MAOs to understand their claims data and data flow.
• Providing benchmarks to help better understand operational, performance and data quality needs.
• Continuous evaluation of the data elements collected as part of EDS submission and the filtering logic applied for EDS.
Next Steps - Recommendations
INOV National Medicare Advantage Summit (4.6.17)v1.0.0

Summary
INOV National Medicare Advantage Summit (4.6.17)v1.0.0
The continued transition to an encounter data
system is likely to have significant impacts on the
MA program and the beneficiaries they serve until
the differences in resulting risk scores are
resolved.
Lower reimbursements could influence plans
benefit design decisions and ultimately adversely
impact the most high need, high cost
beneficiaries who are younger, disabled, low
income, dual eligible and with multiple
comorbidities.
• For 2016 payment year (2015 DOS), final deadline for submitting EDS data is extended to May 1, 2017. The RAPS deadline was January 31, 2017.
Risk scores for the final payment will be calculated using 90% of RAPS and 10% of EDS risk score.
• For 2017 payment year (2016 DOS), 75% of RAPS and 25% of EDS will be used for risk score calculation in the final payment reconciliation.
• From the CMS 2018 Announcement, released on April 3, 2017:
— In recognition of operational and other challenges associated with the RAPS-to-EDS transition, CMS is proposing to scale back the blend to
85% RAPS, 15% EDS for 2018.
— CMS did not include an updated transition schedule for future years.
— CMS is currently not considering applying a uniform adjustment to the portion of the risk score calculated using EDS data across the industry.
• CMS Monitoring and Compliance Activities Regarding Encounter Data. CMS will focus its oversight on the following areas:
— Operational Performance: Measures of performance on submission of encounter data and compliance with requirements (e.g., certification to
submit and frequency of submission)
— Completeness Performance: Measures of volume and completeness of encounter data submitted
— Accuracy Performance: Measures of the “reasonableness” of
data submitted (e.g., reasonable patterns of HCPCS
and diagnosis codes)
Latest CMS Guidelines - EDS Transition
INOV National Medicare Advantage Summit (4.6.17)v1.0.0

Contact
INOV National Medicare Advantage Summit (4.6.17)v1.0.0
Arati Swadi
Inovalon
Senior Director
