rapid urban growth and land use patterns in doha, qatar
TRANSCRIPT
Portland State University Portland State University
PDXScholar PDXScholar
Urban Studies and Planning Faculty Publications and Presentations
Nohad A. Toulan School of Urban Studies and Planning
6-30-2017
Rapid Urban Growth and Land Use Patterns in Doha, Rapid Urban Growth and Land Use Patterns in Doha,
Qatar: Opportunities for Sustainability Qatar: Opportunities for Sustainability
Vivek Shandas Portland State University, [email protected]
Yasuyo Makido Portland State University
Salim Ferwati Qatar University
Follow this and additional works at: https://pdxscholar.library.pdx.edu/usp_fac
Part of the Urban Studies and Planning Commons
Let us know how access to this document benefits you.
Citation Details Citation Details Shandas, V., Makido, Y. and Ferwati, S. (2017). Rapid Urban Growth and Land Use Patterns in Doha, Qatar: Opportunities for Sustainability?. European Journal of Sustainable Development Research, 1(2), 11. doi: 10.20897/ejosdr.201711
This Article is brought to you for free and open access. It has been accepted for inclusion in Urban Studies and Planning Faculty Publications and Presentations by an authorized administrator of PDXScholar. Please contact us if we can make this document more accessible: [email protected].
Copyright © 2017 by Author/s and Licensed by Lectito BV, Netherlands. This is an open access article distributed under the Creative Commons
Attribution License which permits unrestricted use, distribution, and reproduction in any medium, provided the original work is properly cited.
European Journal of Sustainable Development Research, 1:2 (2017), 11 ISSN: 2542-4742
Rapid Urban Growth and Land Use Patterns in Doha, Qatar: Opportunities for
Sustainability?
Vivek Shandas1*, Yasuyo Makido1, Salim Ferwati2
1 Portland State University, USA 2 Qatar University, Qatar *Corresponding Author: [email protected] Citation: Shandas, V., Makido, Y. and Ferwati, S. (2017). Rapid Urban Growth and Land Use Patterns in Doha, Qatar: Opportunities for Sustainability?. European Journal of Sustainable Development Research, 1(2), 11. doi: 10.20897/ejosdr.201711 Published: June 30, 2017 ABSTRACT
Amidst chaotic growth of Asian cities, the expansion of urban infrastructure in the Middle East’s Gulf region is arguably outpacing any other region on the planet. Yet we have a limited understanding of the types of urban form or the extent to which this rapid urbanization is giving rise to sustainable patterns of growth. We ask, what is the pace and character of urban growth in one Middle East city, Doha, Qatar. By using remotely sensed imagery from 1987 to 2013, we examined the pace, quality, and characteristics of urban growth. We further use the results to create a typology of urban growth that integrates historical and spatial dimensions for describing the qualitative aspects of growth and its implications on regional landscapes. Our results suggest that Doha is creating development patterns similar to many Western cities, and that planners may need to consider whether the emerging urban form offers opportunities for more sustainable growth in the future.
Keywords: rapid urbanization, development pattern, remote sensing, Doha, Qatar
INTRODUCTION
While the population of many urban areas around the globe is increasing, few regions are experiencing growth as fast as the Middle East (World Bank 2014.), where the urban share of the total population grew from 48% in 1980 to close to 60% in 2000. The urban share of the total population is expected to exceed 70% by the end of 2015, compared to an average of 54% for all developing countries (World Bank 2008). Meanwhile, much of the growth in the urban areas of the Middle East is occurring within planners’ broader ambitions to develop sustainably (QNDS 2011). While cities in the Middle East are growing at three times the international average (World Bank 2014), the rapid population and physical growth is largely unexamined, particularly in terms of the unique conditions, qualities, and characteristics that give rise to these emerging centers.
The rapid physical growth of a city’s infrastructure can also lead to serious environmental and social problems, and emerging evidence suggests a significant link between patterns of growth and ecological consequences (Dunlap and Jorgenson, 2012). These topics are central to challenges facing the sustainability of urban regions, especially as population growth and climate change amplify already vulnerable infrastructure and ecology. Rapidly growing urban centers affect the sustainability of a region through concentrating pressures on both adjacent and more distant ecosystems (Alberti 2010). Cities fragment formerly contiguous areas of landscape and modify nutrient flows and biodiversity (Grimm et al. 2008). Urban areas also characterize several unique phenomena such as cities in the desert areas being cooler than surrounding landscapes (unlike non-desert areas, which usually illustrate the opposite), making them oases that enable habitation in the desert (Nassar et al. 2014). The novelty of urban areas
Shandas et al. / Rapid Urban Growth in Doha, Qatar
2 © 2017 by Author/s
and their sustainability requires at once a recognition of the features on the landscape that impact physical and social process, and information for guiding the growth.
Policymakers and practitioners continue to use untested assumptions and incomplete or biased information without understanding the complicated interactions and feedback loops between humans, their settlement patterns, and their regional ecosystems (Clark et al. 2011). Additionally, in areas with limited publicly available data researchers face formidable challenges in characterizing growth, let alone understanding it. As a result, such rapid change occurring throughout the Gulf region could result in serious environmental and social problems and accelerate global environmental change unless society develops an understanding of the drivers of urbanization, its impacts, and opportunities for mitigation. A first step is evaluating the dynamics of urban growth of a city from a regional perspective, and developing a systematic description of the resulting development patterns. The present paper attempts to reveal the patterns of urbanization that may lead to social and ecological impacts that have been witnessed in other parts of the world.
Contextualizing Urban Growth in the Middle East
The physical growth of cities – a topic that has been studied extensively over several decades – is often used to refer to the physical shape of a given area of development. As of today, empirical evidence about the physical patterns of growth has seen only limited application in non-Western countries. Previous empirical research characterizing urban development patterns suggests a rich and thorough literature, yet still lacking in a global perspective, which primarily focuses on Western regions (Alberti 2010). Examples include the impact of development patterns from transportation corridors and innovation (Ewing and Cervero 2001; Fenkel and Ashkanazi 2008). Other studies also suggest that the process of growth in Western cities impacts property value changes (Song and Knaap 2004; Glaeser and Kahn 2003), density (Parsons et al. 1994; Bertaud and Renaud 1997), and network configuration (Loutzenheiser 1997). Tracing land cover change can provide a means for elucidating development patterns, and the extent to which these patterns give rise to sustainable futures. Those cities that are undergoing rapid landscape transformation – which is the case for many Asian cities (Cho 2005; Shalaby et al. 2012; Li and Peijun 2013; Radhakrishinn et al. 2014) – can be of particular interest to the sustainability discourse since their Western counterparts took several decades to create similar development patterns.
The question of sustainable urban development patterns has generated debate among urban scholars about the economic, environmental, and social concerns of growing cities (Cutsinger and Gastler 2006). While sprawling suburban patterns – defined here as auto-dependent low density development – can create some amenities, including larger living spaces at lower housing costs, and lower crime rates, these low density developments also causes several problems, including excessive air pollution and oil consumption (Brueckner 2001; Frumkin 2002; Glaeser and Khan 2003). Moreover, urban sprawl tends to be accompanied by the high costs of building new public infrastructure and commercial developments (Hortas-Rico 2010), which can directly impact the economic sustainability of a region. Indeed, sprawl is one of the most important of several physical patterns of urban growth, but to date we have limited application of this concept to Middle East cities.
These environmental and social problems, which are often exacerbated by the physical patterns of urban development, point to the need for a better understanding of how urban areas outside of American and European contexts grow. In the past few years, research in China, India, and Latin America have provided insight into non-Western development patterns (Li et al. 2009; Bhatta et al. 2010; Monkkonen 2008), but these studies are largely untested in the Middle East, which early evidence indicates contain a combination of Western and Eastern development models (Wiedmann et al. 2012; Rizzo 2013; Nasser et al. 2014).
While a general lack of relevant data still hinders comprehensive assessments of development patterns in the Middle East, recent developments in spatial analysis, computational power and publicly available satellite data offer a timely and effective means for understanding growth of Middle East cities. For example, assessing urban growth over 50 years in the U.S. can conflate the drivers of growth, such as the rationale for the growth of specific areas and the outcomes of alternative growth patterns. But, when examining physical growth patterns over a shorter period of time during a phase of rapid urban development, we can, arguably, link specific growth processes and reasons for specific patterns of development. We can address such questions as: How does physical growth couple with existing infrastructures to create specific development patterns? How might new forms of development mitigate or exacerbate the environmental and human health impacts of urban growth? The rapid growth occurring in Middle East cities provides an opportunity to answer some of these questions by capturing data over short periods of fast development.
For this study, we examined the spatio-temporal coupling of urban growth in one urbanizing region of the Middle East, Doha, Qatar. The city of Doha is the largest city and capital of the state of Qatar, and is located on the Persian Gulf. It has one of the fastest growing populations in the Arabic world (World Bank 2014). While the population of Doha was below 500 thousand just 20 years ago, it is now over 1.2 million and expected to continue rising at unprecedented rates. The rapid rise in population has occurred as a result of discovering natural gas in
European Journal of Sustainable Development Research, 1:2 (2017), 11
© 2017 by Author/s 3
mid-20th century. The same oil has fueled a growth of the physical infrastructure in Doha, and the development of several mega-project (e.g. 2022 football World Cup, 2006 Asia Games, etc.) has changed the landscape in noticeable ways. Yet, we know of no studies that have documented the land use patterns since the beginning of the transformation of the physical infrastructure in Doha. As a result, we posit that an understanding of the patterns of growth can shed light into the sustainability of the region, specifically through associating different types of landscape patterns with economic, environmental, and social implications.
Using data from satellite imagery, we analyzed physical changes in the Doha metropolitan region over a recent time period in order to provide a description of urban patterns that are specific to that study region. We asked three research questions: 1) Does rapid urban development in Doha lead to increasing urban sprawl; 2) In what way does rapid urban growth in Doha lead to unique patterns of development; and 3) To what extent does urban sprawl interact with other forms of development to impact the density of urban development? For the purposes of this study we define urban sprawl unchecked outward expansion from the core of the city and is a manifestation of disorder in the system (Bhatta et al., 2010). Answering these questions will provide some of the only regional-scale descriptions of the urban development patterns of Doha. Additionally, we aim to contribute to the use of computer-based analysis of urban areas (e.g. urban geo-informatics) literature by describing the extent to which physical and spatial urban growth interact with temporal scales of development. We begin by offering a description of Doha and then outline our methods, describe the relevant results, and discuss interpretations of our findings. We conclude with a summary of our findings and identify some opportunities for future research.
MATERIAL AND METHODS
Case Study: Doha, Qatar
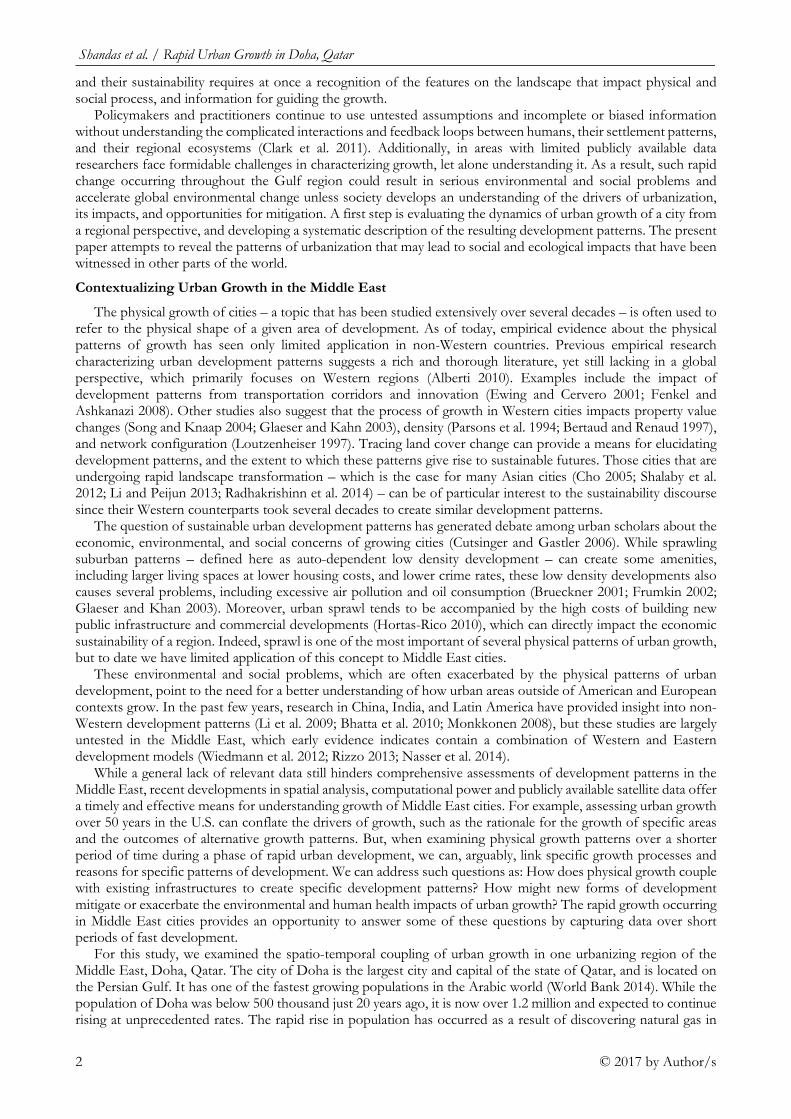
The city of Doha is the capital of the State of Qatar and is located on the Persian Gulf (Figure 1). The primary industry in the city was pearl trading through the 1920s, and then collapsed due to the invention of pearl harvesting techniques in Japan. The population peaked at about 27,000 inhabitants in the 1920s (Wirth 1988) and consisted of traditional Islamic desert settlement patterns, as described by Besim Hakim in his book Arab- Islamic Cities: Building and Planning Principles (1986). These patterns consisted of a vernacular road networks of cul-de-sacs, which enhanced the privacy of neighborhoods, known as ferej, and the market, located close to the port and constituting the central public realm. After national independence, Doha entered a phase in the 1970s and 80s when the discovery of oil fueled a physical growth of the city’s infrastructure. While the old city centers were replaced by commercial buildings and apartment blocks for foreign labor, low-rise housing areas rapidly extended the urban periphery (Al Hathloul 1996).
At the end of the 20th century the Emirate of Dubai introduced a new model of urbanism by implementing growth-oriented development strategies in order to diversify the economy. The subsequent liberalization of local real-estate markets led to a vast construction boom and a new chapter of urban development in the Gulf (Schmid
Figure 1. Doha study area.
Shandas et al. / Rapid Urban Growth in Doha, Qatar
4 © 2017 by Author/s
2009). Most cities became hosts to various mega-projects, which were usually launched by newly founded holdings whose main shareholders are usually public institutions due to the fact that most unbuilt land is considered to be the property of the state and thus under the authority of rulers (Wiedman et al. 2014). New forms of development such as reclaimed islands and high-rise agglomerations emerged and transformed the previous urban morphologies. The new focus on expanding real estate markets as diversification strategy led to the decentralization of urban governance and the common practice of case-by-case decision making (Weidman et al., 2014). This rapid growth of Doha development patterns, and the immediately availability of satellite imagery offer at timely and effective means for understanding the areas where sustainable urban forms are emerging.
Data used
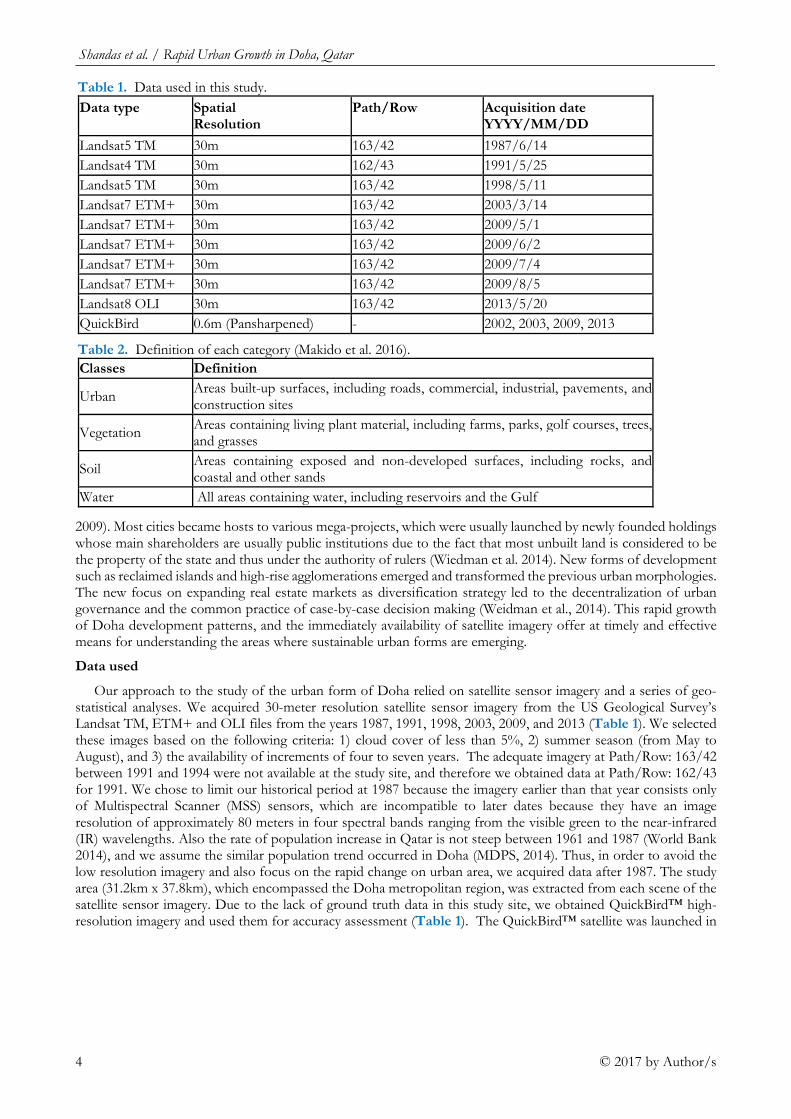
Our approach to the study of the urban form of Doha relied on satellite sensor imagery and a series of geo-statistical analyses. We acquired 30-meter resolution satellite sensor imagery from the US Geological Survey’s Landsat TM, ETM+ and OLI files from the years 1987, 1991, 1998, 2003, 2009, and 2013 (Table 1). We selected these images based on the following criteria: 1) cloud cover of less than 5%, 2) summer season (from May to August), and 3) the availability of increments of four to seven years. The adequate imagery at Path/Row: 163/42 between 1991 and 1994 were not available at the study site, and therefore we obtained data at Path/Row: 162/43 for 1991. We chose to limit our historical period at 1987 because the imagery earlier than that year consists only of Multispectral Scanner (MSS) sensors, which are incompatible to later dates because they have an image resolution of approximately 80 meters in four spectral bands ranging from the visible green to the near-infrared (IR) wavelengths. Also the rate of population increase in Qatar is not steep between 1961 and 1987 (World Bank 2014), and we assume the similar population trend occurred in Doha (MDPS, 2014). Thus, in order to avoid the low resolution imagery and also focus on the rapid change on urban area, we acquired data after 1987. The study area (31.2km x 37.8km), which encompassed the Doha metropolitan region, was extracted from each scene of the satellite sensor imagery. Due to the lack of ground truth data in this study site, we obtained QuickBird™ high-resolution imagery and used them for accuracy assessment (Table 1). The QuickBird™ satellite was launched in
Table 1. Data used in this study.
Data type
Spatial Resolution
Path/Row
Acquisition date YYYY/MM/DD
Landsat5 TM 30m 163/42 1987/6/14
Landsat4 TM 30m 162/43 1991/5/25
Landsat5 TM 30m 163/42 1998/5/11
Landsat7 ETM+ 30m 163/42 2003/3/14
Landsat7 ETM+ 30m 163/42 2009/5/1
Landsat7 ETM+ 30m 163/42 2009/6/2
Landsat7 ETM+ 30m 163/42 2009/7/4
Landsat7 ETM+ 30m 163/42 2009/8/5
Landsat8 OLI 30m 163/42 2013/5/20
QuickBird 0.6m (Pansharpened) - 2002, 2003, 2009, 2013
Table 2. Definition of each category (Makido et al. 2016).
Classes Definition
Urban Areas built-up surfaces, including roads, commercial, industrial, pavements, and construction sites
Vegetation Areas containing living plant material, including farms, parks, golf courses, trees, and grasses
Soil Areas containing exposed and non-developed surfaces, including rocks, and coastal and other sands
Water All areas containing water, including reservoirs and the Gulf
European Journal of Sustainable Development Research, 1:2 (2017), 11
© 2017 by Author/s 5
2001 and provides a very high resolution imagery, which simultaneously captures 0.61 m panchromatic and 2.44 m multispectral digital imagery.
Data preparation and pre-processing
All Landsat bands (visible, near and shortwave infrared) except the thermal band were used in the classification process. Some images from the year 2009 (Landsat7 ETM+) contain gaps that were reportedly caused by a sensor's hardware failure. For that year, we filled these gaps by mosaicking four images from different months in 2009 into a single composite image. To conduct the accuracy assessment of the Landsat images, the Quickbird imagery was ortho-rectified and pan-sharpened. Ortho-rectification is the correction of the image, pixel-by-pixel, for topographic distortion, and the result is that every pixel appears to be viewing the earth from directly above (Schowengerdt, 1997). Pan-sharpening is a process of combining a lower resolution multispectral imagery with a high resolution panchromatic imagery to create a high resolution color image. For this study, Gram-Schmidt Pan Sharpening (Brower and Laben, 2000) was applied to obtain 60cm multispectral data. All images were geo-referenced using 1st order polynomial transformation, and overall root mean square errors were less than half a pixel. All image processing work and accuracy assessments were carried out in ENVI 5.1 (Exelis Visual Information Solutions, Boulder, CO, USA) and ArcGIS 10.2 (ESRI Inc.).
Due to the lack of ancillary data and prior satellite-based research of the study area, we employed a hybrid classification method (Lo and Choi, 2004). Each image with six bands was sorted into 40 clusters using the ISODATA unsupervised classification method. Based on visual interpretation, the homogeneous clusters that coincided with a specific land use/cover type were labelled into one of four categories – Urban, Vegetation, Soil, and Water (Table 2). Other clusters that exhibited mixed classes were clipped out from the image for further classification using supervised classification. The maximum likelihood algorithm was applied to the clipped images. The images were initially classified into seven classes: Urban 1, Urban 2, Vegetation, Soil 1, Soil 2, Water1, and Water 2. The difference between Urban 1 and 2 is one appears darker and the other appears brighter, and so as Soil and Water classes. Ten to twenty training sites for each class were selected with the aid of a panchromatic band and/or QuickBird imagery. The classified images were resampled to the aforementioned four classes and combined with the ISODATA classified land use/cover map.
Classification and Accuracy Assessment
A confusion matrix can provide a basis for describing classification accuracy and for characterizing errors (Foody 2002). One of the compelling features of a confusion matrix is its overall accuracy, or Percent Correctly Classified (PCC) (Foody 2002). The PCC is calculated as the ratio of the sum of correctly classified pixels in all classes to the sum of the total number of pixels (Lillesand 2004). The k statistics, or Kappa coefficient, is an indicator of the extent to which the percentage correct values of an error matrix are due to “true” agreement versus “chance” agreement (Lillesand 2004). User and producer accuracy can be obtained from the confusion matrix. The users’ accuracy measure indicates the probability that a pixel classified into a given category actually represents that category on the ground; the producer’s accuracy measure, which uses a set of training pixels of the given cover type, indicates how well each is classified (Lillesand 2004).
Due to the lack of ground-level data on land use/land cover, we undertook an accuracy assessment using high resolution satellite sensor imagery only for half of the total images we classified. Unfortunately, the high-resolution imagery for earlier years (1987, 1991, and 1998) are unavailable for purchase, and as a result we only undertook accuracy assessment for years 2003, 2009, and 2013.
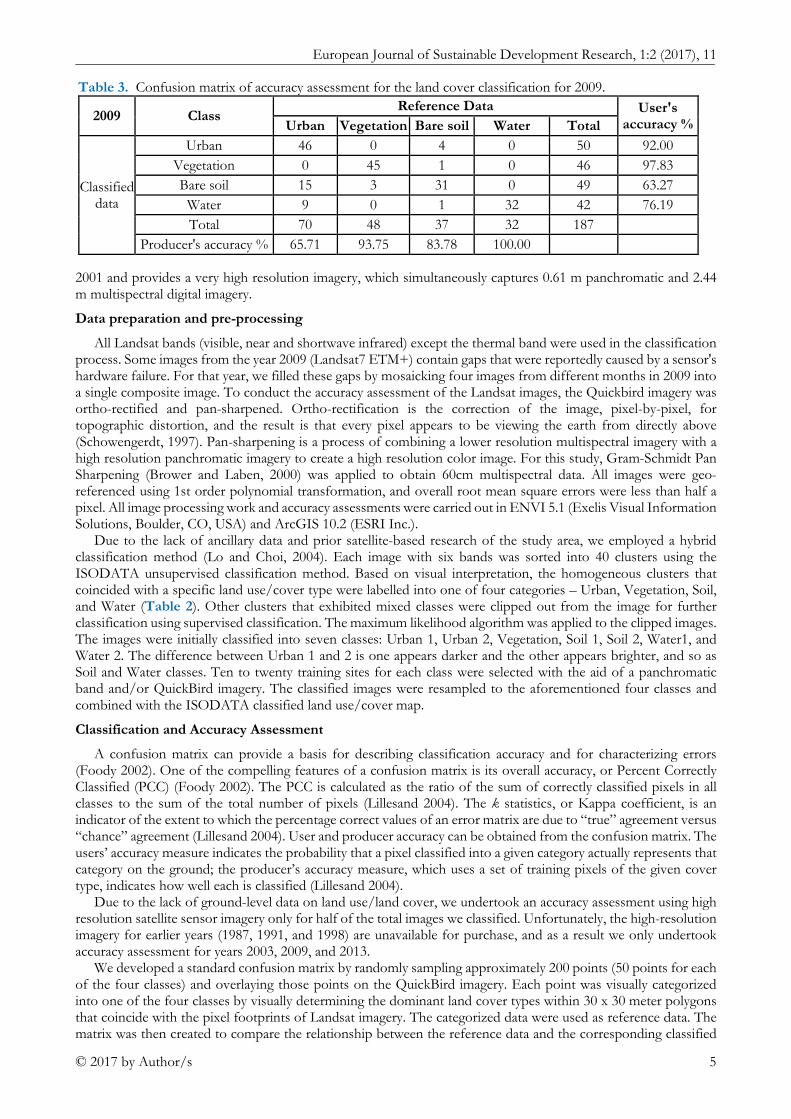
We developed a standard confusion matrix by randomly sampling approximately 200 points (50 points for each of the four classes) and overlaying those points on the QuickBird imagery. Each point was visually categorized into one of the four classes by visually determining the dominant land cover types within 30 x 30 meter polygons that coincide with the pixel footprints of Landsat imagery. The categorized data were used as reference data. The matrix was then created to compare the relationship between the reference data and the corresponding classified
Table 3. Confusion matrix of accuracy assessment for the land cover classification for 2009.
2009 Class Reference Data User's
accuracy % Urban Vegetation Bare soil Water Total
Classified data
Urban 46 0 4 0 50 92.00
Vegetation 0 45 1 0 46 97.83
Bare soil 15 3 31 0 49 63.27
Water 9 0 1 32 42 76.19
Total 70 48 37 32 187
Producer's accuracy % 65.71 93.75 83.78 100.00
Shandas et al. / Rapid Urban Growth in Doha, Qatar
6 © 2017 by Author/s
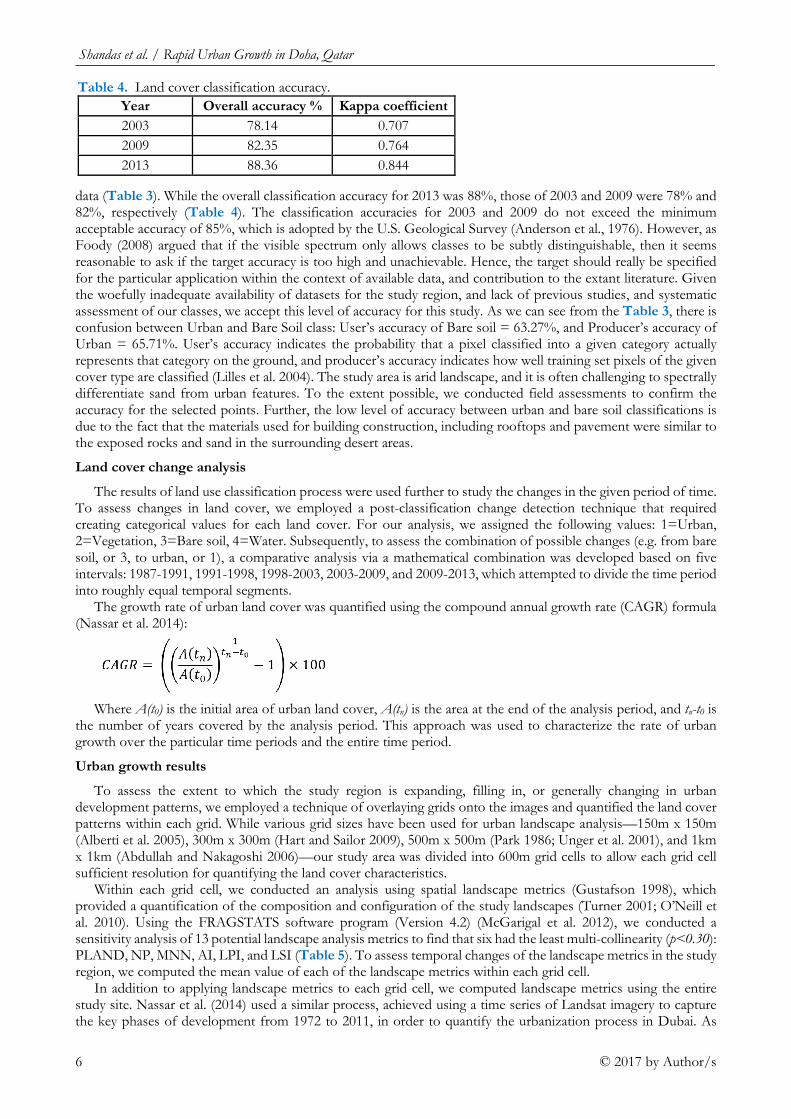
data (Table 3). While the overall classification accuracy for 2013 was 88%, those of 2003 and 2009 were 78% and 82%, respectively (Table 4). The classification accuracies for 2003 and 2009 do not exceed the minimum acceptable accuracy of 85%, which is adopted by the U.S. Geological Survey (Anderson et al., 1976). However, as Foody (2008) argued that if the visible spectrum only allows classes to be subtly distinguishable, then it seems reasonable to ask if the target accuracy is too high and unachievable. Hence, the target should really be specified for the particular application within the context of available data, and contribution to the extant literature. Given the woefully inadequate availability of datasets for the study region, and lack of previous studies, and systematic assessment of our classes, we accept this level of accuracy for this study. As we can see from the Table 3, there is confusion between Urban and Bare Soil class: User’s accuracy of Bare soil = 63.27%, and Producer’s accuracy of Urban = 65.71%. User’s accuracy indicates the probability that a pixel classified into a given category actually represents that category on the ground, and producer’s accuracy indicates how well training set pixels of the given cover type are classified (Lilles et al. 2004). The study area is arid landscape, and it is often challenging to spectrally differentiate sand from urban features. To the extent possible, we conducted field assessments to confirm the accuracy for the selected points. Further, the low level of accuracy between urban and bare soil classifications is due to the fact that the materials used for building construction, including rooftops and pavement were similar to the exposed rocks and sand in the surrounding desert areas.
Land cover change analysis
The results of land use classification process were used further to study the changes in the given period of time. To assess changes in land cover, we employed a post-classification change detection technique that required creating categorical values for each land cover. For our analysis, we assigned the following values: 1=Urban, 2=Vegetation, 3=Bare soil, 4=Water. Subsequently, to assess the combination of possible changes (e.g. from bare soil, or 3, to urban, or 1), a comparative analysis via a mathematical combination was developed based on five intervals: 1987-1991, 1991-1998, 1998-2003, 2003-2009, and 2009-2013, which attempted to divide the time period into roughly equal temporal segments.
The growth rate of urban land cover was quantified using the compound annual growth rate (CAGR) formula (Nassar et al. 2014):
Where A(t0) is the initial area of urban land cover, A(tn) is the area at the end of the analysis period, and tn-t0 is
the number of years covered by the analysis period. This approach was used to characterize the rate of urban growth over the particular time periods and the entire time period.
Urban growth results
To assess the extent to which the study region is expanding, filling in, or generally changing in urban development patterns, we employed a technique of overlaying grids onto the images and quantified the land cover patterns within each grid. While various grid sizes have been used for urban landscape analysis—150m x 150m (Alberti et al. 2005), 300m x 300m (Hart and Sailor 2009), 500m x 500m (Park 1986; Unger et al. 2001), and 1km x 1km (Abdullah and Nakagoshi 2006)—our study area was divided into 600m grid cells to allow each grid cell sufficient resolution for quantifying the land cover characteristics.
Within each grid cell, we conducted an analysis using spatial landscape metrics (Gustafson 1998), which provided a quantification of the composition and configuration of the study landscapes (Turner 2001; O’Neill et al. 2010). Using the FRAGSTATS software program (Version 4.2) (McGarigal et al. 2012), we conducted a sensitivity analysis of 13 potential landscape analysis metrics to find that six had the least multi-collinearity (p<0.30): PLAND, NP, MNN, AI, LPI, and LSI (Table 5). To assess temporal changes of the landscape metrics in the study region, we computed the mean value of each of the landscape metrics within each grid cell.
In addition to applying landscape metrics to each grid cell, we computed landscape metrics using the entire study site. Nassar et al. (2014) used a similar process, achieved using a time series of Landsat imagery to capture the key phases of development from 1972 to 2011, in order to quantify the urbanization process in Dubai. As
Table 4. Land cover classification accuracy.
Year Overall accuracy % Kappa coefficient
2003 78.14 0.707
2009 82.35 0.764
2013 88.36 0.844
European Journal of Sustainable Development Research, 1:2 (2017), 11
© 2017 by Author/s 7
Nassar employed 3x3 kernel size smoothing filter prior to landscape metric computation, we also applied the same filter for computing metrics for the entire site.
Cluster analysis using urban land cover change
To develop some specific categories of urban morphology, we integrated the results of the land cover change analysis with a statistical method called a k-mean cluster analysis. The k-means algorithm is statistical clustering method that iteratively evaluates differences among the time of development (Bacao et al. 2005). In this study, the
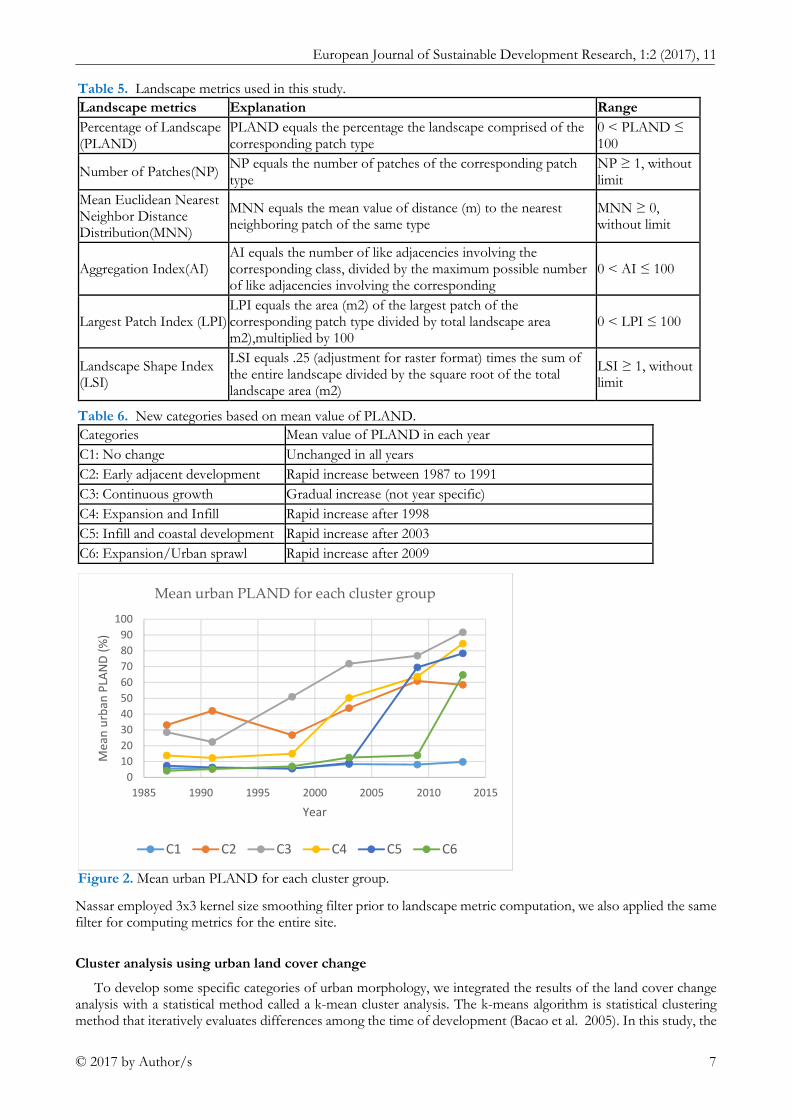
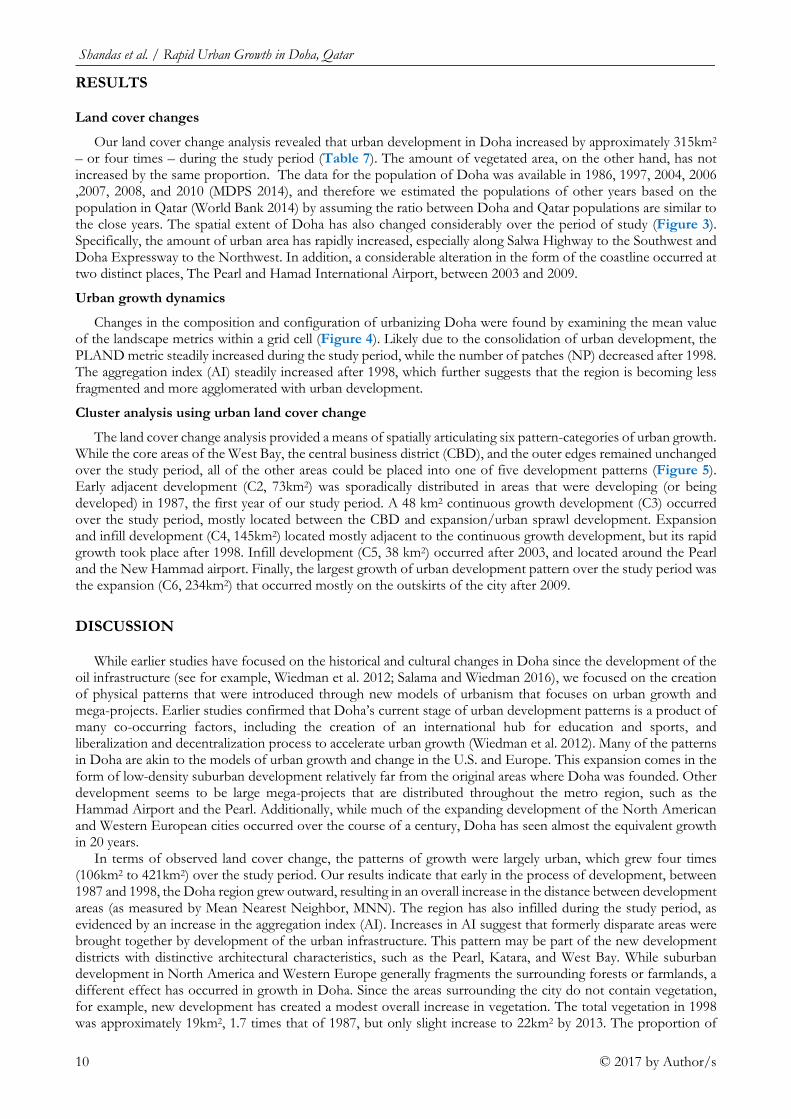
Table 6. New categories based on mean value of PLAND.
Categories Mean value of PLAND in each year
C1: No change Unchanged in all years
C2: Early adjacent development Rapid increase between 1987 to 1991
C3: Continuous growth Gradual increase (not year specific)
C4: Expansion and Infill Rapid increase after 1998
C5: Infill and coastal development Rapid increase after 2003
C6: Expansion/Urban sprawl Rapid increase after 2009
Table 5. Landscape metrics used in this study.
Landscape metrics Explanation Range
Percentage of Landscape (PLAND)
PLAND equals the percentage the landscape comprised of the corresponding patch type
0 < PLAND ≤ 100
Number of Patches(NP) NP equals the number of patches of the corresponding patch type
NP ≥ 1, without limit
Mean Euclidean Nearest Neighbor Distance Distribution(MNN)
MNN equals the mean value of distance (m) to the nearest neighboring patch of the same type
MNN ≥ 0, without limit
Aggregation Index(AI) AI equals the number of like adjacencies involving the corresponding class, divided by the maximum possible number of like adjacencies involving the corresponding
0 < AI ≤ 100
Largest Patch Index (LPI) LPI equals the area (m2) of the largest patch of the corresponding patch type divided by total landscape area m2),multiplied by 100
0 < LPI ≤ 100
Landscape Shape Index (LSI)
LSI equals .25 (adjustment for raster format) times the sum of the entire landscape divided by the square root of the total landscape area (m2)
LSI ≥ 1, without limit
Figure 2. Mean urban PLAND for each cluster group.
0
10
20
30
40
50
60
70
80
90
100
1985 1990 1995 2000 2005 2010 2015
Me
an
urb
an
PLA
ND
(%
)
Year
Mean urban PLAND for each cluster group
C1 C2 C3 C4 C5 C6
Shandas et al. / Rapid Urban Growth in Doha, Qatar
8 © 2017 by Author/s
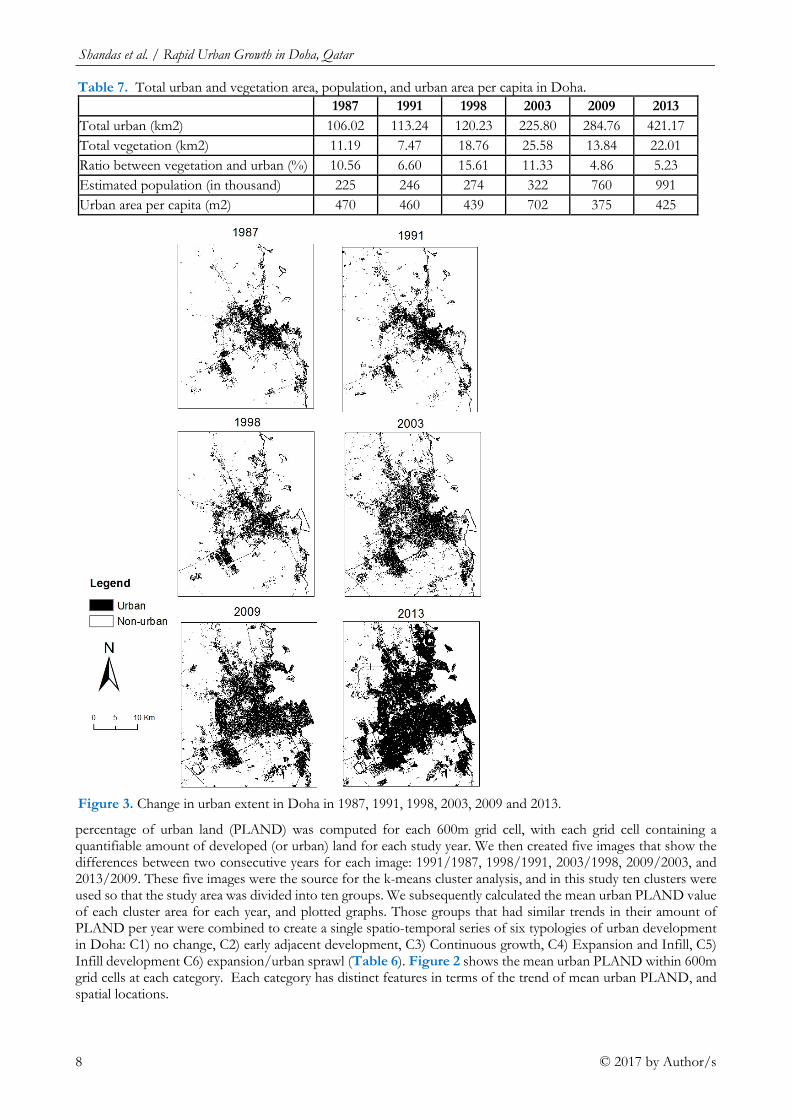
percentage of urban land (PLAND) was computed for each 600m grid cell, with each grid cell containing a quantifiable amount of developed (or urban) land for each study year. We then created five images that show the differences between two consecutive years for each image: 1991/1987, 1998/1991, 2003/1998, 2009/2003, and 2013/2009. These five images were the source for the k-means cluster analysis, and in this study ten clusters were used so that the study area was divided into ten groups. We subsequently calculated the mean urban PLAND value of each cluster area for each year, and plotted graphs. Those groups that had similar trends in their amount of PLAND per year were combined to create a single spatio-temporal series of six typologies of urban development in Doha: C1) no change, C2) early adjacent development, C3) Continuous growth, C4) Expansion and Infill, C5) Infill development C6) expansion/urban sprawl (Table 6). Figure 2 shows the mean urban PLAND within 600m grid cells at each category. Each category has distinct features in terms of the trend of mean urban PLAND, and spatial locations.
Table 7. Total urban and vegetation area, population, and urban area per capita in Doha.
1987 1991 1998 2003 2009 2013
Total urban (km2) 106.02 113.24 120.23 225.80 284.76 421.17
Total vegetation (km2) 11.19 7.47 18.76 25.58 13.84 22.01
Ratio between vegetation and urban (%) 10.56 6.60 15.61 11.33 4.86 5.23
Estimated population (in thousand) 225 246 274 322 760 991
Urban area per capita (m2) 470 460 439 702 375 425
Figure 3. Change in urban extent in Doha in 1987, 1991, 1998, 2003, 2009 and 2013.
European Journal of Sustainable Development Research, 1:2 (2017), 11
© 2017 by Author/s 9
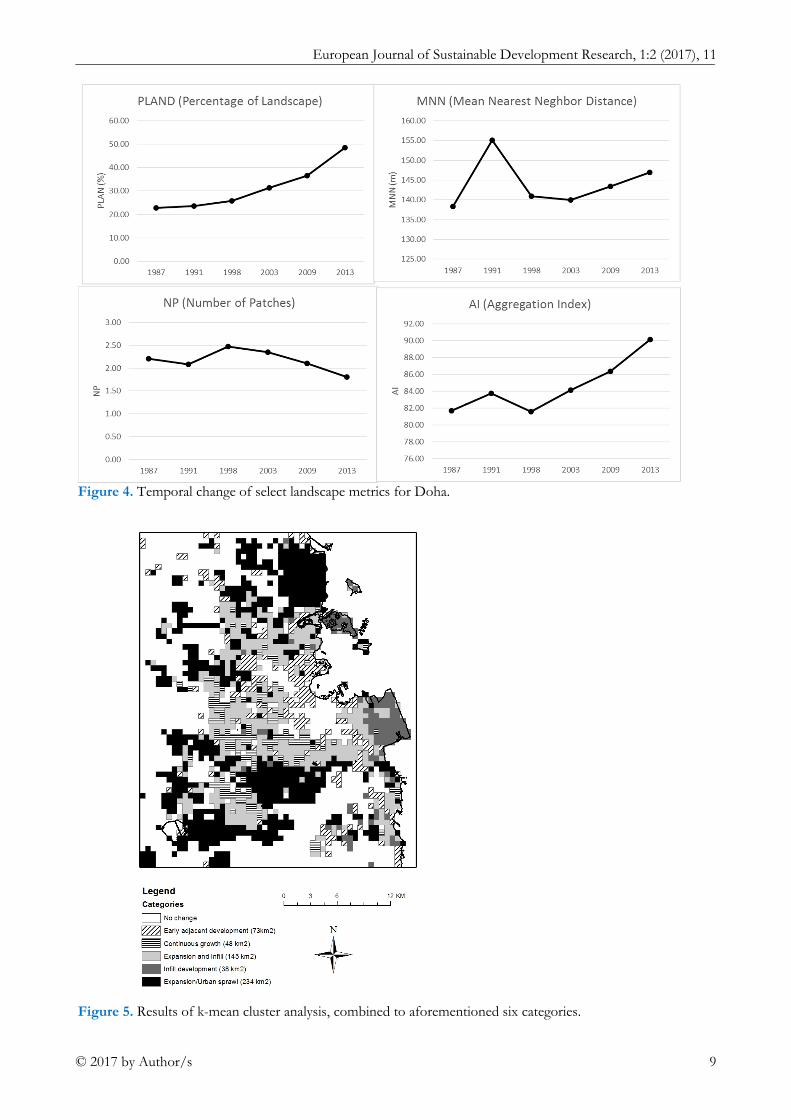
Figure 4. Temporal change of select landscape metrics for Doha.
Figure 5. Results of k-mean cluster analysis, combined to aforementioned six categories.
Shandas et al. / Rapid Urban Growth in Doha, Qatar
10 © 2017 by Author/s
RESULTS
Land cover changes
Our land cover change analysis revealed that urban development in Doha increased by approximately 315km2
– or four times – during the study period (Table 7). The amount of vegetated area, on the other hand, has not increased by the same proportion. The data for the population of Doha was available in 1986, 1997, 2004, 2006 ,2007, 2008, and 2010 (MDPS 2014), and therefore we estimated the populations of other years based on the population in Qatar (World Bank 2014) by assuming the ratio between Doha and Qatar populations are similar to the close years. The spatial extent of Doha has also changed considerably over the period of study (Figure 3). Specifically, the amount of urban area has rapidly increased, especially along Salwa Highway to the Southwest and Doha Expressway to the Northwest. In addition, a considerable alteration in the form of the coastline occurred at two distinct places, The Pearl and Hamad International Airport, between 2003 and 2009.
Urban growth dynamics
Changes in the composition and configuration of urbanizing Doha were found by examining the mean value of the landscape metrics within a grid cell (Figure 4). Likely due to the consolidation of urban development, the PLAND metric steadily increased during the study period, while the number of patches (NP) decreased after 1998. The aggregation index (AI) steadily increased after 1998, which further suggests that the region is becoming less fragmented and more agglomerated with urban development.
Cluster analysis using urban land cover change
The land cover change analysis provided a means of spatially articulating six pattern-categories of urban growth. While the core areas of the West Bay, the central business district (CBD), and the outer edges remained unchanged over the study period, all of the other areas could be placed into one of five development patterns (Figure 5). Early adjacent development (C2, 73km2) was sporadically distributed in areas that were developing (or being developed) in 1987, the first year of our study period. A 48 km2 continuous growth development (C3) occurred over the study period, mostly located between the CBD and expansion/urban sprawl development. Expansion and infill development (C4, 145km2) located mostly adjacent to the continuous growth development, but its rapid growth took place after 1998. Infill development (C5, 38 km2) occurred after 2003, and located around the Pearl and the New Hammad airport. Finally, the largest growth of urban development pattern over the study period was the expansion (C6, 234km2) that occurred mostly on the outskirts of the city after 2009.
DISCUSSION
While earlier studies have focused on the historical and cultural changes in Doha since the development of the oil infrastructure (see for example, Wiedman et al. 2012; Salama and Wiedman 2016), we focused on the creation of physical patterns that were introduced through new models of urbanism that focuses on urban growth and mega-projects. Earlier studies confirmed that Doha’s current stage of urban development patterns is a product of many co-occurring factors, including the creation of an international hub for education and sports, and liberalization and decentralization process to accelerate urban growth (Wiedman et al. 2012). Many of the patterns in Doha are akin to the models of urban growth and change in the U.S. and Europe. This expansion comes in the form of low-density suburban development relatively far from the original areas where Doha was founded. Other development seems to be large mega-projects that are distributed throughout the metro region, such as the Hammad Airport and the Pearl. Additionally, while much of the expanding development of the North American and Western European cities occurred over the course of a century, Doha has seen almost the equivalent growth in 20 years.
In terms of observed land cover change, the patterns of growth were largely urban, which grew four times (106km2 to 421km2) over the study period. Our results indicate that early in the process of development, between 1987 and 1998, the Doha region grew outward, resulting in an overall increase in the distance between development areas (as measured by Mean Nearest Neighbor, MNN). The region has also infilled during the study period, as evidenced by an increase in the aggregation index (AI). Increases in AI suggest that formerly disparate areas were brought together by development of the urban infrastructure. This pattern may be part of the new development districts with distinctive architectural characteristics, such as the Pearl, Katara, and West Bay. While suburban development in North America and Western Europe generally fragments the surrounding forests or farmlands, a different effect has occurred in growth in Doha. Since the areas surrounding the city do not contain vegetation, for example, new development has created a modest overall increase in vegetation. The total vegetation in 1998 was approximately 19km2, 1.7 times that of 1987, but only slight increase to 22km2 by 2013. The proportion of
European Journal of Sustainable Development Research, 1:2 (2017), 11
© 2017 by Author/s 11
vegetation in comparison to urban area decreased from 11% in 1987 to 5% in 2013. Statistical analysis further reveals that the expansion of development mentioned earlier, which we refer to as ‘Early Adjacent Development,’ occurred mostly outside of the urban core.
In terms of a sustainable urban patterns, two characteristics can be separated out in the evolution of the Doha since 1987. First, the initial development was outward and relatively low-density, which follows many patterns from the U.S. and European cities. From 1987 through 2003, the development came in the form of expansion across away from the central West Bay area, and to a lesser extent along the coastline. These development patterns encouraged automobile use, and without limited public transit, creates increase in air pollution, infrastructure costs, and obesity. Indeed, recent studies are beginning to shed light on the challenges of these land use patterns, including the world’s worst air quality (WHO, 2016), and the most obesity within the Middle East and North Africa (Ng et al. 2014). Some argue that mega-projects, including Education City, Al-Waab, the Aspire Zone, located far from the city center helped to spurn the rapid expansion and sprawling land use patterns (Rizzo 2013). Since our analysis did not examine mega-projects, we are unable to confirm these conclusions; however, we note that early developments occurring from the coastline established a periphery of the metropolitan region, which served as a boundary that may have in later years allowed for infill development.
A second set of land use patterns suggest many indications for creating a more sustainable Doha. The infill development that has been occurring since 2003, including the high densities of the Pearl and Msheireb in downtown contains many core components of sustainable land use. In fact, Qatar’s national framework for urban development describes the need for greater connectivity among land uses, greater densities, including corridors and centers, and opportunities for infill development. The recent creation of the transit line in Doha that is expected to cover over 200km is a compelling example of the land use strategy taking root. The metro rail lines are expected to have their hub at Msheireb, with a total of four lines connecting all the major areas from the periphery to the core. Such efforts, if coupled with opportunities for greater neighborhoods that allow for active transit and walkability, more vegetation, and outdoor spaces can advance livability as mounting pressures from climate change further threaten unstainable land use patterns. Overall, while the land cover patterns of Doha reveal dynamic and rapid change over the study period, the urban growth patterns support previous descriptions of expansion and infill, although with specific temporal patterns. What has taken many cities in the U.S. over 70 years of expansion and infill, has taken Doha only 25. Indeed, our analysis reveals that while the initial growth of Doha spurred unstainable land use patterns, more recently, the City has created many opportunities for sustainable growth.
CONCLUSIONS
In this study, we examined the spatio-temporal urban growth of Doha, Qatar using satellite data from 1987 to 2013. We characterized intra urban development pattern by using 600m grid landscape metrics, which enabled us to examine spatial patterns of each of the five development of the five phases. The results suggest that the urban areas in the Doha metropolitan region have rapidly increased at a compound annual growth rate of 5.45% over the 26 years of our study period (315 km2). The majority of this urban growth occurred after 1998, with the period 1998-2003 experiencing a peak compound annual growth rate of 13.43%. While the physical growth of Doha is discernable through an analysis of satellite images, the quality of growth and its implications for the social, economic, and environmental conditions of the region all require further study. Our study cannot, in its current state, shed light on how the physical changes are affecting Doha residents. We can, however, speculate from other studies that the patterns of initial suburbanization has required greater investment in infrastructure, and impacted the capacity for residents to engage in active transportation (e.g. biking, walking, transit, etc.). These will further have further implications on public health and the environment, which we have observed in other parts of the world. Needed are examinations of Doha’s development patterns that are linked to environmental factors and overall quality of life, if for no other reason than to understand whether development patterns in and of themselves create similar outcomes in other cultures. At best, such future research could help to reduce the possible negative implications of development for humans and the environment upon which they depend.
ACKNOWLEDGEMENTS
This paper was made possible by NPRP Grant No. NPRP 5-074-5-5015 from the Qatar National Research Fund (a member of Qatar Foundation).
Shandas et al. / Rapid Urban Growth in Doha, Qatar
12 © 2017 by Author/s
REFERENCES
Abdullah, S. A., & Nakagoshi, N. (2006). Changes in landscape spatial pattern in the highly developing state of Selangor, peninsular Malaysia. Landscape and Urban Planning, doi:10.1016/j.landurbplan.2005.03.003
Alberti, M., Hepinstall, J. A., Coe, S. E., Coburn, R., Russo, M., & Jiang, Y. (2005). MODELING URBAN PATTERNS AND LANDSCAPE CHANGE IN CENTRAL PUGET SOUND. In Proceedings of the ISPES joint conference 3rd International Symposium Remote Sensing and Data Fusion Over Urban Areas, 5th International Symposium Remote Sensing of Urban Areas.[Online]. Available: http://www. isprs. org/commission8/workshop_urban/Alberti. pdf. Accessed August 2014.
Alberti, M. (2010). Maintaining ecological integrity and sustaining ecosystem function in urban areas. Current Opinion in Environmental Sustainability, 2(3), 178-184.
Al Hathloul, S. 1996. The Arab- Muslim City. Tradition Continuity and Change in the Physical Environment, Dar Al Sahan, Riyadh.
Anderson, J. R., Hardy, E. E., Roach, J. T., & Witmer, R. E. (1976). A land use and land cover classification system for use with remote sensor data. Washington, DC: Government Printing Office (US Geological Survey, Professional Paper 964).
Bacao, F., Lobo, V., & Painho, M. (2005). Self-organizing Maps as Substitutes for K-Means Clustering. Lecture Notes in Computer Science, 3516, 476–483.
Bertaud, A., & Renaud, B. (1997). Socialist Cities without Land Markets. Journal of Urban Economics, 41(1), 137-151. Bhatta B, Saraswati S, Bandyopadhyay D (2010) Urban sprawl measurement from remote sensing data. Applied
Geography, 30,731–740. Brower, B. V., & Laben, C. A. (2000). U.S. Patent No. 6,011,875. Washington, DC: U.S. Patent and Trademark
Office. Brueckner, J.K. (2001): Urban Sprawl: Lessons from Urban Economics, In W.G., Gale and J.R., Pack (Ed.),
Brookings-Wharton Papers on Urban Affairs (pp. 65- 89). Washington, DC: Brookings Institution. Cho, J. (2005). Urban Planning and Urban Sprawl in Korea. Urban Policy and Research, 2, 203-218. Clark, M. L., Roberts, D. A., Ewel, J. J., & Clark, D. B. (2011). Estimation of tropical rain forest aboveground
biomass with small-footprint lidar and hyperspectral sensors. Remote Sensing of Environment, doi:10.1016/j.rse.2010.08.029.
Cutsinger J., and G Gastler (2006). There Is No Sprawl Syndrome: A New Typology of Metropolitan Land Use Patterns, Urban Geography, 27(3), 228-252.
Dunlap, R. E. and J.K. Jorgenson (2012). Environmental Problems. The Wiley-Blackwell Encyclopedia of Globalization.
Ewing, R., & Cervero, R. (2001). Travel and the built environment: a synthesis. Transportation Research Record: Journal of the Transportation Research Board, (1780), 87-114.
Frenkel, A. and Ashkenazi, M. (2008). Measuring Urban Sprawl; How Can We Deal With It? Environment and Planning B, 35(1), 56-79.
Foody, G. M. (2002). Status of land cover classification accuracy assessment. Remote Sensing of Environment, doi:10.1016/S0034-4257(01)00295-4
Foody, G. M. (2008). Harshness in image classification accuracy assessment. International Journal of Remote Sensing, 29(11), 3137-3158.
Frumkin, Howard. (2002). Urban sprawl and public health. (Viewpoint). Public Health Reports, (3), 201. Glaeser, E. L., & Kahn, M. E. (2003). Sprawl and urban growth. Working Paper Series, 9733. Grimm, N. B., S. H. Faeth, N. E. Golubiewski, C. L. Redman, J. Wu, Z. Bai, and J. M. Briggs. (2008). Global
change and the ecology of cities. Science, 319, 756-760. Gustafson, E. J. (1998). Minireview: Quantifying Landscape Spatial Pattern: What Is the State of the Art? Ecosystems,
doi:10.1007/s100219900011. Hakim, B.S. 1986. Arabic-Islamic Cities: Building and Planning Principles, University of Michigan Press. Hart, M. A., & Sailor, D. J. (2009). Quantifying the influence of land-use and surface characteristics on spatial
variability in the urban heat island. Theoretical and Applied Climatology, doi:10.1007/s00704-008-0017-5 Hortas-Rico, M. (2010). Does Urban Sprawl Increase the Costs of Providing Local Public Services? Evidence from
Spanish Municipalities. Urban Studies, 7, 1513-1540. Li F, Liu X, Hu D, Wang R, Yang W, Li D et al (2009) Measurement indicators and an evaluation approach for
assessing urban sustainable development: a case study for China’s Jining City. Landscape and Urban Planning, 90, 134–142.
Li, F. & Peijun, D. (2013) Dyanamic change analysis of urban sprawl based on remote sensing and GIS-a case study of Jiangning, Nanjing, China. Proceedings of the JURSE, April 21-23.
Lillesand, T. M. (2004). Remote sensing and image interpretation (5th ed.). New York: Wiley.
European Journal of Sustainable Development Research, 1:2 (2017), 11
© 2017 by Author/s 13
Lo, C. P., & Choi, J. (2004). A hybrid approach to urban land use/cover mapping using Landsat 7 Enhanced Thematic Mapper Plus (ETM+) images. International Journal of Remote Sensing, 25(14), 2687-2700.
Loutzenheiser, D. R. (1997). Pedestrian access to transit: model of walk trips and their design and urban form determinants around bay area rapid transit stations. Transportation Research Record, 1604, 40-49.
Makido, Y., Shandas, V., Ferwati, S., & Sailor, D. (2016). Daytime variation of urban heat islands: the case study of Doha, Qatar. Climate, 4(2), 32.
McGarigal, K., Cushman, S., & Ene, E. (2012). FRAGSTATS v4: Spatial Pattern Analysis Program for Categorical and Continuous Maps. Computer software program produced by the authors at the University of Massachusetts, Amherst. Retrieved from http://www.umass.edu/landeco/research/fragstats/fragstats.html. Accessed August 2014.
MDPS: Ministry of Development Planning and Statistics. (2014). Statistics Tree. Retrieved from http://www.qix.gov.qa/ Accessed August 2014.
Monkkonen, P. (2008). Using online satellite imagery as a research tool mapping changing patterns of urbanization in Mexico, Journal of Planning Education and Research, 28 (2), 225-236.
Nassar, A. K., Alan, B. G., & Duncan, W. J. (2014). Developing the desert: The pace and process of urban growth in Dubai. Computers, Environment and Urban Systems, 45, 50-62.
Ng, M., Fleming, T., Robinson, M., Thomson, B., Graetz, N., Margono, C., ... & Abraham, J. P. (2014). Global, regional, and national prevalence of overweight and obesity in children and adults during 1980–2013: a systematic analysis for the Global Burden of Disease Study 2013. The Lancet, 384(9945), 766-781.
O’Neill, B. C., Dalton, M., Fuchs, R., Jiang, L., Pachauri, S., & Zigova, K. (2010). Global demographic trends and future carbon emissions. Proceedings of the National Academy of Sciences, doi:10.1073/pnas.1004581107
Park, H.-S. (1986). Features of the heat island in Seoul and its surrounding cities. Atmospheric Environment, doi:10.1016/0004-6981(86)90326-4
Parsons, Brinckerhodd, Quade and Douglas, Inc., (1994). Building Orientation – a Supplement to “the pedestrian environment”. Portland OR: 100 Friends of Oregon.
QNDS (2011). Qatar National Development Strategy: Towards Qatar national vision 2030, the Qatar General Secretariat for Development Planning, Doha, Qatar.
Radhakrishnan, N. (2014). Analysis of Urban Sprawl Pattern in Tiruchirappalli City Using Applications of Remote Sensing and GIS. Arabian Journal for Science and Engineering, 7, 5555-5563.
Rizzo, A. (2013). Metro Doha. Cities, 31, 533–543. doi:10.1016/j.cities.2011.11.011 Schowengerdt, R. A. (1997). Remote Sensing: Models and Methods for Image Processing. Elsevier. Salama A. and F. Weidman, 2015. Demystifying Doha. Routledge Press. Shalaby, A., Ali, R., & Gad, A. (2012). Urban sprawl impact assessment on the agricultural land in Egypt using
remote sensing and GIS: A case study, Qalubiya Governorate. Journal of Land Use Science, 7(3), 261-273. Schmid, H., 2009. Economy of Fascination. Dubai and Las Vegas as Themed Urban Landscapes, Gebrueder
Borntraeger, Stuttgart. Song, Y., & Knaap, G.-J. (2004). Measuring Urban Form: Is Portland Winning the War on Sprawl?. Journal of the
American Planning Association, 70(2), 210. Turner, M. G. (2001). Landscape ecology in theory and practice: pattern and process. New York: Springer. Wiedmann, F., Salama, A. M., & Thierstein, A. (2012). Urban evolution of the city of Doha: An investigation into
the impact of economic transformations on urban structures. Metu Journal of the Faculty of Architecture, 29, 2, 35-61.
Wiedmann, F. (2012). Post-oil Urbanism in the Gulf: New Evolutions in Governance and the Impact on Urban Morphologies. Stuttgart.
Wiedmann, F., Salama, A., & Mirincheva, V. (2014). Sustainable urban qualities in the emerging city of Doha. Journal of Urbanism, 1-23.
Wirth, E. 1988. Dubai: Ein modernes städtisches Handels- und Dienstleistungszentrum am Arabisch-Persischen Golf, Selbstverlag der Fränkischen Geographischen Gesellschaft, Erlangen.
World Bank, (2008). Urban Development in the Middle East and North Africa (MENA). Sector Brief. Resource document. http://siteresources.worldbank.org/INTMNAREGTOPURBDEV/Resources/URBAN-ENG2008AM.pdf Accessed August 2014.
World Bank. (2014). Data: Qatar. Resource document. http://data.worldbank.org/country/qatar. Accessed August 2014.
WHO (World Health Oregnization). Global Ambient Air Pollution Database. Accessed at: http://www.who.int/phe/health_topics/outdoorair/databases/cities/en/, on July 10th, 2016.