rapid pharmaceutical management assessment: an indicator
TRANSCRIPT
RAPID PHARMACEUTICAL
MANAGEMENT ASSESSMENT:
AN INDICATOR-BASED APPROACH
July 1995
Rational Pharmaceutical Management Project Latin America and Caribbean HealthDrug Management Program and Nutrition Sustainability ProjectManagement Sciences for Health University Research Corporation1655 North Fort Myer Drive, Suite 920 7200 Wisconsin Avenue, Suite 600Arlington, VA 22209 USA Bethesda, MD 20814 USA(703) 524-6575 (301) 941-8490
In technical collaboration with:
Regional Program on Essential DrugsPan American Health Organization
525 23rd Street, N.W.Washington, DC 20037 USA
(202) 861-3200

Table of Contents
EXECUTIVE SUMMARY . . . . . . . . . . . . . . . . . . . . . . . . . . . . . . . . . . . . . . . . . . . . . . . . . . . . . . . . . . . . . . . . . . . 1A. Purpose . . . . . . . . . . . . . . . . . . . . . . . . . . . . . . . . . . . . . . . . . . . . . . . . . . . . . . . . . . . . . . . . . . . . . 1B. Scope . . . . . . . . . . . . . . . . . . . . . . . . . . . . . . . . . . . . . . . . . . . . . . . . . . . . . . . . . . . . . . . . . . . . . . 1C. Development Process . . . . . . . . . . . . . . . . . . . . . . . . . . . . . . . . . . . . . . . . . . . . . . . . . . . . . . . . . . 2D. Intended Users of this Manual . . . . . . . . . . . . . . . . . . . . . . . . . . . . . . . . . . . . . . . . . . . . . . . . . . . 2E. Contents . . . . . . . . . . . . . . . . . . . . . . . . . . . . . . . . . . . . . . . . . . . . . . . . . . . . . . . . . . . . . . . . . . . . 3
I. INTRODUCTION . . . . . . . . . . . . . . . . . . . . . . . . . . . . . . . . . . . . . . . . . . . . . . . . . . . . . . . . . . . . . . . . . . . 5A. Background . . . . . . . . . . . . . . . . . . . . . . . . . . . . . . . . . . . . . . . . . . . . . . . . . . . . . . . . . . . . . . . . . . 5B. Objectives . . . . . . . . . . . . . . . . . . . . . . . . . . . . . . . . . . . . . . . . . . . . . . . . . . . . . . . . . . . . . . . . . . . 7C. Cautions . . . . . . . . . . . . . . . . . . . . . . . . . . . . . . . . . . . . . . . . . . . . . . . . . . . . . . . . . . . . . . . . . . . . 9
II. INDICATORS DESCRIPTION FORMAT . . . . . . . . . . . . . . . . . . . . . . . . . . . . . . . . . . . . . . . . . . . . . . 15
III. DETAILED DESCRIPTIONS OF THE INDICATORS . . . . . . . . . . . . . . . . . . . . . . . . . . . . . . . . . . . . 17A. Policy, Legislation and Regulation . . . . . . . . . . . . . . . . . . . . . . . . . . . . . . . . . . . . . . . . . . . . . . . 17
A.1 Existence of a national drug policy approved by the government . . . . . . . . . . . . . . . . 17A.2 Existence of comprehensive drug control legislation, regulations and enforcement
agencies . . . . . . . . . . . . . . . . . . . . . . . . . . . . . . . . . . . . . . . . . . . . . . . . . . . . . . . . . . . . . 19A.3 Percentage of unregistered drug products in a sample of private sector drug retail
outlets . . . . . . . . . . . . . . . . . . . . . . . . . . . . . . . . . . . . . . . . . . . . . . . . . . . . . . . . . . . . . . 21A.4 Type of drug registration information system . . . . . . . . . . . . . . . . . . . . . . . . . . . . . . . 23A.5 Number of drugs registered . . . . . . . . . . . . . . . . . . . . . . . . . . . . . . . . . . . . . . . . . . . . . 25A.6 Law permitting generic substitution by pharmacists . . . . . . . . . . . . . . . . . . . . . . . . . . 27A.7 Practice of generic substitution . . . . . . . . . . . . . . . . . . . . . . . . . . . . . . . . . . . . . . . . . . . 29
B. Formulary/Essential Drugs List and Drug Information . . . . . . . . . . . . . . . . . . . . . . . . . . . . . . . 31B.1 Number of unique drug products on National Drug Formulary List . . . . . . . . . . . . . . 31B.2 Existence of an official manual, based on the National Drug Formulary List, providing
basic drug information to prescribers, revised and published within the last five years33B.3 Percentage of MOH health facilities visited with the most current edition of an official
manual based on the National Drug Formulary List . . . . . . . . . . . . . . . . . . . . . . . . . . 35B.4 Existence of drug information centers that provide unbiased and current information to
public health decision makers, health care providers and consumers . . . . . . . . . . . . . 36C. Ministry of Health Budget and Finance . . . . . . . . . . . . . . . . . . . . . . . . . . . . . . . . . . . . . . . . . . . 38
C.1 MOH budget or expenditures on pharmaceuticals, US$ per capita . . . . . . . . . . . . . . . 38C.2 Existence of a system for recovering the cost of drugs dispensed in MOH health
facilities . . . . . . . . . . . . . . . . . . . . . . . . . . . . . . . . . . . . . . . . . . . . . . . . . . . . . . . . . . . . . 41C.3 Percentage of patients who pay a charge for drugs they receive in MOH health facilities43C.4 Percentage of total government recurrent budget used for Ministry of Health . . . . . . 45C.5 Percentage of total MOH recurrent budget allocated to pharmaceuticals . . . . . . . . . . 47
D. Ministry of Health Pharmaceutical Procurement . . . . . . . . . . . . . . . . . . . . . . . . . . . . . . . . . . . . 49D.1 Existence of a policy limiting MOH pharmaceutical procurement to drugs on the
National Drug Formulary List/National Essential Drugs List . . . . . . . . . . . . . . . . . . . 49D.2 Percentage by value of MOH drugs purchased through a central procurement system 50D.3 Percentage of average international price paid for last regular procurement of a set of
indicator drugs . . . . . . . . . . . . . . . . . . . . . . . . . . . . . . . . . . . . . . . . . . . . . . . . . . . . . . . 52D.4 Percentage by value of MOH drugs purchased through competitive tender . . . . . . . . 55
E. Ministry of Health Pharmaceutical Logistics . . . . . . . . . . . . . . . . . . . . . . . . . . . . . . . . . . . . . . . 57

E.1 Weighted average percentage of inventory variation for a set of indicator drugs in MOHstorage and health facilities . . . . . . . . . . . . . . . . . . . . . . . . . . . . . . . . . . . . . . . . . . . . . 57
E.2 Average percentage of individual variation for a set of indicator drugs in MOH storageand health facilities . . . . . . . . . . . . . . . . . . . . . . . . . . . . . . . . . . . . . . . . . . . . . . . . . . . . 60
E.3 Average percentage of stock records that corresponds with physical counts for a set ofindicator drugs in MOH storage and health facilities . . . . . . . . . . . . . . . . . . . . . . . . . . 63
E.4 Average percentage of a set of unexpired indicator drugs available in MOH storage andhealth facilities . . . . . . . . . . . . . . . . . . . . . . . . . . . . . . . . . . . . . . . . . . . . . . . . . . . . . . . 66
E.5 Average percentage of time out of stock for a set of indicator drugs in MOH storageand health facilities . . . . . . . . . . . . . . . . . . . . . . . . . . . . . . . . . . . . . . . . . . . . . . . . . . . . 68
F. Patient Access and Drug Utilization . . . . . . . . . . . . . . . . . . . . . . . . . . . . . . . . . . . . . . . . . . . . . 70F.1 Population per functional MOH health facility that dispenses drugs . . . . . . . . . . . . . 70F.2 Population per licensed pharmacist or pharmacy technician in the public sector . . . . 72F.3 Population per authorized prescriber in the public sector . . . . . . . . . . . . . . . . . . . . . . 74F.4 Average number of drugs prescribed per curative outpatient encounter in MOH health
facilities . . . . . . . . . . . . . . . . . . . . . . . . . . . . . . . . . . . . . . . . . . . . . . . . . . . . . . . . . . . . . 76F.5 Percentage of drugs prescribed by generic name in MOH health facilities . . . . . . . . . 78F.6 Percentage of drugs prescribed from the National Drug Formulary List in MOH health
facilities . . . . . . . . . . . . . . . . . . . . . . . . . . . . . . . . . . . . . . . . . . . . . . . . . . . . . . . . . . . . . 80F.7 Percentage of outpatients prescribed injections at MOH health facilities . . . . . . . . . . 82F.8 Percentage of outpatients prescribed antibiotics at MOH health facilities . . . . . . . . . 82F.9 Percentage of prescribed drugs presented for dispensing that are actually dispensed in
MOH health facilities . . . . . . . . . . . . . . . . . . . . . . . . . . . . . . . . . . . . . . . . . . . . . . . . . . 85G. Product Quality Assurance . . . . . . . . . . . . . . . . . . . . . . . . . . . . . . . . . . . . . . . . . . . . . . . . . . . . . 87
G.1 MOH drug product quality laboratory tests during the past year: (a) number of drugproducts tested and (b) total number of drug product quality tests performed . . . . . . 87
G.2 Use of WHO Certification Scheme . . . . . . . . . . . . . . . . . . . . . . . . . . . . . . . . . . . . . . . 89G.3 Existence of formal systems for reporting: (a) product quality complaints, and (b)
adverse drug reactions (ADRs) . . . . . . . . . . . . . . . . . . . . . . . . . . . . . . . . . . . . . . . . . . . 91H. Private Sector Pharmaceutical Activity . . . . . . . . . . . . . . . . . . . . . . . . . . . . . . . . . . . . . . . . . . . 93
H.1 Population per licensed private sector drug retail outlet . . . . . . . . . . . . . . . . . . . . . . . 93H.2 Number of licensed or registered drug retail outlets per government drug inspector
. . . . . . . . . . . . . . . . . . . . . . . . . . . . . . . . . . . . . . . . . . . . . . . . . . . . . . . . . . . . . . . . . . . . 95H.3 Percentages of drug manufacturers, distributors, and drug retail outlets inspected during
a one-year period . . . . . . . . . . . . . . . . . . . . . . . . . . . . . . . . . . . . . . . . . . . . . . . . . . . . . . 96H.4 Total value of total private sector retail pharmaceutical sales, US$ per capita . . . . . . 98H.5 Combined value of public sector pharmaceutical expenditures and private sector retail
sales, US$ per capita . . . . . . . . . . . . . . . . . . . . . . . . . . . . . . . . . . . . . . . . . . . . . . . . . . 100H.6 Percentage of products on National Drug Formulary List that are currently
manufactured or co-manufactured within the country . . . . . . . . . . . . . . . . . . . . . . . . 102H.7 Average of median private sector drug retail prices as a percentage of MOH acquisition
prices for a set of indicator drugs . . . . . . . . . . . . . . . . . . . . . . . . . . . . . . . . . . . . . . . . 103H.8 Existence of price controls for drugs in the private sector . . . . . . . . . . . . . . . . . . . . . 106H.9 Percentage of licensed drug retail outlets where an antibiotic was available without a
prescription . . . . . . . . . . . . . . . . . . . . . . . . . . . . . . . . . . . . . . . . . . . . . . . . . . . . . . . . . 108
IV. GUIDELINES FOR STUDY DESIGN . . . . . . . . . . . . . . . . . . . . . . . . . . . . . . . . . . . . . . . . . . . . . . . . 111A. Gathering Vital Statistics and Background Information . . . . . . . . . . . . . . . . . . . . . . . . . . . . . 113B. Preparing an Overview of MOH Pharmaceutical Management Operations . . . . . . . . . . . . . . 113C. Specifying a List of Indicator Drugs . . . . . . . . . . . . . . . . . . . . . . . . . . . . . . . . . . . . . . . . . . . . 114D. Designing a Survey of Health Facilities and Drug Retail Outlets . . . . . . . . . . . . . . . . . . . . . . 115

E. Defining Approaches for Collecting Survey Data . . . . . . . . . . . . . . . . . . . . . . . . . . . . . . . . . . 117F. Developing Data Collection Forms and Structured Interview Questionnaires . . . . . . . . . . . . 121G. Defining a Range of Dates for Retrospective Data . . . . . . . . . . . . . . . . . . . . . . . . . . . . . . . . . 121
V. IMPLEMENTATION OF AN INDICATORS STUDY . . . . . . . . . . . . . . . . . . . . . . . . . . . . . . . . . . . 123A. Work Plan . . . . . . . . . . . . . . . . . . . . . . . . . . . . . . . . . . . . . . . . . . . . . . . . . . . . . . . . . . . . . . . . . 123B. Review of Data Collection Methods . . . . . . . . . . . . . . . . . . . . . . . . . . . . . . . . . . . . . . . . . . . . 124C. Logistical Arrangements . . . . . . . . . . . . . . . . . . . . . . . . . . . . . . . . . . . . . . . . . . . . . . . . . . . . . 125D. Analyzing Data and Presenting Results . . . . . . . . . . . . . . . . . . . . . . . . . . . . . . . . . . . . . . . . . . 126
Annex A: Sample Materials for an Overview of Pharmaceutical Management . . . . . . . . . . . . . . . . . . . . . . . . 129
Annex B: Sample Lists of Indicator Drugs . . . . . . . . . . . . . . . . . . . . . . . . . . . . . . . . . . . . . . . . . . . . . . . . . . . . 135
Annex C: Sample Data Collection Forms . . . . . . . . . . . . . . . . . . . . . . . . . . . . . . . . . . . . . . . . . . . . . . . . . . . . . 143
Annex D: Sample Structured Interview Questionnaire . . . . . . . . . . . . . . . . . . . . . . . . . . . . . . . . . . . . . . . . . . . 197
Annex E: End Notes . . . . . . . . . . . . . . . . . . . . . . . . . . . . . . . . . . . . . . . . . . . . . . . . . . . . . . . . . . . . . . . . . . . . . . 201

List of Tables
Table 1: List of Pharmaceutical System Indicators . . . . . . . . . . . . . . . . . . . . . . . . . . . . . . . . . . . . . . . . . . . . . . . 10Table 2: Pharmaceutical Indicators Set . . . . . . . . . . . . . . . . . . . . . . . . . . . . . . . . . . . . . . . . . . . . . . . . . . . . . . . . 12Table 3: Indicators to Be Measured with Survey Methods and Data Collection Forms . . . . . . . . . . . . . . . . . . 122Table 4: Provisional Work Plan . . . . . . . . . . . . . . . . . . . . . . . . . . . . . . . . . . . . . . . . . . . . . . . . . . . . . . . . . . . . . 124Table 5: Illustrative Training Course for Data Collectors in Health Facilities and Drug Retail Outlets . . . . . 128

ACKNOWLEDGMENTS
This manual could not have been created, tested and revised without the assistance of a large number of interested professionals. We take pleasure in acknowledging theimportant contributions made by the following organizations and individuals.
United States Agency for International Development
Two USAID staff members deserve special mention for their roles in thisactivity. Nicholas Studzinski provided instrumental leadership in gettingthe work started through the Latin America/Caribbean Health and NutritionSustainability Project. Anthony Boni has provided unfailing support forcontinued development through the Rational Pharmaceutical ManagementProject.
Latin America/Caribbean Health and Pan American Health OrganizationNutrition Sustainability Project
Thomas Bossert Kees De JoncheereJack Galloway Enrique FeferJohn Holley Adela RosenkranzAida Leroy Ileana Santich
Harvard Medical School International Review PanelDrug Policy Research Group
Dennis Ross-Degnan Kevin ArmstrongStephen Soumerai Ana Maria Arriagada
Management Sciences for Health Drug Management Program
James Bates Anthony BattersbyElvira Beracochea Jaime BenaventeEnriqueta Clark Karin BergstromVimal Dias Michael BernhartPatricia Foreman Henk Den BestenPradeep Goel BimoRichard Laing Richard BlakneyDavid Lee Roy BrooksJeanne Madden Denis BrounJulie McFadyen Eugenie BrownChris Olson Pascale Brudon-JakobowiczJames Rankin Patricia BushJean-Pierre Sallet Malcolm ButlerAnthony Savelli Patrizia CarlevaroSarah Schuler Sidney ChernenkoffWaichi Wong
Rosario D'Alessio
Fernando Antezana
Jeffrey AshleyPaul AuxilaOla A. AyanbekuWilbert Bannenberg

Azad Chowdhury William McGreevey Agathe WehrliRene Christensen Marc Mitchell Albert WertheimerRichard Church Catherine Morlock Brian WilkinsonMariam Claeson Gabriel Mwaluko Richard WilsonCatherine Crone Coburn Richard Nelson Alonzo WindPeter Cross Ole Nielsen Antonio Carlos ZaniniCarlos Javier Cuellar Christine NortonGabriel Daniel Nyi NyiAnanda Mohan Das Ronald O'ConnorJan Dik Joseph OddisVinod Diwan David Ofori-AdjeiLina Domingo William OldhamGraham Dukes Mead OverJ.F. Dunne Agostino PaganiniEdward Ellerbeck C. PannenborgSteven Fabricant Clydette PowellPeter H.M. Fontilus Agma PrinsNadine Gasman Jonathan QuickReginald Gipson Ralph RackPeter Graaff David RadelSherita Gregoire Michael ReichHilbrand Haak Richard RobertsAnita Hardon Robert RobertsonPaul Hartenberger John RohdeJens Hasfeldt Donald RuckerMargaretha Helling-Borda Camille SaadeNed Heltzer Stephen SaccaFiliberto Hernández Lateef SalakoHans Hogerzeil Budiono SantosoPeter Huff-Rousselle Philippa SaundersMargaret Hume Gordon SchiffWilliam Jansen Miriam SchneidmanStephen Jarrett David SencerKeith Johnson Diana SilimperiKumud Kafle Barry SmithNoreen Kerr James SocknatRobert Kim-Farley Steven SolterRosalyn King A.O.O. SorungbeVed Kumar Göran SterkyCalvin Kunin Yutaka SuzukiJean-Louis Lamboray E. TarimoKaren Lashman-Hall Youssef TawfikLaurence Laumonier-Ickx Göran TomsonErnst Lauridsen James TullochPhilip Lee Johannes Van HaperenBarry Levy Alexander van OmmenA.F.B. Mabadeje Marcelo VernengoPierre Mandl Taryn VianPatricio Marquez Ruday WabitshJohn Martin Gill WaltAmos Massele Krisantha Weerasuriya

EXECUTIVE SUMMARY
A. Purpose
This manual presents an indicator-based approach for rapidly assessing pharmaceutical management systemsand programs. Such assessments have a number of potential applications, including:
! Defining the status of the pharmaceutical system, including strengths and weaknesses, formanagers and donors
! Designing and planning interventions! Defining budget or resource requirements! Monitoring changes in systems and the impact of interventions! Comparing the performance of different systems, programs, or countries
Rapid assessments may be indicated when the existing management information system is unable to track theperformance of the pharmaceutical system, or when urgent drug problems are evident. The assessment shouldresult in an analysis of why the problems that exist have come to pass, which problems can be solved, andwhat interventions are feasible in terms of cost-effectiveness and sustainability.
B. Scope
The manual presents a set of 46 indicators of performance, grouped under eight topics of pharmaceuticalmanagement, which are listed below.
! Policy, Legislation and Regulation! Formulary/Essential Drug Lists and Drug Information! Ministry of Health Budget and Finance! Ministry of Health Pharmaceutical Procurement! Ministry of Health Pharmaceutical Logistics! Patient Access and Drug Utilization! Product Quality Assurance! Private Sector Pharmaceutical Activity
Each topic is covered by a subset of indicators. Thirty-four of the indicators are quantitative, that is,expressed as numbers. Twelve are qualitative, in that they describe the presence or absence of a policy ormanagement system, and in some cases, the degree of implementation.
Carrying out an assessment that includes all 46 indicators will provide a reasonably complete overview ofpharmaceutical systems operations in a given country. It is also valid to use the subsets of indicatorsselectively, according to need. This approach could be used for focused assessments based on, for example,the indicators for logistics or the indicators for drug utilization.
C. Development Process
In developing this manual, our overall objective has been to produce a concise set of proposed indicators foruse in the context of a rapid assessment method that can be carried out in a reasonable period of time by non-specialists. To be useful over the long run, it is necessary that each of the indicators in the set meet thefollowing criteria.

2 Rapid Pharmaceutical Management Assessment
! Importance - Each indicator must reflect an important dimension of performance.! Measurability - Indicators must be measurable, within constraints of time and variable quality
and availability of data.! Reliability - Each indicator must be reliable over time and with different observers.! Validity - Each indicator must allow a consistent and clear interpretation and have a similar
meaning across different environments.
To meet these criteria, we began by soliciting recommendations from a panel of over 150 professionalsworking internationally in drug management, who subsequently produced a preliminary list of over 200 items.From this list, we distilled a list of 33 indicators for field testing. Next, teams of international and localexperts carried out assessments in 11 countries, including Guatemala, Ecuador, El Salvador, Nicaragua,Jamaica, the Organization of Eastern Caribbean States, Ghana, Mozambique, Nepal, Cambodia and Russia.Based on the outcomes of these field tests, we made revisions, added new indicators and produced the currentset of 46 indicators presented in this manual. The work was done in close collaboration with PAHO, with aview to harmonizing this set of indicators with data collected by PAHO in a survey of Central Americancountries.
D. Intended Users of this Manual
Depending on the purpose and context of assessment activities, likely users of this manual include:
! Ministry of Health (MOH) decision makers, health planners, health economists, donorrepresentatives, or experts responsible for project design and evaluation activities
! System managers at the national, regional or local levels wishing to measure the performance ofspecific systems or activities, such as drug registration, product selection, procurement, stockrecord keeping or prescribing
! Social scientists, and health project or facility managers who are interested in operationalresearch and management tools
Other potential "users" of this manual are "system participants" who might benefit from the specific findingsthat an indicator-based assessment produces. For example, indicators measuring the performance of stockrecord keeping systems or prescribing practices can be usefully reported to staff at warehouses or clinicalfacilities to give them an idea of how their own performance compares with that of others.
Users have basically three options for gathering data for the indicators study:
! Structured Assessment - Field visits by a dedicated team that makes use of structured surveyinstruments
! Limited Assessment - Interviews, document review using less formal assessment methods! Self-Assessment - Informal questionnaires and working groups to determine the nature and
extent of the problems

Executive Summary 3
E. Contents
The manual is designed to take users step-by-step through the assessment process, beginning withintroducing the concept of indicator-based assessments, and ending with producing an assessment report.There are five chapters in the manual:
I. Introduction: Provides background on the history of indicator-based assessments and thedevelopment of this manual.
II. Indicators Description Format: Defines the standard format for presenting the indicators.
III. Detailed Descriptions of the Indicators: Explains, for each indicator, the rationale, definition,data collection, computation, and sample presentations of results.
IV. Guidelines for Study Design: Provides details for survey design and data collection activities.
V. Implementation of an Indicators Study: Covers the practical problems of carrying out anassessment, including logistical arrangements and recruiting and training data collectors.

I. INTRODUCTION
This manual is the result of an ongoing effort to develop and test a rapid assessment method based on a set ofprocess and outcome indicators that can be used to monitor and compare significant aspects ofpharmaceutical systems. The work has been done under the auspices of two projects financed by the UnitedStates Agency for International Development (USAID).
Initial development and field testing of 33 indicators, and various methods for data collection, were done by aworking group led by the Management Sciences for Health Drug Management Program and the Harvard DrugPolicy Research Group, with support and guidance from the Latin America/Caribbean Health and NutritionSustainability Project (LA/C-HNS), a USAID-funded project managed by University Research Corporation.Input into the first draft list of indicators was also provided by the Ghana and Indonesia Core Groups of theInternational Network for Rational Use of Drugs (INRUD).
Additional field tests, and revisions of both methods and the manual itself, have been accomplished throughcountry pharmaceutical sector assessments performed by the USAID-financed Rational PharmaceuticalManagement Project (RPM), which is composed of cooperative agreements with Management Sciences forHealth (MSH) and the United States Pharmacopeial Convention, Inc. (USP). As a result, the original set ofindicators has been expanded to 46. This set is given as Table 1 (page 10). As of December 1994, data havebeen collected in nine countries, and the results are presented in Table 2 (page 12). The method hassubsequently been applied in Cambodia and Russia, but the data from these assessments have not yet beenincorporated into the comparison matrix.
As a review of these two tables shows, the indicators are grouped under eight topics of drug management:
! Policy, Legislation and Regulation! Formulary/Essential Drug Lists and Drug Information! Ministry of Health Budget and Finance! Ministry of Health Pharmaceutical Procurement! Ministry of Health Pharmaceutical Logistics! Patient Access and Drug Utilization! Product Quality Assurance! Private Sector Pharmaceutical Activity
In reviewing Table 2, it is important to note that, as the indicator set has undergone testing and revision, anumber of indicators have evolved. In general, this evolutionary process has been in the direction of morespecificity and focus, based on the data actually available. One consequence of this is that, in some cases,indicator data collected in earlier tests are not complete enough for purposes of expressing the revisedindicators. Where this has occurred, the decision has been made to not include the incomplete data in thetable. Although this produces gaps in the presentation, it maintains the quality and integrity of the data set.
A. Background
Pharmaceutical supply systems in many developing countries have severe problems, including ineffectiveprocedures in selection, poor quality control, and economically inefficient procurement. This has beendocumented in numerous reports and publications. Nonetheless, there has been no standard method for1
measuring the effectiveness of these systems. The LA/C-HNS and RPM work described in this manual buildson and complements other activities directed at developing indicators for pharmaceutical systems and sectors.

6 Rapid Pharmaceutical Management Assessment
Indicators have been used for years in "developed" countries to measure aspects of pharmaceutical systems.Notable examples of organizations that have used indicators in the United States include the U.S. PublicHealth Service, Division of Health Care Delivery, the Joint Commission on Accreditation of HealthcareOrganizations, and the American Society of Hospital Pharmacists. The focus of the indicators developed bythese organizations is relatively specific to U.S. institutions.
The World Health Organization, and in particular the WHO Action Programme on Essential Drugs, haverecognized the need for formal indicators that would facilitate comparative analyses of developing countrypharmaceutical systems. In 1988, WHO published the World Drug Situation, which presented an impressiveamount of useful information, organized into an indicator format. These indicators were, in most cases, not2
presented in a quantitative format, but this work stimulated widespread interest in the concept ofpharmaceutical system indicators.
In the fall of 1994, the WHO Action Programme on Essential Drugs issued a draft manual, entitled ModelIndicators for Monitoring National Drug Policies, which proposes a set of 31 background indicators, 50structural indicators, 38 process indicators, and 10 outcome indicators. These indicators are intended for self3
use by developing countries to monitor their pharmaceutical systems. The WHO Action Programme onEssential Drugs worked with a group including the Harvard School of Public Health and the Centre deRecherches et d'Etudes pour le Développement de la Santé (CREDES - Paris, France) to develop theseindicators. Field testing is planned for 1995.
The Australian government has recently adapted the WHO indicator format to develop its own set of drugpolicy indicators for use in Australia. This set has 41 process indicators, 27 impact indicators and 6 outcome4
indicators. In this model, process indicators are equivalent to WHO structural indicators, and impactindicators are similar to WHO process indicators.
Another group active in developing and testing indicators is the International Network for Rational Use ofDrugs (INRUD). INRUD is a network promoting rational drug use in developing countries, involving 10African and Asian member countries. It is coordinated by MSH, with additional technical support providedby the Harvard Drug Policy Research Group, the Karolinska Institute, the University of Newcastle, and theWHO Action Programme on Essential Drugs. Network sponsors include Danida, WHO, USAID, SIDA, andthe Pew Charitable Trusts. INRUD developed and field tested a set of indicators related to drug use review inprimary care health facilities. The INRUD drug use indicators have been adopted by WHO as the standardmethodology for assessing drug use, and published as the Action Programme on Essential Drugs' manualHow to Investigate Drug Use in Health Facilities. These indicators also form the core of drug use5
assessment in this manual.

Introduction 7
In addition, the Pan American Health Organization (PAHO) sponsored a multi-country project to develop andtest indicators which could be used to measure progress of Essential Drugs Programs in Central America. Thedata from this work were collated and assembled by the PAHO Essential Drugs Advisor for the subregion. InOctober 1993 LA/C-HNS, RPM and PAHO technical staff met for the purpose of standardizing terminologyand methods. The indicators in this manual were modified according to the recommendations made at thismeeting, and, in light of the more advanced stage of development and testing of the MSH indicators and theircompatibility with PAHO's previous effort, the Regional Essential Drugs Program discontinued its field workin this area. Subsequently, in August 1994, PAHO technical staff responsible for PAHO/WHO EssentialDrugs Programs in Latin America met in Lima, Peru, and agreed that the revised RPM and LA/C-HNSindicators would be used, as required, for purposes of program development and evaluation. PAHO will becollaborating in workshops and other activities to promote the use of the indicators by the managers ofnational Essential Drugs Programs.
Discussions have also taken place with the WHO Action Programme on Essential Drugs to explore thepossibility of harmonizing the terms and methods used in this manual with those used in Model Indicatorsfor Monitoring National Drug Policies. The two methods are complementary rather than competitive, in thatthey have different approaches to data collection. The RPM/LA/C-HNS approach is primarily a rapidassessment method, while the WHO approach relies on self reporting by country officials. It is expected thatsteps toward harmonization will occur after the WHO Model Indicators are field tested.
B. Objectives
The goal of the LA/C-HNS and RPM indicators development process is to develop an indicator-based rapidassessment methodology that can be used by developing country managers, international agencies, and donorsto monitor pharmaceutical systems on a regular basis. This means that the indicator set and assessmentmethodology should be as concise as possible, so that the data can be collected in a reasonable time frame.
There are four general criteria for useful indicators, which are listed below.
! Importance - Each indicator must reflect an important dimension of performance. Certain data maybe readily and consistently available, but say nothing important about the system performance.
! Measurability - Each indicator must be measurable, within existing constraints of time and variablequality and availability of source data.
! Reliability - Each indicator must be reliable over time and with different observers. If one observerreports a certain result from a set of data, it is expected that a second observer will report the sameresult.
! Validity - Each indicator must allow a consistent and clear interpretation and have a similarmeaning across different environments.

8 Rapid Pharmaceutical Management Assessment
It is important to recognize that, although the term "indicators" is used for convenience, the indicatorsproposed are not yet indicators in the truest sense, but rather they are standardized measurements of a localpharmaceutical system. There is not enough data available yet to be able to establish normative ranges forany of the measures, or to determine which of the measures have sufficient diagnostic worth to be regarded asstandard indicators. For example, we may be able to say that a country has a national formulary with 400discrete drug products, but we are unable to say if this is too many or too few items for a national formularylist, or indeed whether a national formulary list is a necessary feature of a well functioning pharmaceuticalsystem.
As more data are gathered using consistent methods, it should become possible to determine to what extentthese proposed standard measurements meet the criteria of importance, measurability, reliability, andvalidity, and to begin to establish normal ranges of performance for each of the indicators.
C. Cautions
It is important to keep in mind that this list of indicators, like any other, has limitations. When interpretingthe data presented in Table 2 (page 12), or indicator data which users of this manual may collect themselves,four important cautions should be observed:
! First, when collecting indicator data, it is essential to systematically collect descriptivebackground information. Such information is often required for usefully interpreting individualindicators. For example, consider indicator G.3, "Existence of a formal system for reportingproduct quality complaints." The indicator may be recorded as limited, indicating that such asystem formally exists but does not function regularly in practice. Specificity can be added byproviding background information, as in the following illustrative example:
In country Y, the Drug Regulatory Authority is mandated by the health code to monitor andtake action on product quality complaints. The status of this system is at best limited,because no standard reporting forms exist, and only one complaint was received during thetwelve months preceding the assessment. There was no evidence of follow up action.
! Second, to place the pharmaceutical indicator data in context, additional information about thelocal situation may be required. The indicators described here are not intended to stand alone,but rather to be used in conjunction with compilations of social and health indicators such as theWorld Bank World Development Report.
! Third, it should not be assumed that the indicator data must be collected on an all-or-nothingbasis. For example, if for some reason the indicators in section H, "Private SectorPharmaceutical Activity" cannot be collected, it is still worthwhile to collect the indicatorscovering the public sector system. In fact, one recent application of the indicator set, carried outin Cambodia, demonstrated that selected indicators could be drawn from various sections of theoverall set to meet the needs of local decision makers.
! Fourth, not all of the indicators may be reliably compared from country to country and region toregion. Indicators for drug prices, drug availability, stock record keeping and drug use may beusefully compared across a spectrum of countries when supplemented with appropriatebackground information. Financial indicators, however, should be compared with great cautionbecause public and private sector financial contexts are so complex and vary so significantlyfrom country to country, and region to region.

Table 1: List of Pharmaceutical System Indicators
A. POLICY, LEGISLATION AND REGULATION 1. Existence of a national drug policy approved by the government
2. Existence of comprehensive drug control legislation, regulations and enforcement agencies3. Percentage of unregistered drug products in a sample of private sector drug retail outlets4. Type of drug registration information system5. Number of drugs registered6. Law permitting generic substitution by pharmacists7. Practice of generic substitution
B. FORMULARY/ESSENTIAL DRUGS LIST AND DRUG INFORMATION1. Number of unique drug products on the National Drug Formulary List 2. Existence of an official manual, based on the National Drug Formulary List, providing basic drug
information to prescribers, revised and published within the last five years3. Percentage of MOH health facilities visited with the most current edition of an official manual
based on the National Drug Formulary List4. Existence of drug information centers that provide unbiased and current information to public
health decision makers, health care providers and consumers
C. MINISTRY OF HEALTH BUDGET AND FINANCE1. MOH budget or expenditures on pharmaceuticals, US$ per capita2. Existence of a system for recovering the cost of drugs dispensed in MOH health facilities3. Percentage of patients who pay a charge for drugs they receive in MOH health facilities4. Percentage of total government recurrent budget used for Ministry of Health 5. Percentage of total MOH recurrent budget allocated to pharmaceuticals
D. MINISTRY OF HEALTH PHARMACEUTICAL PROCUREMENT1. Existence of a policy limiting MOH pharmaceutical procurement to drugs on the National Drug
Formulary List2. Percentage by value of MOH drugs purchased through a central procurement system3. Percentage of average international price paid for last regular procurement of a set of indicator
drugs4. Percentage by value of MOH drugs purchased through competitive tender
E. MINISTRY OF HEALTH PHARMACEUTICAL LOGISTICS1. Weighted average percentage of inventory variation for a set of indicator drugs in MOH storage
and health facilities2. Average percentage of individual variation for a set of indicator drugs in MOH storage and health
facilities3. Average percentage of stock records that corresponds with physical counts for a set of indicator
drugs in MOH storage and health facilities4. Average percentage of a set of unexpired indicator drugs available in MOH storage and health
facilities5. Average percentage of time out of stock for a set of indicator drugs in MOH storage and health
facilities

10 Rapid Pharmaceutical Management Assessment
F. PATIENT ACCESS AND DRUG UTILIZATION1. Population per functional MOH health facility that dispenses drugs2. Population per licensed pharmacist or pharmacy technician in the public sector3. Population per authorized prescriber in the public sector4. Average number of drugs prescribed per curative outpatient encounter in MOH health facilities5. Percentage of drugs prescribed by generic name in MOH health facilities6. Percentage of drugs prescribed from the National Drug Formulary List in MOH health facilities7. Percentage of outpatients prescribed injections at MOH health facilities8. Percentage of outpatients prescribed antibiotics at MOH health facilities9. Percentage of prescribed drugs presented for dispensing that are actually dispensed in MOH
health facilities
G. PRODUCT QUALITY ASSURANCE1. MOH drug product quality laboratory tests during the past year: (a) number of drug products
tested, and (b) total number of drug product quality tests performed 2. Use of WHO Certification Scheme3. Existence of formal systems for reporting: (a) product quality complaints, and (b) adverse drug
reactions (ADRs)
H. PRIVATE SECTOR PHARMACEUTICAL ACTIVITY1. Population per licensed private sector drug retail outlet 2. Number of licensed or registered drug retail outlets per government drug inspector3. Percentages of drug manufacturers, distributors, and drug retail outlets inspected during a one-
year period 4. Total value of private sector retail pharmaceutical sales, US$ per capita
5. Combined value of public sector pharmaceutical expenditures and private sector retail sales, US$per capita
6. Percentage of products on National Drug Formulary List that are currently manufactured or co-manufactured within the country
7. Average of median private sector drug retail prices as a percentage of MOH acquisition prices fora set of indicator drugs
8. Existence of price controls for drugs in the private sector9. Percentage of licensed drug retail outlets where an antibiotic was available without a prescription

TABLE 2: PHARMACEUTICAL INDICATORS SET: COMPARISON OF SELECTED COUNTRIES
NEPALOECS (B)JAMAICANICARAGUA (A)GUATEMALAEL SALVADORECUADORECUADORGHANAMOZAMBIQUE1993199319921994199219931994199219931993
A. POLICY, LEGISLATION AND REGULATIONNoNoNoYesNoYesYesNoNo1. Existence of a national drug policy approved by the governmentYesNoYesNoYesYesYesNo2. Existence of comprehensive drug control legislation, regulations and enforcement agencies
100%21%7.3%23%N/A0%N/AN/A3. % of unregistered drug products in a sample of private sector drug retail outletsManualNoneManualComputerizedManualMixedMixedManualNone4. Type of drug registration information system11,000+7,00619,7001,5745. Number of drugs registered
No No NoNoNoNoNo No No N/A6. Law permitting generic substitution by pharmacists7. Practice of generic substitution
B. FORMULARY/ESSENTIAL DRUGS LIST AND DRUG INFORMATION2613881,0102344282844384382223831. Number of unique drug products on National Drug Formulary List YesYesYesNoYesYesYesYesNoNo2. Existence of an official manual, based on the NDFL, providing
basic drug information to prescribers, revised and published within last 5 yearsN/A100%N/A7%0%0%70%25% 45%100%3. % of MOH health facilities visited with the most current
edition of an official manual based on the NDFL4. Existence of drug information centers that provide unbiased and current information to public health
NoNoYesYesYesNoNoNoNo decision makers, health care providers and consumers
C. MINISTRY OF HEALTH BUDGET AND FINANCE $5.50$1.98$1.13$3.93$4.96$0.25$0.09$0.46 (C)$ 0.621. MOH budget or expenditures on pharmaceuticals, US$ per capita
YesYesYesYesYesYesYesYesYes2. Existence of a system for recovering the costs of drugs dispensed in MOH health facilities
N/A0%N/AN/A3. % of patients who pay a charge for drugs they receive in MOH health facilities4%12%3%15%15%8%14%6%4. % of total government recurrent budget used for MOH
6%8%16%26%4%1%No budget2%5. % of total MOH recurrent budget allocated to pharmaceuticals
All dollar amounts are in U.S. dollars.N/A indicates that information was not available despite attempts to collect it.Blanks indicate that these indicators were not part of the original studies.Grey shading indicates that the indicator is new or has been changed since the assessment, as a result of field tests. For some indicators, data is available from information already collected.
(A) Nicaragua results are based on data collected for the USAID-funded Decentralized Health Services Project. They include two regional/intermediate medical stores and 20 health facilities. These results may or may not represent the country as a whole.(B) OECS is the Organization of Eastern Caribbean States. The countries studied included: Dominica, Grenada, Montserrat, St. Kitts and Nevis, St. Lucia, and St. Vincent and the Grenadines.(C) Ghana CMS purchases only; there were also substantial direct purchases by regional stores and health facilities.

TABLE 2: PHARMACEUTICAL INDICATORS SET: COMPARISON OF SELECTED COUNTRIES
NEPALOECS (B)JAMAICANICARAGUA (A)GUATEMALAEL SALVADORECUADORECUADORGHANAMOZAMBIQUE1993199319921994199219931994199219931993
D. MINISTRY OF HEALTH PHARMACEUTICAL PROCUREMENTYesYesYesYesYesYesYesYesYesYes1. Existence of a policy limiting MOH pharmaceutical
procurement to drugs on NDFL N/A100%80%27%80%<50%<50% N/A100%2. % by value of MOH drugs purchased through a central procurement system63%147%145%164-371%114%161%79%76-205%3. % of average international price paid for last regular procurement of a set of
indicator drugs50%100%95%10%80%28%45%45% (D)91%4. % by value of MOH drugs purchased through competitive tender
E. MINISTRY OF HEALTH PHARMACEUTICAL LOGISTICS48%0%124%Tally:CMS1. Weighted average % of inventory variation for a set
8% 3% RMS of indicator drugs in MOH storage and health facilities8%11% HF
19% 5%0%3%15%159% Ledger:CMS5%5% RMS
38%16% HF Tally:CMS2. Average % of individual variation for a set of indicator
RMS drugs in MOH storage and health facilities HF
Ledger:CMS RMS HF
0% Tally:CMS3. Average % of stock records that corresponds with RMS physical counts for a set of indicator drugs HF in MOH storage and health facilities
14%Ledger:CMS23% RMS
HF79% 100%93%94%93%100%67% CMS4. Average % of a set of unexpired indicator drugs available 58% 89%81%72%87%87%80% RMS in MOH storage and health facilities
95%72%60%78%46%38%60%59% HF15% 27%32%23%79%8% CMS5. Average % of time out of stock for a set of indicator drugs
21%7% RMS in MOH storage and health facilities13%12%11% HF
All dollar amounts are in U.S. dollars.N/A indicates that information was not available despite attempts to collect it.Blanks indicate that these indicators were not part of the original studies.Grey shading indicates that the indicator is new or has been changed since the assessment, as a result of field tests. For some indicators, data is available from information already collected.
(D) 87% of the Ghana central procurement was done competitively; about 52% of drugs purchased by regional stores came through the central agency. Thus, 45% of the MOH drugs were purchased competitively.

TABLE 2: PHARMACEUTICAL INDICATORS SET: COMPARISON OF SELECTED COUNTRIES
NEPALOECS (B)JAMAICANICARAGUA (A)GUATEMALAEL SALVADORECUADORECUADORGHANAMOZAMBIQUE1993199319921994199219931994199219931993
INRUD Avg. (E)F. PATIENT ACCESS AND DRUG UTILIZATION15,6003,9455,8558,6228,52914,4306,3076,31035,25313,7981. Population per functional MOH health facility that dispenses drugs
2. Population per licensed pharmacist or pharmacy technician in the public sector3. Population per authorized prescriber in the public sector
2.12.12.02.42.11.42.22.01.34.32.44. Average # of drugs prescribed per curative outpatient encounter in MOH health facilities
67%44%49%40%86%71%72%39%37%59%99%5. % of drugs prescribed by generic name in MOH health facilities6. % of drugs prescribed from the NDFL in MOH health facilities
25%5%2%4%10%13%7%19%17%56%20%7. % of outpatients prescribed injections at MOH health facilities43%43%39%30%34%27%32%42%27%47%52%8. % of outpatients prescribed antibiotics at MOH health facilities77%83%84%92%61%86%77%9. % of prescribed drugs presented for dispensing that are actually dispensed
in MOH health facilities
G. PRODUCT QUALITY ASSURANCE1. MOH drug product quality laboratory tests during the past year:
N/A430N/AN/A N/A<10 N/A (a) number of drug products tested960N/A03,042N/AN/AN/AN/A (b) total number of drug product quality tests performedN/ANoNoNoNoYesYesNo2. Use of WHO Certification Scheme
3. Existence of formal systems for reporting:NoneFunctionalNoneNoneLimitedNoneNoneNoneNoneNone (a) product quality complaintsNoYesNoNoYesYesNoNoNo (b) adverse drug reactions (ADRs)
H. PRIVATE SECTOR PHARMACEUTICAL ACTIVITY8,1789,7204,8054,8353,5693,4193,438285,1561. Population per licensed private sector drug retail outlet
1 Grenada inspect. (F)63947no inspectors13262192. Number of licensed or registered drug retail outlets per government drug inspector3. %s of drug manufacturers, distributors, and drug retail outlets inspected during a one-year period
N/A$10.29$10.98$11.09$18.98$12.84N/A$ 0.084. Total value of private sector retail pharmaceutical sales, US$ per capitaN/A$12.27$14.91$16.05$19.23$12.93N/A$ 0.855. Combined value of public sector pharmaceutical expenditures & private sector retail sales, US$ per capita
7%0%15-20%71%50%50%70%1%6. % of products on NDFL which are currently manufactured or co-manufactured within the country7. Average of median private sector drug retail prices as a % of MOH acquisition prices for a set of indicator drugs
NoYesYesYesYesNo8. Existence of price controls for drugs in the private sectorN/A100%100%95%100%85%9. % of licensed drug retail outlets where an antibiotic was available
without a prescription
All dollar amounts are in U.S. dollars.N/A indicates that information was not available despite attempts to collect it.Blanks indicate that these indicators were not part of the original studies.Grey shading indicates that the indicator is new or has been changed since the assessment, as a result of field tests. For some indicators, data is available from information already collected.
(E) INRUD Average is based on data collected by the International Network for Rational Use of Drugs in eleven countries from 1989 to 1992.(F) Grenada has one inspector. The other OECS countries do not have any inspectors.

About the Indicators Description Format 15
II. INDICATORS DESCRIPTION FORMAT
Chapter 3 presents detailed descriptions of each of the 46 proposed indicators, grouped under the eight topicsidentified in chapter 1. Each description follows exactly the same format, which is summarized below.
Indicator data can be collected at three different levels of the health care system. Each indicator in thedescriptions that follow is coded according to the level at which it is measured, with the code appearing afterthe indicator title. The level codes used are:
C Central level - under direct supervision of the central governmentR Regional or district level - acts as the intermediary; provides supplies to the health
facilities and not directly to patientsF Health facility level - provides direct care to the patient population
Indicator Name: The name of the indicator along with the different system levels that may be examined(for example, C/R/F signals that the indicator may be applied at the central, regional andhealth facility levels).
Rationale: The reason that the indicator is important.
Definition: The meaning of the indicator, and the terms used to describe this indicator.
Data Collection: The most likely source(s) of information are summarized in a table indicating where thedata are to be collected, who to ask for assistance, and what documents and records toreview.
Brief discussions of methods and issues related to data collection.
Citations of the data collection forms to be used, if any. Data for 18 indicators arecollected using eight different forms. There is a discussion of how to develop therequired forms in chapter 4, and examples given in Annex C.
Computation &Example: Computations, if any, which are needed, accompanied by an example using illustrative
data.
Presentation: Brief example of how results may be presented.
Notes: Suggestions for additional information or discussion required to put the indicator inproper context, or to provide more detail.

III. DETAILED DESCRIPTIONS OF THE INDICATORS
A. Policy, Legislation and Regulation
A.1 Existence of a national drug policy approved by the government (C)*
Rationale: National drug legislation should be a guide to action in three areas: providing qualitypharmaceuticals to the public, regulating control of pharmaceuticals, and supportingcost-effective management. To be effective, health policies should be based on reliableinformation. When approved by the appropriate authorities, the government explicitlycommits itself to implement and enforce the policy. The health needs and priorities ofthe population change; therefore, policies need to be reviewed to ensure that theyrespond to changing needs. This indicator will assess the existence or absence of adocument containing the national drug policy (NDP), as recommended by WHO. This isa measure of the government's political commitment to improving the pharmaceuticalmanagement in both the public and private sectors.
Definition: A national drug policy is a written document, officially approved by the nationalgovernment, and used as the basis for current policy in the pharmaceutical sector. It hasguidelines pertaining to three areas:
! Control of import, export, manufacture, and pricing of drugs, and of distribution,supply, storage and sale
! Authority for regulation of labelling, information and advertising, drug registration,scheduling of controlled substances, imposition of fees and price controls
! Drug control administration: organization and function, prescribing and dispensingrestrictions, mechanisms of appeals against decisions
Data Collection:
Where to go Who to ask What to get
MOH Senior administrative official, Chief Document(s) containing thePharmacist National Drug Policy
Health Policy and/or Planning Officer in chargeOffice
Drug Regulatory Authority Officer in charge of registry
Central Government Registry or Officer in chargeNational Archives
Government official newspaper or Information Officer Record of published disseminationgazette of the NDP
This national drug policy should be identified through interviews with key officials and asearch of records. A copy should be made available to the assessment team.
See page 15 for description of codes.*

18 Rapid Pharmaceutical Management Assessment
Computation &Example: Record the existence of a national drug policy according to the following categories:
! Yes, WHO, if a national drug policy along WHO guidelines exists (include yearapproved or revised)
! Yes, not WHO, if a national drug policy exists, but does not follow WHO guidelines(include year approved or revised)
! In process, if a WHO-style national drug policy is in the process of development(include expected date of completion)
! No, if there is no national drug policy
Presentation: In country X, the national drug policy, which follows WHO guidelines, is describedwithin the "Política Nacional del Sector Salud," approved by the National HealthCouncil in 1988 and revised in October 1990. Thus country X is rated yes, WHO. Thepolicy addresses issues regarding the supply of drugs and the control of importation andlocal manufacturing, but does not include the registration of drugs for sale in the country.A copy of the policy is attached in the annex.
Notes: The ideal way to present data for indicators such as this one is to record the rating plusannotation, such as dates. For example: Yes WHO, 1989. However, for relativelycomplex tables which compare data from several countries, such as Table 2 (page 12),this would result in a visually crowded presentation that would be difficult to read. Insuch cases it is best to present just the rating. When presenting data for just one country,however, it is more feasible to present both rating and annotation.

Detailed Descriptions of the Indicators 19
A.2 Existence of comprehensive drug control legislation, regulations and enforcement agencies (C)
Rationale: Drug control legislation and regulations, and functioning agencies that enforce them, aremeasures of a government's capacity to implement beneficial policies and practices inpharmaceutical management. If a government does not allocate financial resources orstaff to the agencies charged with enforcing legislation and regulation, this suggests asituation where plans for pharmaceutical improvement will exist on paper but are notimplemented in reality.
Definition: Comprehensive drug control legislation is defined as written, government-approvedlegislation and regulation applying to: drug manufacturing, registration, licensing,distribution, prescribing, and sales practices, as well as regulations assigning officialresponsibility for enforcement of these rules. A functioning drug regulation enforcementagency is one that has sufficient staff and funding to carry out policy mandates. Reportsof its activities should be available, and discussions with its staff will indicate the extentof their activities.
Data Collection:
Where to go Who to ask What to get
MOH Pharmaceutical Services Legislation and regulationDirector/Chief/Secretary documents, name of agency/persons
in charge of enforcing them Drug Regulatory Authority Officer in charge of registry
Ministry of Industry Officer in charge of importation and Legislation documents, registers,control, registry of retail pharmacies, and reports of inspectionsand of protection of local industry
Pharmacists Association and Association Executive, Director or Verification of awareness of drugPharmacy Owners Association Secretary control legislation and compliance
Member pharmacists with the laws
Through document review and interviews with the Chief Pharmacist in the MOH, theHead of the Drug Regulatory Authority, or other similar agency, determine if legislationexists in areas listed below, and which agency has been assigned responsibility forenforcing these regulations. If possible, check with the pharmacy association aboutawareness of and enforcement of these laws.
Computation &Example: Record the existence of drug control legislation, regulations and enforcement agencies
for drug manufacturing, drug registration, drug distribution, authorization to prescribedrugs, authorization to sell drugs and drug marketing and promotion as follows:
! Yes, if drug control legislation, regulations and enforcement agencies all exist (includerelevant dates and titles of legislation, regulations or agency names)
! Partial, if some of these elements are in place but others are not! No, if there is no drug control legislation, regulation, or enforcement agency

20 Rapid Pharmaceutical Management Assessment
Presentation: In country A, the existence of components of drug control legislation was asfollows:
Legislative Area Legislation in Place Enforcing Agency in Place
Drug manufacturing Yes, Food & Drug Act, 1989 Yes, Pharmaceutical Supply Division, MOH (PSD/MOH)
Drug registration Yes, Food & Drug Act, 1989 Yes, PSD/MOH
Drug distribution Yes, Food & Drug Act, 1989 Yes, PSD/MOH
Authorization to prescribe drugs Yes, Medicines Act, 1989 Yes, National Medical Association
Authorization to sell drugs Yes, Medicines Act, 1989 Yes, National Pharmacy Council
Drug marketing and promotion Yes, Medicines Act, 1989 YES, PSD/MOH

Detailed Descriptions of the Indicators 21
A.3 Percentage of unregistered drug products in a sample of private sector drug retail outlets (C)
Rationale: The percentage of unregistered drugs available for sale is a measure of the degree towhich a government enforces its drug control policies and protects its people fromproducts of uncertified quality and effect. High percentages of unregistered productsindicate a regulatory agency that does not function effectively. This may be due to suchfactors as insufficiency of staff, financial resources or political will.
Definition: This indicator measures how completely drug registration regulations are beingimplemented. A product is considered officially registered when the drug is listed on anofficial register of products approved for sale or distribution in the country. Drugs notlisted on this official register are considered to be unregistered. The indicator applies toall pharmaceutical drug products identified in national legislation as requiringregistration, both legend (prescription required) and non-legend. Products classified asfoodstuffs, diagnostics and medical supplies are usually excluded. Vitamins may or maynot be included as pharmaceutical drug products.
Note: If drug registration is not required by law, this indicator is not relevant.
Data Collection:
Where to go Who to ask What to get
MOH Pharmaceutical Services Director/ List of registered drugs, how oftenChief Pharmacist it is updated, purged, date of last
entry, waiting list to be registered
Drug Regulatory Authority Drug Registration Inspector Review of drug registrationinformation system, reports of saleof unregistered drugs, list ofregistered drugs
Private drug retail outlets Pharmacist/Dispenser Check products on shelf for numberof unregistered drugs out of 200selected brand names
Select a sample of 20 retail drug sales outlets. At each site select from the shelves 10products, and record the complete name (both brand and generic), and name ofmanufacturer and/or supplier listed on the product label. If the law requires a productlicense number on the package, record this number from sample products. This gives atotal sample of 200 products.
If working with more than one data collector, duplication can be avoided by assigningeach data collector an exclusive range of letters of the alphabet, with instructions toselect products within the assigned range. For example, if there are three data collectors(Joe, Mary, and Bob), then Joe selects only products starting with the letters A-H, Maryselects products starting with the letters I-Q, and Bob selects products starting withletters R-Z. Prior to the start of the assessment, all the data collectors should beinstructed to carry out this part of the work at the same time.

22 Rapid Pharmaceutical Management Assessment
See the "Drug Registration Data Form" in Annex C, page 145.
Computation &Example: Compare the sample of 200 product names collected with the most current list or
database of registered products. Check to see if any of the names in the sample are notregistered. Record the number of unregistered products. Compute the percentage ofunregistered sample products by dividing the number of unregistered products by thenumber of products sampled; multiply this quotient by 100 to obtain the percentage.
% of Unregistered = Number of Unregistered Drug Products x 100Drug Products Number of Drug Products Sampled
% of Unregistered = 14 x 100 = 7% Drug Products 200
Presentation: In country A, 7% of the drug products, or 14 out of a sample of 200, selected during July1993 were found to be unregistered.

Detailed Descriptions of the Indicators 23
A.4 Type of drug registration information system (C)
Rationale: The type and characteristics of the drug registration system a country has in place is ameasure of the government's ability to collect and retrieve information on drugregistration and use it to monitor and evaluate the degree to which policies andregulations are enforced. Computerized systems, when functional, are far more efficientin organizing and recovering information than manual systems. The degree of usefulnessof the registration system is measured in terms of the speed, type and amount ofinformation that it can generate to support decision-making and action.
Definition: A drug registration system should record pharmaceutical product information suppliedfor registration, including the name and contact information of the company whichregistered the drug, the name of the manufacturing company (if different from thecompany registering), the country where the product was manufactured, when it wasregistered, and complete product description (which includes therapeutic effect, dosage,side effects, and shelf life). A drug registration system should not be static.Manufacturers and distributors should periodically register their drugs; therefore, regularreviews ensure that drug information is up-to-date.
Note: If drug registration is not required by law, this indicator is not relevant.
Data Collection:
Where to go Who to ask What to get
MOH Pharmaceutical Services A demonstration of how theDirector/Chief/Secretary registration system works,
information (brand names, strengthsand dosages, and companies thatregistered the drugs) about two orthree common drugs selected byINN or generic name
Drug Regulatory Authority Officer in charge of registry
Ministry of Industry Officer in charge of importation and Description of registration systemcontrol, and protection of localindustry
Interview personnel who work directly with the drug registration system. Ask them toshow how the system works. To determine whether the system is manual orcomputerized, ask the following questions for two or three common drug products:
! How many manufacturers or suppliers have registered the drug under the genericname or a brand name?
! What are the strengths and dosage forms available?! Which companies have registered the drug?

24 Rapid Pharmaceutical Management Assessment
Watch to see if this information is obtained through consultation of files and ledgers(indicating a manual system) or through use of a computer. In some cases, the respondent may consult both manual files and a computerized data base in order toanswer the questions; this is termed a mixed system.
Computation &Example: Describe the drug registration system as follows:
! Manual (include date established)! Computerized (include date established)! Mixed (include dates for establishment of the manual system, and introduction of
computerized elements)! None, if no system is established
Presentation: In country A, the drug registration system is fully computerized. The system wasestablished in 1989. The primary source document is the "Registration ApplicationForm" submitted by the party wishing to register the product. One staff member entersthe information from approved applications into the system. The system is menu-drivenand designed to produce reports by a range of variables including brand and genericnames, number of active ingredients, dosage forms, routes of administration,manufacturers and country of origin.

Detailed Descriptions of the Indicators 25
A.5 Number of drugs registered (C)
Rationale: The number of drugs registered is a rough measure of the functionality of a drugregistration system and the degree to which the regulatory authority enforces drugcontrol regulations. A relatively large number of registered products (in excess of10,000) may indicate that (a) there is no effective effort to make sure only safe andeffective products are registered, (b) products are not licensed for a specific time period,and in fact, many of the registered products may not really be marketed, or (c) the systemis not being kept up-to-date, and products with expired licenses are not being purgedfrom the records.
Definition: A drug registration system, either manual or computerized, should be able to produce anaccurate figure for the total number of drugs registered for import and sale in a country.In order to usefully interpret this indicator it is necessary to gather backgroundinformation on the contents of drug policies and regulations, as well as the degree towhich staff are able to keep the registration information system current and up-to-date.
Data Collection:
Where to go Who to ask What to get
MOH Pharmaceutical Services Determine terms of registration,Director/Chief/Secretary number of drugs registered,
frequency of license checks
Drug Regulatory Authority Officer in charge of registry Number of registered drugs, date oflast check, number of drugs delisted
Ministry of Industry Officer in charge of importation and Number of patented or registeredcontrol and of protection of local drugs, duration of registrationindustry
The information for this indicator may be collected at the time when interviews are heldto determine the type of drug registration information system. Ask for the total numberof drugs registered for sale in the country, and verify the source of information and themethod of calculating the number of registered products.
Computation &Example: Record the number of registered drugs provided by drug registration staff, obtained from
the registration information system or other sources, as well as the source itself.
Presentation: In country A, there are 7,006 registered products, of which 5,898 are brand named and1,108 are generically named, according to a computerized report produced by staff in thedrug registration process upon request. Registration is renewed every five years. If theregistration is not renewed, the product is delisted and manufacturer, health facilities andretailers are advised accordingly. Registration checks for expiry are carried out monthly.

26 Rapid Pharmaceutical Management Assessment
A.6 Law permitting generic substitution by pharmacists (C)
Rationale: A generic product is any drug product unprotected by patent. Any manufacturer istherefore entitled to produce it. In the marketplace, drug products sold under genericname are almost always less expensive than brand name products. Generic substitutionis the dispensing of a product, with the same active ingredients(s) in the same dosageform and strength, in place of the drug that is prescribed by brand name. The existenceof a law or regulation that allows pharmacists to make generic substitutions is a meansof promoting the use of relatively low cost, generically named products.
Definition: The written law or regulation must explicitly permit qualified pharmacists, or thosepracticing in designated settings, to substitute generic drug products for prescribed brandname products, only when the substituted drug is chemically equivalent to the oneprescribed.
Data Collection:
Where to go Who to ask What to get
MOH Pharmaceutical Services Document(s) that regulate genericDirector/Chief/Secretary prescribing or dispensing, views on
level of compliance with regulationBoard of Pharmacy Chairman
Pharmacy Owners Association, Executive Director, Secretary and/orPharmacists Association members
Use document review and interviews to determine the existence of a law or written regulation that allows generic drug products to be dispensed in place of brand nameproducts. Note which settings are covered by this law or regulation. This indicator scoresonly the existence of such law(s) or regulation(s), not whether substitution of generic forproprietary drugs is actually practiced. A copy of such a document should be madeavailable to the assessment team and/or as a reference in the MOH.
Computation &Example: Record the existence of a law permitting generic substitution by pharmacists as follows:
! Yes public and private, if a written law or regulation permitting generic substitutionin both the public and the private sector (pharmacies) exists (record name of law orregulation and year of enactment)
! Yes public, if a written law or regulation permitting generic substitution only inpublic settings exists (record name of law or regulation and year of enactment)
! Yes private, if a written law or regulation permitting generic substitution only in theprivate sector (pharmacies) exists (record name of law or regulation and year ofenactment)
! No, if such a law or regulation does not exist! Illegal, if generic substitution is explicitly prohibited in both public and private
sectors

Detailed Descriptions of the Indicators 27
Presentation: In country Y, Congressional Decree #85 was approved in 1991, amending the PublicHealth Code, and permitting pharmacists practicing in MOH facilities to substitutegeneric equivalents unless specifically indicated otherwise on the prescription.

28 Rapid Pharmaceutical Management Assessment
A.7 Practice of generic substitution (C/R/F)
Rationale: While in many countries generic substitution is not explicitly permitted by law, it doesoften occur. This indicator measures the practical acceptance of this important principleof cost reduction.
Definition: This indicator is defined as the prevalence of generic substitution practices, as describedby either: (a) reports on this behavior by informed sources, or (b) observation based onsimulated purchases.
Data Collection:
Where to go Who to ask What to get
MOH health facility Pharmacy Dispenser or Pharmacist Record of generic substitutionbehavior, or views on practice ofgeneric substitution; directobservation through simulatedpurchase
20 drug retail outlets Pharmacy Dispenser or Pharmacist
Data to substantiate this indicator may be qualitative, gathered through interviews withdispensers; or quantitative, gathered through simulated purchase surveys. The obviouslimitation of interviews is that most developing countries do not have laws explicitlypermitting generic substitution, and informants may perceive risk in acknowledging thepractice. The result will be under-reporting of this behavior. When interviews are used, itis suggested that questions be posed to both key informants at the central and regionallevels, and to dispensers at the health facility or retail pharmacy level. This will providea cross-check for assessing the probable validity of responses.
The most objective way to measure this indicator is to carry out a sample survey usingthe simulated purchase method. This is described in detail in chapter 4, section E,"Defining Approaches for Collecting Survey Data." To summarize, this requires a datacollector, who pretends to be a patient, to visit a sample of dispensing sites, present aprescription for a brand name product, and ask the dispenser if it is possible to substitutea cheaper product for the one prescribed. Willingness to do this may suggest prevalenceof generic substitution. In making this determination, however, only those cases whereinthe substituted item is chemically equivalent to the one prescribed should be counted.For cases in which a different chemical compound is substituted for the prescribedproduct, the term which applies is "therapeutic substitution."
The simulated purchase method is best suited for retail settings because the dispensersthere normally have several options for making substitutions, and this is often not thecase in MOH facilities. In practice, therefore, it may be most feasible to gather data inMOH settings through interview, and gather data in retail settings through simulatedpurchase.
See the "Generic Substitution and Sale of Antibiotics Data Form" in Annex C,page 149.

Detailed Descriptions of the Indicators 29
Computation &Example: This indicator is recorded as a percentage, calculated as the number of dispensers who
either: (a) state that they practice generic substitution; or (b) are observed to practicegeneric substitution, divided by the total number of dispensers in a sample, andmultiplied by 100.
! For data collected through interview, the formula is:
% of Dispensers Acknowledging = Number of Acknowledging Practice x 100 Generic Substitution Total Number Interviewed
% of Dispensers Acknowledging = 8 x 100 = 40%Generic Substitution 20
! For data collected through simulated purchase surveys, the formula is:
% of Dispensers Observed Practicing Generic Substitution =
Number Making a Generic Substitution x 100 Total Number Purchases
% of Dispensers Observed = 12 x 100 = 60%Practicing Generic Substitution 20
Presentation: In country C, 40%, or 8 dispensers interviewed at a sample of 20 MOH clinicalfacilities, stated that they make generic substitutions when filling prescriptions. At thesame time, 60%, or 12 drug sellers from a sample of 20 retail pharmacies, made validgeneric substitutions, for brand name products, while 15%, or 3 drug sellers, substitutednonequivalent products.

30 Rapid Pharmaceutical Management Assessment
B. Formulary/Essential Drugs List and Drug Information
B.1 Number of unique drug products on National Drug Formulary List (C)
Rationale: The number of unique drug products on a National Drug Formulary List (NDFL) orNational Essential Drugs List (NEDL) is one measure of a country's commitment torational resource allocation and to containing drug costs by using only essential and cost-effective products in the health care system. Sometimes, however, the term "EssentialDrugs List" refers only to a list of products authorized for use in primary health carefacilities. It is important, therefore, to understand how the terms related to essential druglists are used before assuming that they meet the test of being equivalent to an NDFL.
Definition: The term NDFL refers to a listing of all the unique drug products approved for medicalpractice in MOH facilities in a particular country. Sometimes the NDFL will appear in amanual which contains a description for each product on the list. In countries where theMOH uses the term "National Essential Drug List," this is often the equivalent of anNDFL.
Data Collection:
Where to go Who to ask What to get
MOH Director of Pharmaceutical and/or NDFL and/or NEDLMedical Supplies Services
Central Medical Stores Officer in charge/Director/Mgr.
Determine whether a NDFL/NEDL exists. If so, study investigators must obtain copiesto assess the number of drug products it contains. In order to make an accurateassessment, it is necessary to specify criteria for counting products containing the sameactive ingredient(s).
Products that are counted as the same item include:
! Brand name products that are chemically equivalent to generic products of the samestrength and dose form appearing on the list. For example, Bactrim 400/80 mg tabletsand co-trimoxazole 400/80 mg tablets are counted as the same product.
! Tablets and capsules of the same product appearing in the same strength. Forexample, ampicillin 500 mg tablets and ampicillin 500 mg capsules are counted asone product.
! Fixed combination drug products, no matter how many chemicals they contain. Forexample, a combination product, containing ergometrine and caffeine, is counted asone drug product.

Detailed Descriptions of the Indicators 31
Products that are counted as different items include:
! Different strengths of the same chemical entity. For example, tetracycline 250 mgcapsules and tetracycline 500 mg capsules are counted as two products.
! Dosage forms for different routes of administration. For example, tablets andcapsules (oral), suppositories (rectal), and injectable (IM/IV/SC) should each becounted as different drug products for a particular drug product.
! Different dosage forms for the same route of administration, such as tablets andsuspensions. For example, ampicillin 500 mg tablets and ampicillin 50 mg/mlsuspension are counted as two different drug products.
Computation &Example: The indicator is recorded as the total number of unique drug products on the National
Drug Formulary List. Record the year of the most recent edition of the published NDFL.If no NDFL exists, this indicator would be recorded as none.
Presentation: Country A has a National Drug Formulary List with a total of 230 unique drug productslisted. It was revised in 1993. There is also an Essential Drugs List for primary healthcare facilities with 35 unique drug products listed.

32 Rapid Pharmaceutical Management Assessment
B.2 Existence of an official manual, based on the National Drug Formulary List, providing basicdrug information to prescribers, revised and published within the last five years (C)
Rationale: The existence of a government produced or sanctioned manual with accurate, unbiased,and reasonably current information for prescribers concerning the drugs on the NationalDrug Formulary List is a measure of the official awareness of the need for druginformation to promote rational use of the drugs available.
Definition: To qualify as an official manual for purposes of this indicator, a document must beintended as a clinical reference for health care providers and present the followinginformation on drug products: pharmacology, chemical components, acceptedindications, contraindications, side effects, and recommended dosages.
Any document which provides the information summarized above for the sub-set ofdrugs authorized for use in a given type of clinical facility meets the definition of manualfor this indicator. Such documents might take the form of formulary manuals (FM),which use the drugs on the list as the point of departure, and are organized bytherapeutic categories of products. The manual could also be organized as standardtreatment guidelines (STG), which use health problems as the point of departure, anddiscuss the use of NDFL drugs to treat these problems.
In many countries, the drugs presented in the NDFL are classified according to level ofuse, with the greatest number of drugs authorized for use in hospitals with specialistphysicians and the least number authorized for use in facilities staffed by paramedicalworkers. Accordingly, there may be FMs or STGs which cover subsets of the overallNDFL and which are aimed at particular groups of health care providers, such asparamedical staff working in rural health posts.
Data Collection:
Where to go Who to ask What to get
MOH Director of Pharmaceutical and/or Most recent copy of manualMedical Supplies Services, Directorof Health Services
Such a manual must officially exist for this indicator to be meaningful. If so, obtain themost recent copy of the manual that has been prepared to provide impartial informationabout the drugs on the National Drug Formulary List. Evaluate whether or not theinformation in the manual meets all the following criteria, specified in the definitionabove:
! The document is intended as a clinical reference for health care providers
! The document presents therapeutic effects, chemical components, indications,contraindications, side effects, and recommended dosages for drug products

Detailed Descriptions of the Indicators 33
Computation &Example: Record the existence of an official manual, based on the NDFL, providing information to
prescribers, and revised within the last five years, as follows:
! Yes, if either a formulary manual, or standard treatment guidelines, which meet thedefinitions given above, exists and has been revised and published within the last fiveyears. Record the type of manual (FM or STG) and the year in which the manual waspublished.
! No, if:- A manual exists, but has not been revised within the past five years.- A manual is under production and incomplete.- A complete manual exists as an approved draft, but has not been
printed or circulated.
Presentation: In country Y, a national formulary manual exists; it was revised in June 1992. Themanual is intended for use by physicians, nurses and medical and nursing students. Itcontains information on indications, dosages and contraindications for 38 drugs. It lacksinformation on side effects or pediatric dosages.

34 Rapid Pharmaceutical Management Assessment
B.3 Percentage of MOH health facilities visited with the most current edition of an official manualbased on the National Drug Formulary List (F)
Rationale: The degree of distribution of a current edition of a manual providing unbiasedinformation on products of the NDFL is a measure of the effort actually being made toeffectively promote appropriate use of the drugs on the list.
Definition: This indicator measures the presence of the current edition of an official formularymanual in a given sample of health facilities.
Data Collection:
Where to go Who to ask What to get
20 MOH health facilities Officer in charge Most recent copy of manual
A manual, or manuals, covering products on the NDFL/NEDL, must exist in order forthis indicator to be meaningful. As noted in the discussion of indicator B.2, such adocument may take the form of either formulary manual or standard treatmentguidelines. Data for this indicator are collected by survey of a sample of 20 healthfacilities. At each site, staff are asked to produce a copy of a document appropriate totheir type of facility.
If a recent manual (revised within the past five years) does not exist (that is, the answerto indicator B.2 is No) then, if possible, record the presence of the most current editionof any manual which meets the definition.
See the "Inventory Data Form" in Annex C, page 153.
Computation &Example: This indicator is a percentage. It is computed as the number of facilities at which an
official manual is found, divided by the total number of facilities in the sample; multiplythis quotient by 100, to convert the decimal to a percentage.
% of Facilities with = Number of Facilities with Official Manual x 100Official Manual Number of Facilities in Sample
% of Facilities with = 5 x 100 = 25% Official Manual 20
Presentation: An indicator study carried out in country A revealed that in only 25% of health facilities,or five health facilities out of a sample of 20 surveyed, could staff produce a copy of the1990 edition of the Standard Treatment Guidelines.

Detailed Descriptions of the Indicators 35
B.4 Existence of drug information centers that provide unbiased and current information to publichealth decision makers, health care providers and consumers (C)
Rationale: The existence of one or more drug information centers that provide unbiased and currentinformation is a measure of the degree of access that exists to the information requiredfor rational selection, procurement, and use of drugs.
Definition: A drug information center should maintain and provide current information for policymakers, prescribers, pharmacists and consumers on such topics as: indications,contraindications, dosage, adverse reactions, costs and sources, storage requirements,drug quality/purity, and actions to take for inadvertent administration and overdoses.The center may or may not be government operated, but to qualify according to thisindicator, it should be freely accessible to health care providers of the system beingsurveyed.
In some countries, there are information centers which exist only to provide informationon drug availability, that is, where drugs may be purchased, or otherwise obtained. Theremay also be centers operated by groups or associations which are intended only for useby members. Cases such as these do not meet the definition for this indicator.
Data Collection:
Where to go Who to ask What to get
MOH Drug Regulatory Authority Director/Manager Information on the existence of theMOH Dept. of Pharmacy Services Chief Pharmacist center and a description according
to criteria listed belowMOH Information, Education, and Health EducatorCommunication Department
Schools of Medicine or Pharmacy Professors
Drug information center Director Information on services offered,utilization, resources, location,staffing and budget
Interview key informants to identify the drug information centers. Follow up with a briefvisit to each site. Collect the following information:
! Location of the center and its affiliation (i.e., university, MOH, etc.)! Principal users (i.e. Drug Regulatory Authority drug registration staff, hospital staff,
medical students or the general public)! Services offered and frequency of use! Documented demand/quantity of services provided! Types of equipment and information resources available, scope and currency! Numbers and qualifications of staff! Source of funding

36 Rapid Pharmaceutical Management Assessment
Computation &Example: This indicator is recorded as follows:
! Yes, if one or more drug information centers that meet the definition for this indicatorexist; record the number of such centers and describe any existing centers byproviding the information stated above
! No, if no drug information center exists
Presentation: In country Q, there is one drug information center. It is located in the College ofPharmacy, and serves the University, the MOH, and the Board of Pharmacy. The centerresponds to requests and irregularly publishes a newsletter on new drugs. This center isstaffed by one pharmacist, who has no formal training in providing drug information.The center has a typewriter but no computer. The information resources consist oftwelve texts; the newest is five years old. Funds for the center are obtained from theMOH, the College of Pharmacy and WHO. Funds for resource acquisition are budgeted,but never spent. No records are kept to document the numbers and types of inquiriesreceived.

Detailed Descriptions of the Indicators 37
C. Ministry of Health Budget and Finance
C.1 MOH budget or expenditures on pharmaceuticals, US$ per capita (C)
Rationale: The MOH's per capita budget or expenditures on drugs is a measure of the adequacy offinancing for pharmaceuticals in the public sector. Government financing in manydeveloping countries has decreased in recent years due to inflation and increase inpopulation.
Definition: MOH per capita pharmaceutical expenditures are defined as the total amount of money(in US$ at the current rate of exchange) spent on pharmaceuticals by all MOH sources(national, regional and local budgets combined) for the most recent financial year, perindividual in the population. MOH budget is defined as the budget for pharmaceuticalpurchases which was approved, not the requested budget. In many countries, only theapproved budget figures will be readily available, but whenever possible, it is preferableto use expenditure data for calculating this indicator.
Data Collection:
Where to go Who to ask What to get
MOH/MOF Budget Director, Health Planner Budget and/or expenditures bybudget category for most recentfinancial year(s), World Bankreports
Donors and NGOs Health Financing Specialist,Logistics Specialist
Bureau of Statistics Census Director Most recent population censusfigure, population projections forintercensal period
In most countries, the Ministry of Finance (MOF) publishes an annual report on budgetsand expenditures. This source of information should be combined with interviews withrelevant government officials and examination of historical documents to obtain acomplete-as-possible accounting of total budget or expenditures on pharmaceuticals inthe previous fiscal year. Valuation of donated products should be included, if their valuewas accounted for in the forward planning budget. This estimate must include budget orexpenditures from all public sources at the central, regional, and local levels. Finally,obtain a reasonably reliable estimate of the current national population from the Bureauof Statistics or some other official source.
In collecting this data, keep the following points in mind:
! Although the indicator is for the budget or expenditures for the most recent financialyear, if possible, the data should be collected for the preceding three to five years.This would give an idea of trends in financing.
! In some countries, there are as many as three budget figures: amount requested,amount sent forward, and amount approved. It is crucial to use the amount approvedrather than either of the other two amounts.

38 Rapid Pharmaceutical Management Assessment
! The value of donated drugs should be included in the indicator only if the value ofdonations was included as a line item in forward budget planning or actualexpenditures. The practice on this point varies from country to country.
! If reliable current population estimates are not available locally, there are two options.The first is to obtain the last census figure, note the date, and calculate an estimatedcurrent population based on estimated annual population growth rates. The secondoption is to use the figures from the latest edition of the World Bank WorldDevelopment Report.
Computation &Example: The indicator is computed by dividing the total value of the MOH drug budget or
expenditures for the most recent fiscal year (expressed in US$ at the current rate ofexchange) by the national population. Be sure to stipulate whether the value representsactual expenditure or budget, and record the fiscal year on which the data are based.
MOH DrugBudget = Total of MOH Drug BudgetPer Capita National Population
MOH DrugExpenditure = Total of MOH Drug ExpenditurePer Capita National Population
MOH DrugExpenditure = $2,850,000 = $0.77 Per Capita 3,694,000
Presentation: In country A, both budget and actual expenditure data for the most recent financial yearwere available. These data showed a pharmaceutical budget for fiscal year 1993 of$3,000,000, with actual expenditures being $2,850,000. In the same year, the MOHreceived $1,050,000 worth of donated drugs, including $500,000 from UNICEF,$500,000 from USAID and $50,000 from WHO. In accordance with local accountingnorms, none of the donated drugs figured in budget projections or expenditure estimates.
The most current population estimate was from a census taken in 1990, which gave thefigure 3,430,000. The MOH Family Planning Division estimates annual populationgrowth at 2.5%. This gives an estimated population of 3,694,000 in 1993.
Taking into account the norms listed in the Data Collection section, the correct financialfigure to use is $2,850,000 (that is, expenditure is preferred to budget, and donations areexcluded), and the MOH drug expenditure per capita was US$ 0.77 in 1993.

Detailed Descriptions of the Indicators 39
C.2 Existence of a system for recovering the cost of drugs dispensed in MOH health facilities (C)
Rationale: In most countries the funds available through government budgets and donors are notsufficient to meet rising demands for drugs. The existence of a system (or systems) torecover costs of drugs from consumers is a measure of a country's recognition thatregular budgetary means require supplementation in order to bridge the gap betweensupply and demand.
Definition: For purposes of this indicator, a cost recovery system is defined as any system whichsupports drug supply costs by charging patients for all or part of the drugs dispensed tothem. Included within this definition are:
! Systems that charge patients prices intended to recover 100% of acquisition, storage,distribution and dispensing costs
! Systems that charge patients prices intended to recover only part of these cost, forexample 50%; such systems are sometimes called cost sharing systems
! Systems that charge patients a flat fee, regardless of the types of drugs dispensed ortheir costs, when all revenues are allocated to buying new drugs; these systems arealso sometimes called cost sharing systems
Not included in the definition of pharmaceutical cost recovery, for purposes of thisindicator, are schemes that charge patients for medical consultations, with no stipulationthat the revenues be used for buying new drugs. This exclusion holds even in caseswhere some of the revenues may be used to purchase drugs.
Data Collection:
Where to go Who to ask What to get
MOH Health Finance Director Document that describes the costrecovery program, its objectives,management and accountingsystems, etc.
MOF Revenue Collection/ Planning Records of cost recovery revenuesDirector collected by MOH facilities
NGO/Donors Director or Project Director Cost recovery program activities,plan and records
Gather information for verifying the existence of cost recovery systems throughinterviews with key informants. In addition, attempt to gather a range of backgroundinformation as available:
! Coverage of the cost recovery system, expressed as the percentage of all facilitieswherein cost recovery takes place
! Financial objectives, such as full or partial cost recovery, recovery of replacementcost, etc.
! Percentage of costs actually recovered! Types of fee charged and basis for fee scheme

40 Rapid Pharmaceutical Management Assessment
! Exemption systems which excuse indigent or chronically ill patients from all or partof customary charges
! The year(s) for which all such data collected apply! Management system and accountability for fees collected: records, reports, joint
facility-community bank accounts, etc.
Computation &Example: Record this indicator as follows:
! Yes, if one or more cost recovery systems exits, meeting the definitions listed above! No, if at least one scheme does not exist
Presentation: In country A, cost recovery schemes operate in all of the MOH's 36 national and regionalhospitals, but not in the 122 health centers. There is no documentation of financialobjectives concerning average percentage of costs to be recovered, but it is clear that theobjective is partial cost recovery, or cost sharing, and not total cost recovery.
Patients are charged flat fees for each different drug product that they receive, but thereis a two-tiered fee structure: 10 pesos for ordinary drugs and 20 pesos for expensivedrugs. No figures are available for the total amounts of money collected nationally. Datafor the Western Region indicate that for fiscal year 1992, total revenues from drug salesat the six hospitals were P 9,000,000. This represents 25% of the cost of the region'shospital drug purchases, and 15% of MOH's total drug purchases for the region.
Notes: This indicator has been reduced in scope as a result of field tests of this manual.Originally, the indicator covered such points as average prices charged and revenuescollected as a percentage of MOH drug expenditures. In practice, these data weredifficult to obtain in most settings without major study efforts, which were not feasiblein the context of the overall indicator assessment. Nevertheless, it is strongly felt thatattempts should be made to obtain the types of information listed above, as part offilling in the background for this indicator. Remember: This indicator only measures acountry's recognition of the problem of inadequate finances for drug supply. By itself, itdoes not tell how active are that country's attempts at using cost recovery to solve theproblem. The more background data that is collected, the more usefully this indicator canbe interpreted.
Although the indicator does not measure cost recovery systems which are not related todrugs, it is useful to note in the report information on other types of cost sharing/costrecovery programs, including the nature of the charge, amounts charged, scope of theprogram and results achieved.

Detailed Descriptions of the Indicators 41
C.3 Percentage of patients who pay a charge for drugs they receive in MOH health facilities (F)
Rationale: There is often substantial variation between stated cost recovery policies and actualpractice. Ministries of Health may have stated policies of charging for drugs, but inpractice do not enforce these policies in health care facilities. Taking a measure of thepercentage of patients who actually make some payment gives an indication of whethercost recovery systems exist on paper only, or whether they operate in practice, and howmuch is actually recovered. This will determine the success of the cost recovery policy inachieving its objectives.
Definition: The definition of patient who pays a charge is any observed patient encounter in whichthe patient pays a charge (no matter how large or small) specifically related to drugswhich are dispensed.
Data Collection:
Where to go Who to ask What to get
20 MOH health facilities Pharmacist/Dispenser Number of patients that paid acharge out of 30 observations orrecords
Data for this indicator are collected retrospectively, from dispensing or accountingrecords, or prospectively as follows: In a sample of 20 health facilities, review records orobserve drug dispensing for 30 patients at each facility. This gives a sample of 600contacts. At each site, record the number of patients who pay a charge explicitly for thedrugs they receive, and the number that do not. If a fee is paid for medical services,which includes consultation fees as well as drugs, then these data should not be used forthis indicator.
See the "Charge for Drugs Tally Form" in Annex C, page 157.
Computation &Example: The percentage of patients paying a charge is calculated by dividing the total number of
patients paying a charge (for pharmaceuticals only), by the total number of patientsobserved, and multiplying by 100.
% of Patients who Pay = Number of Patients Paying a Charge for Drugs x 100A Charge For Drugs Number of Patients Observed
% of Patients Who Pay = 252 x 100 = 42% A Charge for Drugs 600
Record the number of health facilities examined and the time period in which the datawere collected.

42 Rapid Pharmaceutical Management Assessment
Presentation: In country Q, drug dispensing was observed at a sample of 20 health care facilities. Outof 600 patients observed, 42% paid a charge for the drugs they received duringNovember 1991.

Detailed Descriptions of the Indicators 43
C.4 Percentage of total government recurrent budget used for Ministry of Health (C)
Rationale: The percentage of total government recurrent budget used for the Ministry of Health is ameasure of the relative priority which the government gives to public health. The MOHpercentage depends on the government's policies in other sectors, such as education,social services, industry subsidies, defense forces, macroeconomic adjustment policies,debt servicing, etc. The impact of decisions in these other sectors will be reflected in theoverall state of health of the population as a consequence of budgetary cuts. Trends inthe previous years will help show whether or not the health sector has been favored bygovernmental policies.
Definition: The recurrent budget is the amount of money allocated for routine operating costs. Itnormally excludes capital costs (and in some cases, excludes donations). This indicatoris expressed as the percentage of the total government recurrent budget which isprovided as a recurrent budget to the MOH, in the most recent fiscal year for whichinformation is available.
Data Collection:
Where to go Who to ask What to get
MOH Permanent Secretary, Health Budget and expenditure reports forFinance Director, Chief most recent financial year(s),Administrative Officer a copy of the most recent
budget/expenditure booksMOF Planning Director
Normally these data are collected from the most recent report on recurrent expenditurespublished by the Ministry of Finance. If such a report has not been published, contactsenior officials at the MOH and/or the Ministry of Finance to obtain necessaryinformation. If the information is only estimated, stipulate this when recording the data.Be sure to avoid confusion between amounts requested and amounts approved. Theamount approved is the relevant number. If information is available for actualexpenditures, record information for both allocated budget and expenditures. Attempt todetermine whether or not debt servicing is included in the budget figures being used. Ifso, this should be excluded before making calculations.
Computation &Example: The indicator is recorded as a percentage, calculated as total Ministry of Health recurrent
budget divided by total government recurrent budget, and multiplied by 100.
% of Total GovernmentRecurrent Budget = Ministry of Health Recurrent Budget x 100for MOH Government Recurrent Budget
% of Total GovernmentRecurrent Budget = 8,190,000 x 100 = 6%for MOH 136,500,000

44 Rapid Pharmaceutical Management Assessment
Record the year on which data are based.
Presentation: In 1992, country A devoted 6.0% of its total recurrent budget to the Ministry of Health.

Detailed Descriptions of the Indicators 45
C.5 Percentage of total MOH recurrent budget allocated to pharmaceuticals (C)
Rationale: The percentage of total Ministry of Health recurrent budget used for pharmaceuticals is ameasure of the degree of priority given to meeting demand for drugs, and also measuresthe impact on the system of pharmaceutical expense.
Definition: The recurrent MOH budget has been defined in the previous indicator. The amount usedfor pharmaceuticals is that amount allocated for the purchase of pharmaceuticals in thesame budget year. As is the case with the previous indicator, actual expenditures arepreferable to budget allocations, if the information is available. It is important that allfigures used for deriving the indicator be of the same type, that is, either expenditure orbudget. The two should not be mixed within one calculation.
Data Collection:
Where to go Who to ask What to get
MOH Chief Administrative Officer, Pharmaceutical budget allocationPermanent Secretary, Planning and expenditures for most recentDirector, Finance Director, Director financial year(s)of Pharmaceutical and/or MedicalSupplies Service
MOF Planning Director
Normally, this data is collected from the most recent report on recurrent expenditureswhich is published by the Ministry of Finance. If such a report has not been published,contact senior officials at the MOH and/or the Ministry of Finance to obtain necessaryinformation. If the information is only estimated, stipulate this when recording the data.Be sure to avoid confusion between amounts requested and amounts approved. Theamount approved is the relevant number. If information is available for actualexpenditures, use this information for comparison with allocations. In some countries, itmay be difficult to quantify the drug budget or expenditures because expendable medicalsupplies and drugs are included together in the same figure. In such cases, the totalamount should be recorded, and the assessment team should obtain the most reliableestimates available concerning the relationship between drugs and other supplies. Thevalues of donated drugs should be excluded from this indicator, unless they are includedas line items in forward budget planning or actual expenditures.
Computation &Example: The indicator is recorded as a percentage, calculated as the MOH recurrent budget for
pharmaceuticals divided by total Ministry of Health Budget, and multiplied by 100.
% of MOH RecurrentBudget Used for = MOH Recurrent Budget Used for Pharmaceuticals x 100Pharmaceuticals Total MOH Recurrent Budget
% of MOH RecurrentBudget Used for = 2,850,000 x 100 = 35%

46 Rapid Pharmaceutical Management Assessment
Pharmaceuticals 8,190,000
Record the year on which data are based.
Presentation: In the 1993 fiscal year, country A devoted 35% of its Ministry of Health recurrentbudget to pharmaceuticals.

Detailed Descriptions of the Indicators 47
D. Ministry of Health Pharmaceutical Procurement
D.1 Existence of a policy limiting MOH pharmaceutical procurement to drugs on the National DrugFormulary List/National Essential Drugs List (C)
Rationale: The existence of a policy limiting MOH pharmaceutical procurement to products on theNDFL/NEDL is a measure of a country's recognition of the need to contain costs byrestricting supplies to those items that have been authorized.
Definition: A written official policy should explicitly restrict MOH procurement to items includedon the government-approved national drug list (NDFL/NEDL).
Data Collection:
Where to go Who to ask What to get
MOH Procurement Office Procurement Officer Copy of the written policy
CMS Chief of CMS
Obtain a copy of a written MOH procurement policy related to the restricted purchase ofproducts on the National Drug Formulary List. The indicator measures only whethersuch a policy exists, not whether it is actually followed.
Computation &Example: The indicator is recorded as follows:
! Yes, if only drugs on the NDFL/NEDL are eligible for MOH procurement! No, if an NDFL/NEDL does not exist, or if procurement is not restricted to drugs on
the list
Presentation: In country X, an NEDL exists, but the MOH has no requirement that procurements belimited to products on this list. Data show that in 1993 MOH expenditures on drugsfrom the NEDL accounted for 62% of total drug expenditures, while out-of-formularydrugs accounted for 38%.

48 Rapid Pharmaceutical Management Assessment
D.2 Percentage by value of MOH drugs purchased through a central procurement system (C)
Rationale: Centralized procurement systems, when operated efficiently, have significant potentialfor containing drug costs by taking advantage of competitive forces in the market and byachieving economies of scale. The presence of centralized procurement systems is ameasure of recognition of this potential.
Definition: The "central system" is an officially mandated procurement mechanism via a centralizedagency, authority, or ministry office.
Data Collection:
Where to go Who to ask What to get
MOH Procurement Office or other Procurement Officer Procurement reports for most recentgovernment or parastatal agency Tender Board Secretary financial year(s), invoices from(Disease Control Programs or Chief Pharmacist suppliers, tender documentsfacilities, Regional or Provincialgovernments)
Central Medical Stores Chief of CMS
Assess whether a centralized procurement system exists, and assess the approximatepercentage by value of MOH drugs procured via this system. Data are obtained fromprocurement records for the most recent year for which they are available. If data on totalprocurement are not reliable, or in situations where extensive local facility purchasesoccur, it may be necessary to rely on estimates gathered through interviews. It should bedocumented, however, when such a method is used. The following data are needed:
! Total value of drugs procured by or for MOH; if more than one agency or institutionpurchases drugs, provide separate value purchased by each facility or each type offacility
! Value of drugs purchased by central procurement system
If no central procurement system exists, the indicator should be scored as 0%.
Computation &Example: Record the percentage by value of drugs purchased through the central procurement
system, computed by dividing the monetary value of drugs centrally procured by thetotal monetary value of drugs purchased in the MOH, and multiplied by 100.
% by Value of MOH = Value of Drugs Centrally Procured x 100Drugs Purchased Total Value of Drugs Purchased by MOHthrough CentralProcurement System

Detailed Descriptions of the Indicators 49
% by Value of MOH = 2,280,000 x 100 = 80%Drugs Purchased 2,850,000through CentralProcurement System
Record the year on which data are based.
Presentation: In country A, central drug procurement is managed by the Central Medical Stores.National and regional hospitals also have separate budgets for emergency procurements.In 1992, 80% by value of total drug purchases was made centrally by the CMS, and atotal of 20% by the individual hospitals.
Notes: In some countries each state or region may have a separate central procurement system.In others, health facilities may purchase independently, but there may be a central grouppurchasing scheme serving one group of facilities. If there are significant variations inprocurement practices from region to region, or at different levels of the system, it isimportant to document these differences, and calculate estimated values for centralprocurement separately for the regions or facility types.

50 Rapid Pharmaceutical Management Assessment
D.3 Percentage of average international price paid for last regular procurement of a set of indicatordrugs (C/R/F)
Rationale: The cost of drugs procured as a percentage of average international prices is a measureof the efficiency of procurement systems. This indicator will help determine the potentialsavings that could be achieved if the procurement practices are improved, and in thisway support changes in the pharmaceutical supply system.
Definition: Average international price is the average free on board (FOB) price from a set ofinternational suppliers. One source of price information is the MSH International DrugPrice Indicator Guide. The last regular procurement price refers to the cost, insurance,freight (CIF) price paid during the last regular procurement.
Data Collection:
Where to go Who to ask What to get
MOH-Procurement Unit Officer in charge of pharmaceutical List of most recent prices paid for apurchases set of indicator drugs
Central Medical Store Manager or Reception Officer
Regional government Manageradministration or Medical Store
Health facilities Pharmacist or Procurement Officer Tender documents, supplierinvoices
A set of indicator drugs for which this indicator will be measured must be developed asone of the preparatory activities for the indicator study (see chapter 4, "Guidelines forStudy Design," section C, "Specifying a List of Indicator Drugs"). Examples of indicatordrug lists that have been used for assessments in different countries are found in AnnexB. Information on CIF prices paid by the MOH for the indicator drugs should apply tothe last regular procurement. Any more recent ad hoc or emergency procurements thatmay have taken place should be compared separately to international prices. The averageinternational prices for the indicator drugs may be determined by reference to averageinternational unit prices in the MSH International Drug Price Indicator Guide. The6
average price in this guide is FOB, and should be adjusted upward by 20% to reflectaverage shipping and insurance costs. Specify the source of international prices and theyear of both data sets. If all purchases are not done by one central agency, compileinformation separately by type of institution, and compute the percentage ofinternational price for each type of purchasing institution (e.g., Regional Medical Stores,hospitals, health centers, etc). Note the date of the most recent regular drug procurement.When making calculations, it may be necessary to convert prices paid in local currenciesinto U.S. dollars. It is important to use the exchange rates in effect at the time thepurchases were made, and to use the edition of the Price Guide which correspondswith the year in which purchases were made.
See the "International Price Comparison Form" in Annex C, page 173.

Detailed Descriptions of the Indicators 51
Computation &Example: The indicator should be presented as an average of the percentages of international
prices for the set of indicator drugs. If data are collected from different levels of thesystem, a separate average should be calculated for each level. The computation involvestwo steps:
! First, the percentages are calculated for each of the indicator drugs by dividing thepurchase cost of the comparison unit (e.g., tablet, milliliter, etc.) at the last regularprocurement by the average international price of that unit and multiplying the resultby 100.
% of Average = Comparison Unit Price x 100International Price Average International Unit Price
! Second, the average percentage for all indicator drugs is calculated by summing theirpercentages and dividing by the total number on the list.
Average % of All = Sum of Percentage of All Indicator Drugs Indicator Drugs Total Number of Indicator Drugs
For purposes of illustrating the computation of the result at the CMS, assume anindicator list of three products:
Product Comparison Unit Price International Unit Price*Adjusted Average
Tetracycline 250 MG CAP 0.0207 0.0163
ORS 200 ML PKT 0.0677 0.0578
Paracetamol SYR 24 MG/ML 0.0070 0.0051
1. The first step is to calculate the percentage for each product.
For tetracycline, the first product on the list, this is done as follows:
% of Average = 0.0207 x 100 = 127%International Price 0.0163
Using the data in the table, the percentages for ORS and paracetamol are calculated as117% and 137%, respectively.
2. Next, the average percentage for all three products is calculated as follows:
Average % of All = 127 + 117 + 137 = 127%Indicator Drugs 3
* The figures in this column have been adjusted to reflect estimated CIF prices.

52 Rapid Pharmaceutical Management Assessment
Presentation: In country C, comparisons of drug purchase prices with average international prices weremade at both the Central Medical Store and at a sample of one national and threeregional hospitals. In 1992 the CMS paid 127% of the average international price, whilethe hospitals paid 206%.
Notes: Where there is a wide range in the average percentages for a list of indicator drugs, thiscan be reflected in the report by also calculating the standard deviation from the meanfor the list. The standard deviation from the mean is a way of indicating an averageamount by which the individual percentages are different than the average percentages.All major computer spreadsheet programs have a function which automaticallycalculates standard deviation.

Detailed Descriptions of the Indicators 53
D.4 Percentage by value of MOH drugs purchased through competitive tender (C/R/F)
Rationale: Competitive tenders are among the best ways to minimize the costs of drug purchases.Even when central purchase mechanisms are in place, they may not result in economicalpurchases unless competitive tendering is used. The percentage of total purchases madeusing this method is a measure of commitment and ability to manage purchases in a costefficient way.
Definition: To be considered a formal competitive tender process, pharmaceuticals must bepurchased on the basis of sealed bids submitted in response to government requests tosupply drugs. The tender process may be open, such as international competitive bidding(ICB), or closed, and with or without pre-qualification of suppliers.
Data Collection:
Where to go Who to ask What to get
MOH-Procurement Unit Officer in charge of pharmaceutical Total value of drugs purchased,purchases total value of drugs purchased
through competitive tenderCentral Medical Store Manager or Procurement Officer
Health facilities (if procurement is Procurement Officer/Facilitydecentralized) accountant
For this indicator to be relevant, the MOH must use competitive tenders. Collect data onthe total value of all drugs purchased during the last fiscal year, and on the value ofdrugs purchased through formal competitive tenders. Information may be available froma central purchasing agency. As for D.2, if reliable data is not available, estimates maybe used, providing that the source and reliability of estimates are documented.
Computation &Example: The indicator is a percentage, calculated by dividing the total value of drugs purchased
through competitive tender (in the previous fiscal year) by the total value of all drugspurchased that year, and multiplying the result by 100.
% of Drugs Purchased = Total Value of Drugs Purchased through Competitive Tender x 100 through Competitive Total Value of All Drugs Purchased Tender
% of Drugs Purchased = $1,710,000 x 100 = 60% through Competitive $2,850,000 Tender
Presentation: In country A, in the Financial Year 1990/91, 60% of the drugs (by value) procured bythe MOH were purchased through competitive tender.
Notes: As for D.2, it may be necessary to compile percentages of competitive procurementseparately for different states, regions, or type of health facility.

54 Rapid Pharmaceutical Management Assessment
E. Ministry of Health Pharmaceutical Logistics
E.1 Weighted average percentage of inventory variation for a set of indicator drugs in MOHstorage and health facilities (C/R/F)
Rationale: Stock record keeping systems that are significantly inaccurate are of limited use formonitoring the status of inventory, estimating future needs, and for controlling leakageand wastage of stock. Weighted average percentage of inventory variation measures thedegree to which stock record keeping systems reflect the real status of drugs in stock.
Definition: The weighted average percentage of inventory variation is the weighted averagepercentage difference between recorded stock levels and actual physical counts for a setof indicator drugs. This is also known as average piece variation. As a measure, itindicates the overall correspondence between records and real stock levels.
Data Collection:
Where to go Who to ask What to get
Central Medical Store Inventory Officer/Storekeeper Most accurate records of currentstock levels for each indicator drug,issues and receipts not entered;method to record stocks; physicalcount of unexpired stock levels
Regional Medical Store Manager
20 MOH health facilities Dispenser/Pharmacist/Storekeeper
This indicator is based on the list of 25 to 50 indicator drugs used to treat commonhealth problems (see chapter 4 "Guidelines for Study Design," section C "Specifying aList of Indicator Drugs," and Annex B, which gives examples of indicator drug lists).Visit the CMS (and at least one regional store if they exist in this system), and a sampleof 20 health facilities. At each site, carry out the following procedure:
! Ask staff to produce the most accurate records of current stock level for each of theindicator drugs. Ask them to produce their files for any recent (i.e., within the pastmonth) issues or receipt vouchers which have not been entered in their stock levelrecords. If unentered issues and receipts can be adjusted on the spot, this should bedone, and the recorded totals should reflect the adjustment. If the records are badlybehind (e.g., several weeks or months of issues or receipts have not been entered), usethe actual recorded total, and make a note in the report that records are not current.
! Take note of the means used to produce these estimates (computerized system,manual ledgers, bin cards). If bin cards exist, and if they were not used to produce thebest estimates, obtain a second set of data from the bin cards. If there are both manualand computerized records, obtain data from both systems.
! Finally, carry out a physical count of the unexpired stock levels for these drugs, andrecord the number of units for each indicator drug in stock. The expired units shouldnot be counted.

Detailed Descriptions of the Indicators 55
It may be possible to collect three sets of data for a list of indicator drugs at each site in asample. These sets would include: physical count, stock levels noted in the computerizedrecords or manual ledgers, and stock levels taken by tally from bin cards. This meansthat this indicator is calculated twice, that is, one calculation based on comparison of thephysical count and computer/ledger results, and another based on physical count and thetally or bin card results. If either ledgers or bin cards do not exist, or if one of thesesystems is in total disarray, it may be possible to make only one comparison. If there isdifficulty in collecting data, the comparison between physical count and ledger resultsshould have priority.
For the most ambitious assessment, this indicator would be calculated for bothcomputerized stock records/ledgers and bin cards at the CMS, at the sample Regional orDistrict Medical Stores, and at a sample of health facilities. Whether this is possible forall of these sites, or just some of them, will depend on the state of the record keepingsystems. It is important, however, to record the following information for all datacollected and all indicators computed: the site visited, and which record keeping systemshave been assessed, that is, computerized systems, ledgers or bin cards.
See the "Inventory Data Form" in Annex C, page 153.
Computation &Example: To calculate the weighted average percentage of inventory variation, carry out the
following steps:
! First, write down the sum of the adjusted totals of all units of indicator drugs recordedin the computer/ledger and/or on the bin cards.
! Second, record the total of all units of indicator drugs verified by physical count.! Third, subtract the physical count from the recorded count, and remove any negative
signs, thereby creating an absolute value.! Fourth, divide the result by the total of the physical count, and multiply this quotient
by 100 to get the weighted average percentage difference.
Weighted Average = Recorded Count - Physical Count x 100% of Inventory Physical CountVariation

56 Rapid Pharmaceutical Management Assessment
For purposes of illustrating the computation of this indicator, assume an indicator druglist of three products:
Product Record PhysicalCount
Tetracycline 250 MG CAP 1000 900
ORS 200 ML PKT 400 450
Paracetamol SYR 100 ML BOT 350 100
Total 1750 1450
The weighted average percentage of inventory variation is calculated as follows:
1. Add up the total number of units for each product shown in the record:1000 + 400 + 350 = 1750
2. Add up the total number of units verified by physical count:900 + 450 + 100 = 1450
3. Subtract the physical count from the recorded amount:1750 - 1450 = 300
4. Calculate the weighted average percentage of inventory variation:
Weighted Average % = 300 x 100 = 21%of Inventory Variation 1450
Presentation: After adjusting for issues and receipts not yet entered in the records, at the CentralMedical Store in country B, the average percentage of inventory variation between thecomputerized record keeping system and the physical count was calculated to be 21%.

Detailed Descriptions of the Indicators 57
E.2 Average percentage of individual variation for a set of indicator drugs in MOH storage andhealth facilities (C/R/F)
Rationale: As noted in the previous indicator, stock record keeping systems that are significantlyinaccurate are of limited use for monitoring the status of inventory and for controllingleakage and wastage of stock. Average percentage of individual variation measures thedegree to which stock record keeping systems reflect the real status of drugs in stock. Asa measure, it indicates the magnitude of discrepancy between records and the real stocklevels of individual items.
Definition: The average percentage of individual variation is the weighted average of the absolutedifferences between recorded stock levels and physical counts for the same list ofindicator drugs.
Data Collection:
Where to go Who to ask What to get
Central Medical Store Inventory Officer/Storekeeper Most accurate records of currentstock levels for each indicator drug,issues and receipts not entered,method to record stocks, physicalcount of unexpired stock levels
Regional Medical Store Manager
20 MOH health facilities Dispenser/Pharmacist/Storekeeper
This indicator is based on the list of 25 to 50 indicator drugs used to treat commonhealth problems (see chapter 4 "Guidelines for Study Design," section C "Specifying aList of Indicator Drugs," and Annex B, which gives examples of indicator drug lists). Itis calculated based on the same data that was collected for the previous indicator, E.1.Use this data and proceed to calculate the weighted average percentage of individualvariation. As was the case with indicator E.1, if there are multiple record systems, theindicator should be calculated for all functioning systems. The data should be presentedin separate tables for each type of facility in the sample (CMS, RMS and peripheralhealth facilities).
See the "Inventory Data Form" in Annex C, page 153.
Computation &Example: To calculate the average percentage of individual variation, carry out the following
steps:
! For each drug on the indicator list, determine the absolute value of individualvariation, as follows:
Subtract the physical count from the recorded quantity (ledger or bin cards).Record that result as an absolute value by removing any negative signs. All resultsshould be expressed as positive numbers.
Absolute Value of = Recorded Quantity - Physical CountVariation

58 Rapid Pharmaceutical Management Assessment
! Calculate the percentage of variation for each indicator drug as follows:Divide the absolute variation by the recorded quantity, and multiply that quotient by100 to get the percentage of individual variation.
% of Individual = Absolute Value of Variation x 100 Variation Recorded Quantity
! Determine the average percentage of individual variations by summing all of thepercentages of individual variation and dividing by the total number of percentages ofvariation calculated.
Average % of = Sum of Percentages of Individual Variations Individual Total Number of Percentages CalculatedVariation
Once again, this indicator may be calculated for both computerized stock records/ledgersand bin cards at the CMS, at a sample of Regional or District Medical Stores, and at asample of health facilities. Whether this is possible for all of these sites, or just some ofthem, will depend on the state of the record keeping systems. It is important, however, torecord the following information for all data collected and all indicators computed: thesite visited, and which record keeping systems have been assessed, that is, computerizedsystems, ledgers or bin cards.
Assume the same indicator drug list as for the previous indicator, E.1, for purposes ofillustrating the computation of results:
Product Record Count
Tetracycline 250 MG CAP 1000 900
ORS 200 ML PKT 400 450
Paracetamol SYR 100 ML BOT 350 100
1. To determine the weighted average percentage of individual variation, the first step isto calculate the percentages of individual variation.
For tetracycline, the first product on the list, this is done as follows:
Absolute Value of Variation: 1000 - 900 = 100
2. Next, percentage of individual variation is calculated:
% of Individual = 100 x 100 = 10%Variation 1000

Detailed Descriptions of the Indicators 59
The percentage of individual variation for ORS is calculated as:
1. 400 - 450 = -50 = 50
2. 50 x 100 = 12.5% 400
The percentage of individual variation for paracetamol is:
1. 350 - 100 = 250
2. 250 x 100 = 71.4% 350
3. Finally, the average percentage of individual variation for all three products iscalculated as follows:
Average % of = 10 + 12.5 + 71.4 = 31.3%Individual 3Variation
Presentation: After adjusting for issue tickets not yet entered in the records, at the Central MedicalStore in country B, the average percentage of individual variation for the set of indicatordrugs was calculated as 31.3%.

60 Rapid Pharmaceutical Management Assessment
E.3 Average percentage of stock records that corresponds with physical counts for a set ofindicator drugs in MOH storage and health facilities (C/R/F)
Rationale: The average percentage of stock records that corresponds with physical counts is usefulfor clarifying the quality of the stock record keeping system in cases where averagevariations and variance are skewed by a small number of items.
Definition: This is the average percentage of in-stock indicator drug inventory records whichcorresponds exactly with physical stock count for a set of indicator drugs.
Data Collection:
Where to go Who to ask What to get
Central Medical Store Inventory Officer/Storekeeper Most accurate records of currentstock levels for each indicator drug,issues and receipts not entered,method to record stocks, physicalcount of unexpired stock levels
Regional Medical Store Manager
20 MOH health facilities Dispenser/Pharmacist/Storekeeper
This indicator is based on the list of 25 to 50 indicator drugs used to treat commonhealth problems (see chapter 4 "Guidelines for Study Design," section C "Specifying aList of Indicator Drugs," and Annex B, which gives examples of indicator drug lists).Visit the CMS (and at least one regional store if they exist in this system), and a sampleof 20 health facilities. At each site, carry out the following procedure:
! Ask staff to produce the most accurate records of current stock level for each of theindicator drugs. Ask them to produce their records for any recent issues or receiptswhich have not been entered in their stock level records.
! Take note of the means used to produce these estimates (computerized system,manual ledgers, bin cards). If bin cards exist, and if they were not used to produce thebest estimates, obtain a second set of data based on bin cards.
! Finally, carry out a physical count of the unexpired stock levels for these drugs, andrecord the number of units for each indicator drug in stock. The expired units shouldnot be counted. Indicator drugs which are not normally stocked by the facility shouldbe excluded.
See the "Inventory Data Form" in Annex C, page 153.
Computation &Example: ! For the set of indicator drugs calculate the percentage of records checked which
corresponds exactly with the physical counts according to the tally and the ledger. Todo this, divide the number of records for which no discrepancy was found by the totalnumber of records checked, and multiply this result by 100.
% of Stock Records Corresponding with Physical Counts =
Number of Stock Records with No Discrepancies x 100 Total Number of Records Examined

Detailed Descriptions of the Indicators 61
! Present the data in separate tables for each type of facility in the sample (CMS, RMS,or peripheral health facilities). For the sample of health facilities, the indicator iscalculated as the average of the facility-specific averages:
Average % of Stock Records Corresponding with Physical Counts =
Sum of Average % for Each Facility Total Number of Facilities in Sample
For purposes of illustrating this computation, assume an indicator drug list of threeproducts:
Product Record Count
Tetracycline 250 MG CAP 10000 10000
ORS 200 ML PKT 1000 990
Paracetamol SYR 100 ML BOT 88 87
To calculate the percentage of stock records that corresponds exactly with physicalcounts, carry out the following steps:
For one health facility, using the indicator drug list above:
1. The number of records examined = 3
2. The number of records with no discrepancy = 1
% of Stock Records Corresponding = 1 x 100 = 33%with Physical Counts 3
For a sample of 20 health facilities, for which the sum of percentages of stock recordsthat correspond exactly with physical counts is 600%, the average percentage ofindicator drugs in stock is calculated as:
Average % of Stock Records Corresponding = 600% = 30%with Physical Counts 20
Presentation: After adjusting for issue tickets not yet entered in the records at the Central MedicalStore in country Q, the percentage of records for 25 indicator drugs that correspondedexactly with physical counts was 33%. The average percentage of health facility recordsthat corresponded exactly with physical counts was 30%, with the range among facilitiesfrom 10% to 60%.

62 Rapid Pharmaceutical Management Assessment
E.4 Average percentage of a set of unexpired indicator drugs available in MOH storage and healthfacilities (C/R/F)
Rationale: The availability of indicator drugs is perhaps the single most important indicator of thisentire set. This indicator measures a procurement and distribution system's ultimateeffectiveness in fulfilling its basic mission, that is, providing drugs at health facilities.
Definition: A drug is defined as available if even one unit of unexpired product is in stock. Sinceexpired drugs are inappropriate for use in almost all situations, they are not counted asstock available for use.
Data Collection:
Where to go Who to ask What to get
Central Medical Store Inventory Officer/Storekeeper Inventory records and stock countfor indicator drugs
Regional Medical Store Manager/Storekeeper
20 MOH health facilities Dispenser/Pharmacist/Storekeeper
This indicator is based on the list, developed by study organizers, of indicator drugs usedto treat common health problems (see chapter 4 "Guidelines for Study Design," sectionC "Specifying a List of Indicator Drugs," and Annex B, which gives examples ofindicator drug lists). First, in consultation with staff at the CMS, RMS, and local healthfacilities, determine which of these products are normally stocked at each level. Thefigure for drugs normally stocked becomes the denominator in calculations. Then, assesswhether each of the normally stocked drugs is available. If any of each of the indicatordrugs is unexpired and available, record that item as "present" even if it is likely to beout of stock very soon. If all stock for a product on the list is expired, record 0. Do notworry about stock levels for this indicator.
See the "Inventory Data Form" in Annex C, page 153.
Computation &Example: ! The indicator is recorded as a percentage, calculated by dividing the number of
specified products found in stock by the total number of drugs for which availabilitywas assessed, and multiplying by 100.
% of Indicator Drug = Number of Indicator Drugs with Unexpired Stock x 100Availability Total Number of Indicator Drugs Normally Stocked
! Present the data in separate tables for each type of facility (CMS, RMS and peripheralhealth facilities) visited. For the sample of health facilities, the indicator is calculatedas the average of the facility-specific averages:
Average % of Indicator = Sum of Average % for Each Facility Drug Availability Total Number of Facilities in Sample

Detailed Descriptions of the Indicators 63
To calculate the average percentage of indicator drug availability for the sample ofhealth facilities, carry out the following steps:
1. For one health facility with 11 unexpired indicator drugs in stock, from a list of 19indicator drugs normally stocked, the calculation is:
% of Indicator Drug = 11 x 100 = 58%Availability 19
2. For a sample of 20 health facilities, for which the sum of percentages of indicatordrugs in stock is 960%, the average percentage of indicator drugs in stock iscalculated as:
Average % of Indicator = 960% = 48% Drug Availability 20
Presentation: In a survey of 20 health facilities, where 19 indicator products were confirmed to benormally stocked, an average of 48% of the listed products was found in stock. Therange among facilities was 25% to 85%, with the lower end of the range beingassociated with more peripheral health facilities. The facility-specific averages are listedbelow.
! Regional medical stores - 85%! District hospitals - 64%! Health centers and posts - 48%

64 Rapid Pharmaceutical Management Assessment
E.5 Average percentage of time out of stock for a set of indicator drugs in MOH storage and healthfacilities (C/R/F)
Rationale: The percentage of time out of stock for a set of indicator drugs gives a measure of aprocurement and distribution system's capacity to maintain a constant supply of drugs.
Definition: Time out of stock, or stockout time, is defined as the number of days that a product wasnot present in a warehouse or health facility over a recent twelve month period (usuallythe 12 months preceding the one during which the assessment takes place). To beconsidered a stockout, there must have been none of an unexpired drug in stock. If evensmall quantities of an unexpired drug were present, the drug should be counted as instock. Percentage of time out of stock is defined as the percentage of days during a 12month period that a drug has been out of stock (based on inventory records).
Data Collection:
Where to go Who to ask What to get
Central Medical Store Inventory Officer/Storekeeper Drugs that are normally stockedfrom the list of indicator drugs,number of days these normallystocked drugs were out of stockduring the 12 months prior toassessment or previous year
Regional Medical Store Manager
20 MOH health facilities Dispenser/Pharmacist/Storekeeper
This indicator is based on the list, developed by study organizers, of 25 to 50 indicatordrugs used to treat common health problems (see chapter 4 "Guidelines for StudyDesign," section C "Specifying a List of Indicator Drugs," and Annex B, which givesexamples of indicator drug lists). In order to determine stockout duration, it is necessarythat there be a reasonably accurate inventory recording system (computer/ledger/bincards) in place. As in the previous indicator, the first step is to consult with staff at eachfacility and determine which of the products are normally stocked. It is the number ofdrugs normally stocked that will be used in calculations. To determine average stockoutduration, identify which of the normally stocked drugs were out of stock during the lastyear, and then determine for how many days the product was out of stock during thattime. Ideally, this should be determined for the 12 months prior to the month in whichthe visit occurs. The critical issue is that the same 12-month period should be used forall health facilities and warehouses visited.
See the "Stockout Data Form" in Annex C, page 161.

Detailed Descriptions of the Indicators 65
Computation &Example: Enter the historical stock data into a table, recording the names of the indicator drugs,
and the number of days of stockout in the previous year. To compute this indicator, carryout the following steps:
! First, for each indicator drug on the table, record the number of days out of stock foreach of the last 12 months. Then sum the total numbers of days out of stock over thepast 12 months for all drugs.
! Second, to record this indicator, compute the average percentage of time that allindicator drugs were out of stock, within the 12 month period, by adding all thestockout days for all drugs, dividing by 365 times the number of drugs, andmultiplying by 100.
Average % of Time that Indicator Drugs were Out of Stock =
Total Number of Stockout Days for All Indicator Drugs x 100365 x Total Number of Indicator Drugs Normally Stocked
Present this data in tables, and report averages for each type of facility visited (CMS,RMS, and peripheral health facilities).
For purposes of illustrating the computation, assume an indicator drug list of threeproducts:
Product Total Days Outof Stock
Tetracycline 250 MG CAP 36
ORS 200 ML PKT 64
Paracetamol SYR 100 ML BOT 123
Assume that in a CMS, all three of these indicator drugs are normally stocked.
Average % of Time that Indicator Drugs were Out of Stock =
36 + 64 + 123 x 100 = 20% 365 x 3
Presentation: In country C, over a 12-month period, the indicator drugs were out of stock an averageof 20% of the time at the Central Medical Stores. In the Regional Medical Store, theindicator drugs were out of stock an average of 30% of the time. In the sample of healthclinics, the indicator drugs were out of stock an average of 40% of the time.

66 Rapid Pharmaceutical Management Assessment
F. Patient Access and Drug Utilization
F.1 Population per functional MOH health facility that dispenses drugs (C)
Rationale: The ratio of population to functional health facilities that dispense drugs provides arough measure of access to and availability of pharmaceutical services. The informationprovided by this indicator will allow health planners and evaluators to assess andmonitor strategies to improve distribution and access to pharmaceuticals.
Definition: Any fixed, functional health facility that dispenses drugs to inpatients or outpatientsshould be included in the total count. This might include hospitals, health centers andrural health posts. It should not include vaccination posts which do not normallydispense drugs.
Data Collection:
Where to go Who to ask What to get
MOH Chief Pharmacist, Director of Health Most recent list of facilitiesServices
Bureau of Statistics Census Director Most recent population censusfigure, population projections forintercensal period
Obtain lists of all functional MOH health facilities that meet the above definition offacilities that dispense drugs. If facilities that are managed completely, or partly, byNGOs, are considered part of the overall MOH system, they should be counted as well.The population estimate should be as current as possible. If an estimate for the currentyear is not available locally, then the options are the same as those explained in the DataCollection section of indicator C.1. That is, either use the estimate provided by the mostrecent edition of the World Bank's World Development Report, or build an estimateusing a recent census figure and applying the cumulative annual rate of populationgrowth to bring it up to the current year.
Computation &Example: This indicator is a ratio, calculated by dividing the total national population by the
number of functional MOH health facilities which dispense drugs.
Ratio = National Population Number of Functional MOH Health Facilities which Dispense Drugs
Ratio = 13,000,000 = 30,660 424
Presentation: In country C, the total number of MOH facilities is reported as 424. This includesnational, regional and district hospitals, health posts, and sub health posts, all of whichstock and dispense drugs. With a population of 13,000,000 this gives an average of30,600 persons per health facility that dispenses drugs.

Detailed Descriptions of the Indicators 67
F.2 Population per licensed pharmacist or pharmacy technician in the public sector (C)
Rationale: The unavailability of technically skilled human resources can be an important constraintin developing countries. This indicator provides a rough measure of access to skilledpharmacy personnel. Health care systems with a high ratio of population per pharmacistand trained pharmacy technician should include in their human resource managementplan the recruitment, training and development of this important resource in order tobring about improvements in service delivery.
Definition: For purposes of this indicator, pharmacist is defined as a person holding a universitydegree in pharmacy, and pharmacy technician is defined as a person who has completedformal course work leading to a certificate or diploma in pharmacy technology. Onlythese personnel who work full or part-time in the health care system which is surveyedshould be counted.
Data Collection:
Where to go Who to ask What to get
MOH Chief Pharmacist, Director of Latest count or registry ofPersonnel or Human Resources pharmacists and pharmacy
technicians in the health caresystemDrug Regulatory Authority Officer in charge of professional and
/Professional Associations technical registrations
School of Pharmacy Faculty members
Ministry of Planning/Personnel Human Resource PlannerManagement
Use interviews with key informants at any of the sites listed above to obtain lists, tablesor other documentation. Sometimes this type of information is available in gazettes orother compendia. If possible, obtain breakdowns of numbers of pharmacists andpharmacy technicians working in the public, NGO and private sectors. It is importantthat the estimates be as current as possible. Cite the names and dates of sources.
Computation &Example: This indicator is a ratio obtained by dividing the total national population by the
combined number of licensed pharmacists and pharmacy technicians who were full orpart-time employees in the public sector health system.
Ratio = National Population Pharmacists + Pharmacy Technicians
Ratio = 13,000,000 = 146,067 21 + 68

68 Rapid Pharmaceutical Management Assessment
Presentation: In country C, information on the numbers of licensed pharmacists and pharmacytechnicians was obtained from the Human Resources Division of the Ministry ofPlanning. Breakdowns for both the public and private sector are given in the table belowfor the year 1993.
Sector Pharmacists PharmacyTechnicians
Public (full or part-time) Ministry of Health 14 46Social Security 7 22Agency
Subtotal 21 68
Private (only)Manufacturers 19 32Distributors 3 0Retail 2 41
Subtotal 24 73
Totals: 45 141
There were 21 pharmacists and 68 pharmacy technicians who worked full or part-timefor the MOH in 1993. The estimated population for that year was 13,000,000, whichgives a ratio of 146,067 people per licensed pharmacist or pharmacy technician in theMOH health system.

Detailed Descriptions of the Indicators 69
F.3 Population per authorized prescriber in the public sector (C)
Rationale: Adequate numbers of technically qualified staff who are authorized to prescribemedicines are essential to a sound health care system. This indicator provides a roughmeasure of access to health care providers in the public sector who are authorized toprescribe drugs.
Definition: For purposes of this indicator, an authorized prescriber is a practitioner with formaltraining in primary and/or curative health care, who is legally authorized to prescribedrugs. Physicians, registered nurses, auxiliary nurses and nurse mid-wives are examplesof categories of professionals who are authorized to prescribe drugs in many countries.Exclude traditional healers and community based volunteers, even if they have hadtraining and prescribe selected drugs.
Data Collection:
Where to go Who to ask What to get
MOH Director of Personnel or Human Latest count or registry ofResources physicians, professional nurses and
auxiliary nurses and otherparamedical staff (communityhealth workers, health inspectors,health extension officers, etc.) whoare authorized to prescribe drugs
Drug Regulatory Authority Officer in charge of professional and/Professional Associations technical registrations
Ministry of Planning/Personnel Human Resource PlannerManagement
Use interviews with key informants at any of the sites listed to obtain lists, tables orother documentation. Sometimes this type of information is available in gazettes or othercompendia. The indicator is for the health care system being surveyed. If possible, obtainbreakdowns for numbers of authorized prescribers working in the public, NGO andprivate sectors. Keep in mind that one difficulty in interpreting such breakdowns is that,in many countries, practitioners may work in both the public and private sectors. It isimportant that the estimates be as current as possible. Cite names and dates of sources.
Computation &Example: This indicator is a ratio obtained by dividing the total national population by the
combined number of authorized prescribers.
Ratio = National Population Combined Total of Authorized Prescribers in the Health Care System
In country C, information on the numbers of authorized prescribers was obtained by firstconsulting the National Health Code. According to that document, there are three legallyestablished categories of health care providers: physicians, registered nurses andauxiliary nurses. Only the physicians may prescribe the full range of ethical and over-the-counter products. Prescribing practices of nurses and auxiliary nurses are coveredby an amendment to the Code, which authorizes them to prescribe selected drugs on theNational Drug Formulary List when working in MOH facilities, or under the direct

70 Rapid Pharmaceutical Management Assessment
supervision of a private physician. It was only possible to obtain numbers of physicianspracticing in both the public and private sectors. Information on the two categories ofnurses was available only for the public sector, though there are thought to be relativelyfew of them working in the private sector.
Sector Physicians Nurses Nurses Auxiliary
Public (full or part-time) Ministry of Health 209 42 612
Social Security Agency 62 15 65
University Hospital 42 20 32
Subtotal 313 77 709
Private (only) 74 N/A N/A
Totals: 387 77 709
Ratio = 13,000,000 = 11,829 313 + 77 + 709
Presentation: In country C, the population for 1993 was estimated at 13,000,000. Based on theinformation available, this gives a ratio of 11,829 people per authorized prescriber in theMOH system.

Detailed Descriptions of the Indicators 71
F.4 Average number of drugs prescribed per curative outpatient encounter in MOH healthfacilities (F)
Rationale: This indicator attempts to describe prescriber behavior, since too high (or too low) anaverage number prescribed can indicate poor prescribing practices. These practices canbe explained by lack of pharmaceutical information and education, or by chronic lack ofsupplies that force health workers to prescribe what is available. Additional informationis necessary to explain the cause of the prescribing practices observed.
Definition: This indicator measures the average number of drugs prescribed per outpatient percurative encounter. Each drug written separately is counted as a separate drugprescribed. Encounters include only visits by patients seeking curative care.
Data Collection:
Where to go Who to ask What to get
20 MOH health facilities Medical Records Officer/Health Determine the number of drugsFacility Manager/Pharmacist prescribed for a sample of 30
patients per facility, by consultingdaily registers, patient records,prescription slips, or throughobservation
Select a sample of 30 outpatient encounters at each health facility, and count the numberof drugs prescribed to each patient. These data may be gathered either retrospectivelyfrom medical records, or prospectively from observation. (See description of samplingmethods in chapter 4, section E, "Defining Approaches for Collecting Survey Data.") Include only patients seeking curative care. To count drugs in a uniform way in somesettings, guidelines must be established for data collectors on how to count ambiguousprescribing practices. Examples of these include locally compounded multi-drugcombination therapies, or certain combined oral/injection therapies, such as a standardtreatment of injection followed by oral administration. The methods for collecting theseindicators are also described in the manual How to Investigate Drug Use in HealthFacilities, published by WHO. 7
See the "Drug Use Data Form" in Annex C, page 165.
Computation &Example: For each health facility in the sample, the indicator is recorded as an average, calculated
by dividing the number of different drug products prescribed by the total number ofcurative outpatient encounters surveyed. Remember to count any curative encounters inwhich no drug was prescribed. The overall indicator is an average of these facility-specific averages. Along with this overall average, provide the range of highest andlowest facility averages. If different levels of the system are visited (i.e., hospitals, healthcenters and health posts), tabulate results separately and summarize with averages foreach type of facility. Express the results as the number of drugs prescribed perencounter.

72 Rapid Pharmaceutical Management Assessment
Average Number of Drugs Prescribed Per Curative = Total # of Drugs Prescribed in All Encounters Outpatient Encounter Total # of Curative Encounters Studied in All Facilities
! For example, assume that the data collected for 30 patient encounters at one healthfacility showed that 51 drugs had been prescribed. Results for that one facility arecalculated as follows:
Average Number of DrugsPrescribed Per Curative = 51 = 1.7 per encounterOutpatient Encounter 30
! For a sample of 20 health centers surveyed, a total of 1800 drugs were prescribed for600 patient encounters. The average number of drugs per encounter, for healthfacilities, is calculated as follows:
Average Number of Drugs Prescribed Per Curative = 1800 = 3 drugs per encounter Outpatient Encounter 600
Presentation: An indicator survey covering a sample of 20 health centers in country A found thatpatients received an average of 3 prescribed drugs per curative encounter. The rangeamong health facilities was 0.9 to 3.8 drugs per facility.

Detailed Descriptions of the Indicators 73
F.5 Percentage of drugs prescribed by generic name in MOH health facilities (F)
Rationale: If health care providers prescribe by generic names instead of brand names, it is easier tocontrol drug costs in the health care system, because generic substitution is not needed.
Definition: This indicator measures the percentage of drugs which are prescribed using theirinternationally recognized generic names, as identified in the WHO list of internationalnonproprietary names (INN). The availability of generically named drugs in the market,8
and the information available to prescribers, will influence the pattern observed.Although the INN is used as the "official" generic name for this indicator, in somecountries, generic drugs may be available under INN and other variations such as USANor BAN. For example, the antihistamine chlorphenamine (INN) may be marked aschlorpheniramine (USAN). Or, only the USAN or BAN generic product may bemarketed. In such situations, any of the common generic names may be counted forpurposes of this indicator.
Data Collection:
Where to go Who to ask What to get
20 MOH health facilities Medical Records Officer/Health Determine the number of genericFacility Manager drugs and total of all drugs
prescribed for a sample of 30patients per facility, by consultingdaily registers, patient records,prescription slips, or throughobservation
Study organizers must develop a list of (or an explicit way of defining) the specificproduct names to be included as generic drugs; usually the generic names of drugs areidentified on the National Drug Formulary List. Select a sample of 30 patient encountersat each health facility. These data may be gathered either retrospectively, from medicalrecords, or prospectively, from observation of patient encounters. Note the way eachdrug prescribed in the sample is recorded. (See chapter 4, "Guidelines for Study Design,"section E, "Defining Approaches for Collecting Survey Data"). Include only patientsseeking curative care. Data collectors must be able to observe the actual names used todescribe the drugs prescribed, as opposed to having access only to the names of theproducts dispensed. Thus, the dispensing ledger (if there is one) may not be an accuratesource for this indicator.
See the "Drug Use Data Form" in Annex C, page 165.

74 Rapid Pharmaceutical Management Assessment
Computation &Example: For each facility in the sample, the indicator is recorded as a percentage, computed by
dividing the number of drugs prescribed by generic name by the total number of drugsprescribed, and multiplying this quotient by 100. The overall indicator is an average ofthese facility-specific percentages. Along with this average, provide range figures.
% of Drugs = Total Number of Drugs Prescribed by Generic Name x 100 Prescribed by Total Number of All Drugs PrescribedGeneric Name
If different levels of the system are included, summarize the results in separate tables foreach type of health facility.
! For example, results for one health facility are calculated as follows:
% of Drugs = 41 x 100 = 80% Prescribed by 51Generic Name
! A total of 900 drugs were prescribed at 15 health posts; 324 were prescribed bygeneric name. The average for this sample would be calculated as follows:
% of Drugs = 324 x 100 = 36% Prescribed by 900Generic Name forAll Facilities
Presentation: In 15 health centers in country A, an average of 36% of drugs was prescribed by genericname, while in 5 hospitals in the same country, 43% of drugs were prescribed using theirgeneric names. The rate among facilities varied from 15% to 80%.

Detailed Descriptions of the Indicators 75
F.6 Percentage of drugs prescribed from the National Drug Formulary List in MOH healthfacilities (F)
Rationale: In well-managed pharmaceutical systems, health care providers are trained to confineprescribing to those drugs on the NDFL/NEDL which are authorized for the type offacility in which they work; compliance with the NDFL/NEDL is an essential part ofcost control. This indicator provides a measure of the extent to which this objective isachieved.
Definition: This indicator measures the percentage of drugs prescribed, by either brand or genericname, which are listed in the current NDFL/NEDL.
Data Collection:
Where to go Who to ask What to get
20 MOH health facilities Medical Records Officer/Health Determine the number of drugsFacility Manager/Pharmacist prescribed that are in the
NDFL/NEDL, and total number ofdrugs prescribed in a sample of 30patients per facility, by consultingdaily registers, patient records,prescription slips, or throughobservation
Before the study, organizers should obtain a copy of the NDFL/NEDL, and if possible,assemble an index of brand and generic names for products on the list. Select a sampleof 30 patient encounters from each health facility. These data may be gathered eitherretrospectively, from medical records, or prospectively, from observation of patientencounters. Record the names of the drugs prescribed exactly the way they are written.(See chapter 4, "Guidelines for Study Design," section E, "Defining Approaches forCollecting Survey Data"). Include only patients seeking curative care. Data collectorsmust be able to observe the actual names used to describe the drugs prescribed, asopposed to having access only to the names of products dispensed. For drugs written bybrand name it may be necessary to determine the generic equivalent, before determiningwhether or not the product is contained in the NDFL/NEDL. This may be done byconsulting relevant indexes. The services of a local pharmacist will also be useful here.
See the "Drug Use Data Form" in Annex C, page 165.
Computation &Example: For each health facility in the sample, the indicator is recorded as a percentage,
computed by dividing the number of drugs prescribed which are contained in theNDFL/NEDL by the total number of drugs prescribed, and multiplying by 100. Theoverall indicator is an average of these facility-specific percentages. Along with thisaverage, provide range figures.
% of Drugs Prescribed = Total Number of Drugs Prescribed from NDFL/NEDLFrom the NDFL/NEDL Total Number of Drugs Prescribed

76 Rapid Pharmaceutical Management Assessment
If different levels of the system are included, summarize the results in separate tables foreach type of health facility.
! For example, results from one health facility are calculated as follows:
% of Drugs Prescribed = 36 x 100 = 80%From the NDFL/NEDL 45
! If, for 20 health facilities, data for a sample of 600 patient encounters showed that atotal of 2,280 drugs were prescribed, and that 1664 of these were prescribed bygeneric name, then the average for all facilities would be calculated as follows:
% of Drugs Prescribed = 1,664 x 100 = 73%From the NDFL/NEDL 2,280for All Facilities
Presentation: An indicator survey covering a sample of twenty health facilities in country A found that73% of all drugs prescribed were contained in the NEDL. The range was from 62% to94%.

Detailed Descriptions of the Indicators 77
F.7 Percentage of outpatients prescribed injections at MOH health facilities (F)F.8 Percentage of outpatients prescribed antibiotics at MOH health facilities (F)
Rationale: The increasing incidence of AIDS and hepatitis B provides a good reason to assess theextent of injectable therapies and promote their rational use. Injections are essential forsome purposes, but overuse, which is common, wastes scarce resources and exposespatients to risks for adverse reactions and disease. Both of these outcomes are less likelywith oral therapies.
Antibiotics and injections are costly therapies and are frequently overused. Antibioticresistance to common infections has rendered some formerly useful drugs ineffective.This is partly caused by indiscriminate, empirical and uninformed prescribing practicesand other forms of overuse. This is especially serious when national capacity forlaboratory monitoring of antimicrobial sensitivity is limited or nonexistent.
Definition: Injectable drugs are those given intravenously or intramuscularly. For purposes of thisindicator, count only injectable drugs prescribed for curative encounters. Do not countEPI vaccinations. All antibacterials, penicillins, anti-infective dermatologicals,ophthalmic anti-infectives, and anti-diarrheal drugs containing antibiotics should beincluded as antibiotics. Metronidazole and anti-tuberculosis drugs (except streptomycin)would not be considered antibiotics for this indicator. The indicator measures thepercentage of outpatient curative encounters for which these therapies are prescribed.The indicator result would be misleading if inpatient and outpatient encounters weremixed.
Data Collection:
Where to go Who to ask What to get
20 MOH health facilities Medical Records Officer/Health Determine the number ofFacility Manager/Pharmacist outpatients who were prescribed an
antibiotic, and number who wereprescribed an injection for a sampleof 30 patients by consulting dailyregisters, patient records,prescription slips, or throughobservation
Before the study, organizers should develop a list of which medications are to be countedas antibiotics to be used as a reference by data collectors. Select a sample of 30 patientencounters from each facility. These data may be gathered either retrospectively, frommedical records, or prospectively, from observation. Count the number of injectionsand/or antibiotics prescribed for each patient. (See description of sampling methods inchapter 4, section E, "Defining Approaches for Collecting Survey Data.") Include onlyoutpatients seeking curative care. Count separately the number of patients who areprescribed one or more antibiotics, or one or more injections. If a patient receives two ormore antibiotics, this counts as one instance for this purpose. If a patient receives two ormore injections, this counts as one instance for the indicator.

78 Rapid Pharmaceutical Management Assessment
It is extremely important to avoid, or at least be aware of, factors in the data collectingenvironment which would bias results. For example, if the patient encounter samplecovered one or more days at facilities when most patients who attended were diabeticscoming for insulin, the number of injections observed in a sample would be artificiallyhigh. Similar problems would occur if the sample was weighted with days when apsychiatric clinic was held and a high proportion of patients came for maintenanceantipsychotic injections.
See the "Drug Use Data Form" in Annex C, page 165.
Computation &Example: For each facility in a sample, both indicators are recorded as percentages, computed by
dividing the number of patient encounters during which an antibiotic is prescribed/aninjection is given, by the total number of patient encounters surveyed, and multiplying by100. The overall indicators are the averages of these facility-specific percentages. Alongwith this average, provide range figures.
% of Patients = Total Number of Patients Prescribed Injections x 100Prescribed Injections Total Number of Patient Encounters Surveyed
% of Patients = Total Number of Patients Prescribed Antibiotics x 100Prescribed Antibiotics Total Number of Patient Encounters Surveyed
! For example, results from one health facility are calculated as follows:
% of Patients = 4 x 100 = 13%Prescribed Injections 30
% of Patients = 7 x 100 = 23%Prescribed Antibiotics 30
! If, for 20 health facilities surveyed, data for a sample of 600 patient encountersshowed that a total 120 patients received injections, then the average for all facilitieswould be calculated as follows:
% of Patients = 120 x 100 = 20%Prescribed Injections 600for All Facilities
! For the same 20 health facilities, the same data also showed that 102 patients receivedantibiotics. Therefore, the average for all facilities would be calculated as follows:
% of Patients = 102 x 100 = 17%Prescribed Antibiotics 600for All Facilities

Detailed Descriptions of the Indicators 79
Presentation: In a survey of 20 health facilities in country Z, an injection was prescribed during 20%of all outpatient encounters, with a range of 0% to 55% among facilities. For the samesample, 17% of encounters resulted in prescription of antibiotics, with a range of 0% to57% among facilities.

80 Rapid Pharmaceutical Management Assessment
F.9 Percentage of prescribed drugs presented for dispensing that are actually dispensed in MOHhealth facilities (F)
Rationale: This indicator measures the ability of a sample of health facilities to meet thepharmaceutical needs of their users. It is also a measure of the availability of drugs in thehealth facilities.
Definition: Drugs that are actually dispensed are defined as drugs that are prescribed and dispensedfrom the health facility. In this indicator, it is based only on the prescriptions presentedfor dispensing.
Date Collection:
Where to go Who to ask What to get
20 MOH health facilities Medical Records Officer/Health Number of drugs dispensed andFacility Manager total number of drugs that were
prescribed in a sample of 30dispensing encounters at eachfacility
At each of the 20 health facilities, examine 30 dispensing encounters in a given month.Prior to the start of the assessment, all the data collectors should agree on which monthor set time period to study these 30 encounters at each health facility. If recordsdocument which drugs were not dispensed, this indicator can be collectedretrospectively. Otherwise, observe 30 dispensing encounters. (See chapter 4, section E,"Defining Approaches for Collecting Survey Data.") Record the number of prescribeddrugs presented for dispensing, and then record the number of drugs actually dispensedfrom these 30 encounters. Each prescribed drug should be counted separately. If anyportion of the prescribed amount is dispensed, count the drug as dispensed.
See the Drug Use Data Form" in Annex C, page 165.
Computation &Example: For each health facility in the sample, indicators are recorded as percentages, computed
by dividing the number of drugs actually dispensed by the total number of prescribeddrugs which were presented for dispensing, and multiplying this quotient by 100. Theoverall indicator is an average of these facility-specific percentages. Along with thisaverage, provide the range figures.
% of Prescribed Drugs that are Dispensed =
Number of Drugs Actually Dispensed x 100 Number of Prescribed Drugs Presented for Dispensing
! The results for one health facility are calculated as follows:
% of Prescribed Drugs that are Dispensed = 35 x 100 = 78% 45

Detailed Descriptions of the Indicators 81
! If, for 20 health facilities surveyed, data for a sample of 600 patient encountersshowed that 438 prescribed drugs were actually dispensed, then the average for allfacilities would be calculated as follows:
Average % of Prescribed Drugs = 438 x 100 = 73%that are Dispensed for All Facilities 600
Presentation: In country C, for a sample of 20 health facilities, an average of 73% of prescribed drugspresented for dispensing were actually dispensed, with a range from 50% to 96% amongfacilities.

82 Rapid Pharmaceutical Management Assessment
G. Product Quality Assurance
G.1 MOH drug product quality laboratory tests during the past year: (a) number of drug productstested and (b) total number of drug product quality tests performed (C)
Rationale: This indicator measures how actively the Ministry of Health pursues drug productquality assurance (QA) testing. Typically, Ministries of Health have laboratory analysesconducted on drug samples on such occasions as: receipt of bids from potentialsuppliers, arrival of new stock at the central warehouse, receipt of complaints concerningspecific products, or random sampling in retail pharmacies.
Definition: This indicator measures the number of separate drug products which were submitted byMOH facilities for testing within a recent 12 month period, and the total number of testsfor quality which were performed.
Data Collection:
Where to go Who to ask What to get
Drug Regulatory Authority or Officer in charge of quality control Information on the existence ofQuality Control Testing Laboratory and drug testing laboratory services drug product testing program, its
description and performance
Use interviews with key informants to determine and record:
! Whether or not the MOH has an active drug product testing program! Names and affiliations of the laboratories which actually perform the tests! Occasions on which testing is carried out! Number of drug products submitted for testing, from where and why! Number of drug products actually tested this past year! Number of tests carried out in the past year, with results of tests! The year these tests were performed! Information at the drug testing laboratory concerning staff level and capacity,
equipment, record systems, and access to reagents, reference standards and technicalinformation
Computation &Example: This indicator is expressed as:
! Number of drug products tested by the MOH for drug quality.
! Total number of tests carried out by the MOH for drug quality. For example, drugs Xand Y were submitted to the MOH for testing. Four separate tests were done on X andonly two on Y. Therefore, two drug products were tested and a total of six tests wereperformed. In addition, present any information which permits breaking down thetotal number of tests by such criteria as: number initially presented for testing,reasons for testing, numbers of positive and negative results, and locations of testing.

Detailed Descriptions of the Indicators 83
Presentation: Six drugs purchased by the MOH in country Q were submitted for testing to theRegional Drug Testing Laboratory in 1993. At the time of the survey, results had beenobtained for three of these items. One (ampicillin) was found to be substandard. A totalof eight tests were performed on these three drugs.

84 Rapid Pharmaceutical Management Assessment
G.2 Use of WHO Certification Scheme (C)
Rationale: Developing countries with inadequate pharmaceutical testing facilities may be unable tocarry out quality control analyses. The WHO Certification Scheme on the Quality ofPharmaceutical Products Moving in International Commerce is one mechanism tohelp assure the quality of pharmaceutical products manufactured or purchased in acountry. Full participation of the exporting country in the Scheme provides assurance9
that the drug has been authorized to be sold in the exporting country, that themanufacturing laboratory has been inspected and complied with good manufacturingpractices, and facilitates the exchange of drug information between governments.
Definition: This indicator measures the degree to which the WHO Certification Scheme on theQuality of Pharmaceutical Products Moving in International Commerce is used byimporting countries for drug registration and for public sector procurement, and byexporting countries to certify quality of exported products.
Data Collection:
Where to go Who to ask What to get
MOH Director of Pharmaceutical Services Evidence of membership to and useof WHO Scheme to assure qualityof pharmaceuticals in registration,procurement, and/or certificationfor exports
Central Procurement Agency Director
Drug Regulatory Authority Officers in charge of registration andof certifying good manufacturingpractices
There are four ways for a country to participate in the WHO Certification Scheme. Acountry may:
1. Issue and use certification for drug registration2. Issue certification for exports3. Use certification issued by other countries for drug registration4. Uses certification by other countries for public sector procurement
Visit whatever sites are required for determining whether the country participates in eachof these components. Also determine if the country is using the current version of theScheme, and obtain data on the specific number of instances of use for purposes ofprocurement, registration and certification of exports. Verbal assurances of participationin and active use of the Certification Scheme do not necessarily mean that the Scheme isbeing used. The study team should ask for documents which verify use.

Detailed Descriptions of the Indicators 85
Computation &Example: Record participation in the Certification Scheme as follows:
! Total, if the country is a member and uses the Scheme and for all of the registration,export, and procurement functions
! Partial, if the country is a member and actively uses the Scheme for at least one of theregistration, export, and procurement functions
! Limited, if the country is an official member of the Scheme, but there is limited or noevidence that it is active for specific purposes of registration, exports, or procurement
! None, if the country does not participate in the Scheme
Presentation: Country A is a partial participant in the WHO Certification Scheme of PharmaceuticalProducts Moving in International Commerce. Review of relevant records showed thatin 1993, there were six import certifications for drugs purchased by the MOH CentralMedical Store. There is no evidence that the Scheme is used for product registration orexport certification.

86 Rapid Pharmaceutical Management Assessment
G.3 Existence of formal systems for reporting: (a) product quality complaints, and (b) adverse drugreactions (ADRs) (C)
Rationale: Product quality assurance is most readily assured by a combination of purchases fromreliable suppliers and functioning mechanisms through which health care providersreport potentially defective products and potential adverse reactions. Effective follow-upon such reports is also critical. This indicator measures a government's ability to monitordrug product quality problems, as well as drug-induced disease.
Definition: Formal mechanisms designed for reporting product quality complaints and adverse drugreactions in patients are programs which have been enacted by legislation, writtenregulation, or through official notices from the responsible government agency. To beconsidered functioning, the offices responsible for administering these systems must beable to produce standard forms used for reporting quality complaints or ADRs. Inaddition, there must be evidence that follow-up investigations occur when reports aresubmitted.
Data Collection:
Where to go Who to ask What to get
Drug Regulatory Authority Quality Control Officer Format for reporting drug qualitycomplaints and ADRs, number ofcomplaints and ADRs reportedduring previous year, action takenand sample of reporting forms
MOH Chief Pharmacist
Adverse Drug Reaction Monitoring ADR monitoring officerCenter or Unit
Determine, through interviews and review of documents on hand at the office(s)responsible for pharmaceutical quality control and adverse drug reactions, how reportsare intended to be processed. Obtain copies of reporting forms. Determine how manyproduct quality complaints or ADR reports have been received during the last year. If itis verified that reports have been received, ask for evidence of any follow-up that tookplace.
Computation &Example: Each part of this indicator should be scored according to the following criteria:
! Functional, if a formal reporting system is mandated, there are standard reportingforms, there is evidence that reports are submitted, and there is evidence that follow-up investigations take place
! Limited, if a reporting system is mandated, but no standard reporting forms exist, oreven if standard reporting forms do exist, reports are rarely or never submitted, andthere is no evidence of follow-up investigations
! Nonexistent, if there is no reporting system in place

Detailed Descriptions of the Indicators 87
Presentation: In country Y, the Drug Regulatory Authority is mandated by the Health Code to monitorand take action on product quality complaints. The status of this system is at bestlimited, because no standard reporting forms exist, and only one complaint was receivedduring the 12 months preceding the assessment. There was no evidence of follow-upaction.
For adverse drug reactions the situation is similar, with even less evidence of activity.There is no legal mandate for reporting ADRs, but staff at the Drug RegulatoryAuthority do acknowledge responsibility in this area. There is no standard reportingform, nor is there evidence that reports have ever been submitted. Therefore, the mostappropriate rating for an ADR reporting system appears to be nonexistent at thenational level.
There are, however, two hospitals in the capital city that do have their own ADRreporting systems, both using regular reporting forms: the University Teaching Hospitaland the Adventist Hospital. At the University Hospital, an average of two ADRs werereported monthly over the twelve months preceding the assessment, and at the AdventistHospital a monthly average of one ADR was reported over the same period.

88 Rapid Pharmaceutical Management Assessment
H. Private Sector Pharmaceutical Activity
H.1 Population per licensed private sector drug retail outlet (C)
Rationale: The private pharmaceutical sector is the primary source of medicines consumed in mostcountries. The extent and impact of this sector on the health status of the population isusually not well documented. This indicator provides one measure of the coverage of theprivate sector drug system.
Definition: A private sector drug retail outlet is any private drug outlet, pharmacy, or formallyorganized store that is authorized by the Drug Regulatory Authority to sell ethical and/orover-the-counter pharmaceutical products to the public.
Data Collection:
Where to go Who to ask What to get
MOH Chief Pharmacist List of all licensed private sectordrug retail outlets
Pharmacy Board Members
Drug Regulatory Authority Director
Bureau of Statistics Census Director Most recent population censusfigure/population projections forintercensal period
Obtain a list or a count of all licensed private sector drug retail outlets. Obtain officialinformation about the most recent estimate of national population. If the most recentlocal estimates are not current, extrapolate from the last census figure, the year it wasdone, and the population growth rate per year (or use the most recent edition of theWorld Development Report).
Computation &Example: This indicator is a ratio, obtained by dividing the national population by the number of
licensed private sector drug retail outlets. Express results in terms of persons per drugretail outlet.
Population per Licensed = National Population Private Sector Drug Number of Licensed Private Sector Drug Retail OutletsRetail Outlet
Population per Licensed = 10,000,000 = 25,000Private Sector Drug 400Retail Outlet
Presentation: In country X, a total of 400 licensed private sector drug retail outlets were in operationduring the year 1993. With a total population of 10,000,000 persons that year, thisyields an average of 25,000 persons per licensed private sector drug retail outlet.

Detailed Descriptions of the Indicators 89
H.2 Number of licensed or registered drug retail outlets per government drug inspector (C)
Rationale: Governments need to ensure that the private pharmaceutical sector is an effective partnerin sustaining and improving the health status of the population. Active enforcement ofthe legislation and regulations require adequate numbers of trained inspectors. Thenumber of licensed/registered drug retail outlets per government drug inspector providesan estimate of the government's capacity to monitor the formal drug retail market.
Definition: Only pharmacies and other formally organized stores that are licensed to sell drugs to thepublic should be counted. Government drug inspectors are those whose primary orsecondary responsibility is inspecting drug manufacturers, drug importers, drugwarehouses, private pharmacies, and other drug retail outlets. This indicator, however,concerns only drug retail outlets.
Data Collection:
Where to go Who to ask What to get
MOH Director of Pharmaceutical Services List of all licensed private sectordrug retail outlets, and total numberof staff that are officially counted asdrug inspectors
Pharmacy Board Members
Drug Regulatory Authority Director
Obtain the most recent information regarding the number of licensed and/or registereddrug retail outlets in a given year. Define the categories of government staff that areofficially counted as drug inspectors, and obtain an estimate of the number of suchpersonnel that are currently employed by the government in that given year.
Computation &Example: This indicator is calculated by dividing the number of licensed drug retail outlets by the
number of actual drug inspectors. Express the results in terms of outlets per inspector.
Number of Licensed Drug Retail = Number of Licensed Drug Retail OutletsOutlets per Drug Inspector Number of Drug Inspectors
Number of Licensed Drug Retail = 900 = 75 Outlets per Drug Inspector 12
Presentation: In country X, the Department of Drug Administration has 12 staff members whose fullor part time responsibilities include inspecting drug retail outlets of all categories. Thereare 900 licensed pharmacies. This yields an average of 75 licensed drug retail outlets perinspector.

90 Rapid Pharmaceutical Management Assessment
H.3 Percentages of drug manufacturers, distributors, and drug retail outlets inspected during aone-year period (C)
Rationale: The degree of coverage for inspections of drug manufacturers, distributors, and drugretail outlets provides a rough measure of the enforcement of drug legislation andregulations.
Definition: For this indicator, drug manufacturers are those companies that are licensed tomanufacture raw materials, formulate from imported or manufactured raw materials,repackage finished dosage forms and strengths, or any combination thereof. Distributorsinclude companies that distribute pharmaceuticals, as well as other products. See H.1 fora definition of drug retail outlets.
Data Collection:
Where to go What to getWho to ask
MOH Director of Pharmaceutical Services List of all manufacturers,distributors and licensed privatesector drug retail outlets, and totalnumber of sites inspected in eachcategory in 12 months prior to theassessment or during the last year
Pharmacy Board Members
Drug Regulatory Authority Director
Interview key informants and review records to determine:
! Numbers of manufacturers, distributors and retailers! Numbers of sites in each category that received one or more inspection visits during
either the 12-month period preceding the assessment, or the most recent one-yearperiod for which data are available
Computation &Example: For each category, calculate the percentage of total sites receiving one or more inspection
visits in the past year, as follows:
% of Sites = Number of Sites Inspected x 100Inspected Total Number of Sites

Detailed Descriptions of the Indicators 91
The Office of Inspection provided information summarized in the table belowconcerning sites inspected during 1993.
Number PercentType of Site Number Inspected Inspected
Manufacturer 6 4 67%
Distributor 14 6 43%
Drug Retail Outlet 900 84 9%
The example below illustrates the calculation for the drug retail outlets:
% of Sites = 84 x 100 = 9%Inspected 900
Presentation: During a one year period in country X, the percentage of sites inspected, by category,was as follows: 9% of drug retail outlets, 43% of distributors, and 67% ofmanufacturers.

92 Rapid Pharmaceutical Management Assessment
H.4 Total value of total private sector retail pharmaceutical sales, US$ per capita (C)
Rationale: The value per capita of private sector retail pharmaceutical sales is one measure of thevalue of national resources allocated to pharmaceuticals. To allow cross-nationalcomparisons, the value is expressed in US$ per capita.
Definition: Private sector retail pharmaceutical sales are those sales that are made to the publicthrough private drug retail outlets. It excludes sales from distributors to public sectorhospitals and outpatient health facilities.
Data Collection:
Where to go Who to ask What to get
Pharmaceutical Manufacturers President and/or members Total value of retail sales in US$Association for most recent calendar or fiscal
yearRetail Trade Association President and/or members
Customs or Internal Revenue Registry DirectorAgency
Ministry of Finance or Trade Planning Director
Bureau of Statistics Census Director Most recent population estimate,international data sources such asIMS International Data
After ascertaining what information sources are available, study organizers mustdetermine the most reliable method of obtaining total private sector retail pharmaceuticalsales in a recent fiscal or calendar year. Often, the most reliable source for suchinformation is the local association which represents pharmaceutical manufacturers.Sometimes information will be available from the Ministry of Health or the Ministry ofTrade (or its equivalent). Obtain a reasonably accurate official estimate of the nationalpopulation (as described in other indicators) during this fiscal year. Be sure not to doublecount wholesale and retail sales. If sales data were provided in local currency, and therehave been significant changes in the conversion rates, select and report on a method foraveraging the exchange rate. Obtain data for the same time period used for MOHpharmaceutical expenditures.
Computation &Example: The indicator is calculated as the total value of private sector retail pharmaceutical sales,
in U.S. dollars, divided by the national population.
Private Sector Pharmaceutical Sales = Total Value of Private Sector Retail Drug SalesPer Capita National Population

Detailed Descriptions of the Indicators 93
Private Sector Pharmaceutical Sales = $58,800,000 = $4.20Per Capita 14,000,000
Presentation: In country B, the value of the private pharmaceutical sector sales was approximately$4.20 worth of drugs per capita during 1993.

94 Rapid Pharmaceutical Management Assessment
H.5 Combined value of public sector pharmaceutical expenditures and private sector retail sales,US$ per capita (C)
Rationale: The combined value of public sector drug purchases and private sector retailpharmaceutical sales is one measure of the value of total national resources allocated topharmaceuticals. This indicator complements the previous one. Viewed together, theyprovide a basis for comparing the relative weights of the MOH and private sector in themarket.
Definition: Total public sector per capita purchases are defined as the total amount of money (inUS$ at the current rate of exchange) spent on purchasing pharmaceuticals by all publicsector systems (national, regional and local budgets combined) for the most recentfinancial year, per individual in the population. The total private sector market isestimated by the value of total pharmaceutical retail (rather than wholesale) sales asdescribed in the previous indicator. The periods (and exchange rates) used for privateand public markets should be the same. This value should not include donations for (orfrom) NGOs and/or PVOs. However, major NGO health systems which purchase drugsin the local market for distribution through their own health systems should be included,if possible.
Data Collection:
Where to go Who to ask What to get
MOH and other major public sector Finance or Budget Director Total public sector purchases andhealth systems total value of retail sales in US$ for
most recent calendar or fiscal yearPharmaceutical Manufacturers President and/or membersAssociation/Retail TradeAssociation
College of Pharmacy President and/or members
Customs or Internal Revenue Registry DirectorAgency
Ministry of Finance or Trade Planning Director
International data sources, such asIMS International Data
Bureau of Statistics Census Director Most recent population estimate
Two major components of this indicator have been collected previously in two otherindicators (C.1 and H.4). In order to be able to combine them for this indicator, however,the MOH expenditures and private sector sales figures must be calculated for the samedefined period of time. If there are other major public sector health systems, such asSocial Security, these estimated or actual purchases must be added to the MOH figurefor the same period of time.

Detailed Descriptions of the Indicators 95
Computation &Example: For the same time period, adjust the public and private sector components, add together,
then divide by the estimated national population.
Combined Public Drug = Public Sector Purchases + Private Sector Sales Purchases and Private National PopulationSector Sales Per Capita
OR add the values of the indicators C.1 and H.4, assuming the data was collected overthe same period of time for both, and there are no other major public sector healthsystems.
Combined Public Drug Purchases and Private Sector Sales Per Capita =
$18,000,000 (MOH) + $8,000,000 (Social Security) + $58,800,000(Private) = $6.06 14,000,000
Presentation: In country B, in the previous calendar year, the total value of the drug market was US$6.06 per capita ($1.86 by the public sector and $4.20 in the private sector).

96 Rapid Pharmaceutical Management Assessment
H.6 Percentage of products on National Drug Formulary List that are currently manufactured orco-manufactured within the country (C)
Rationale: The percentage of products on the NDFL/NEDL which are currently manufactured orco-manufactured within the country measures a country's self sufficiency for supplyingthe most essential pharmaceutical products.
Definition: For the indicator to be relevant, there must be a National Drug Formulary List inexistence, as well as a local drug industry. Drugs from this list are counted asmanufactured in-country if they are manufactured either from raw materials orintermediate chemical constituents; drugs which are simply repackaged or relabelled arenot counted.
Data Collection:
Where to go Who to ask What to get
MOH Pharmaceutical Services Director Total number of drugs inNDFL/NEDL
Local Pharmaceutical President/Members List of drugs manufactured fromManufacturers Association raw materials or intermediate
chemical constituents
Determine the number of pharmaceutical products listed on the National DrugFormulary List. For each of these products, determine if one or more local manufacturerscurrently manufactures the product in-country and markets it in either generic orproprietary form. If a product is manufactured by one or more manufacturers, it isrecorded as being produced in the country.
Computation &Example: This indicator is recorded as a percentage, calculated by dividing the number of drugs
produced in-country, in a given year, on the National Drug Formulary List by the totalnumber of unique, generic drug products on the list, and multiplying by 100.
% NDFL Drugs Manufactured In-country =
Number of Drugs on NDFL that are Manufactured In-country x 100 Number of Drugs on NDFL
% NDFL Drugs = 120 x 100 = 42%Manufactured 284In-country
Presentation: In 1992, 42% of the drugs on the National Drug Formulary List of country D weremanufactured in-country by one or more of the six local producers.

Detailed Descriptions of the Indicators 97
H.7 Average of median private sector drug retail prices as a percentage of MOH acquisition pricesfor a set of indicator drugs (C)
Rationale: The average percentage of median indicator drug prices in private sector drug retailoutlets provides a measure of the cost-effectiveness of operating in-house retailpharmacy services in MOH health facilities. Cost-effectiveness increases to the degreethat retail prices exceed MOH acquisition prices.
Definition: The average of median private sector retail prices is the average of the median retailprices for a list of 25 to 50 tracer drugs, based on data collected at a sample of 20 drugretail outlets. These data can be collected as part of the sample survey covering bothMOH health facilities and drug retail outlets that is required for covering a number ofother indicators. (See chapter 4, "Guidelines for Study Design.") The average MOHacquisition prices are the average of CIF prices paid for the same indicator drugs in themost recent MOH procurement.
Data Collection:
Where to go Who to ask What to get
MOH Procurement Unit or CMS Officer in charge Most recent regular CIF price paidfor list of tracer drugs
Sample of drug retail outlets Pharmacy owner /Dispenser Retail price for list of tracer drugs/Pharmacist
To collect prices from retail outlets, begin with the list of tracer drugs. Visit the sampleof pharmacies or other drug retail outlets, and at each site obtain the current selling pricefor each of the indicator drugs. If an item is not stocked, skip that drug and go to thenext. If more than one brand is stocked, use the price of the least expensive product.Select the median price for each indicator drug from the aggregate of prices collectedfrom all sites visited. [The median (or middle-most), is used instead of the mean (oraverage) retail price to avoid bias caused by outlying high or low prices for a given drugproduct.] To determine the median retail price for each product, examine the completelist of 20 prices obtained from all sites, arranged in ascending order, and pick the middletwo numbers (10 and 11). Add these two numbers and divide by two to obtain themedian. If the list contains an odd number of items, simply select the middle-mostnumber as the median. See the following examples:
Ex. 2,3,4,5,6 Median is 4
Ex. 2,3,4,5,6,7 Median: 4 + 5 = 9 ÷ 2 = 4.5
The MOH acquisition price is the CIF price paid for the indicator drugs for the mostrecent regular (non-emergency) procurement. This has already been discussed inindicator D.3.
See the "Price Comparison Data Form" in Annex C, page 169.

98 Rapid Pharmaceutical Management Assessment
Computation &Example: Using the median retail prices, this indicator is calculated as follows:
! For each indicator drug, divide the median retail unit price by the MOH acquisitionunit price, and multiply by 100.
% of MOH Acquisition Price = Median Retail Unit Price x 100 MOH Acquisition Unit Price
! For the entire list of indicator drugs, add up the results of the above calculation donefor each product, then divide by the total number of indicator drugs.
Average % of MOH Acquisition Price =
Sum of % of MOH Acquisition Prices for all Indicator Drugs Total Number of Indicator Drugs
For example, for purposes of illustrating this result, assume an indicator drug list ofthree products.
Median Retail MOH Acquisition Product Unit Price Unit Price
Tetracycline 250 MG CAP 0.112 per CAP 0.014 per CAP
ORS 200 ML PKT 0.36 per PKT 0.04 per PKT
Paracetamol SYR 100 ML BOT 4.30 per ML 0.43 per ML
1. To arrive at the average percentage of MOH acquisition price, the first step is tocalculate the percentage of MOH acquisition price for each product. For tetracycline,the first product on the list, this is done as follows:
% of MOH Acquisition Price = 0.112 x 100 = 800% 0.014
2. Using the data provided in the table, the percentages of MOH acquisition prices forORS and paracetamol syrup are calculated as 900% and 1000%, respectively.
3. Finally, the average percentage of MOH acquisition price for all three products iscalculated as follows:
Average % of MOH Acquisition Price = 800 + 900 + 1000 = 900% 3
Presentation: In country Q, retail prices of 25 indicator drugs were found to be, on average, 900% ofMOH acquisition prices, based on retail data collected in July 1993 and MOHacquisition prices paid in March 1993.

Detailed Descriptions of the Indicators 99
H.8 Existence of price controls for drugs in the private sector (C)
Rationale: Governments often attempt to influence the level of profit the private sector can obtainfrom drug sales. This indicator will record whether there are policies and regulationscontrolling the prices of drugs in the private sector.
Definition: Price controls are regulations which govern markups, margins, sales prices or profits fordrugs at the manufacturer, importer, wholesale distributor and/or retail sales level.
Data Collection:
Where to go Who to ask What to get
MOH Director of Pharmaceutical Services Copy of legislation or regulationscontrolling prices of drugs in theprivate sector, list of prices,description of measures to monitorprices charged, sanctions toviolators, and number of siteswhere price checks were carried outin the last 12 months
MOF Price Control Authority
Manufacturers, importers, Company Managerswholesalers
Retail outlets Owners
Professional and industry Presidentassociations
Interviews and document review are used to determine the presence of price controls atmanufacturer, wholesale and retail levels. The type and extent of controls at each levelshould be obtained. If feasible, price lists from manufacturers and wholesale and retailoutlets should be used in combination with interviews, to determine whether controls areenforced. During interviews, request information about programs in place to monitorcompliance with price controls, and sanctions which are applied to violators. If possible,obtain quantitative information as to the number of outlets where prices were physicallychecked in the last 12 months, and the number of exceptions which were found. Inaddition, collect information on such related points as titles of pertinent laws andregulations, rigor of enforcement and fines or other sanctions for violations.
Computation &Example: This indicator is scored as follows:
! Manufacturer, Wholesale and Retail, if price controls are in force for all three levels! Manufacturer and Wholesale, if price controls exist at both manufacturer and
wholesale levels! Wholesale and Retail, if price controls exist at both wholesale and retail levels! Manufacturer Only, if price controls are applicable only to manufacturers! Wholesale Only, if price controls apply only at the wholesale level! Retail Only, if price controls only apply at the retail level! None, if there are no official price controls in place

100 Rapid Pharmaceutical Management Assessment
Presentation: In country X, there are regulations that control drug prices at both the wholesale andretail units. The regulations limit markups at the wholesale level to 10%, and at the retaillevel to 15%. Interviews with MOH officials and the Pharmaceutical Associationsuggest that controls are not rigorously enforced.

Detailed Descriptions of the Indicators 101
H.9 Percentage of licensed drug retail outlets where an antibiotic was available without aprescription (C/R/F)
Rationale: Antibiotics have precise indications when epidemiological and laboratory evidenceconfirm or suggest a bacterial infectious agent. In the absence of this evidence, use ofantibiotics is not only ineffective and a waste of resources, but it can also result inresistance. Health care system staff should be aware of the detrimental consequences ofunjustified use of antibiotics and in countries where policies regulate their sale with aprescription, compliance should be enforced. This indicator will measure the degree towhich existing regulations on the sale of antibiotics without a prescription are obeyed inpractice. If there are no regulations, this indicator is not relevant.
Definition: For this indicator, a prescription is a document that contains the physician/prescriber'schoice of drug treatment for the patient. All antibacterials, penicillins, anti-infectivedermatologicals, ophthalmic anti-infectives, and anti-diarrheal drugs containingantibiotics should be included as antibiotics.
Data Collection:
Where to go Who to ask What to get
20 licensed drug retail outlets near Pharmacist or dispenser Purchase of one or twothe health facilities assessed capsules/tablets of an antibiotic
without a prescription
Ascertain whether any regulations exist regarding the sale of antibiotic products withouta prescription. If they do, ask which antibiotic drugs might commonly be sold over thecounter without a prescription (e.g., tetracycline, ampicillin or co-trimoxazole). Recruitthe assistance of local personnel, and have them attempt to purchase 1 or 2capsules/tablets of the product in question at a randomly selected drug retail outlet neareach of the 20 health facilities (see methods described in chapter 4, "Guidelines forStudy Design," Section E, "Defining Approaches for Collecting Survey Data"). Count alldrug retail outlets where drugs are successfully purchased.
Drugs that are purchased should be retained by the principal investigator. If qualityassurance testing facilities exist in the country, products could be tested for quality. Theinvestigator might also be able to determine the number of different suppliers' productswhich are sold. Once any such activities are completed, properly dispose of anyremaining drugs. Prior to the start of any assessment, all data collectors should agree todo this study over the same set period of time (e.g., within the month of July), and toattempt to purchase the same drug product (not necessarily from the samemanufacturer).
See the "Generic Substitution and Sale of Antibiotics Data Form" in Annex C,page 149.

102 Rapid Pharmaceutical Management Assessment
Computation &Example: This indicator is recorded as a percentage, calculated as the number of drug retail outlets
where an antibiotic was successfully purchased without a prescription divided by thetotal number of drug retail outlets where the attempts to purchase were made, andmultiplied by 100.
% of Outlets where = # of Outlets where Antibiotic Available Without a Prescription x 100Antibiotic was Available Total Drug Retail Outlets VisitedWithout a Prescription
% of Outlets where = 14 x 100 = 70%Antibiotic was Available 20 Without a Prescription
Presentation: When an assessor asked to purchase tetracycline without a prescription, she wassuccessful in 14 out of 20, or 70%, of drug retail outlets during the month of March1994.

IV. GUIDELINES FOR STUDY DESIGN
General Approach
This manual is intended for use in a structured assessment of the pharmaceutical sector. At first glance,gathering data for the 46 indicators described in the preceding chapter may seem complex and intimidating.The complete assessment requires that information be gathered on eight different topics, at threeadministrative levels, and using seven different methods of data collection. These three dimensions of theindicator study are given below:
Topics Levels Methods
Policy, Legislation and Regulation Central Structured
Formulary/Essential Drugs List and Drug Information Regional
Ministry of Health Budget and Finance Health facility
Ministry of Health Pharmaceutical Procurement and stock record
Ministry of Health Pharmaceutical Logistics
Patient Access and Drug Utilization review
Product Quality Assurance Observation of
Private Sector Pharmaceutical Activity
Interview
Document review
Inventory taking
review
Clinical record
clinical encounters
Shelf checks
Simulatedpurchases
The actual management is not, however, as difficult as it may seem. In practice, the entire set of indicatorssorts itself into two groups, which constitute distinct data collection efforts:
! At the central level, data are collected for 38 indicators, of which 30 are collected throughstructured interview and document review, and eight through physical inventory and stock recordreview.
! At the regional and health facility levels, data for 18 indicators are collected through sample
surveys, in the course of which techniques such as physical inventory, review of stock records,review of clinical records, shelf checks and simulated purchases are all used. These methods arealso supplemented by structured interviews.
These two efforts represent roughly equal amounts of work. Note that data for some of the indicators arecollected at multiple levels. Although the central-level effort has the most indicators to cover, all of therequired data should be available in the capital city, and most of them may be relatively easy to obtain. Theregional/health facility effort covers fewer indicators, but it requires organizing a survey to collect differenttypes of data in 40 or more sites.

104 Rapid Pharmaceutical Management Assessment
Experience in several countries has shown that the most practical way to carry out the pharmaceuticalindicators study is to engage two or more expert investigators to work with counterparts over a period ofthree to six weeks. An ideal combination would include the following people:
! A pharmaceutical management specialist to take charge of data collection at the central level. Forthis, familiarity with pharmaceutical policy, system management, procurement, and budget issueswould be most useful.
! A health care provider such as a physician, pharmacist or nurse to take charge of the surveys to becarried out at the regional and health facility levels. For this, familiarity with pharmaceuticalproducts and work routines in health facilities would be an asset.
The rest of this chapter, and the following one, are based on the assumption that the pharmaceutical indicatorstudy will be carried out by two investigators. In order to avoid confusion, one member of the study teamshould be designated as the team leader. Technical responsibilities should be divided according to the skillsand interests of each team member. Data collection at facility level may be handled largely or entirely by datacollectors recruited locally. Using local health care system counterparts who are fully committed toparticipation and who are available full time will expand the technical reach of the assessment substantially.Furthermore, it is essential to have a senior operations official of the local health care system designated asprincipal counterpart to the assessment team.
One crucial step that cannot be overlooked when planning an assessment is the definition and identification ofnecessary resources. The financial and human resource requirements depend primarily on the purpose andscope of the assessment, and the number of significant levels in the health care system.
An experienced two person team of experts might be able to manage a survey of public sector pharmaceuticalprograms in a small-to-medium-sized country in a total of six weeks. The team would spend one weekpreparing for the assessment, three weeks in-country and two weeks analyzing data and writing the report.This assumes that local officials and counterparts were active supporters and participants, and that the healthcare system has no more than three levels to be covered, i.e., central, provincial and district.
In the same country, an additional experienced person would be needed to cover the private sector in detail,and a fourth person would be needed if there were additional levels in the public sector system. The cost of these experts is higher both in terms of salary or fee and travel expenses if internationalconsultants are used; costs may be reduced if there are local experts who have the necessary expertise andexperience.
In addition to the cost of experts (local or international), which includes salary, all travel and per diem, thereare additional costs which must be covered:
! Preparation of data collection forms! Communications! Travel and per diem for local counterparts! Travel and per diem for local data collectors! Cost of personnel to enter data into computers! Miscellaneous local costs during the study
These additional costs usually run between US$2,000 and US$10,000 (as of 1995) depending on the actualcosts for local travel and support. The total cost of a country-wide structured assessment may vary between

Guidelines for Study Design 105
US$50,000 and US$150,000 (again, as of 1995) for a medium-sized country with a pharmaceutical sector ofaverage complexity. This assumes that the principal assessment team members are all internationalconsultants. This is indeed a substantial sum, but it must be remembered that a development project based onthe assessment might be worth US$100 million.
Before any data are collected, it is first necessary to prepare systematically by carrying out seven tasks:
A. Gather vital statistics on the country and the Ministry of HealthB. Prepare an overview of Ministry of Health pharmaceutical management operationsC. Specify a list of indicator drugsD. Design a sample survey of health care facilities and drug retail outlets E. Define approaches for collecting different types of survey data in health facilities and retail
pharmaciesF. Develop data collection forms and structured interview questionnairesG. Define the range of dates which will be used to collect retrospective data
A. Gathering Vital Statistics and Background Information
There are certain vital statistics which are used repeatedly, either to derive specific indicators, or to providecontext when presenting the results in a report. When two or more investigators work on a study, it can easilyhappen, based on interviews with different informants and readings of different documents, that they begin touse and derive different figures, which result in embarrassing divergences in the information presented. Toavoid this problem, the following data should be collected, recorded and distributed to all investigators at thevery outset of the work:
! The dates covered by the government fiscal year! Exchange rates of local currency for U.S. dollars for the periods covered by the data to be collected ! Inflation rates for the previous five years! National and regional population figures! Rates of population increase! Prevalence and incidence of major health problems! Numbers and distribution of MOH health facilities! Numbers and distribution of drug retail outlets! Numbers and distribution of drug wholesalers, distributors and manufacturers
B. Preparing an Overview of MOH Pharmaceutical Management Operations
In order to efficiently carry out an indicators study, usefully interpret the results, and make recommendationsfor system improvement, it is also essential to have an overall picture of current operations. At a minimum,this should include:
! Organigram showing agencies and offices responsible for procurement and distribution. Thisshould include the offices responsible for managing procurement (by both purchase and donation),storage facilities and health facilities.
! List of sources of drugs flowing through the distribution system, and estimated values for eachsource. This should include the central and regional budgets, donors and NGOs.

106 Rapid Pharmaceutical Management Assessment
! For each major source of drugs, to the extent possible, list the annual schedules for budgeting,needs estimation, procurement and distribution.
! Tables showing geographical distribution of warehouses and health facilities.! Delivery schedules for all levels of the system.! Summary of transport arrangements that link storage and health facilities. This should be as
specific as possible, indicating numbers and types of vehicles available by geographic zone. Iftransport is through contract arrangements with parastatal or commercial agencies, describe thosearrangements and indicate the budgets.
! Qualitative descriptions of major problems that affect the movement of drugs through theprocurement and distribution system.
! Staffing patterns that reflect numbers and geographic distribution.
In most settings, it will be possible to create all of these items through interviews and document review.Annex A gives examples of charts and tables developed for one recent study.
C. Specifying a List of Indicator Drugs
Seven indicators are measured on the basis of a standard list of indicator drugs. These include indicatorsrelated to procurement, stock control, drug availability in the public sector, and prices in the private sector.Although it would be ideal to collect data on all drugs flowing through a system, this would usually requiretoo much time and effort. Therefore, data are collected for a standard list of 25 to 50 products, calledindicator drugs. There is no "universal" indicator drug list. An indicator drug list must be developed locallyfor each country wherein assessments take place. While developing the list, keep the following points inmind:
! The list of indicator drugs must include drugs that are commonly used and that should be availableat warehouses and health facilities. Most of the drugs should be drawn from the national formularyor essential drugs list. However, it may also be useful to include one or more drugs which are notfrom these lists, but which local team members believe are used in violation of official policies.
! In country settings where record keeping is generally disorganized and incomplete, it is best to havea longer list of about 50 products. This will help to ensure that data for all indicators are collectedfor a core sample of products, for example, at least 20 to 25.
! It is absolutely essential to involve local experts in the formulation of indicator drug lists. Failure todo so may seriously undermine the credibility of results. For example, co-trimoxazole may be theinternational expert's drug of choice for treating pneumonia in children, but local experts may knowthat ampicillin is used most often in practice. In such a case, it would be desirable to have bothproducts on the indicator drug list.
! The indicator drug list should cover a range of therapeutic categories, as well as importantindividual drugs within each category. If feasible, selection should also be based on drug utilizationdata and on data concerning values of drugs purchased, such as those provided by ABC analysis.For example, the list probably should include antibiotics, cardiovascular drugs, analgesics,parenteral solutions, and representatives of therapeutic categories used to treat diseases importantin the health care system.

Guidelines for Study Design 107
! Normally, all products on the indicator drug list should be authorized for use at all levels of thesystem of the country where the indicators study is taking place. If exceptions are to be made to thisrule, they should be made systematically and with a technical rationale. For example, although anti-hypertensive drugs or antidiabetic drugs may not be available in lower level health facilities, theseproducts may be considered essential for purposes of a given study. If the decision is made toinclude some drugs not used in all facilities, then as a rule of thumb, at least 80% of the products onthe list should be used at all levels.
! Include a range of dosage forms, that is, tablets or capsules, oral liquids, injections, intravenoussolutions and topical products. The matter of dosage forms may be a critical issue. For example, ifthere is a special interest in child survival activities, then it would be important to include availablepediatric dosage forms of products for treating such problems as diarrheal disease, malaria andARI.
! In some surveys it may be useful to include drugs used by vertical programs, such as familyplanning products, in order to incorporate these vertical distribution systems into the survey.
Annex B provides examples of indicator drug lists developed for indicator studies in different countries.
D. Designing a Survey of Health Facilities and Drug Retail Outlets
First, propose a sample design:
The exercise of constructing the overview of pharmaceutical management operations will often reveal thatimportant variations exist within a pharmaceutical procurement and distribution system. Some features ofsystems may vary from region to region, facility to facility, and from prescriber to prescriber. These localvariations might include such items as access to finances, sources of drug supply, ease of access to facilities,condition of inventory records, or patterns of prescribing practices.
It is important to ensure that facilities representing all significant variants of the overall system are includedin the sample. One way to do this is to choose four geographic areas (that is, districts or regions) in which towork, based on an informed division of the country into groupings determined by such variables asgeography, socio-economic factors, population density, or key features of the health care system. Somesuggestions are offered below.
! The capital city and the main population center (if different) should always be included as one ofthe study areas.
! If the country is relatively homogeneous, geographically and epidemiologically, simply choose threeother districts at random.
! If there are varying conditions in different areas of the country that might be expected to influencethe way pharmaceuticals are managed, first organize all districts into groups, based on thesecharacteristics, then select three study districts at random from these groups.

108 Rapid Pharmaceutical Management Assessment
Three examples may make this more clear:
Example 1: (1) Capital city; (2) Highland agricultural district; (3) Lowland agricultural district;and (4) Arid district
Example 2: (1 and 2) Capital city and one other densely settled urban area; and (3 and 4) Tworural agricultural districts
Example 3: (1) Capital city; (2 and 3) Two rural districts with reasonably good transportationlinks; and (4) One relatively inaccessible rural district
Second, select the health facility sample:
It is recommended that at least five health facilities in each of the four selected regions (for a total of 20facilities) be included in the sample. The actual selection of sites should be guided by the following factors:
! The district hospital outpatient unit should always be one of the facilities selected in each studydistrict. Select randomly if there is more than one district hospital in the district.
! For systems organized with only one basic tier of outpatient facilities below the district hospital(for example, rural health centers) select the other four as follows:
- If geographic distances and transportation logistics are such that all facilities can be visited,and all data can be collected in one day, select four of these second level units at random, fromall of those in the district.
- If transportation is more difficult, select two facilities at random, and then choose two otherfacilities that are geographically close to them, so that the paired facilities may be visited inone trip.
! For systems with two tiers below the district hospital level (for example, poly-clinics staffed byphysicians and lower level health posts staffed by paramedics) select the other four facilities asfollows:
- Choose two second level health facilities at random.- For each of those two second level health facilities choose, from among the group of third
level facilities that are geographically close, one site. The result is paired sets of second andthird tier facilities.
! For systems that are organized in a different way, distribute the five facilities to be studied in eachdistrict among the possible types of health facilities, according to such factors as their geographiclocation or patient load.
The most important principle to remember in each phase of this process is random selection. The simplestapproach to random selection is to apply the interval method to site lists. Make sure that the site lists arecomplete and organized alphabetically, and select every n site, where n is determined by dividing the totalth
number of available sites by the desired sample size. For example, if there are 200 sites available, and 20 areneeded for the study, select every tenth site on the list. If there are 40 sites available, select every other site toreach a sample size of 20, and so forth.

Guidelines for Study Design 109
Third, select the drug retail outlet sample:
As with the health facilities, the sample size for drug retail outlets is 20 sites. The most commonly recognizeddrug retail outlets are pharmacies. However, there may be other types, such as over-the-counter (OTC) drugstores. It is important to obtain a clear idea of the different types of outlets operating, their relativeproportions and geographic distributions, and regulations that affect what may be sold. The drug retail outletsample should be selected to include proportional numbers of all major types. To do this, apply the principlesdescribed above for sampling different types of health facilities.
In selecting the drug retail outlet site sample, the simplest approach, from the logistical point of view, wouldbe to choose the site that is geographically closest to each health facility visited. Two problems with thisapproach are that (a) those outlets situated closest to health facilities may not be representative of all outlets;and (b) in some settings where rural health facilities are located, there may be no pharmacies or other drugretail outlets. A better approach, from the point of view of representative sampling, is random selectionwithin each of the four geographic areas in the sample design. The best way to accomplish this is to apply thesystematic interval sampling method to site lists, as described above.
E. Defining Approaches for Collecting Survey Data
Completing the survey design, based on the three steps discussed above, determines where survey data will becollected. That is, it indicates exactly which health care facilities and drug retail outlets will be visited forpurposes of data collection. It is still necessary to specify how the data will be collected. In order to do thiseffectively it is useful to proceed as follows:
! First, develop required survey instruments and forms, to use for collecting each type of data
! Second, visit a few health facilities and drug retail outlets to test the methods
! Third, revise the methods and forms based on the results of the tests
This is a matter wherein design and implementation issues overlap. This section covers the first of thesesteps, that is, suggesting generic approaches to collecting survey data that have been tested in a number ofcountries. It is up to the study investigators to take the information provided here and go on to complete thesecond and third steps. Those two steps will be addressed again in the following chapter.
In Health Facilities
The complete indicator study, as described in chapter 3, specifies that data for 17 indicators be collected inhealth facilities. The information provided on data collection in the indicator descriptions should providesufficient explanation on how to collect the required data for most of the indicators; however, furtherclarification is needed for the drug use indicators. There are two basic options for collecting these data: eitherretrospectively through review of clinical records, or prospectively through observation. Details of the twoapproaches are given below.
For retrospective data collection, the objective is to collect, for each of the six indicators of drug use, data on30 curative outpatient contacts for each of 20 health facilities, which gives a total sample of 600 contacts.This method can only be used if the facility retains, on site, records documenting drug prescribing anddispensing.

110 Rapid Pharmaceutical Management Assessment
! Begin by extracting, from the facility's patient register, a list of names for the first 60 patients seenduring the month preceding the one in which the study takes place. If service levels are too low toyield a list of 60 names for this period, they may be distributed over a number of months, forexample five patients per month for 12 months.
! In rare cases, most or all of the data required may be found right in the register. More commonly,however, it is necessary to consult the individual patient records and/or dispensary records.
! In either case, the next step is to fill out the data collection form, recording information untilcomplete data on all six of the drug use indicators are collected for 30 curative contacts at eachsite. (The reason for beginning with the list of 60 names is that very often the records do notcontain complete data for every contact, so a certain number of names for which data areincomplete will have to be discarded.)
For prospective data collection, the objective is also to collect complete data for 30 curative contacts persite, for each of 20 health facilities.
! One approach is direct observation: data collectors position themselves in drug dispensing areas,and record data for the first 30 patients who come. A potential disadvantage of this approach is thatthe presence of data collectors may influence the behavior of both prescribers and dispensers, andgive non-representative results.
! A second approach is to use the exit poll technique, with data collectors positioned outside thefacilities. The data collectors approach patients leaving the facility and question them about whatdrugs have been prescribed. At large facilities in urban areas, this may avoid the observation biasthat would occur with collecting data at the dispensing point. At modest-sized clinics in small townsettings, it probably will not make any difference, as news that a poll is being taken will quicklymake its way back into the clinic. Another disadvantage of the exit poll approach is that it may bedifficult to get all of the required data from all patients. It may still be necessary to visit thedispensing point and review prescription slips.
! A potential problem with both of these approaches is that in health facilities with low utilizationrates, it could take a considerable amount of time to accumulate 30 observations.
Each of the methods summarized above has been used successfully to collect indicator data on drug use. Inalmost all cases, some modification to the generic approach was required. In at least one case, it wasnecessary to employ both prospective and retrospective data collection in order to obtain complete data for allsix drug use indicators. Retrospective data collection is quicker and easier if prescribing and dispensingrecords are accessible, and if the records are legible, reasonably complete and well organized. Otherwise,prospective data collection is required.
In Drug Retail Outlets
Chapter 3 notes that data for four indicators are collected in pharmacies or other drug retail outlets. Theseindicators include:
! Percentage of unregistered drugs on the market (A.3)! Practice of generic substitution (A.7)! Retail prices paid for indicator drugs (H.7)! Availability of antibiotic products without a prescription (H.9)
Details on how to collect the data for each of these indicators are given below.

Guidelines for Study Design 111
To assess the registration status of drugs on the market, work as follows: At each of the 20 drug retailoutlets visited for the sample survey, select 10 products, and record the complete names and productspecifications. This will produce a list of 200 products. When data are being collected by more than one datacollector, avoid duplication by assigning to each data collector an exclusive range of letters of the alphabet.For example, if there are three data collectors (Joe, Mary and Bob), then Joe should select only productswhose names start with the letters A-H; Mary selects products in the range I-Q; and Bob works with R-Z.
To collect the prices paid for indicator drugs, simply record the pharmacy sales prices of each of theindicator drugs on the appropriate form. If an item is not stocked, skip that drug and go on to the next one.Where a site stocks more than one brand of the same product, record the least expensive one.
Data collectors may use shelf checks to openly collect data for drug registration status and retail prices ofindicator drugs. The matters of practice of generic substitution and availability of antibiotics without aprescription, however, must be handled by a different method. Although either of these practices may becommon, in the case of generic substitution, it may not be legal; in the case of sale of antibiotics withoutprescription, it is illegal in most countries. Therefore, drug sellers may perceive risk in admitting to thesepractices. As a result, if asked directly, they are likely to deny or underreport these practices. Therefore, asimulated purchase survey is used, in which data collectors pose as ordinary customers and request productsubstitutions or attempt to purchase antibiotics without a prescription.
The first step is to recruit the data collectors for simulated purchases. They should be local people whoseappearance and demeanor suggests that they are regularly employed, for example, as vehicle drivers orsecretaries. As the sex of the data collector may affect results of the survey, make sure that all data collectorsare of the same sex.
The data collectors will have two tasks to carry out at each drug retail outlet:
! Present a prescription for a brand name product and request that a cheaper product be substituted! Attempt to purchase an antibiotic product without a prescription
At each site, these tasks should be carried out by different data collectors, and preferably on different days. If,for logistics reasons, these encounters cannot be arranged on different days, they should take place at leastfour hours apart. All data collectors should be trained to carry out both tasks.
! To measure the practice of generic substitution, proceed as follows:
1. Select a brand name of an antibiotic product which is (a) commonly used in the local area fortreatment of general bacterial infections, and (b) at the more expensive end of the range of productsavailable. Examples of appropriate products are the brand name versions of co-trimoxazole,tetracycline or ampicillin. Very often, brands of these products that are produced or licensed bymultinational manufacturers are more expensive than local brands or generically labelledequivalents.
2. Develop a simple scenario, and train data collectors to follow it when visiting drug retail outlets:
- The data collector will be carrying a prescription slip on which is written a prescription for afull course of treatment for the product selected.
- The data collector is coached to respond, if asked, that the prescription is for an adult relativewho has bronchitis.

112 Rapid Pharmaceutical Management Assessment
- The data collector presents the prescription, and asks what will be the cost of filling theprescription.
- Upon hearing the response, the data collector asks the salesperson if he or she has a cheaperversion of the same drug.
- If the salesperson offers a cheaper product, the data collector buys it, and exits the store.- If the salesperson initially refuses to make a substitution, the data collector tries once to gently
persuade him or her.- If the salesperson refuses a second time, the data collector makes no further argument, makes
no purchase, and exits the store without comment.- Upon leaving the store, the data collector records the result of the encounter on the appropriate
form, that is, either: (a) the drug seller declined to make a substitution, or (b) the name of thealternative drug purchased. If the drug seller stated that he/she could not offer a genericsubstitute because none was in stock, this should be recorded.
! To measure the availability of antibiotic products without a prescription, the steps are similar:
1. Select an antibiotic commonly believed to be available through direct over-the-counter sales.
2. Develop a distinct scenario for this indicator and train data collectors to use it.
- The data collector will be carrying a piece of paper with the drug's name on it.- The data collector will tell the salesperson that one of his or her adult relatives is suffering
from diarrhoea (other common conditions such as a bad cough may be used).- The data collector will then say that he or she has used the drug whose name appears on the
piece of paper before, and ask to purchase four tablets.- If the salesperson agrees, the data collector buys the product and exits the store.- If the salesperson initially refuses, the data collector tries once to gently persuade him or her.- If the salesperson refuses a second time, the data collector leaves the store without complaint.- Upon leaving the store, the data collector records the results of the encounter on the
appropriate form.
F. Developing Data Collection Forms and Structured Interview Questionnaires
Two types of formats are required for carrying out the assessment described in this manual. One is datacollection forms, and the other is structured interview questionnaires.
Data for 18 indicators are collected through on-site survey methods, and require data collection forms. Theseinclude 14 to be measured in MOH health facilities and four to be measured in drug retail outlets. (There isone indicator which is measured in both groups of sites.) Eight forms are used for recording the data. Fiveare used in the health facilities and four are used in drug retail outlets.
The 17 indicators measured though on-site surveys and the corresponding forms are given in the Table 3below. There are two sets of these sample forms given in Annex C. The first set contains forms that are filledin with illustrative data, and they are accompanied by brief instructions. The second set contains blank formsthat may be photocopied and used in field tests. It is essential to understand that all of these sample formsare drafts that must be tested and revised prior to launching survey activities in any specific country.

Guidelines for Study Design 113
As has been noted, data for many of the indicators, as well as background information, are collected throughstructured interviews. It is essential that all interview activities be carried out using structured interviewquestionnaires. These must be prepared separately in-country for each indicator assessment. Some fieldtesting of these instruments may be required. Minimally, drafts should be reviewed by local counterparts andrevised before use. An example of a structured interview questionnaire for indicator B.1 is given in Annex D.
G. Defining a Range of Dates for Retrospective Data
Before any data are collected, be sure to define the range of dates to be covered, and make sure that all datacollectors understand which date range is to be used. If this step is omitted, data may not be useful forcomparison of results from the various sites visited. Indicators for which specification of date ranges isparticularly important include:
! All 18 of those for which data are collected through sample survey
! Those that involve budget, expenditure, and market values

Table 3: Indicators to Be Measured with Survey Methods and Data Collection Forms
Indicator Forms
In Health Facilities
A.7 Practice of generic substitution Generic Substitution and Sale of
B.3 Percentage of MOH health facilities visited with the most Inventory Data Formcurrent edition of an official manual based on the NDFL
C.3 Percentage of patients who pay a charge for drugs they receive Charge for Drugs Tally Formin MOH health facilities
E.1 Weighted average percentage of inventory variation for a set of Inventory Data Formindicator drugs in MOH storage and health facilities
E.2 Average percentage of individual variation for a set of indicator Inventory Data Formdrugs in MOH storage and health facilities
E.3 Average percentage of stock records that corresponds with Inventory Data Formphysical counts for a set of indicator drugs in MOH storage andhealth facilities
E.4 Average percentage of a set of unexpired indicator drugs Inventory Data Formavailable in MOH storage and health facilities
E.5 Average percentage of time out of stock for a set of indicator Stockout Data Formdrugs in MOH storage and health facilities
F.4 Average number of drugs prescribed per curative outpatient Drug Use Data Formencounter in MOH health facilities
F.5 Percentage of drugs prescribed by generic name in MOH health Drug Use Data Formfacilities
F.6 Percentage of drugs prescribed from the NDFL in MOH health Drug Use Data Formfacilities
F.7 Percentage of outpatients prescribed injections at MOH health Drug Use Data Formfacilities
F.8 Percentage of outpatients prescribed antibiotics at MOH health Drug Use Data Formfacilities
F.9 Percentage of prescribed drugs presented for dispensing that Drug Use Data Formare actually dispensed in MOH health facilities
Antibiotics Data Form
In Drug Retail Outlets
A.3 Percentage of unregistered drug products in a sample of private Drug Registration Data Formsector drug retail outlets
A.7 Practice of generic substitution Generic Substitution and Sale of Ant
D.3 Percentage of average international price paid for last regular ticsprocurement of a set of indicator drugs Dat
H.7 Average of median private sector drug retail prices as a apercentage of MOH acquisition prices for a set of indicator Fordrugs m
H.9 Percentage of licensed drug retail outlets where an antibiotic International Price Comparison Data Forwas available without a prescription m
ibio
Retail Price Comparison Data Form
Generic Substitution and Sale ofAntibiotics Data Form

V. IMPLEMENTATION OF AN INDICATORS STUDY
The previous chapter began with assurances that the pharmaceutical indicators study is a manageable activity,despite some apparent complexity. Getting valid results does, however, require good organization andmanagement. This chapter discusses some of the practical matters to be resolved in implementing the study.
A. Work Plan
As noted in the preceding chapter, the basic organizational principles for implementing the indicators studyare that: (a) it is composed of two separate data collection efforts; and (b) each of these efforts should bemanaged by one investigator. To recapitulate:
! One investigator should take charge of data collection at the central level, where the primarymethods will be interview and document review; and
! The other investigator should take charge of data collection at regional and health facility levels,where a sample survey employing a range of data collection methods is required. A group of datacollectors will be recruited to undertake actual data collection for the sample survey.
The work to accomplish falls into three phases:
! Preparatory activities
! Primary data collection
! Tabulation and write up
Table 4, below, provides a summary of the work to be carried out by each investigator. Experience suggeststhat three to six weeks are required to complete the basic indicators assessment. This assumes that localofficials are cooperative, that is, that key informants, documents and records may be consulted withoutdifficulty. It also assumes that sample sizes are on the order of five warehouses, 20 health facilities and 20retail outlets, and that qualified data collectors are available.
There are two conditions that can greatly increase time requirements, and they occur frequently:
! Increasing the sample size beyond the standard design of five warehouses, 20 health facilities and20 drug retail outlets
! Expanding the assessment beyond the standard set of 46 indicators, and conducting in-depthanalyses of particular features of overall pharmaceutical management systems, such as procurementoperations, or cost recovery programs
Assuming, however, that the objective is to carry out the basic assessment described in chapter 3, thenexperience suggests that three to six weeks are required for completing all work. Table 4, below, shows anillustrative four-week schedule in which design and preparation are allotted one week, primary datacollection two weeks, and write up one week.

116 Rapid Pharmaceutical Management Assessment
Table 4: Provisional Work Plan
Task Central Level Regional and Health Facility Level
Design andPreparationOne Week
! Gather vital statistics. ! Prepare indicator drug list.
! Prepare system overview. ! Design sample survey.
! Specify data collection date ranges. ! Test data collection methods and forms.
! Assist with training data collectors. ! Recruit and train data collectors.
Primary DataCollectionOne to TwoWeeks
! Carry out central level data ! Launch and supervise the sample survey.collection.
! Collect data to supplement work of datacollectors.
Tabulationand Write UpOne to TwoWeeks
! Collate findings, write report with ! Supervise data tabulation.recommendations.
! Analyze data, write report withrecommendations.
B. Review of Data Collection Methods
The previous chapter described some approaches to data collection, in terms of their implications for studydesign, but it will be useful to review them. The methods to be employed are listed below.
! Structured interviews with key informants
! Reviews of reports and other descriptive documents
! Physical inventories and review of stock records in both storage and health facilities
! Review of clinical records in health facilities
! Observation of clinical encounters
! Shelf checks and price taking in drug retail outlets
! Simulated purchase surveys
Implementation of an Indicators Study 117
Structured interviews with key informants and reviews of documents are the methods through which data formost indicators are collected. This will usually take place using structured questionnaires. In carrying out thiswork, keep two points in mind:
! Informants should be selected for their capacity to provide current and reliable data. Take intoconsideration their official positions, and factors which may bias their views.
! To the extent possible, data collected through interviews should be validated through review ofdocuments or records.
Previous discussions have noted that central level data collection centers on structured interviews anddocument review, and that peripheral level data collection is organized through sample surveys. Within thisgeneral framework, however, it should be noted that physical inventory and review of records is a datacollection activity that take places at all levels.
C. Logistical Arrangements
Recruiting and Training Data Collectors
For the site visit component of the study, it is necessary to recruit and train two groups of data collectors. Thenumber of data collectors recruited will depend on the size of the study sample. For a sample of 20 facilities,five well-trained data collectors in each group would be an appropriate number to carry out the work in areasonable amount of time. The two groups would be designated as follows:
! one group to collect data in health facilities, and to obtain drug registration and price data in drugretail outlets
! another group to carry out the simulated purchases
For the first of these, the most effective data collectors will usually be doctors, pharmacists, nurses orparamedical personnel who have worked in health facilities. There is some risk in using students or otherparties who have no practical experience in working with the record keeping systems which they willencounter. The risks are that the students will have difficulty identifying the required data, the work will beunduly slow and frustrating, and the result may be incomplete or even faked data sets. A related problem,which could produce similar results, lies in recruiting parties, particularly some doctors, who may considerthemselves too senior to carry out the relatively tedious work required.
To minimize both risks, and promote productivity, a very useful strategy would be to pair health careproviders and other workers with experience in storage facilities. This would provide a team that has practicalexperience with product names as well as both the stock and clinical record keeping systems.
No matter who is recruited, however, it is essential that they be trained, and that the training include actualpractice in filling out all forms required for both health facility and drug retail outlet data collection. Table 5(see page 128), illustrates a model training course which may be adapted to suit local circumstances.

118 Rapid Pharmaceutical Management Assessment
Finding data collectors for the simulated purchases poses less of a recruiting problem. No technical expertiseis required to do this quick and simple work. It is, however, very important to train the data collectors throughrole playing, and to verify that they understand what to do by observing their performance in two or threeencounters in drug retail outlets. This can be set up with the help of a sympathetic store owner whose storecould be used as a training site.
Scheduling, Additional Staffing, Transport and Authorizations
Scheduling is a complicated issue which is affected by factors such as the average time required to collectdata in each site, the number of data collectors available, distances between sites, and transport arrangements.It is best to begin by thinking in terms of averages, and then make refinements by considering the geographicimplications of the site sample of the study. Experience with the indicator studies completed so far suggeststhat, on average, about one day of data collection time and one to two days of travel time are required forcompleting work at one health facility.
This suggests that five data collectors, each working in four sites, would require 10 work days each, orperhaps 11 to 12 calendar days for the whole group to travel out, complete work, and travel back. The timerequired for covering the drug retail outlets must also be considered. For this group of sites, however, worktime is shorter, so the main variable is geographic distribution.
Thus far, discussions have covered the roles of the study investigators and the data collectors. Other types ofstaffing which may be required include one or more data collection managers, to supervise and coordinategroups of data collectors, persons to enter or process collected data, and drivers. It should be clear that thepractical problems of managing a data collection schedule will be greatly simplified by employing these typesof workers. Not employing them to save money will be false economy in most cases.
Concerning transport, it is certainly faster to chauffeur data collectors directly to sites, but buses or otherpublic transport can also be used. In some cases, combination approaches will be useful, in which some datacollectors working in closely grouped sites are ferried around by drivers, while others, who are going toremote sites, take the bus.
One important detail which can cause serious problems if overlooked is the matter of letters of authorization.Each data collector, supervisor, and investigator should be provided with letters from the appropriateauthority (such as MOH) which introduce the bearer, request cooperation, and authorize data release. Lettersfrom different authorities may be required for visits to health facilities and drug retail outlets. Wheneverpossible, central level officials should inform the health facility authorities by telephone communication orradio prior to the arrival of the data collectors.
D. Analyzing Data and Presenting Results
In order to avoid major confusion and a mad scramble at the end of an assessment it is advisable to collateand prepare data for analysis as it is collected. If a computerized system for collating survey results is used,data should be entered at night by team members (or by a local data entry person). Team members andcounterparts should all play an active role in examining data and considering what type of additional analysesmay be appropriate, in addition to those prescribed in the assessment workplan.
It is important to realize that no matter how well the assessment was designed and planned, the data obtainedmay not be totally reliable, for any number of reasons. Part of the job of the study team, when analyzing data,

Implementation of an Indicators Study 119
is to determine what biases, inaccuracies or inconsistencies may exist, and what precautions are necessary ininterpreting the data. When developing presentations for policy makers, it is advisable to present a very clearexecutive summary and to the extent possible, present key findings, recommendations and projections ofimpact graphically as well as in text or table form.

Table 5: Illustrative Training Course for Data Collectors in Health Facilities and Drug Retail Outlets
Topic Materials Time
1. Overview of the indicator study Briefing package 1 hour- What the study is and why MOH is interested- Role of data collectors- Work to be carried out in both health facilities and drug
retail outlets- Work schedule and compensation- Location of sites to be visited
2. How the data are collected Complete set of 8 forms 1-2 hours- Review types of data to be collected in both health
facilities and drug retail outlets.- Group the forms into one set for each type of site; review
them one by one and field by field.
3. Practice session for entering data Complete set of eight forms 1-2- Begin with the five health facility forms. Use poster- hours
sized examples to lead class through filling out eachfield.
- Standardize data recording, e.g., abbreviations, decimalpoints, format for large numbers, format for numerals.
- Repeat this exercise for the three drug retail outlet forms.
4. How to draw a sample of patient encounters from health Sample register and patient 1 hourfacility records encounter form
5. Practice session in health facility Set of five health facility forms 1 day- Visit and collect a complete set of data using all five
forms.- Critique performances and trouble shoot problems.
6. Practice session in retail outlet Set of three drug retail outlet 1/2 day- Visit and collect a complete set of data using all three forms
forms.- Critique performances and trouble-shoot problems.
7. Final discussion Schedules; letters of 1/2 day- Review experiences of field test and address concerns introduction; sets of forms for
and questions. each site; expense money- Discuss revisions in forms, if any have been made since
the visits.- Assign data collectors to teams or groups, as required.- Finalize schedule and logistics arrangements.

Annex A: Sample Materials for an Overview of PharmaceuticalManagement

1
LMD WAREHOUSE
4
REGIONAL MEDICAL
STORE
REGIONAL MEDICAL
STORE
REGIONAL MEDICAL
STORE
REGIONAL MEDICAL
STORE
REGIONAL MEDICAL
STORE
3
2 PATHALAYA STORE
OVERVIEW OF PUBLIC SECTOR DRUG DISTRIBUTION SYSTEM BY LEVELS AND REGIONS, NEPAL
MOUNTAINS FAR WESTERN MID WESTERN WESTERN CENTRAL EASTERN REGION REGION REGION REGION REGION
MAIN SUPPLIERS:
* ROYAL DRUGS
* SAJHA
* DONORS
* NGOS
HILLS
TERAI EAST-WEST HIGHWAY
ROAD FROM INDIA
5
NORTH
SOUTH
KEY:1. Central Procurement Level 2. Transit warehouse for goods entering the country3. East-west highway to distribute to 5 Regional Medical Stores4. Regional Medical Stores in the 5 country regions5. Logistics Management Division's central warehouse
Drug imports
Annex B 123

SUMMARY OF STORAGE FACILITIES AT REGIONAL LEVEL, NEPAL 10
NUMBER NUMBER SPACE INREGION OF DISTRICTS FACILITY OF ROOMS SQUARE FEET
FAR WESTERN 9DHANGADI OLD MEDICAL STORE 4 1,904
NEW MEDICAL STORE 4 2,130 MALARIA STORE 3 750
TOTAL 11 4,964
MID WESTERN 15NEPALGANJ MEDICAL STORE #1 6 2,486
MEDICAL STORE #2 2 1,000 OLD OFFICE BUILDING 7 766
TOTAL 15 4,662
WESTERN 16BUTWAL MEDICAL STORE #1 2 2,180
MEDICAL STORE #2 2 1,100BHAIRAHAWA MALARIA STORE 9 1,024
TOTAL 13 4,304
CENTRAL 19HETAUDA MEDICAL STORE 7 3,086
MALARIA STORE 2 312
TOTAL 9 3,398
EASTERN 16BIRATNAGAR MEDICAL STORE 6 2,486
MALARIA STORE 3 578 EPI STORE 4 440
DHARAN MEDICAL STORE 27 5,935
TOTAL 40 9,439

LOCATIONS OF REGIONAL HEALTH OFFICES AND MEDICAL STORES, NEPAL 11
HOURS OF TRAVELLOCATION OF LOCATION OF TIME DRIVING
REGION REGIONAL HEALTH OFFICE REGIONAL MEDICAL STORE FROM KATHMANDU
CENTRAL KATHMANDU HETAUDA 6.5
WESTERN POKHARA BUTWAL 5.0
MID WESTERN SURKHET NEPALGANJ 4.0
FAR WESTERN SILGADHI DHANGADHI 4.0
EASTERN DHANKUTA DHARAN 2.0

DISTRIBUTION OF HEALTH DELIVERY FACILITIES, NEPAL
BY REGIONSUB STATIC ILAKA HEALTH DISTRICT ZONAL REGIONAL CENTRAL
REGION HEALTH POST HEALTH POST HEALTH POST CENTER HOSPITAL HOSPITAL HOSPITAL HOSPITAL
Central 45 171 6 15 2 0 5 Western 4 144 2 15 1 1 0
Mid Western 16 135 5 9 1 0 0
Far Western 19 81 1 8 2 0 0
Eastern 27 144 4 14 3 1 0
TOTALS +/-300 111 675 18 61 9 2 5
BY ECOLOGICAL BELTSUB STATIC ILAKA HEALTH DISTRICT ZONAL REGIONAL CENTRAL
REGION HEALTH POST HEALTH POST HEALTH POST CENTER HOSPITAL HOSPITAL HOSPITAL HOSPITAL
Mountain 12 144 8 12 0 0 0
Hill 84 351 9 34 0 1 5
Terai 45 180 1 15 9 1 0
TOTALS +/-300 141 675 18 61 9 2 5

Annex B: Sample Lists of Indicator Drugs

LIST OF INDICATOR DRUGS, EL SALVADOR
DESCRIPTION STRENGTH FORMFARMACOS
CLOROQUINA 250 MG TAB CLOROQUINA 25 MG/5 ML SUS CLOROQUINA + PRIMAQUINA 150 MG + 15 MG TAB CLOROQUINA + PRIMAQUINA 75 MG + 7.5 MG TAB MEBENDAZOL 100 MG TAB METRONIDAZOL 500 MG TAB METRONIDAZOL 125 MG/5ML JAR CLORANFENICOL 250 MG CAP ERITROMICINA 250 MG/5ML JAR ERITROMICINA 500 MG TAB PENICILINA G BENZATINICA 2.400.000 IU AMP PENICILINA G PROCAINA 4.000.000 IU AMP TRIMETOPRIMA + SULFAMET0XAZOL 40 MG +200 MG/5 ML JAR TRIMETOPRIMA + SULFAMET0XAZOL 160 + 800 MG TAB AMOXICILINA 125 MG/5 ML JAR AMOXICILINA 500 MG CAP AMPICILINA 500 MG CAP L-ALFA METIL DOPA 500 MG TAB ACIDO FOLICO TAB 5 MG TAB HIERRO (SULFATO) 125 MG/ML GOT HIERRO (SULFATO) 300 MG TAB IBUPROFENO 400 MG TAB ACETAMINOFENO 120 MG/5 ML JAR ACETAMINOFENO 500 MG TAB CLORFENIRAMINA 2 MG/5 ML JAR CLORFENIRAMINA 4 MG TAB ALUMINIO + MAGNESI0 200 MG/4 ML JAR FENITOINA SODICA 100 MG CAP MULTIVITAMINAS + MINERALES JAR MULTIVITAMINAS + MINERALES GRA SALES DE REHIDRATACION SBR BENZILO BENZOATO 20% LOC TOLNAFTATO FRA CLOTRIMAZOL 1% TUB

LIST OF INDICATOR DRUGS, EL SALVADOR, CONT.
DESCRIPTION STRENGTH FORMINSUMOS DE PLANIFICACION FAMILIAR CONDONES PRESERVATIVO DE LATEX ANOVULATORIO ORAL CICLO DE TABLETAS
INSUMOS MEDICOS JERINGA DESCARTABLE 3 ML CON AGUJA 22 X 1" JERINGA DESCARTABLE P/BCG Y TUBERCULINA 1 ML CON AGUJA 25 X
5/8" ALGODON HIDROFILO ABSORBENTE LIBRA ESPARADRAPO 2" X 12" X 10 YDS BATON VENDA DE GASA 4" X 10 YDS BAJA LENGUAS DE MADERA PIEZA PALILLOS APLICADORES 6" SIN ALGODON TERMOMETRO ORAL PIEZA CLORURO DE BENZALCONIO 1% SOLUCION ALCOHOL DESNATURALIZADO AGUA OXIGENADA SUTURA 3.0 CON AGUJA PIEZA

LIST OF INDICATOR DRUGS, GUATEMALA
DESCRIPTION STRENGTH FORMACETAMINOFENO 120MG/5ML JARACETAMINOFENO 500MG TABACIDO ACETIL SALICILICO 500MG TABFENOBARBITAL 100MG TABMETRONIDAZOL 250MG TABAMPICILINA 500MG TABAMPICILINA 125MG/5ML SUSPPENICILINA PROCAINA 4,000,000 IU VIALTETRACLICLINA 500MG TABCO-TRIMOXAZOL 80/400MG TABMEBENDAZOL 100MG TABCLOROQUINA FOSFATO 250MG TABSULFATO FERROSO 300MG TABSALES DE REHIDRATACION ORAL SBRTOXOIDE TETANICO AMPBENZOATO DE BENCILO 25% LOCCLORANFENICOL 1% UNG OFTVIOLETA GENCIANA 1% SOLISONIAZIDA 100MG +450 MG TABRIFAMPICINA 300MG TAB

LIST OF INDICATOR DRUGS, GHANA
DESCRIPTION STRENGTH FORMACETYLSALICYLIC ACID 325MG TABAMODIAQUINE 200MG TABAMOXYILLIN 25MG/ML SUSAMOXYCILLIN 250mg TABCHLORAMPHENICOL 250MG TABCHLOROQUINE 150MG TABCHLORPHENIRAMINE 4MG TABCO-TRIMOXAZOLE 480MG TABDEXTROSE IN WATER, I.V. 5% VIALDIAZEPAM 5MG TABFERROUS SULFATE 60MG IRON TABFOLIC ACID + IRON 1MG/60MG TABFRUSEMIDE 40MG TABMEBENDAZOLE 100MG TABMETRONIDAZOLE 250MG TABMULTIVITAMIN BP TABORAL REHYDRATION SALT BP POWPARACETAMOL 500MG TABPENICILLIN PROCAINE 4MU VIALPENICILLIN, BENZYL 5MU VIALPIPERAZINE CITRATE BP ELIXIRRESERPINE 0.25MG TABTETANUS TOXOID VACCINE LIQ

LIST OF INDICATOR DRUGS, ORGANIZATION OF EASTERN CARIBBEAN STATES
DESCRIPTION STRENGTH FORMAMOXYCILLIN (100ML) 125MG/5ML POWAMOXYCILLIN 250MG TABAMPICILLIN 500MG POWANTACID (AL+MAG.OH) (360ML) SUSPBACITRACIN (15GM) OINTCAPTOPRIL 25MG TABCEPHRADINE 500MG TABCHLORPROPAMIDE 250MG TABCOUGH EXPECTORANT (2000ML) SYRUPDEXTROSE (1000ML) 5% VIALDIAGNOSTIC URINE, GLUCOSE-PROTEIN (50) STRIPSDIGOXIN 0.25MG TABERYTHROMYCIN 250MG TABIBUPROFEN 400MG TABIMIDAZOLE PESSISOPHANE INSULIN (10ml) 100U/ML VIALMETHYLDOPA 500MG TABORAL REHYDRATION SALT BP POWPARACETAMOL 500MG TABPARACETAMOL (150ML) 120MG/5ML SUSPPHENYTOIN 100MG TABTIMOLOL MALEATE (5ML) 0.5% DROPSMEDROXY PROGESTERONE LIQCONDOM DISPORAL CONTRACEPTIVE LO-FEMENAL PILL

LIST OF INDICATOR DRUGS, NEPAL
DESCRIPTION STRENGTH FORMASPIRIN 300 MG TABALUMINIUM HYDROXIDE 250 MG TABAMOXICILLIN 250 MG TAB/CAPPENICILLIN G 1 MU INJCHLORPHENAMINE 4 MG TABDIAZEPAM 5 MG/2 ML INJERGOMETRINE 0.5 MG INJFERROUS SALT 60 MG TABHYDROCHLOROTHIAZIDE 50 MG TABISONIAZID 100 MG TABMEBENDAZOLE 100 MG TABORS SACHET PDRPARACETAMOL 500 MG TABPARACETAMOL 125 24MG/ML SYRPROCAINE PENICILLIN .3 MU INJPROCAINE PENICILLIN .4 MU INJRIFAMPICIN 150 MG TAB/CAPSTREPTOMYCIN 1 G INJSULPHA/TRIMETHOPRIM 400/80 MG TABTETRACYCLINE 250 MG CAPDOXYCYCLINE 100 MG CAPTETRACYCLINE EYE OINT. 1% TUBTHIACETAZONE/ISONIAZID 150/300 MG TABWATER FOR INJ 5 ML INJ

Annex C: Sample Data Collection Forms

Annex C 137
Drug Registration Data Form
This form is used for the indicator listed below.
A.3 Percentage of unregistered drug products in a sample of private sector drug retail outlets
Data Collection Summary:
The data for this indicator is collected in drug retail outlets and at the Drug Regulatory Authority. In a sampleof 20 retail sites, data collectors collect, directly from the shelves, the brand names, generic names, manufacturerand/or supplier and license numbers of 200 products. In a sample of 20 sites, this would mean that data for 10products are collected at each site. Next, for each product recorded, the study organizers check with the DrugRegulatory Authority to determine whether it is registered. Each data collector is given a different range of lettersfrom which to select brand name products, in order to avoid duplication.
Instructions:
1. Date: Fill in the date on which the data are collected.
2. Name of Outlet: Fill in the name of the drug retail outlet in which data are being collected.
3. Type of Outlet: Fill in the type of drug retail outlet, for example, pharmacy or over-the-counter(OTC) drug store.
4. Location: Fill in the geographic location of the outlet, which will usually be the name of a region,district, city or town.
5. Data Collector: Fill in the name of the person collecting the data.
6. Brand Name: Fill in the brand name of the product, and include its dosage form. Select product basedon brand name in the assigned alphabet range.
7. Manufacturer and/or Supplier: Fill in the name of the manufacturer and/or supplier of the product.
8. Generic Name: Fill in the generic name of the product, and include its dosage form and strength.
9. License Number: Fill in the license number, marketing authorization number or registration number,if any, for the product.
10. Registered?: Enter "1" (one) if the product is registered, or "0" (zero) if it is not registered.
Note: All blanks should be filled in on this data collection form. Enter "N/A" if data for a particular itemis not available.

DRUG REGISTRATION DATA FORM
DATE 14 September 1994NAME OF OUTLET Nova FarmaciaTYPE OF OUTLET PharmacyLOCATION M anabiDATA COLLECTOR D iego Guerra
BRAND NAME MANUFACTURER GENERIC NAME LICENSE NUMBER REGISTERED?(DOSAGE FORM) AND/OR SUPPLIER (DOSAGE FORM & STRENGTH)
Anasor tab. Alpha Acetaminophen tab. 500mg DGSEF2820-3 1Actifed tab. Phasur Pseudophedrine/ Tripolidine tab DGSEF 6641 1Acimet tab. Alpha Cimetidine tab. 300mg DGS 6439 1Bactamox susp. Alpha Amoxycillin susp. 250mg M - 009463 1Betnouate crm. I npharm Betamethasone crm. 0.1% 1865 - 3 1Benzan lot. NorthCanestan vag. crm. Phasur Clotrimazole vagcrm 1% 20gm. DGS 4272 - 2 1Clyss-Go Phasur Dioctyl Sod. Sulfasuccinate sol. DGS 299 -2 1
50mg/ 15mlChloromycetin I npharm Chloramphenicol cap. 300mg N/ A
USE WITH INDICATOR: A.3 Key: 1=registered; 0=not registered

Annex C 141
Generic Substitution and Sale of Antibiotics Data Form
This form is used for the indicators listed below.
A.7 Practice of generic substitution
H.9 Percentage of licensed drug retail outlets where an antibiotic was available without a prescription
Data collection summary:
Data for both indicators are collected using simulated purchases. Details are provided in chapter 4, sectionE, "Defining Approaches for Collecting Survey Data." In this example, data collector Mary Smith, wasassigned to visit eight drug retail outlets. At the first four of them she requested product substitutions, andat the second four of them, she attempted to purchase antibiotics without a prescription.
Instructions:
1. Date: Fill in the date on which data are collected. Use a separate form for each date.
2. Data Collector: Fill in the name of the person collecting the data, that is, the name of the datacollector who carries out the simulated purchase.
3. Simulated Purchase Product: Record, first, the brand name of the product to be used in thesimulated purchase encounters, followed by the generic name in parenthesis.
4. Name of Outlet: Data collectors will have lists of sites to visit. Fill in the names of the sitesimmediately after the simulated purchase encounter takes place.
5. Made Substitution?: Use the two columns below this heading for recording the results of encounterswherein data collectors request product substitution. Data entries should be made only after theencounter is completed and the data collector has left the store, and cannot be observed filling out theform.
Yes/Product: If the sales person agrees to make the product substitution, record the name here of theproduct actually sold. Later, in order to compute this indicator, it will be necessary to consult an indexof brand and generic names to determine if those products substituted for the original simulatedpurchase product are chemically equivalent. Enter "1" (one) in the blank if the product substitution ismade, or "0" (zero) if it is not.
6. Sold Antibiotic?: Use the column below this heading for recording the results of encounters whereindata collectors attempt to purchase an antibiotic product without a prescription. Data entries shouldbe made only after the encounter is completed and the data collector has left the store, and cannot beobserved filling out the form.
Yes: Enter "1" (one) in the column if the sales person sold the antibiotic, as requested, or "0" (zero)if the sales person declined to sell the antibiotic.
Note: All blanks should be filled in on this data collection form. Enter "N/A" if data for a particularitem is not available.

GENERIC SUBSTITUTION AND SALE OF ANTIBIOTICS DATA FORM
DATE 2 Feb. 1993 SIMULATED PURCHASE PRODUCT
DATA COLLECTOR M ary Smith Septra (co-trimoxazole)
MADE SUBSTITUTION? SOLD ANTIBIOTIC?NAME OF OUTLET YES PRODUCT YES
Arrow Pharmacy 0Quality Drugs 1 Bactrim
Pharmacy Center 1 Co-trimoxazoleH illcrest Pharmacy 0V alue Drug Center 1Seaview Pharmacy 0Popular Pharmacy 1
Star Drugstore 1
USE WITH INDICATOR: A.7, H.9 Key: 1=yes; 0=no

Inventory Data Form
This form is used for indicators listed below.
B.3 Percentage of MOH health facilities visited with the most current edition of an official manual basedon the NDFL
E.1 Weighted average percentage of inventory variation for a set of indicator drugs in MOH storage andhealth facilities
E.2 Average percentage of individual variation for a set of indicator drugs in MOH storage and healthfacilities
E.3 Average percentage of stock records that corresponds with physical counts for a set of indicator drugsin MOH storage and health facilities
E.4 Average percentage of a set of unexpired indicator drugs available in MOH storage and health facilities
Data collection summary:
For indicator B.3, which measures the availability of manuals based on the National Drug Formulary List,data collectors should ask staff to produce the document. Although this indicator is intended primarily foruse in health facilities, it makes sense to take the measure in storage facilities too.
For indicators E.1-E.4, data are taken from any or all of computerized stock record keeping systems, manualstock ledgers or stock record cards and bin cards. Details are given in the indicator descriptions concerninghow to collect the data from these types of records, as well as how to make required adjustments for recentreceipts and issues, and take physical counts. The indicator descriptions also provide examples of how touse the data collected on this form to compute the indicators.
1. Date: Fill in the date on which data are collected. If at all possible, these data should be collected on thesame day.
2. Facility Name: Fill in the name of the warehouse or health facility in which the data are being collected.
3. Facility Type: Fill in the type of facility in which the data are being collected, for example, warehouse,district hospital, health center or health post.
4. Location: Fill in the geographic location of the facility in which the data are being collected, usually thename of a region, district, city or town.
5. Data Collector: Fill in the name of the person collecting the data.
6. Manual Available?: Check "Yes" if staff are able to produce the most recent edition of a manual basedon the National Drug Formulary List or National Essential Drug List. Check "No" if staff cannot producethis document. Record its year and title.
7. Data Collected From: Indicate if the data presented in the form are collected from a computerized system,manual ledger or stock record cards, or tally sheets or bin cards. In cases where more than one of thesesystems is being assessed, for example, the manual ledger and bin cards, it will be necessary to fill out thisform separately for each system.
144 Rapid Pharmaceutical Management Assessment
8. Product: In this column the list of 25 to 50 indicator drugs being used for the assessment should be pre-printed. For each indicator drug, the generic name, dosage form and strength should be included.
9. Counting Unit: In this column, indicate the smallest unit by which the product is counted.
10. Record Count: In this column write the number of units of each product shown to be present by the recordsystem.
11. Recent Receipts and Recent Issues: It is often and understandably the case that posting of record keepingsystems may lag behind recent receipts and issues of stock. For each of the indicator drugs, after the recordcount has been entered, ask staff to add up all receipts and all issues not yet reflected in the records. Enterthe results of this exercise in these two columns.
12. Adjusted Total: This column is for recording the adjusted total of the record count, taking into accountthe recent receipts and issues. For each indicator drug, make the following calculation, and enter the resultin this column:
Adjusted = Record Count + Recent Receipts - Recent Issues
13. Physical Count: For each indicator drug take a physical count of the number of units actually present.Record the results in this column.
14. How to calculate these indicators: Indicators E.1-E.4 are all derived or calculated using the data enteredinto the six preceding columns. Instructions and examples on how to compute and present these indicatorswill be found in the individual indicator descriptions.
Note: All blanks should be filled in on this data collection form. Enter "N/A" if data for a particular itemis not available.

INVENTORY DATA FORMDATE February 5, 1993 Manual Available? [ ] Yes [X ]NoFACILITY NAME Central Medical Store Year:_____ Title:_________________________________FACILITY TYPE Warehouse Data Collected from: [ ] Computer SystemLOCATION Freetown [X] Manual Ledger or Stock Record CardsDATA COLLECTOR Bob Smith [ ] Tally Sheets or Bin Cards
COUNTING RECORD RECENT RECENT ADJUSTED PHYSICALPRODUCT UNIT COUNT RECEIPTS ISSUES TOTAL COUNT
Acetylsalicylic acid tab 500mg 100 tab 140,000 50,000 70,000 120,000 119,000Amoxycillin tab 250mg 100 tab 160,000 40,000 20,000 180,000 180,000Erythromycin tab 250mg 100 tab 80,000 80,000 30,000 130,000 140,000Co-trimoxazole tab 80/400mg 100 tab 124,000 0 40,000 84,000 80,000Penicillin Procaine vial 80000MU vial 0 0 0 0Oral rehydration salts sachet sachet 50,000 0 20,000 30,000 30,000Aminophylline 100mg/ml amp. (1ml) ampoule 100,000 20,000 15,000 105,000 100,000Mebendazole tab 100mg 100 tab 175,000 90,000 60,000 205,000 205,000Chloroquine tab 150mg 100 tab 150,000 45,000 30,000 165,000 160,000Ergometrine tab 0.2mg 100 tab 90,000 60,000 40,000 110,000 110,000Glibenclamine tab 5mg 100 tab 0 0 0 0Metronidazole tab 250mg 100 tab 120,000 55,000 70,000 105,000 105,000Nystatin cream 100000 IU/g (15g) tube 130,000 70,000 60,000 140,000 140,000Paracetamol susp. 100mg/ml bottle 170,000 60,000 55,000 175,000 180,000Rifampicin tab 300mg 100 tab 60,000 10,000 30,000 40,000 40,000Isoniazid tab 100mg 100 tab 140,000 0 20,000 120,000 100,000Salbutamol tab 2mg 100 tab 80,000 40,000 10,000 110,000 50,000Vitamin A tab 200000 IU 100 tab 150,000 70,000 60,000 160,000 150,000Multivitamin tab 100 tab 160,000 50,000 70,000 140,000 135,000Ferrous Sulfate oral sol. 40mg/ml 1000ml bottle 100,000 60,000 80,000 80,000 80,000Mefloquine tab 250mg 100 tab 125,000 0 50,000 75,000 75,000Cimetidine tab 200mg 100 tab 0 0 0 0Benzyl Benzoate lotion 25% (1000ml) bottle 137,000 30,000 45,000 122,000 120,000Diazepam tab 5mg 100 tab 110,000 40,000 60,000 90,000 90,000Dextrose in Water 5%, IV (500ml) bottle 0 0 0 0USE WITH INDICATOR: B.3, E.1, E.2, E.3, E.4

Annex C 147
Charge for Drugs Tally Form
This form is used for the indicator listed below.
C.3 Percentage of patients who pay a charge for drugs they receive in MOH health facilities
Data collection summary:
Data for this indicator are collected either retrospectively from records or prospectively through observation.At each facility in a sample of facilities record, for thirty consecutive patients receiving drugs, whether ornot they pay a charge. Details on how charges for drugs are defined for purposes of this indicator will befound in the descriptions for indicators C.2 and C.3.
Instructions:
1. Data Collector: Fill in the name of the person collecting the data.
2. Site and Date: There is one column for each site at which data are collected. Results for five sites canbe tallied on one sheet. In this space, record the name of the site and the date on which the data arecollected.
3. Numbered Rows: For each site column, there are thirty numbered rows. Whether making the tallyfrom records or through observation, enter "1" (one) for patients who pay a charge, or "0" (zero) forpatients who pay no charge. By counting up the total of ones and dividing by the total number ofpatients in the sample for whom observations are recorded, the percentage of patients paying a chargecan be calculated. Details and examples on how to compute and present this indicator will be found inthe indicator description.
Note: All blanks should be filled in on this data collection form. Enter "N/A" if data for a particular itemis not available.

CHARGE FOR DRUGS TALLY FORM
DATA COLLECTOR: M ary Smith
SITE AND DATE SITE AND DATE SITE AND SITE AND SITE ANDDATE DATE DATE
National Children’s M etropolitan H ealth K eta District Tema H ealth Puengasi SubcenterH ospital 2/ 15/ 93 Center 2/ 15/ 93 H ospital 2/ 16/ 93 Center 2/ 16/ 93 2/ 17/ 93
1. 1. 1. 1. 1.1 1 1 0 12. 2. 2. 2. 2.1 0 0 1 13. 3. 3. 3. 3.1 0 1 0 04. 4. 4. 4. 4.0 0 1 0 15. 5. 5. 5. 5.0 1 1 1 16. 6. 6. 6. 6.1 0 0 1 07. 7. 7. 7. 7.1 0 0 1 08. 8. 8. 8. 8.0 1 0 0 19. 9. 9. 9. 9.0 0 1 0 110. 10. 10. 10. 10.0 0 0 1 011. 11. 11. 11. 11.0 0 1 0 012. 12. 12. 12. 12.1 1 0 1 013. 13. 13. 13. 13.0 1 0 0 014. 14. 14. 14. 14.0 0 1 1 115. 15. 15. 15. 15.1 1 1 1 116. 16. 16. 16. 16.1 0 0 1 017. 17. 17. 17. 17.0 0 1 0 118. 18. 18. 18. 18.0 0 0 1 119. 19. 19. 19. 19.1 1 0 0 120. 20. 20. 20. 20.1 1 1 1 021. 21. 21. 21. 21.0 1 0 1 022. 22. 22. 22. 22.1 0 1 1 123. 23. 23. 23. 23.0 1 1 0 024. 24. 24. 24. 24.1 1 0 0 025. 25. 25. 25. 25.1 0 1 0 126. 26. 26. 26. 26.0 0 1 1 127. 27. 27. 27. 27.0 0 0 1 028. 28. 28. 28. 28.1 0 1 0 129. 29. 29. 29. 29.1 0 0 1 030. 30.0 0 30. 30. 30.0 0 0
USE WITH INDICATOR: C.3

Annex C 151
Stockout Data Form
This form is used for the indicator listed below.
E.5 Average percentage of time out of stock for a set of indicator drugs in MOH storage and healthfacilities
Data collection summary:
Data for this indicator are collected for each indicator drug from the central stock record keeping system inplace in a given facility. This may be a computerized system or manual system based on ledgers or stockrecord cards.
Instructions:
1. Date: Fill in the date on which the data are collected.
2. Facility Name: Fill in the name of the warehouse or health facility where the data are collected.
3. Facility Type: Fill in the type of facility in which data are being collected, for example, warehouse,district hospital, health center or health post.
4. Location: Fill in the geographic location of the facility in which the data are collected, usually thename of a region, district, city or town,
5. Data Collector: Fill in the name of the person collecting the data.
6. Product: The list of 25 to 50 indicator drugs being used for the assessment should be pre-printed inthis column. For each indicator drug, the generic name, dosage form and strength should be included.
7. Numbered Columns: To the right of the product names are twelve columns numbered in order from1 to 12. They are for the twelve months preceding the one in which the data are being collected. Foreach product, record, for each of the twelve months, the number of days in which that product was outof stock.
8. Total Days Out: In this column, enter for each product, the total number of days, over the twelvemonth period, that the product was out of stock. In other words, for each product, add up the numbersin each of the twelve columns to the left and enter the total here.
9. To calculate this indicator: Instructions and examples on how to use the data collected on this formto compute and present the indicator will be found in the indicator description.
Note: All blanks should be filled in on this data collection form. Enter "N/A" if data for a particular itemis not available.

STOCKOUT DATA FORMDATE 5 February 1993FACILITY NAME Central M edical StoreFACILITY TYPE W arehouseLOCATION FreetownDATA COLLECTOR Bob SmithPRODUCT Month 1 Month 2 Month 3 Month 4 Month 5 Month 6 Month 7 Month 8 Month 9 Month 10 Month 11 Month12 TOTAL DAYS OUT
Acetylsalicylic acid tab 500mg 0 0 0 0 0 0 0 0 10 5 0 0 15Amoxycillin tab 250mg 0 0 15 30 0 0 0 0 0 0 13 12 70Erythromycin tab 250mg 0 0 0 0 10 10 0 0 0 0 0 0 20Co-trimoxazole tab 80/400mg 31 15 0 0 0 0 0 0 0 31 30 31 138Penicillin Procaine vial 80000MU 0 0 0 0 10 0 0 0 7 5 0 0 22Oral rehydration salts sachet 0 0 1 30 31 15 0 0 0 0 0 0 107Aminophylline 100mg/ml amp. (1ml) 0 0 0 0 0 0 0 0 10 31 30 15 86Mebendazole tab 100mg 0 0 0 0 0 0 0 0 0 0 0 0 0Chloroquine tab 150mg 0 15 31 30 10 0 0 0 0 0 0 0 86Ergometrine tab 0.2mg 0 0 0 0 0 0 0 0 0 0 0 0 0Glibenclamine tab 5mg 31 28 0 0 0 0 0 15 15 0 0 0 89Metronidazole tab 250mg 0 0 0 0 18 12 0 0 0 0 0 0 30Nystatin cream 100000 IU/g (15g) 5 28 13 0 0 0 0 0 0 0 0 0 46Paracetamol susp. 100mg/ml 0 0 0 0 21 0 13 0 0 0 20 12 66Rifampicin tab 300mg 0 0 0 0 0 0 0 0 0 0 0 0 0Isoniazid tab 100mg 0 0 6 10 0 0 12 14 0 0 0 0 42Salbutamol tab 2mg 0 0 0 9 17 0 0 0 0 0 0 0 26Vitamin A tab 200000 IU 0 0 0 0 0 8 5 0 0 0 0 0 13Multivitamin tab 0 0 0 0 0 0 0 0 15 20 30 30 95Ferrous Sulfate oral sol. 40mg/ml 1000ml 31 28 30 22 30 30 0 0 0 0 0 0 171Mefloquine tab 250mg 0 12 0 0 0 16 15 0 0 0 0 0 43Cimetidine tab 200mg 0 0 0 0 0 12 31 31 30 31 30 31 196Benzyl Benzoate lotion 25% (1000ml) 0 0 0 0 0 0 0 0 6 0 18 30 54Diazepam tab 5mg 0 8 11 0 0 0 15 10 0 0 0 0 44Dextrose in Water 5%, IV (500ml) 0 0 0 0 0 0 0 0 0 0 0 0 0USE WITH INDICATOR: E.5

Annex C 155
Drug Use Data Form
This form is used for the indicators listed below.
F.4 Average number of drugs prescribed per curative outpatient encounter in MOH health facilities
F.5 Percentage of drugs prescribed by generic name in MOH health facilities
F.6 Percentage of drugs prescribed from the NDFL in MOH health facilities
F.7 Percentage of outpatients prescribed injections at MOH health facilities
F.8 Percentage of outpatients prescribed antibiotics at MOH health facilities
F.9 Percentage of prescribed drugs presented for dispensing that are actually dispensed in MOH healthfacilities
Data collection summary:
The data for all of these indicators are collected at the same time in one of two ways. The first, and preferred,method is to collect the data retrospectively from records including daily registers and individual patientfiles. The second method is to collet the data prospectively through observation at dispensing points. Detailson both methods are provided in chapter 4, section E, "Defining Approaches for Collecting Survey Data."
Instructions:
1. Date: Fill in the date on which the data are collected.
2. Facility Name: Fill in the name of the warehouse or health facility where the data are collected.
3. Facility Type: Fill in the type of facility in which data are being collected, for example, warehouse,district hospital, health center or health post.
4. Location: Fill in the geographic location of the facility in which the data are collected, usually thename of a region, district, city or town,
5. Data Collector: Fill in the name of the person collecting the data.
6. Patient Name: In this column, fill in, for each outpatient curative encounter in the sample, the nameof the patient. This information has no analytical value, but it is noted to facilitate entry of the otherdata collected for each encounter.
7. Drugs Prescribed: Fill in names of the drug or drugs prescribed for each encounter in the sample. Ina case where a patient receives three drugs use three lines in this column. The name of the next patientwould be entered on the fourth line. Fill in names exactly as they appear in records or on prescriptionslips, including the strength. If the prescriber prescribed a drug by its generic name, enter the genericname. If the prescriber used a brand name, enter the brand name.

156 Rapid Pharmaceutical Management Assessment
8. Dosage Form: For each drug prescribed, fill in the presentation or dosage form in which the drug isprescribed. The most common examples are tablet, capsule, injection, lotion, cream, packet orsuppository.
Note: Normally, the three columns discussed so far will be filled out at the time data are being collected.The remaining five columns, discussed below, will be filled out later. They all have to do with classifyingthe drugs that have been prescribed.
9. Generic: In this column, for each drug prescribed, enter "1" (one) if the item is prescribed by genericname, or "0" (zero) if the item is prescribed by brand name.
10. NDFL/NEDL: For each drug prescribed, enter "1" (one) if the item appears in the National DrugFormulary List or National Essential Drug List, or "0" (zero) if the item does not appear on one ofthese lists.
11. Injectable: For each drug prescribed, enter "1" (one) if the item is an injectable product, or "0" (zero)if the item is not an injectable product.
12. Antibiotic: For each drug prescribed, enter "1" (one) if the item is an antibiotic product, or "0" (zero)if the item is not an antibiotic product.
13. Dispensed: For each drug prescribed, enter "1" (zero) if the item was actually dispensed, or "0" (zero)if it was not dispensed.
Note: The final "Dispensed" column is for indicator F.9 "Percentage of prescribed drugs presented fordispensing that are actually dispensed in MOH health facilities." When data for the indicators of drug useare collected retrospectively from records, which is the preferred method, it may not be possible to determinewhich drugs were actually dispensed. In cases wherein it is not possible, a separate prospective sample ofthirty encounters must be taken just for the dispensing indicator. In that case, data collectors will use aseparate set of forms and fill in only the columns headed with "Name of Patient," "Drugs Prescribed" and"Dispensed."
In cases wherein all of the drug use indicator data is collected prospectively, this problem should not arise,and only one sample of encounters will be required.
Note: All blanks should be filled in on this data collection form. Enter "N/A" if data for a particular itemis not available.
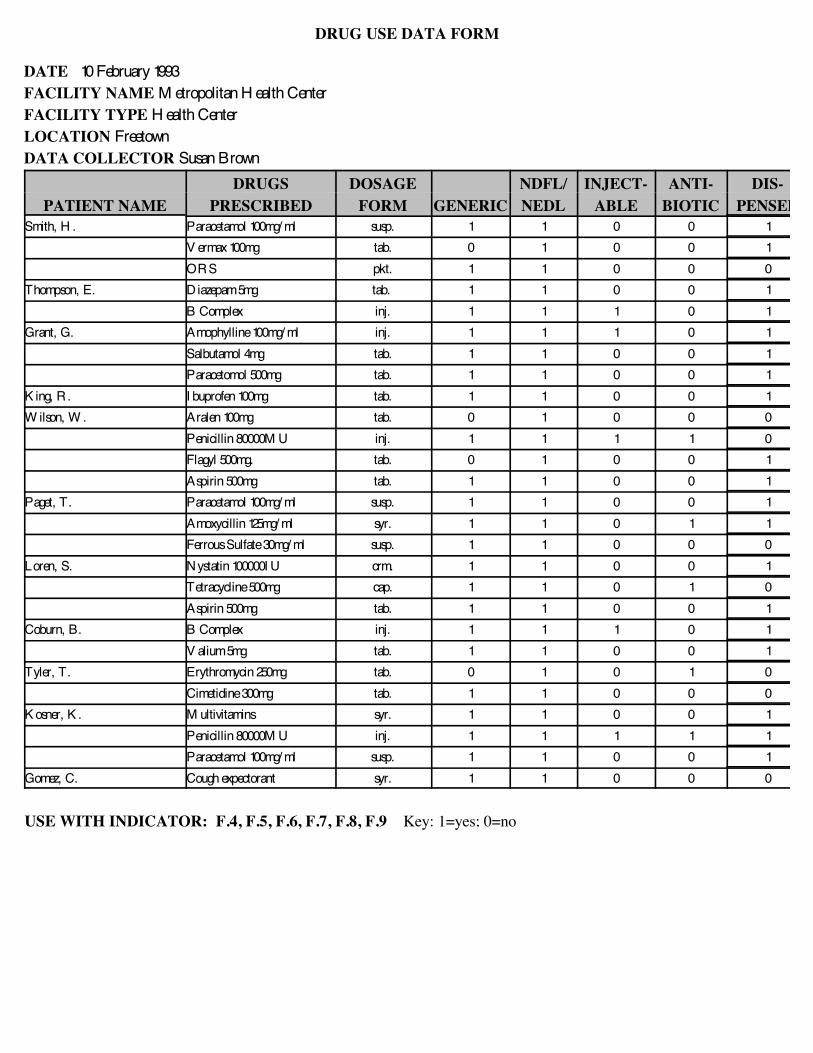
DRUG USE DATA FORM
DATE 10 February 1993FACILITY NAME M etropolitan H ealth CenterFACILITY TYPE H ealth CenterLOCATION FreetownDATA COLLECTOR Susan Brown
DRUGS DOSAGE NDFL/ INJECT- ANTI- DIS-PATIENT NAME PRESCRIBED FORM GENERIC NEDL ABLE BIOTIC PENSED
Smith, H . Paracetamol 100mg/ ml susp. 1 1 0 0 1V ermax 100mg tab. 0 1 0 0 1ORS pkt. 1 1 0 0 0
Thompson, E. D iazepam 5mg tab. 1 1 0 0 1B Complex inj. 1 1 1 0 1
Grant, G. Amophylline 100mg/ ml inj. 1 1 1 0 1Salbutamol 4mg tab. 1 1 0 0 1Paracetomol 500mg tab. 1 1 0 0 1
K ing, R. I buprofen 100mg tab. 1 1 0 0 1W ilson, W . Aralen 100mg tab. 0 1 0 0 0
Penicillin 80000M U inj. 1 1 1 1 0Flagyl 500mg. tab. 0 1 0 0 1Aspirin 500mg tab. 1 1 0 0 1
Paget, T. Paracetamol 100mg/ ml susp. 1 1 0 0 1Amoxycillin 125mg/ ml syr. 1 1 0 1 1Ferrous Sulfate 30mg/ ml susp. 1 1 0 0 0
Loren, S. Nystatin 100000I U crm. 1 1 0 0 1Tetracycline 500mg cap. 1 1 0 1 0Aspirin 500mg tab. 1 1 0 0 1
Coburn, B. B Complex inj. 1 1 1 0 1V alium 5mg tab. 1 1 0 0 1
Tyler, T. Erythromycin 250mg tab. 0 1 0 1 0Cimetidine 300mg tab. 1 1 0 0 0
K osner, K . M ultivitamins syr. 1 1 0 0 1Penicillin 80000M U inj. 1 1 1 1 1Paracetamol 100mg/ ml susp. 1 1 0 0 1
Gomez, C. Cough expectorant syr. 1 1 0 0 0
USE WITH INDICATOR: F.4, F.5, F.6, F.7, F.8, F.9 Key: 1=yes; 0=no

Annex C 159
Retail Price Comparison Data Form
This form is used for the indicator listed below.
H.7 Average of median private sector drug retail prices as a percentage of MOH acquisition prices for aset of indicator drugs
Data collection summary:
The data for this indicator are collected in a sample of drug retail outlets and at the MOH office responsiblefor purchasing drugs. At each drug retail site, for the set of indicator drugs, the price of the least expensiveproduct in stock (brand or generic name) is recorded. At the MOH, the CIF prices for the most recent regularare recorded.
Instructions:
1. Date: Fill in the date on which the data are collected.
2. Outlet Name: Fill in the name of the drug retail outlet in which data are being collected.
3. Outlet Type: Fill in the type of drug retail outlet, for example, pharmacy or OTC drug store.
4. Location: Fill in the geographic location of the outlet, which will usually be the name of a region,district, city or town.
5. Data Collector: Fill in the name of the person collecting the data.
6. Currency Used: Record the currency used to report the price data collected.
7. Product: In this column, the list of 25 to 50 indicator drugs being used for the assessment should bepre-printed. For each indicator drug, the generic name, dosage form and strength should be included.
8. Name (Brand or Generic): For each indicator drug, fill in the brand or generic name of the leastexpensive product that is sold at the site.
9. Comp. Unit: For each indicator drug, fill in the comparison unit being used (e.g., tab, ml).
10. # Units Per Pack: For each indicator drug, fill in the number of units per pack.
11. Retail Pack Price: For each indicator drug, fill in the retail pack price.
12. Retail Unit Price: For each product, fill in the retail unit price, calculated by dividing the retail packprice by the retail pack size. It is necessary to enter the price to four decimal places, because the unitsinvolved are so small.
13. MOH Unit Price: For each indicator drug, fill in the MOH CIF unit price for the most recent regularprocurement.

160 Rapid Pharmaceutical Management Assessment
Note: All blanks should be filled in on this data collection form. Enter "N/A" if data for a particular itemis not available.

RETAIL PRICE COMPARISON DATA FORM
DATE 12 August 1994OUTLET NAME Cantonal GuamoteOUTLET TYPE H ospital currency used: U.S. $LOCATION Urbano-RuralDATA COLLECTOR V eronica M aldonado
NAME COMP # UNITS RETAIL RETAIL MOHPRODUCT (BRAND OR GENERIC) UNIT PER PACK PACK PRICE UNIT PRICE UNIT PRICEAcetylsalicylic acid tab 500mg Anaspirin tab. 100 1.1000 .0110 .0055Amoxycillin tab 250mg Cipamox tab. 20 2.4600 .1230 .0410Erythromycin tab 250mg W emid tab. 50 5.8500 .1170 .0387Co-trimoxazole tab 80/400mg Batrisulf tab. 50 1.3400 .0268 .0134Penicillin Procaine vial 80000MU Retarpen vial 50 32.8500 .6570 .219Oral rehydration salts sachet oRS sachet 50 12.6300 .2526 .0842Aminophylline 100mg/ml amp. (1ml) Aminofilina ml 10 2.8340 .2834 .1417Mebendazole tab 100mg Cofazole tab. 100 1.6000 .0160 .008Chloroquine tab 150mg Aralen tab. 100 2.5200 .0252 .0084Ergometrine tab 0.2mg Ermetrine tab. 30 2.9880 .0996 .0332Glibenclamine tab 5mg Ciana tab. 30 .3600 .0120 .0060Metronidazole tab 250mg Flagyl tab. 10 .2040 .0204 .0068Nystatin cream 100000 IU/g (15g) Candistatin gm. 1 tube .1320 .1320 .066Paracetamol susp. 100mg/ml Dafalgan ml. 1 bottle .0304 .0304 .0152Rifampicin tab 300mg Rifadin tab. 50 8.2800 .1656 .0828Isoniazid tab 100mg I soniazid tab. 30 .1980 .0066 .0033Salbutamol tab 2mg V entolin tab. 100 .8200 .0082 .0041Vitamin A tab 200000 IU A-V itex tab. 100 7.5900 .0759 .0253Multivitamin tab Teragram tab. 50 1.4250 .0285 .0095Ferrous Sulfate oral sol. 40mg/ml 1000ml Feninsol ml. 1 bottle .0456 .0456 .0228Mefloquine tab 250mg Lariam tab. 100 278.4600 2.7846 .9282Cimetidine tab 200mg Cimetase tab. 100 3.6400 .0364 .0182Benzyl Benzoate lotion 25% (1000ml) Ansar ml. 1 bottle .0099 .0099 .0033Diazepam tab 5mg Ortopsique tab. 100 .7400 .0074 .0037Dextrose in Water 5%, IV (500ml) Dextrose ml. 1 vial .0042 .0042 .0021USE WITH INDICATOR: H.7

Annex C 163
International Price Comparison Data Form
This form is used for the indicator listed below.
D.3 Percentage of average international price paid for last regular procurement of a set of indicator drugs
Data collection summary:
The data for this indicator are collected at the MOH office responsible for purchasing drugs. For the set ofindicator drugs, the CIF prices for the most recent regular procurement are recorded and compared to theinternational prices.
Instructions:
1. Date: Fill in the date on which the data are collected.
2. Outlet Name: Fill in the name of the drug retail outlet in which data are being collected.
3. Outlet Type: Fill in the type of drug retail outlet, for example, pharmacy or OTC drug store.
4. Location: Fill in the geographic location of the outlet, which will usually be the name of a region,district, city or town.
5. Data Collector: Fill in the name of the person collecting the data.
6. Currency Used: Record the currency used to report the price data collected.
7. 1 U.S. Dollar: Record the equivalent of one U.S. dollar in the currency used to report the price datacollected.
8. Product: In this column, the list of 25 to 50 indicator drugs being used for the assessment should bepre-printed. For each indicator drug, the generic name, dosage form and strength should be included.
9. Name (Brand or Generic): For each indicator drug, fill in the brand or generic name of the productpurchased by the MOH.
10. Comp. Unit: For each indicator drug, fill in the comparison unit being used (e.g., tab, ml).
11. # Units Per Pack: For each indicator drug, fill in the number of comparison units per pack.
12. MOH Pack Price: For each indicator drug, fill in the MOH CIF pack price.
13. MOH Unit Price: For each product, fill in the MOH CIF unit price for the most recent regularprocurement, calculated by dividing the MOH pack price by the number of units per pack. It isnecessary to enter the price to four decimal places, because the units involved are so small.
14. International Unit Price: For each indicator drug, fill in the average international unit price for themost recent regular procurement, found in the MSH International Drug Price Indicator Guide.

164 Rapid Pharmaceutical Management Assessment
Note: All blanks should be filled in on this data collection form. Enter "N/A" if data for a particular itemis not available.

INTERNATIONAL PRICE COMPARISON DATA FORM
DATE 12 August 1994OUTLET NAME Cantonal GuamoteOUTLET TYPE H ospital currency used: U.S. $LOCATION Urbano-Rural 1 U.S. dollar= _________DATA COLLECTOR V eronica M aldonado
NAME COMP # UNITS MOH MOH INT’LPRODUCT (BRAND OR GENERIC) UNIT PER PACK PACK PRICE UNIT PRICE UNIT PRICEAcetylsalicylic acid tab 500mg Anaspirin tab. 100 .5500 .0055 .0090Amoxycillin tab 250mg Cipamox tab. 20 .8200 .0410 .3800Erythromycin tab 250mg W emid tab. 50 1.9350 .0387 .0476Co-trimoxazole tab 80/400mg Batrisulf tab. 50 .6700 .0134 .0183Penicillin Procaine vial 80000MU Retarpen vial 50 10.9500 .219 .2280Oral rehydration salts sachet oRS sachet 50 4.2100 .0842 .0964Aminophylline 100mg/ml amp. (1ml) Aminofilina ml 10 1.4170 .1417 .1412Mebendazole tab 100mg Cofazole tab. 100 .8000 .008 .0076Chloroquine tab 150mg Aralen tab. 100 .8400 .0084 .0091Ergometrine tab 0.2mg Ermetrine tab. 30 .9960 .0332 .0612Glibenclamine tab 5mg Ciana tab. 30 .1800 .0060 .0049Metronidazole tab 250mg Flagyl tab. 10 .0680 .0068 .0100Nystatin cream 100000 IU/g (15g) Candistatin gm. 1 tube .0660 .066 .0401Paracetamol susp. 100mg/ml Dafalgan ml. 1 bottle .0152 .0152 .0172Rifampicin tab 300mg Rifadin tab. 50 4.1400 .0828 .0927Isoniazid tab 100mg I soniazid tab. 30 .0990 .0033 .0041Salbutamol tab 2mg V entolin tab. 100 .4100 .0041 .0040Vitamin A tab 200000 IU A-V itex tab. 100 2.5300 .0253 .0229Multivitamin tab Teragram tab. 50 .4750 .0095 .0083Ferrous Sulfate oral sol. 40mg/ml 1000ml Feninsol ml. 1 bottle .0228 .0228 .0230Mefloquine tab 250mg Lariam tab. 100 92.8200 .9282 1.0252Cimetidine tab 200mg Cimetase tab. 100 1.8200 .0182 .0367Benzyl Benzoate lotion 25% (1000ml) Ansar ml. 1 bottle .0033 .0033 .0028Diazepam tab 5mg Ortopsique tab. 100 .3700 .0037 .0028Dextrose in Water 5%, IV (500ml) Dextrose ml. 1 vial .0021 .0021 .0017USE WITH INDICATOR: D.3

Blank Sample Data Collection Forms
The following are blank data collection forms that may be used to make copies.

DRUG REGISTRATION DATA FORM
DATE
NAME OF OUTLETTYPE OF OUTLETLOCATIONDATA COLLECTOR
BRAND NAME MANUFACTURER GENERIC NAME LICENSE NUMBER REGISTERED?(DOSAGE FORM) AND/OR SUPPLIER (DOSAGE FORM & STRENGTH)
USE WITH INDICATOR: A.3 Key: 1=registered; 0=not registered

GENERIC SUBSTITUTION AND SALE OF ANTIBIOTICS DATA FORM
DATE SIMULATED PURCHASE PRODUCT
DATA COLLECTOR
MADE SUBSTITUTION? SOLD ANTIBIOTIC?NAME OF OUTLET YES PRODUCT YES
USE WITH INDICATOR: A.7, H.9 Key: 1=yes; 0=no

INVENTORY DATA FORM
DATE Manual Available? [ ] Yes [ ]No Year:_____ Title:_________________________________
_________________________________ Data Collected from: [ ] Computer System
[ ] Manual Ledger or Stock Record Cards[ ] Tally Sheets or Bin Cards
FACILITY NAMEFACILITY TYPELOCATIONDATA COLLECTOR
COUNTING RECORD RECENT RECENT ADJUSTED PHYSICALPRODUCT UNIT COUNT RECEIPTS ISSUES TOTAL COUNT
USE WITH INDICATOR: B.3, E.1,E.2, E.3, E.4

CHARGE FOR DRUGS TALLY FORM
DATACOLLECTOR:
SITE AND DATE SITE AND DATE SITE AND DATE SITE AND DATE SITE AND DATE
1. 1. 1. 1. 1.
2. 2. 2. 2. 2.
3. 3. 3. 3. 3.
4. 4. 4. 4. 4.
5. 5. 5. 5. 5.
6. 6. 6. 6. 6.
7. 7. 7. 7. 7.
8. 8. 8. 8. 8.
9. 9. 9. 9. 9.
10. 10. 10. 10. 10.
11. 11. 11. 11. 11.
12. 12. 12. 12. 12.
13. 13. 13. 13. 13.
14. 14. 14. 14. 14.
15. 15. 15. 15. 15.
16. 16. 16. 16. 16.
17. 17. 17. 17. 17.
18. 18. 18. 18. 18.
19. 19. 19. 19. 19.
20. 20. 20. 20. 20.
21. 21. 21. 21. 21.
22. 22. 22. 22. 22.
23. 23. 23. 23. 23.
24. 24. 24. 24. 24.
25. 25. 25. 25. 25.
26. 26. 26. 26. 26.
27. 27. 27. 27. 27.
28. 28. 28. 28. 28.
29. 29. 29. 29. 29.
30. 30. 30. 30. 30.
USE WITH INDICATOR: C.3 Key: 1=charges collected, 0 = no charges

STOCKOUT DATA FORM
DATE__________________________FACILITY NAME________________________FACILITY TYPE_________________________LOCATION______________________________DATA COLLECTOR______________________
Month 1 Month 2 Month 3 Month 4 Month 5 Month 6 Month 7 Month 8 Month 9 Month 10 Month 11 Month12 TOTAL
PRODUCT DAYS OUT
USE WITH INDICATOR: E.5

DRUG USE DATA FORM
DATEFACILITY NAMEFACILITY TYPELOCATIONDATA COLLECTOR
DRUGS DOSAGE NDFL/ INJECT- ANTI- DIS-PATIENT NAME PRESCRIBED FORM GENERIC NEDL ABLE BIOTIC PENSED
USE WITH INDICATOR: F.4, F.5, F.6, F.7, F.8, F.9 Key: 1=yes; 0=no

RETAIL PRICE COMPARISON DATA FORM
DATEOUTLET NAMEOUTLET TYPE currency used: __________LOCATIONDATA COLLECTOR
NAME COMP # UNITS RETAIL RETAIL MOHPRODUCT (BRAND OR GENERIC) UNIT PER PACK PACK PRICE UNIT PRICE UNIT PRICE
USE WITH INDICATOR: H.7

INTERNATIONAL PRICE COMPARISON DATA FORM
DATEOUTLET NAMEOUTLET TYPE currency used: __________LOCATION 1 U.S. Dollar =________DATA COLLECTOR
NAME COMP # UNITS MOH MOH INT’LPRODUCT (BRAND OR GENERIC) UNIT PER PACK PACK PRICE UNIT PRICE UNIT PRICE
USE WITH INDICATOR: D.3

Annex D: Sample Structured Interview Questionnaire
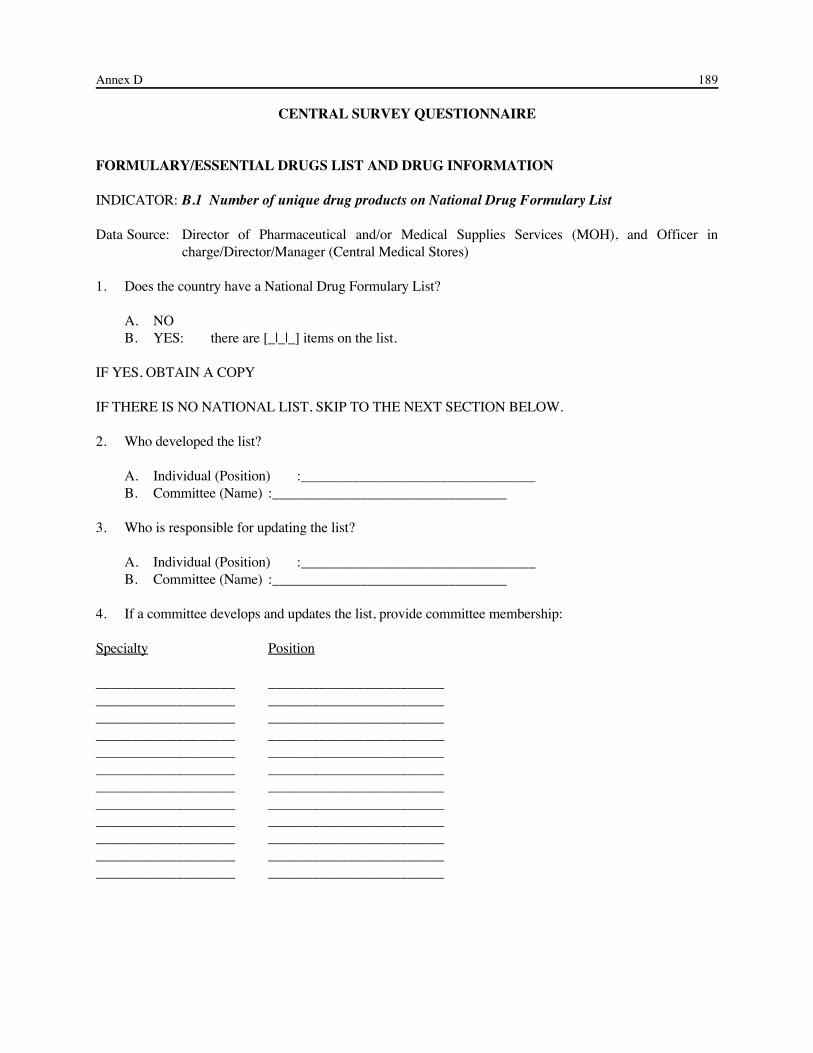
Annex D 189
CENTRAL SURVEY QUESTIONNAIRE
FORMULARY/ESSENTIAL DRUGS LIST AND DRUG INFORMATION
INDICATOR: B.1 Number of unique drug products on National Drug Formulary List
Data Source: Director of Pharmaceutical and/or Medical Supplies Services (MOH), and Officer incharge/Director/Manager (Central Medical Stores)
1. Does the country have a National Drug Formulary List?
A. NOB. YES: there are [_|_|_] items on the list.
IF YES, OBTAIN A COPY
IF THERE IS NO NATIONAL LIST, SKIP TO THE NEXT SECTION BELOW.
2. Who developed the list?
A. Individual (Position) :________________________________B. Committee (Name) :________________________________
3. Who is responsible for updating the list?
A. Individual (Position) :________________________________B. Committee (Name) :________________________________
4. If a committee develops and updates the list, provide committee membership:
Specialty Position
___________________ ___________________________________________ ___________________________________________ ___________________________________________ ___________________________________________ ___________________________________________ ___________________________________________ ___________________________________________ ___________________________________________ ___________________________________________ ___________________________________________ ___________________________________________ ________________________

190 Rapid Pharmaceutical Management Assessment
5. In the past year, how often has the committee met?
A. OnceB. TwiceC. QuarterlyD. MonthlyE. Ad hocF. Other:________________
6. How often is the National Drug Formulary List updated?
A. Once yearlyB. Twice yearlyC. QuarterlyD. MonthlyE. Ad hocF. Other:________________
7. Does the National Drug Formulary List contain contraceptives: YES NO If yes, list those products:
8. Who is the person authorized to make requests for changes in the formulary?
9. What information is required to support requests?
A. Drug consumption dataB. Drug prescribing dataC. References from the medical literatureD. NoneE. Other
10. If references are required, who supplies them?
11. Describe the procedure for requesting and approving additions to the list:
12. How are drugs that are not on the National Drug Formulary List procured?
A. Private sectorB. DonationsC. Transfer from other institutionsD. Other:

Annex E: End Notes

Annex E 193
1. A. Battersby. Logistics for Essential Drugs and Vaccine Supply in Sierra Leone. Freetown, Sierra Leone: UNICEF, 1984.
A. Battersby and Y. Tawfik. Assessment of Logistics Systems Used to Supply Drugs,Vaccines, Supplies, and Contraceptives to Ministry of Health Facilities ThroughoutGhana. Accra, Ghana: December 1986.
K. de Joncheere. Overstock Management: AGAPCO. Boston, MA: Management Sciencesfor Health, May 1985.
Federal Ministry of Health, Nigeria/World Health Organization. Nigerian Essential DrugsProject Consolidated Project Design. Lagos, Nigeria: Management Sciences for Health,September 1987.
L. Holmstrom et al. Sokoto State Health Project: Essential Drugs Programme and DrugRevolving Fund. Sokoto State, Nigeria: WHO, 14 April - 2 May 1986.
Management Sciences for Health. Managing Drug Supply. Boston, MA: ManagementSciences for Health, 1981.
Management Sciences for Health, Ministry of Health, and Yayasan Indonesia Sejahtera. Child Survival Pharmaceuticals in Indonesia: Opportunities for Therapeutics & EconomicEfficiencies in Pharmaceutical Supply and Use. Jakarta: December 1987.
R.W. O'Connor (ed.). Managing Health Systems in Developing Areas: Experiences inAfghanistan. Lexington, MA: Lexington Books (D.C. Heath), 1980.
J.D. Quick and P. Foreman. Pharmaceuticals and Financing for Health in the 1990's:Strategic Perspectives for Asia and the Near East. Boston, MA: Management Sciences forHealth (USAID Asia Near East Bureau Issue Paper Series), May 1989.
J.D. Quick and R. Roberts. Progress Review: Haiti Rural Health Delivery System Project.Boston, MA: Management Sciences for Health, January 1986.
J.R. Rankin. Assessment of Pharmaceutical Logistics, St. Kitts and Nevis. Boston, MA:Management Sciences for Health, July 1987.
J.R. Rankin and R. Calahorrano. Pilot Program for Public Sector Drug Cost Recovery inEcuador: Planning and Implementation Steps Required, and Current Status. Quito,Ecuador: World Bank, June 1992.
J.R. Rankin and J. Korn. Final Report on the Kenya Essential Drugs Programme:Recommendations for Future Cooperation between Danida and the Kenya Ministry ofHealth. Danida/Euro Health, Inc., March 1991.
End Notes

194 Rapid Pharmaceutical Management Assessment
J.R. Rankin et al. Ministry of Health of Ghana: Rational Pharmaceutical ManagementProject, Ghana Pharmaceutical Sector Assessment Final Report. Washington, DC:Management Sciences for Health, August 1993.
J.-P. Sallet. Status Report on the Central Medical Stores and the Drug Logistics System forthe Commonwealth of Dominica. Boston, MA: Management Sciences for Health/ EasternCaribbean Drug Service, January 1990.
A. Savelli and H. Haak. Ministry of Health of Mozambique: Rational PharmaceuticalManagement Project, Mozambique Pharmaceutical Sector Assessment Final Report. Washington, DC: Management Sciences for Health, January 1994.
WHO Action Programme on Essential Drugs. WHO/UNICEF Study on the Stability ofDrugs During International Transport. WHO/DAP/91.10. Geneva: 1991.
WHO Action Programme on Essential Drugs. Inland Stability Study (Sudan). WHO/DAP/91.4. Geneva: 1991.
WHO Action Programme on Essential Drugs. Report for the Biennium 1990-1991. Geneva: February 1992.
2. World Health Organization. World Drug Situation. Geneva: 1988.
3. World Health Organization. Model Indicators for Monitoring National Drug Policies(Draft). Geneva: 1994.
4. CSHSH (Commonwealth Department of Human Services and Health). Manual ofindicators to measure the effect of initiatives under quality use of medicines arm of thenational medical drug policy. Canberra, Australia: Australian Government PublishingService, 1994.
5. WHO Action Programme on Essential Drugs. How to Investigate Drug Use in HealthFacilities. Geneva: WHO, 1993.
6. J.-P. Sallet and J. Frye. 1993-94 International Drug Price Indicator Guide. Washington,DC: Management Sciences for Health, 1994.
7. WHO Action Programme on Essential Drugs. How to Investigate Drug Use in HealthFacilities. Geneva: WHO, 1993.
8. World Health Organization. International nonproprietary names (INN) for pharmaceuticalsubstances. Cumulative list No. 8. Geneva: 1992.
9. World Health Organization. Certification Scheme on the Quality of PharmaceuticalProducts Moving in International Commerce. Geneva: February 1994.

Annex E 195
World Health Organization. Revision: Proposed Guidelines on the WHO CertificationScheme on the Quality of Pharmaceutical Products Moving in International Commerce.Geneva: December 1994.
10. Kunwar and Sherestha. Study of Volumetric and Space Needs...
11. HMG Health Information Bulletin for 1992