rapid lc-ms compatible stability indicating assay …...stability indicating assay method for...
TRANSCRIPT
Open AccessResearch Article
Swain et al., J Anal Bioanal Tech 2015, 6:4 DOI: 10.4172/2155-9872.1000254
Volume 6 • Issue 4 • 1000254J Anal Bioanal TechISSN: 2155-9872 JABT, an open access journal
Keywords: Azilsartan medoxomil potassium; RP-HPLC; PDA; LC-MS; Stability indicating assay
Introduction Azilsartan medoxomil potassium (AZP) is chemically known as
1-[{2’-(2,5-Dihydro-5-oxo-1,2,4-oxodiazol-3-yl) [1,1’-biphenyl]-4-yl]methyl]-2-ethoxy-1H-benzimidazole-7-carboxylic acid(5-methyl-2-oxo-1,3-dioxol-4-yl) methyl ester potassium salt (Figure 1). It isa prodrug of azilsartan. Upon administration of the drug into thephysiological system azilsartan will be released as the active moietyinto the body [1]. AZP selectively blocks the angiotensin II by blocking the angiotensin II, type 1 receptor thereby lowering the blood pressureand thus used in the treatment of hypertension, either individually orin combination with other drugs [2]. The drug AZP has shown betterclinical profile than other drugs in the same class [3]. A few analyticalmethods have been reported for the determination of AZP in biological samples, bulk drugs and also in pharmaceutical formulations [4,5].However no information exists in the literature on the degradation and
LC-MS compatible stability indicating method for the assay of AZP.
Current GMP regulations require all the drugs to be tested with Stability Indicating Assay Methods (SIAMs) before release. The FDA defines the SIAM as an analytical procedure that measures the active pharmaceutical ingredient (in drug substance and drug product) with accuracy and precision, free from the process impurities, excipients
*Corresponding authors: Gananadhamu S, Department of PharmaceuticalAnalysis, National Institute of Pharmaceutical Education and Research [NIPER],Hyderabad 500037, India, Tel: +91-40-234-237-49; Fax: +91-40-230-7375; E-mail:[email protected]
Received June 26, 2015; Accepted July 08, 2015; Published July 15, 2015
Citation: Swain D, Sahu G, Samanthula G (2015) Rapid LC-MS Compatible Stability Indicating Assay Method for Azilsartan Medoxomil Potassium. J Anal Bioanal Tech 6: 254 doi:10.4172/2155-9872.1000254
Copyright: © 2015 Swain D, et al. This is an open-access article distributed under the terms of the Creative Commons Attribution License, which permits unrestricted use, distribution, and reproduction in any medium, provided the original author and source are credited.
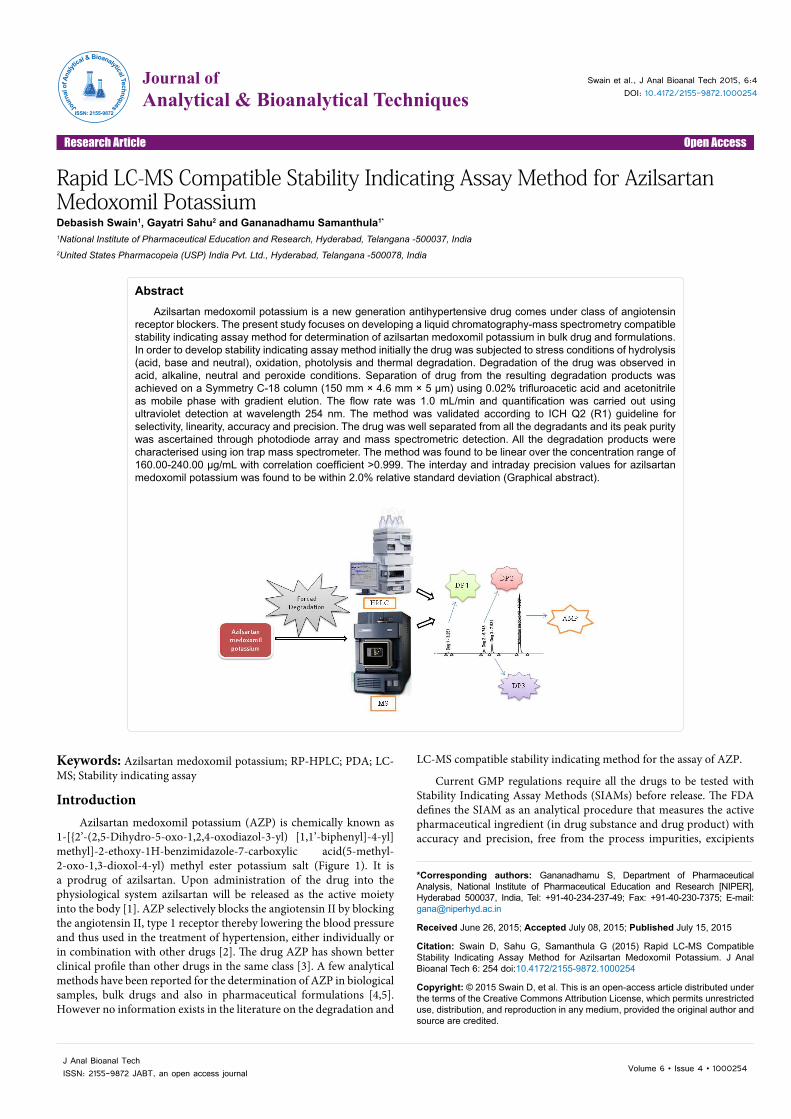
AbstractAzilsartan medoxomil potassium is a new generation antihypertensive drug comes under class of angiotensin
receptor blockers. The present study focuses on developing a liquid chromatography-mass spectrometry compatible stability indicating assay method for determination of azilsartan medoxomil potassium in bulk drug and formulations. In order to develop stability indicating assay method initially the drug was subjected to stress conditions of hydrolysis (acid, base and neutral), oxidation, photolysis and thermal degradation. Degradation of the drug was observed in acid, alkaline, neutral and peroxide conditions. Separation of drug from the resulting degradation products was achieved on a Symmetry C-18 column (150 mm × 4.6 mm × 5 µm) using 0.02% trifluroacetic acid and acetonitrile as mobile phase with gradient elution. The flow rate was 1.0 mL/min and quantification was carried out using ultraviolet detection at wavelength 254 nm. The method was validated according to ICH Q2 (R1) guideline for selectivity, linearity, accuracy and precision. The drug was well separated from all the degradants and its peak purity was ascertained through photodiode array and mass spectrometric detection. All the degradation products were characterised using ion trap mass spectrometer. The method was found to be linear over the concentration range of 160.00-240.00 µg/mL with correlation coefficient >0.999. The interday and intraday precision values for azilsartan medoxomil potassium was found to be within 2.0% relative standard deviation (Graphical abstract).
Rapid LC-MS Compatible Stability Indicating Assay Method for Azilsartan Medoxomil PotassiumDebasish Swain1, Gayatri Sahu2 and Gananadhamu Samanthula1*
1National Institute of Pharmaceutical Education and Research, Hyderabad, Telangana -500037, India2United States Pharmacopeia (USP) India Pvt. Ltd., Hyderabad, Telangana -500078, India
Journal ofAnalytical & Bioanalytical TechniquesJo
urna
l of A
nalyt
ical & Bioanalytical Techniques
ISSN: 2155-9872
Citation: Swain D, Sahu G, Samanthula G (2015) Rapid LC-MS Compatible Stability Indicating Assay Method for Azilsartan Medoxomil Potassium. J Anal Bioanal Tech 6: 254 doi:10.4172/2155-9872.1000254
Page 2 of 12
Volume 6 • Issue 4 • 1000254J Anal Bioanal TechISSN: 2155-9872 JABT, an open access journal
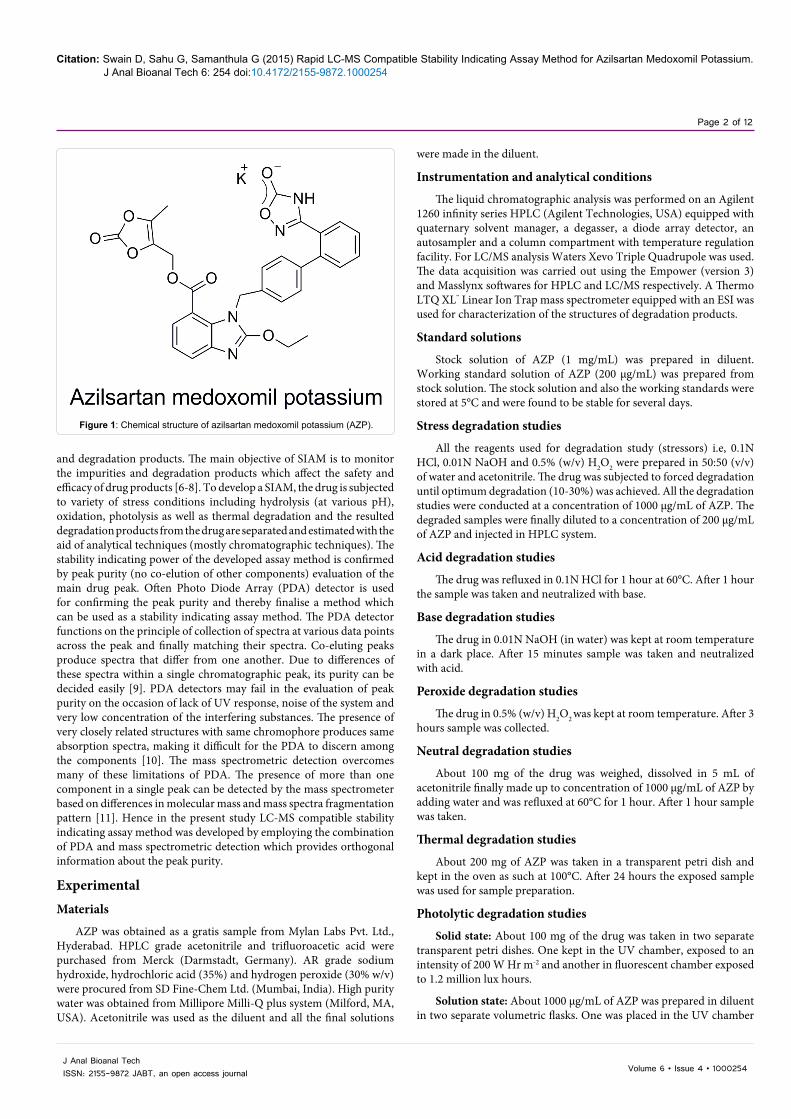
Figure 1: Chemical structure of azilsartan medoxomil potassium (AZP).
and degradation products. The main objective of SIAM is to monitor the impurities and degradation products which affect the safety and efficacy of drug products [6-8]. To develop a SIAM, the drug is subjected to variety of stress conditions including hydrolysis (at various pH), oxidation, photolysis as well as thermal degradation and the resulted degradation products from the drug are separated and estimated with the aid of analytical techniques (mostly chromatographic techniques). The stability indicating power of the developed assay method is confirmed by peak purity (no co-elution of other components) evaluation of the main drug peak. Often Photo Diode Array (PDA) detector is used for confirming the peak purity and thereby finalise a method which can be used as a stability indicating assay method. The PDA detector functions on the principle of collection of spectra at various data points across the peak and finally matching their spectra. Co-eluting peaks produce spectra that differ from one another. Due to differences of these spectra within a single chromatographic peak, its purity can be decided easily [9]. PDA detectors may fail in the evaluation of peak purity on the occasion of lack of UV response, noise of the system and very low concentration of the interfering substances. The presence of very closely related structures with same chromophore produces same absorption spectra, making it difficult for the PDA to discern among the components [10]. The mass spectrometric detection overcomes many of these limitations of PDA. The presence of more than one component in a single peak can be detected by the mass spectrometer based on differences in molecular mass and mass spectra fragmentation pattern [11]. Hence in the present study LC-MS compatible stability indicating assay method was developed by employing the combination of PDA and mass spectrometric detection which provides orthogonal information about the peak purity.
ExperimentalMaterials
AZP was obtained as a gratis sample from Mylan Labs Pvt. Ltd., Hyderabad. HPLC grade acetonitrile and trifluoroacetic acid were purchased from Merck (Darmstadt, Germany). AR grade sodium hydroxide, hydrochloric acid (35%) and hydrogen peroxide (30% w/v) were procured from SD Fine-Chem Ltd. (Mumbai, India). High purity water was obtained from Millipore Milli-Q plus system (Milford, MA, USA). Acetonitrile was used as the diluent and all the final solutions
were made in the diluent.
Instrumentation and analytical conditions
The liquid chromatographic analysis was performed on an Agilent 1260 infinity series HPLC (Agilent Technologies, USA) equipped with quaternary solvent manager, a degasser, a diode array detector, an autosampler and a column compartment with temperature regulation facility. For LC/MS analysis Waters Xevo Triple Quadrupole was used. The data acquisition was carried out using the Empower (version 3) and Masslynx softwares for HPLC and LC/MS respectively. A Thermo LTQ XL™ Linear Ion Trap mass spectrometer equipped with an ESI was used for characterization of the structures of degradation products.
Standard solutions
Stock solution of AZP (1 mg/mL) was prepared in diluent. Working standard solution of AZP (200 µg/mL) was prepared from stock solution. The stock solution and also the working standards were stored at 5°C and were found to be stable for several days.
Stress degradation studies
All the reagents used for degradation study (stressors) i.e, 0.1N HCl, 0.01N NaOH and 0.5% (w/v) H2O2 were prepared in 50:50 (v/v) of water and acetonitrile. The drug was subjected to forced degradation until optimum degradation (10-30%) was achieved. All the degradation studies were conducted at a concentration of 1000 µg/mL of AZP. The degraded samples were finally diluted to a concentration of 200 µg/mL of AZP and injected in HPLC system.
Acid degradation studies
The drug was refluxed in 0.1N HCl for 1 hour at 60°C. After 1 hour the sample was taken and neutralized with base.
Base degradation studies
The drug in 0.01N NaOH (in water) was kept at room temperature in a dark place. After 15 minutes sample was taken and neutralized with acid.
Peroxide degradation studies
The drug in 0.5% (w/v) H2O2 was kept at room temperature. After 3 hours sample was collected.
Neutral degradation studies
About 100 mg of the drug was weighed, dissolved in 5 mL of acetonitrile finally made up to concentration of 1000 µg/mL of AZP by adding water and was refluxed at 60°C for 1 hour. After 1 hour sample was taken.
Thermal degradation studies
About 200 mg of AZP was taken in a transparent petri dish and kept in the oven as such at 100°C. After 24 hours the exposed sample was used for sample preparation.
Photolytic degradation studies
Solid state: About 100 mg of the drug was taken in two separate transparent petri dishes. One kept in the UV chamber, exposed to an intensity of 200 W Hr m-2 and another in fluorescent chamber exposed to 1.2 million lux hours.
Solution state: About 1000 µg/mL of AZP was prepared in diluent in two separate volumetric flasks. One was placed in the UV chamber
Citation: Swain D, Sahu G, Samanthula G (2015) Rapid LC-MS Compatible Stability Indicating Assay Method for Azilsartan Medoxomil Potassium. J Anal Bioanal Tech 6: 254 doi:10.4172/2155-9872.1000254
Page 3 of 12
Volume 6 • Issue 4 • 1000254J Anal Bioanal TechISSN: 2155-9872 JABT, an open access journal
and another in fluorescent chamber exposed to same conditions as that of solid state.
Similarly control samples (petri dishes and volumetric flasks are wrapped with aluminium foils) were prepared and also exposed to the above mentioned conditions. All the samples were observed with respect to the control samples.
Results and DiscussionThe aim of the present study is to develop a LC-MS compatible
reversed-phase high-performance liquid chromatography procedure for the determination of AZP in the presence of its degradation products. AZP is relatively non-polar compound as indicated by partition coefficient (log p = 4.94 and 6.03) [12], and is well retained on traditional C18 bonded phases. The method was optimized in keeping view of adequate separation of the degradation products from the main peak. The initial trials were carried out with aqueous buffer solutions of pH 3.0, 4.0, 5.0, 5.5 and 6.0 with organic phase being methanol or acetonitrile. The AZP peak was not good in the above trials. The combination of trifluroacetic acid and acetonitrile as the mobile phase under gradient elution produced better peak shapes of AZP and degradants along with good resolution among all the peaks. The stability indicating power of the developed method was established by ascertaining the purity of all the peaks in the chromatogram. The peak purity was evaluated using the PDA as well as mass spectrometric detection. The peak purity and the optimum separation of the peaks indicated the selectivity of the assay method. Stress studies of AZP showed the formation of three degradation products in total under the hydrolytic and oxidative conditions. Thus care must be taken during the manufacturing or processing of the drug otherwise the resultant degradants may hamper the safety and efficacy of the resulting formulation.
Optimization of reversed-phase HPLC and LC-MS conditions
The separation was achieved on a Waters Symmetry C-18 column (150 mm × 4.6 mm × 5 µm) using a mobile phase of solvent A (0.02% trifluoroacetic acid in water) and solvent B (acetonitrile) in gradient elution. The gradient program employed to achieve the separation was (Time in min. / %Solvent B): 0/40, 3/40, 10/70, 15/70, 16/40, 20/40. The flow rate was maintained at 1.0 mL/min. The column temperature was maintained at 25°C and the auto sampler at 5°C. The detection wavelength was 254 nm and the injection volume was 10 µL. The developed HPLC method was transferred to LC-MS for the purity evaluation study.
The LC-MS studies was carried out on a Waters Xevo Triple Quadrupole mass spectrometer with the parameters set as: capillary voltage at 3000 V; cone voltage at 25 V; desolvation temperature at 450°C; source temperature at 100°C; extractor voltage at 2 V; cone gas flow at 50 L/hr and desolvation gas flow at 1000 L/hr. The study was carried out in the positive mode under electrospray ionization technique. A Thermo LTQ XL™ Linear Ion Trap mass spectrometer equipped with an ESI was used to conduct the MSn experiments and predict the possible structures of the resulting degradation products. The ESI conditions were maintained as in above experiment; additionally helium was used as the damping gas and nitrogen as the sheath gas (30 psi). The automatic gain control settings were set at 2 × 10⁷ for a full-scan mass spectrum and 2 × 10⁷ counts for a full-product ion mass spectrum with a maximum ion injection time of 200 ms. The collision energy used was 25 eV and all the spectra were recorded with an average of 25-30 scans.
Stress degradation studies
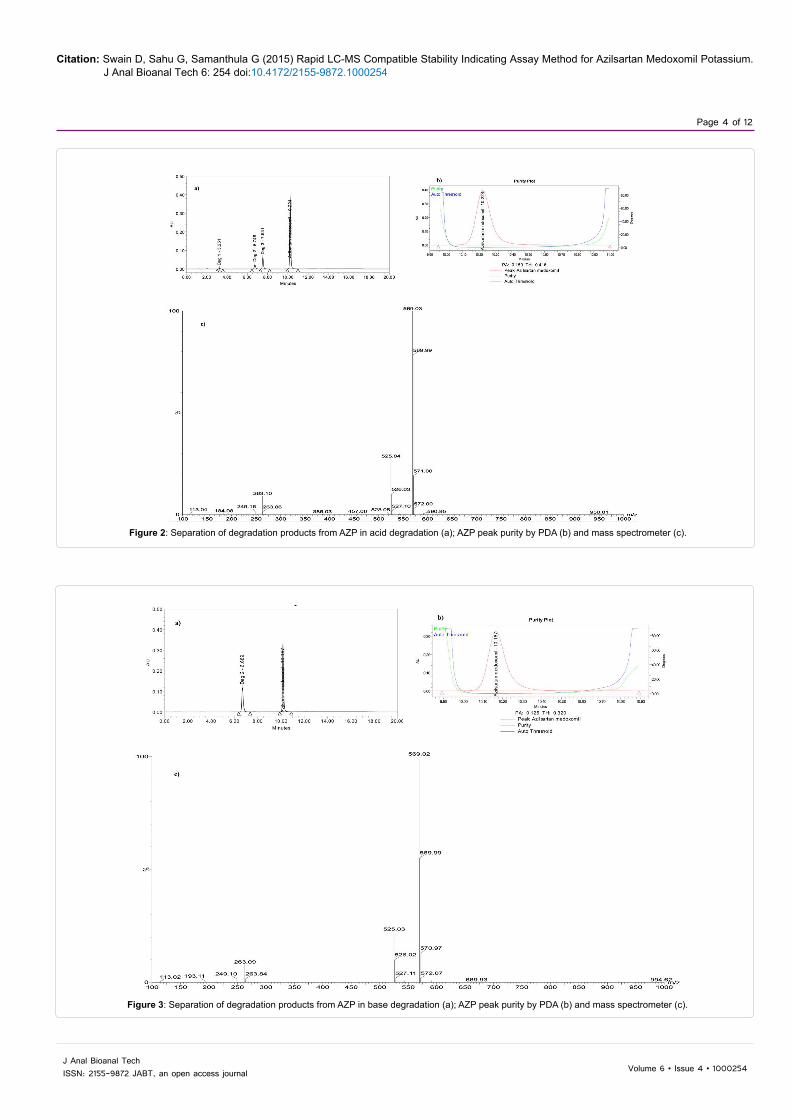
The forced degradation studies were carried out on the AZP drug substance [13-15]. The AZP degraded in acid, base and neutral hydrolysis as well as oxidative stress conditions (Figures 2-5). The AZP was extremely susceptible to even mild alkaline hydrolysis (0.01N NaOH) and degraded to about 26% within 15 min. at room temperature. The drug was found to be stable under photolytic and thermal degradation conditions. The degradation conditions and the percentage of the degradants formed were summarized in Table 1.
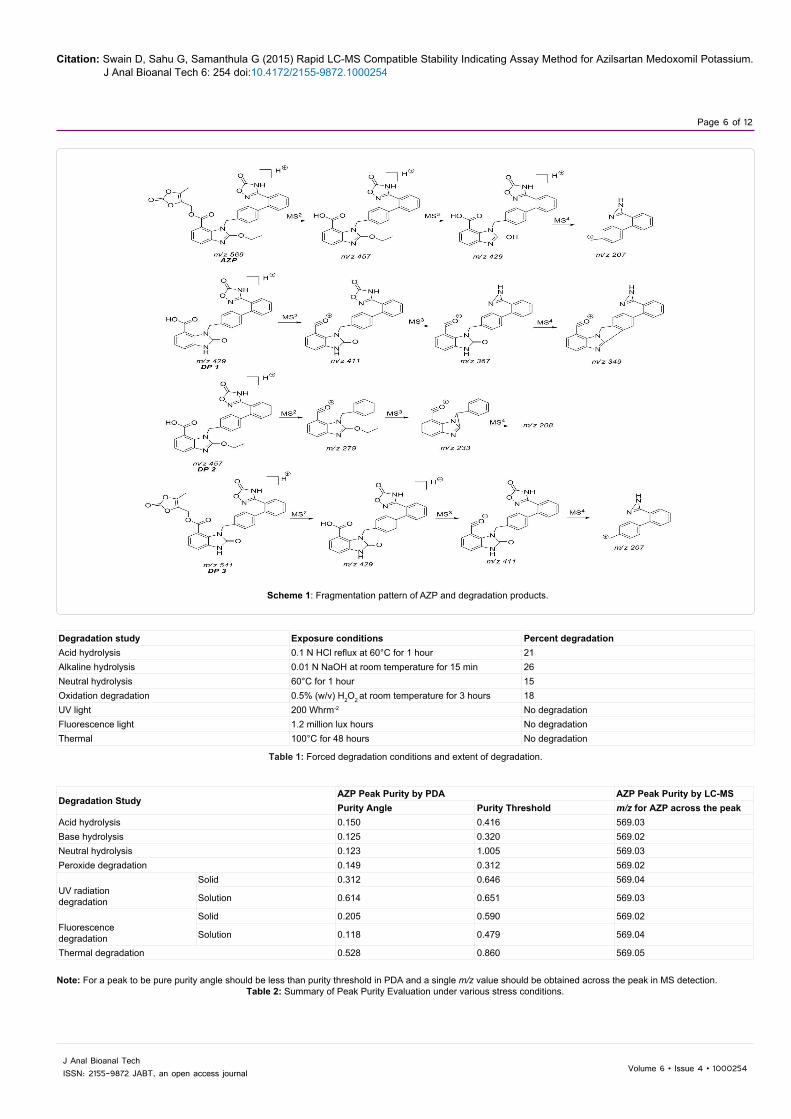
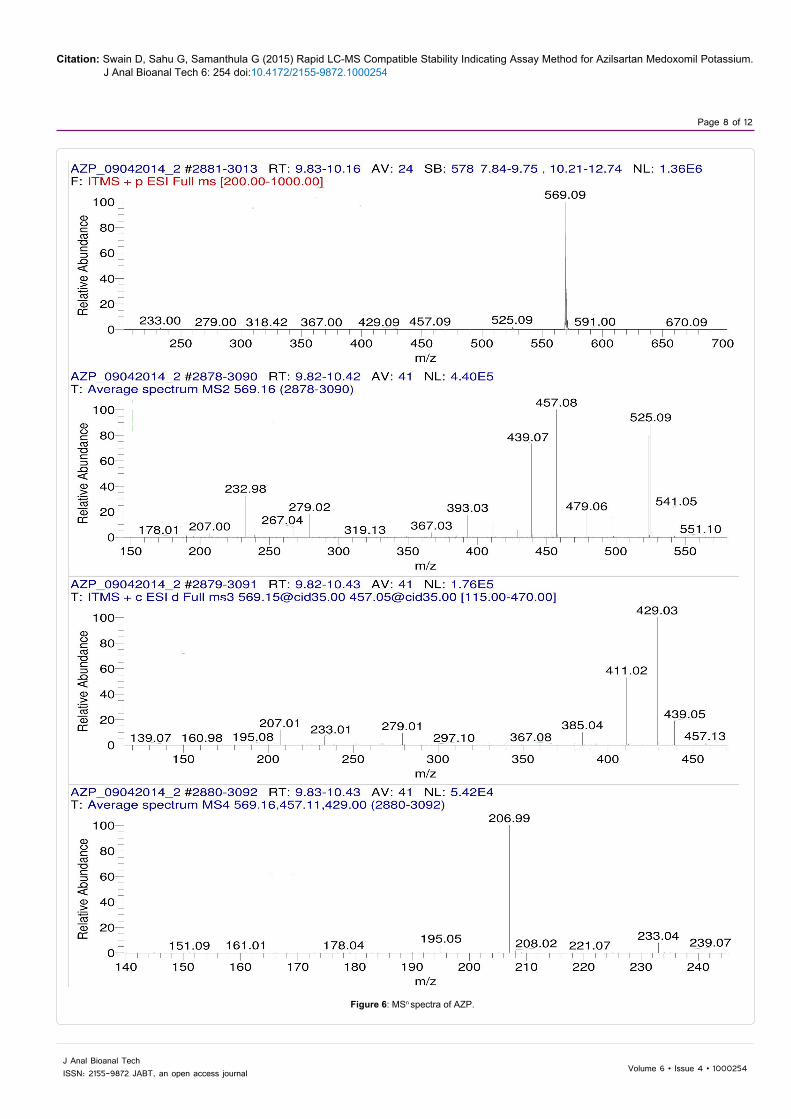
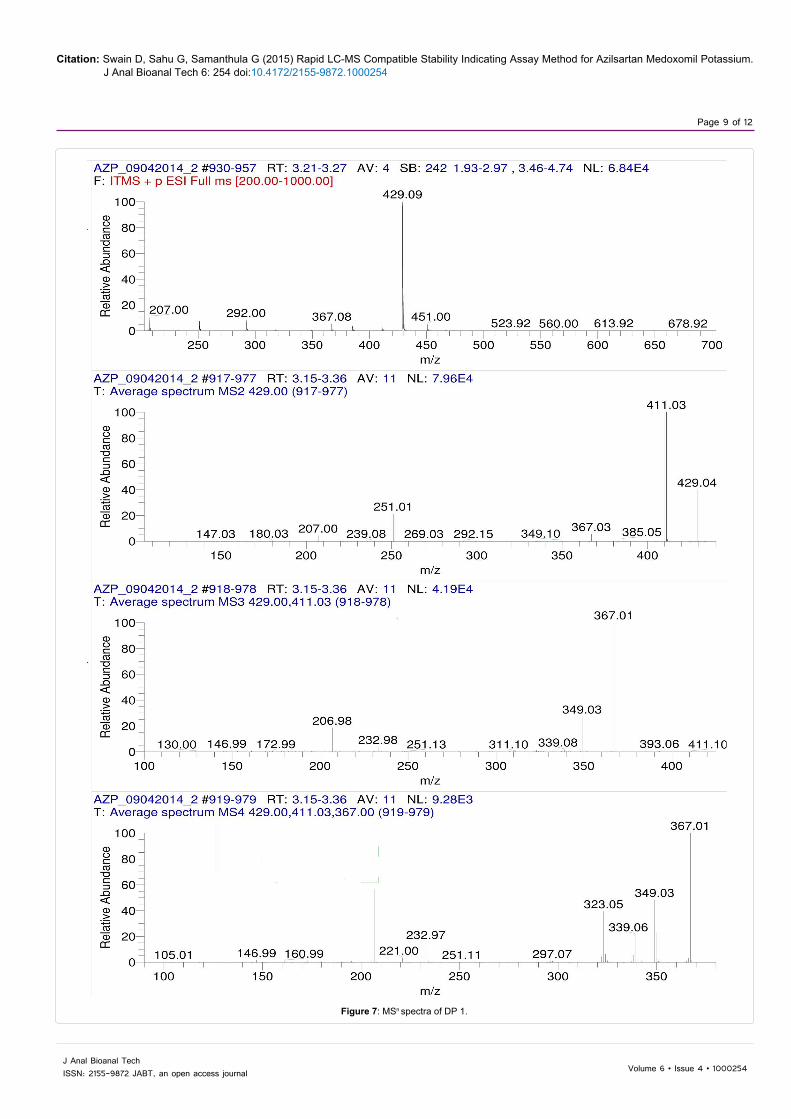
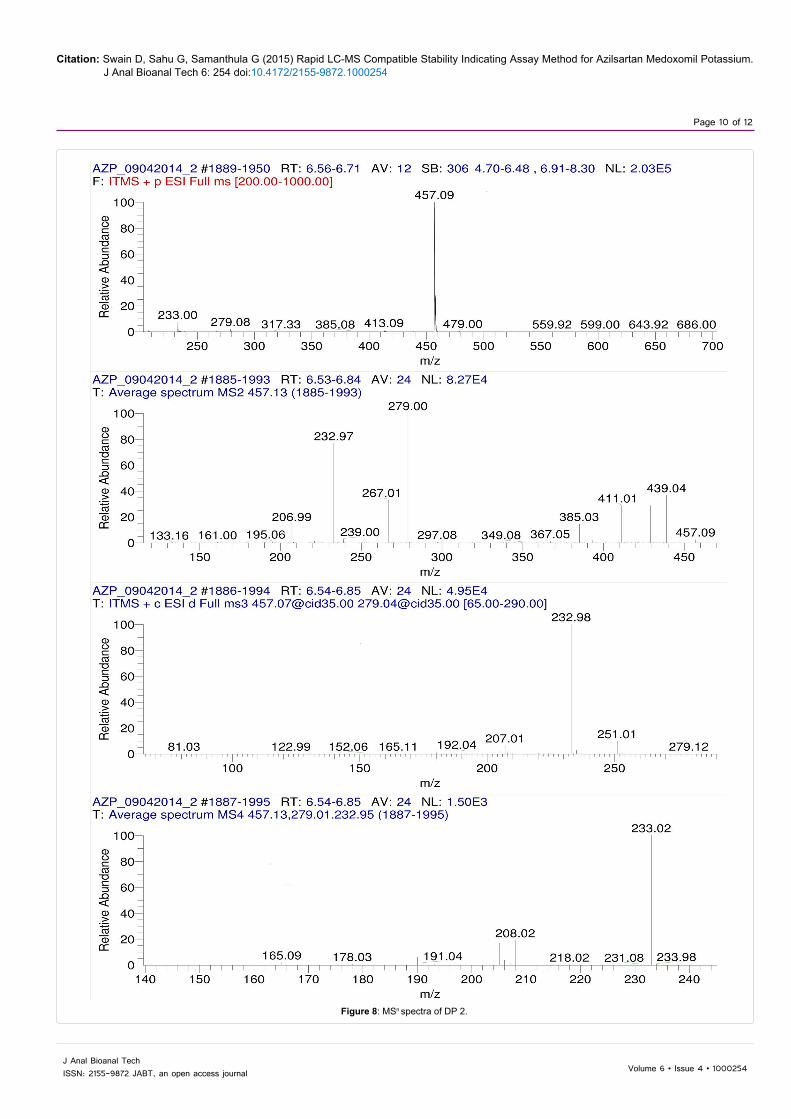
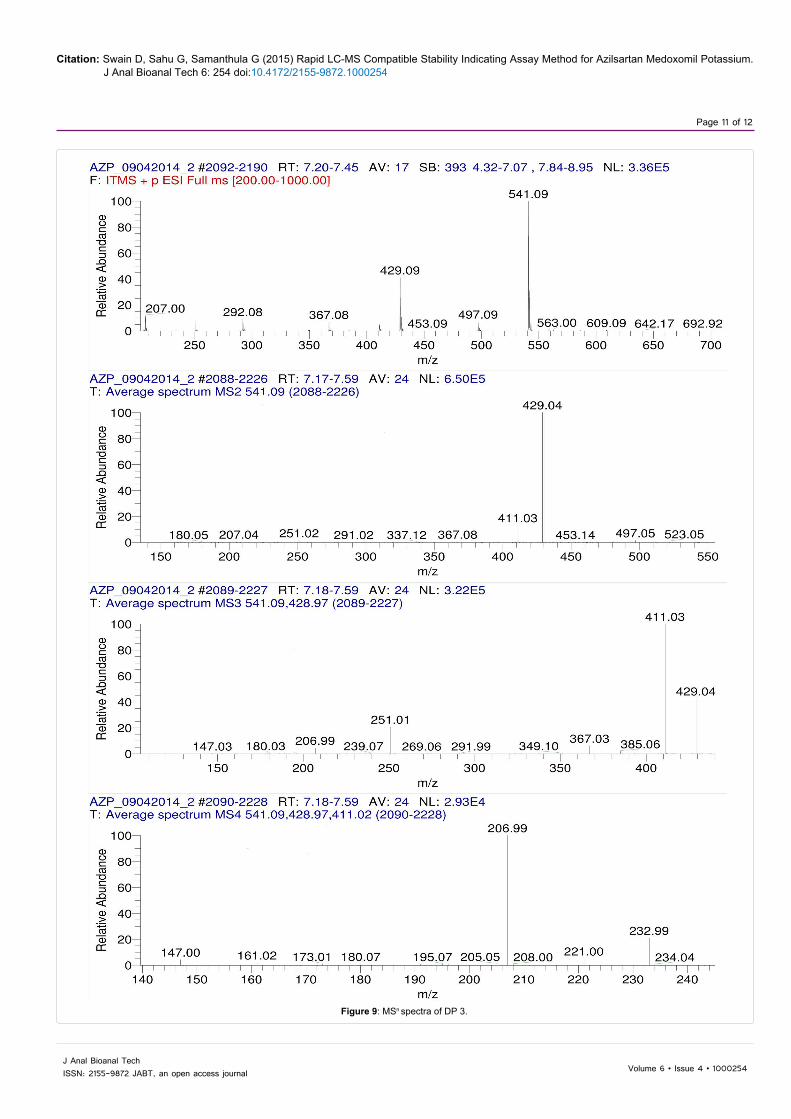
The LC-MSn studies were carried out to determine the possible structures of the degradation products. MSn spectra of AZP and each degradation product were shown in Figures 6-9. The structural information was obtained from the MSn fragmentation data as shown in Scheme 1.
The drug underwent significant degradation under hydrolytic and oxidative conditions resulting the formation of a common degradation product DP 2. The hydrolysis of the ester linkage under these conditions leads to the formation of DP 2. In acidic hydrolysis, the drug undergoes two cleavages simultaneously, one at the enolic ether bond and the other at the ester bond leading to the formation of DP 1. Since the enolic ethers are easily hydrolyzed by aqueous acids, the AZP extensively undergoes hydrolysis at enolic ether bond to give DP 3 as a major degradation product.
Method validation
The developed method was validated to establish the specificity, precision, linearity, accuracy and robustness according to ICH guidelines [16].
Specificity
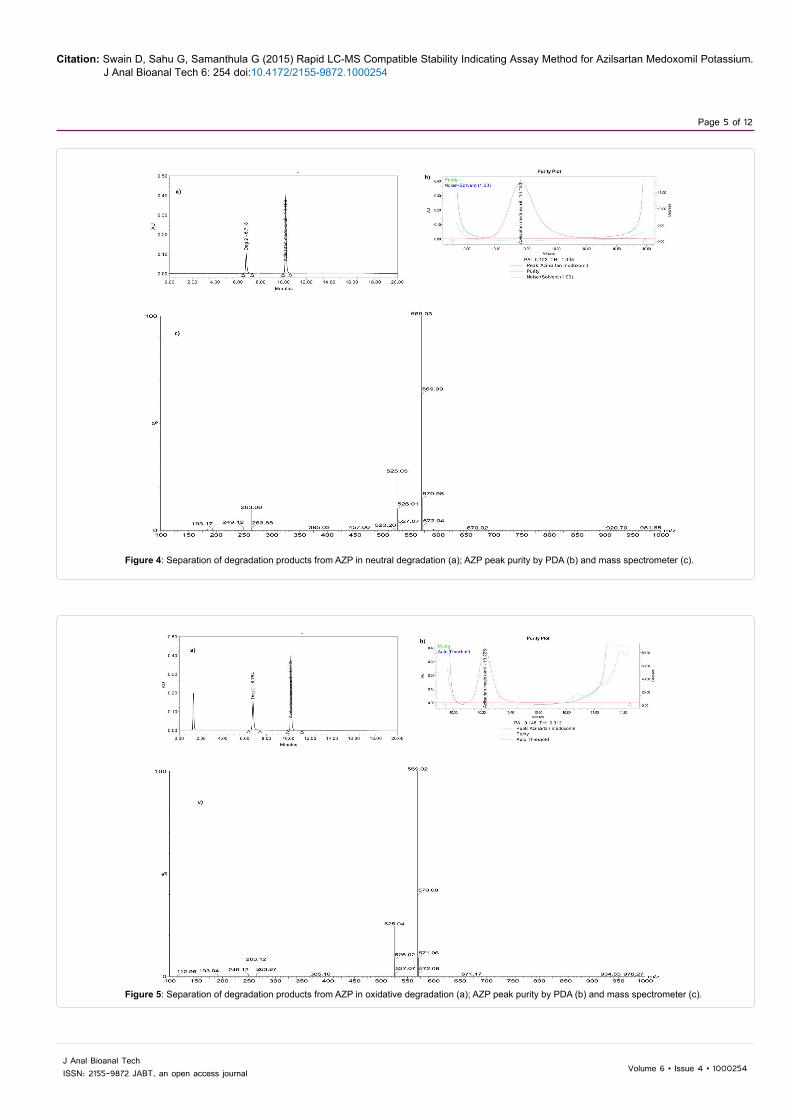
The specificity of the method was performed by ensuring the separation of the drug from all the degradation products formed under various stress conditions. The specificity of the method was established by evaluating the peak purity of AZP through PDA and mass spectrometric detection (Table 2). The results showed AZP to be pure and all the degradation products were separated and no other peaks were interfering with it (Figures 2-5).
Linearity
The linearity of the method was checked by injecting five concentration levels 160 (80%), 180 (90%), 200 (100%), 220 (110%) and 240 (120%) µg/mL of the standard solution. Each solution was injected in triplicate. Calibration equation was obtained from linear regression analysis and the correlation coefficient was found to be 0.99961which shows that the method is linear. The regression equation for the calibration curve was found to be y = 32224.51x + 46741.
Accuracy
The accuracy of the method was evaluated in triplicate at three concentration levels, i.e. 80% (160 µg/mL), 100% (200 µg /mL) and 120% (240 µg /mL) levels by spiking the AZP in tablet placebo. The percentage of recovery of the drug was calculated at each level. The tablet placebo consisted of crosscarmellose sodium (3% w/w), microcrystalline cellulose (20% w/w), hydroxypropylcellulose (5% w/w), magnesium stearate (2% w/w) and mannitol (50% w/w). The percentage recovery of the drug ranged from 98.9% to 100.7% indicating the accuracy of the method (Table 3).
Citation: Swain D, Sahu G, Samanthula G (2015) Rapid LC-MS Compatible Stability Indicating Assay Method for Azilsartan Medoxomil Potassium. J Anal Bioanal Tech 6: 254 doi:10.4172/2155-9872.1000254
Page 4 of 12
Volume 6 • Issue 4 • 1000254J Anal Bioanal TechISSN: 2155-9872 JABT, an open access journal
Figure 2: Separation of degradation products from AZP in acid degradation (a); AZP peak purity by PDA (b) and mass spectrometer (c).
Figure 3: Separation of degradation products from AZP in base degradation (a); AZP peak purity by PDA (b) and mass spectrometer (c).
Citation: Swain D, Sahu G, Samanthula G (2015) Rapid LC-MS Compatible Stability Indicating Assay Method for Azilsartan Medoxomil Potassium. J Anal Bioanal Tech 6: 254 doi:10.4172/2155-9872.1000254
Page 5 of 12
Volume 6 • Issue 4 • 1000254J Anal Bioanal TechISSN: 2155-9872 JABT, an open access journal
Figure 4: Separation of degradation products from AZP in neutral degradation (a); AZP peak purity by PDA (b) and mass spectrometer (c).
Figure 5: Separation of degradation products from AZP in oxidative degradation (a); AZP peak purity by PDA (b) and mass spectrometer (c).
Citation: Swain D, Sahu G, Samanthula G (2015) Rapid LC-MS Compatible Stability Indicating Assay Method for Azilsartan Medoxomil Potassium. J Anal Bioanal Tech 6: 254 doi:10.4172/2155-9872.1000254
Page 6 of 12
Volume 6 • Issue 4 • 1000254J Anal Bioanal TechISSN: 2155-9872 JABT, an open access journal
Scheme 1: Fragmentation pattern of AZP and degradation products.
Degradation study Exposure conditions Percent degradationAcid hydrolysis 0.1 N HCl reflux at 60°C for 1 hour 21Alkaline hydrolysis 0.01 N NaOH at room temperature for 15 min 26Neutral hydrolysis 60°C for 1 hour 15Oxidation degradation 0.5% (w/v) H2O2 at room temperature for 3 hours 18UV light 200 Whrm-2 No degradationFluorescence light 1.2 million lux hours No degradationThermal 100°C for 48 hours No degradation
Table 1: Forced degradation conditions and extent of degradation.
Degradation StudyAZP Peak Purity by PDA AZP Peak Purity by LC-MSPurity Angle Purity Threshold m/z for AZP across the peak
Acid hydrolysis 0.150 0.416 569.03Base hydrolysis 0.125 0.320 569.02Neutral hydrolysis 0.123 1.005 569.03Peroxide degradation 0.149 0.312 569.02
UV radiationdegradation
Solid 0.312 0.646 569.04
Solution 0.614 0.651 569.03
Fluorescencedegradation
Solid 0.205 0.590 569.02
Solution 0.118 0.479 569.04
Thermal degradation 0.528 0.860 569.05
Note: For a peak to be pure purity angle should be less than purity threshold in PDA and a single m/z value should be obtained across the peak in MS detection.Table 2: Summary of Peak Purity Evaluation under various stress conditions.
Citation: Swain D, Sahu G, Samanthula G (2015) Rapid LC-MS Compatible Stability Indicating Assay Method for Azilsartan Medoxomil Potassium. J Anal Bioanal Tech 6: 254 doi:10.4172/2155-9872.1000254
Page 7 of 12
Volume 6 • Issue 4 • 1000254J Anal Bioanal TechISSN: 2155-9872 JABT, an open access journal
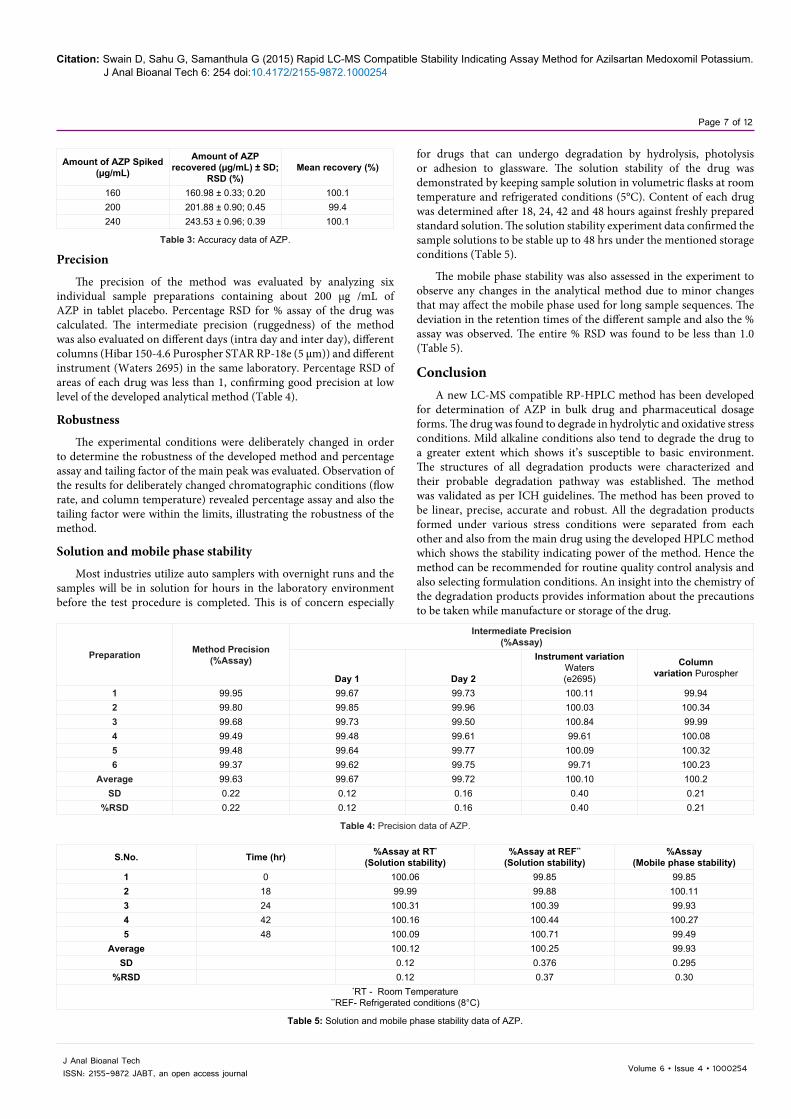
Precision
The precision of the method was evaluated by analyzing six individual sample preparations containing about 200 µg /mL of AZP in tablet placebo. Percentage RSD for % assay of the drug was calculated. The intermediate precision (ruggedness) of the method was also evaluated on different days (intra day and inter day), different columns (Hibar 150-4.6 Purospher STAR RP-18e (5 µm)) and different instrument (Waters 2695) in the same laboratory. Percentage RSD of areas of each drug was less than 1, confirming good precision at low level of the developed analytical method (Table 4).
Robustness
The experimental conditions were deliberately changed in order to determine the robustness of the developed method and percentage assay and tailing factor of the main peak was evaluated. Observation of the results for deliberately changed chromatographic conditions (flow rate, and column temperature) revealed percentage assay and also the tailing factor were within the limits, illustrating the robustness of the method.
Solution and mobile phase stability
Most industries utilize auto samplers with overnight runs and the samples will be in solution for hours in the laboratory environment before the test procedure is completed. This is of concern especially
Amount of AZP Spiked (µg/mL)
Amount of AZP recovered (µg/mL) ± SD;
RSD (%)Mean recovery (%)
160 160.98 ± 0.33; 0.20 100.1200 201.88 ± 0.90; 0.45 99.4240 243.53 ± 0.96; 0.39 100.1
Table 3: Accuracy data of AZP.
for drugs that can undergo degradation by hydrolysis, photolysis or adhesion to glassware. The solution stability of the drug was demonstrated by keeping sample solution in volumetric flasks at room temperature and refrigerated conditions (5°C). Content of each drug was determined after 18, 24, 42 and 48 hours against freshly prepared standard solution. The solution stability experiment data confirmed the sample solutions to be stable up to 48 hrs under the mentioned storage conditions (Table 5).
The mobile phase stability was also assessed in the experiment to observe any changes in the analytical method due to minor changes that may affect the mobile phase used for long sample sequences. The deviation in the retention times of the different sample and also the % assay was observed. The entire % RSD was found to be less than 1.0 (Table 5).
ConclusionA new LC-MS compatible RP-HPLC method has been developed
for determination of AZP in bulk drug and pharmaceutical dosage forms. The drug was found to degrade in hydrolytic and oxidative stress conditions. Mild alkaline conditions also tend to degrade the drug to a greater extent which shows it’s susceptible to basic environment. The structures of all degradation products were characterized and their probable degradation pathway was established. The method was validated as per ICH guidelines. The method has been proved to be linear, precise, accurate and robust. All the degradation products formed under various stress conditions were separated from each other and also from the main drug using the developed HPLC method which shows the stability indicating power of the method. Hence the method can be recommended for routine quality control analysis and also selecting formulation conditions. An insight into the chemistry of the degradation products provides information about the precautions to be taken while manufacture or storage of the drug.
Preparation Method Precision(%Assay)
Intermediate Precision(%Assay)
Day 1 Day 2
Instrument variationWaters(e2695)
Columnvariation Purospher
1 99.95 99.67 99.73 100.11 99.942 99.80 99.85 99.96 100.03 100.343 99.68 99.73 99.50 100.84 99.994 99.49 99.48 99.61 99.61 100.085 99.48 99.64 99.77 100.09 100.326 99.37 99.62 99.75 99.71 100.23
Average 99.63 99.67 99.72 100.10 100.2SD 0.22 0.12 0.16 0.40 0.21
%RSD 0.22 0.12 0.16 0.40 0.21
Table 4: Precision data of AZP.
S.No. Time (hr) %Assay at RT*
(Solution stability)%Assay at REF**
(Solution stability)%Assay
(Mobile phase stability)1 0 100.06 99.85 99.852 18 99.99 99.88 100.113 24 100.31 100.39 99.934 42 100.16 100.44 100.275 48 100.09 100.71 99.49
Average 100.12 100.25 99.93SD 0.12 0.376 0.295
%RSD 0.12 0.37 0.30*RT - Room Temperature
**REF- Refrigerated conditions (8°C)
Table 5: Solution and mobile phase stability data of AZP.
Citation: Swain D, Sahu G, Samanthula G (2015) Rapid LC-MS Compatible Stability Indicating Assay Method for Azilsartan Medoxomil Potassium. J Anal Bioanal Tech 6: 254 doi:10.4172/2155-9872.1000254
Page 8 of 12
Volume 6 • Issue 4 • 1000254J Anal Bioanal TechISSN: 2155-9872 JABT, an open access journal
Figure 6: MSn spectra of AZP.
Citation: Swain D, Sahu G, Samanthula G (2015) Rapid LC-MS Compatible Stability Indicating Assay Method for Azilsartan Medoxomil Potassium. J Anal Bioanal Tech 6: 254 doi:10.4172/2155-9872.1000254
Page 9 of 12
Volume 6 • Issue 4 • 1000254J Anal Bioanal TechISSN: 2155-9872 JABT, an open access journal
Figure 7: MSn spectra of DP 1.
Citation: Swain D, Sahu G, Samanthula G (2015) Rapid LC-MS Compatible Stability Indicating Assay Method for Azilsartan Medoxomil Potassium. J Anal Bioanal Tech 6: 254 doi:10.4172/2155-9872.1000254
Page 10 of 12
Volume 6 • Issue 4 • 1000254J Anal Bioanal TechISSN: 2155-9872 JABT, an open access journal
Figure 8: MSn spectra of DP 2.
Citation: Swain D, Sahu G, Samanthula G (2015) Rapid LC-MS Compatible Stability Indicating Assay Method for Azilsartan Medoxomil Potassium. J Anal Bioanal Tech 6: 254 doi:10.4172/2155-9872.1000254
Page 11 of 12
Volume 6 • Issue 4 • 1000254J Anal Bioanal TechISSN: 2155-9872 JABT, an open access journal
Figure 9: MSn spectra of DP 3.
Citation: Swain D, Sahu G, Samanthula G (2015) Rapid LC-MS Compatible Stability Indicating Assay Method for Azilsartan Medoxomil Potassium. J Anal Bioanal Tech 6: 254 doi:10.4172/2155-9872.1000254
Page 12 of 12
Volume 6 • Issue 4 • 1000254J Anal Bioanal TechISSN: 2155-9872 JABT, an open access journal
Acknowledgement
The authors are grateful to Dr. Ahmed Kamal, Project Director, NIPER-Hyderabad for his constant support and encouragement. One of the authors Debasish Swain is thankful to Ministry of Chemicals and fertilizers, Department of Pharmaceuticals, Govt. of India for providing the fellowship and USP India Pvt. Ltd. for providing facilities to carry out the research work.
References
1. Jones JD, Jackson SH, Agboton C, Martin TS (2011) Azilsartan Medoxomil(Edarbi): The Eighth Angiotensin II Receptor Blocker. P T 36: 634-640.
2. Zaiken K, Cheng JW (2011) Azilsartan medoxomil: a new Angiotensin receptor blocker. Clin Ther 33: 1577-1589.
3. Kurtz TW, Kajiya T (2012) Differential pharmacology and benefit/risk of azilsartan compared to other sartans. Vasc Health Risk Manag 8: 133-143.
4. Gorla R, Sreenivasulu B, Garaga S, Sreenivas N (2014) A simple and sensitive stability- indicating HPTLC assay method for the determination of azilsartanmedoxomil. IAJPR 4: 2985-2992.
5. Vekariya PP, Joshi HS (2013) Development and validation of RP-HPLCmethod for azilsartan medoxomil potassium quantitation in human plasma bysolid phase extraction procedure. ISRN Spectroscopy 2013: 572170.
6. Bakshi M, Singh S (2002) Development of validated stability-indicating assaymethods critical review. J Pharm Biomed Anal 28: 1011-1040.
7. ICH Harmonised Tripartite Guideline (2003) International Conference onHarmonisation of Technical Requirements for Registration of Pharmaceuticalsfor Human Use (ICH). Stability Testing of New Drug Substances and Products, Q1A(R2).
8. ICH Harmonised Tripartite Guideline (1996) International Conference onHarmonisation of Technical Requirements for Registration of Pharmaceuticalsfor Human Use (ICH). Stability Testing of New Drug Substances and Products, Q1B, Q1C.
9. Bryant DK, Kingswood MD, Belenguer A (1996) Determination of liquidchromatographic peak purity by electrospray ionization mass spectrometry. JChromatogr A 721: 41-51.
10. Sánchez FC, Khots M, Massart D, De Beer J (1994) Algorithms for theassessment of peak purity in liquid chromatography with photodiode-arraydetection. Part II. Anal Chim Acta 285: 181-192.
11. Sellers JA, Olsen BA, Owens PK, Gavin PF (2006) Determination of theenantiomer and positional isomer impurities in atomoxetine hydrochloride withliquid chromatography using polysaccharide chiral stationary phases. J PharmBiomed Anal 41: 1088-1094.
12. http://www.drugbank.ca/drugs/DB06695
13. Reynolds DW, Facchine KL, Mullaney JF, Alsante KM, Hatajik TD, et al. (2002) Available Guidance and Best Practices for Conducting forced degradationstudies. Pharmaceutical technology 2002: 48-56.
14. Blessy M, Patel RD, Prajapati PN, Agrawal Y (2014) Development of forceddegradation and stability indicating studies of drugs-A review. J Pharm Anal4: 159-165.
15. Singh S, Junwal M, Modhe G, Tiwari H, Kurmi M, et al. (2013) Forceddegradation studies to assess the stability of drugs and products. TrAC 49:71-88.
16. ICH Harmonised Tripartite Guideline (2005) International Conference onHarmonisation of Technical Requirements for Registration of Pharmaceuticalsfor Human Use (ICH). Validation of Analytical Procedures, Text andMethodology Q2(R1).