rank order coding: a retinal information decoding … · rank order coding: a retinal information...
TRANSCRIPT

Sensory and Motor Systems
Rank Order Coding: a Retinal InformationDecoding Strategy Revealed by Large-ScaleMultielectrode Array Retinal Recordings1,2,3
Geoffrey Portelli,1,� John M. Barrett,2,� Gerrit Hilgen,2 Timothée Masquelier,3,4,5,6 AlessandroMaccione,7 Stefano Di Marco,7 Luca Berdondini,7 Pierre Kornprobst,1,† and Evelyne Sernagor2,‡
DOI:http://dx.doi.org/10.1523/ENEURO.0134-15.2016
1Biovision Team, Inria Sophia Antipolis Méditerranée, FR-06902, Sophia Antipolis, France, 2Faculty of MedicalSciences, Institute of Neuroscience, Newcastle University, Newcastle-upon-Tyne NE2 4HH, United Kingdom,3INSERM, U968, Paris, F-75012, France, 4Sorbonne Universités, UPMC Univ Paris 06, UMR S 968, Institut de laVision, Paris, F-75012, France, 5CNRS, UMR 7210, Paris, F-75012, France, 6Present address: CERCO UMR 5549,CNRS – Université de Toulouse, F-31300, France, 7NetS3 Laboratory, Neuroscience and Brain Technologies Dpt.,Istituto Italiano di Tecnologia, Genova, Italy.
Visual Abstract
0.05 0.1 0.15 0.2 0.25 0.3 0.35 0.4 0.45 0.50
0.25
0.5
0.75
1
Time window [s]
Frac
tion
corre
ct
Time [s]
Neur
ons
0 0.2 0.4
Discrimination task
SpikecountLatencyRank Order Code w latenciesRank Order Code w spikecounts
Receptive fields How a population of retinal ganglioncells (RGCs) encodes the visualscene remains an open question. Go-ing beyond individual RGC codingstrategies, results in salamander sug-gest that the relative latencies of aRGC pair encode spatial information.Thus, a population code based onthis concerted spiking could be apowerful mechanism to transmit visualinformation rapidly and efficiently.Here, we tested this hypothesis inmouse by recording simultaneouslight-evoked responses from hun-dreds of RGCs, at pan-retinal level,using a new generation of large-scale, high-density multielectrode ar-
ray consisting of 4096 electrodes. Interestingly, we did not find any RGCs exhibiting a clear latency tuning to the
Significance Statement
How the retina encodes the visual environment remains an open question. Using a new generation oflarge-scale high-density multielectrode array, we show that in large populations of mammalian retinalganglion cells (RGCs), a significant amount of information is encoded synergistically in the concertedspiking of the RGC population. Thus, the RGC population response described with relative activities, orranks, provides more relevant information than classical neural codes, such as independent spike count- orlatency-based codes. In particular, and for the first time, we show that the wave of first stimulus-evokedspikes (WFS) across the whole population reliably encodes and rapidly transmits information about newvisual scenes. This strategy of WFS could also apply to different sensory modalities.
New Research
May/June 2016, 3(3) e0134-15.2016 1–18

stimuli, suggesting that in mouse, individual RGC pairs may not provide sufficient information. We show that asignificant amount of information is encoded synergistically in the concerted spiking of large RGC populations.Thus, the RGC population response described with relative activities, or ranks, provides more relevant informationthan classical independent spike count- or latency- based codes. In particular, we report for the first time thatwhen considering the relative activities across the whole population, the wave of first stimulus-evoked spikes isan accurate indicator of stimulus content. We show that this coding strategy coexists with classical neural codes,and that it is more efficient and faster. Overall, these novel observations suggest that already at the level of theretina, concerted spiking provides a reliable and fast strategy to rapidly transmit new visual scenes.
Key words: ganglion cells; multielectrode array; population coding; rank order coding; retina
IntroductionUnderstanding information processing in the nervous
system by exploring the neural code is a major challenge(Rieke et al., 1997). In the visual system, many questionsremain open about how spike trains generated by retinalganglion cells (RGCs) encode and convey informationabout the visual environment. Greschner et al. (2006)showed that information can be read-out from simpleresponse features, such as the spike count, the latency ofthe first spike event, or the latency between different spikeevents. But simple coding strategies, such as spike count-based coding, are insufficient and more information-rich codes,such as spike-timing, that take into account the precise timingof occurrence of the spikes of individual RGCs are necessary tomatch behavioral performance (Jacobs et al., 2009).
Beyond the individual RGC coding strategies, the con-certed spiking of a pair of RGCs, e.g., relative latencies ofsome RGC pairs, can encode spatial information in thesalamander retina (Gollisch and Meister, 2008). In thatpaper, the authors suggested that “a population codebased on differential spike latencies could be a powerfulmechanism to rapidly transmit new visual scenes”. Oth-erwise stated, this amounts to considering the structure ofthe global concerted spiking pattern, i.e., the relative ac-tivities.
Among the algorithms available to read out concertedspiking patterns (Rieke et al., 1997), a classical one is the
rank-order code (ROC) strategy, where the information isnot coded in the precise timing of spikes for each input,but rather in the relative order in which the neurons fire(Gautrais and Thorpe, 1998; Thorpe et al., 2001). Thiscoding strategy was established in the context of ultrafastvisual categorization by considering that the human visualsystem can analyze and classify a new complex scene in�200 ms (Thorpe et al., 1996; Kirchner and Thorpe, 2006;Crouzet et al., 2010). The ROC strategy has computa-tional advantages, such as robustness and fast process-ing, compared to classical spike count- and latency-based independent coding strategies (VanRullen et al.,2005). Therefore, by looking at the relative latency pattern,the ROC scheme may represent a strategy to accesssynergistically encoded information, i.e., informationavailable in the population response that is not availablewhen considering RGC responses individually. These ad-vantages of ROC were highlighted using simplified retinamodels (VanRullen and Thorpe, 2001). However, to ourknowledge, this has never been investigated experimen-tally.
In this study, we investigated whether the relative ac-tivities of a large RGC population might be a mechanismfor encoding visual information in the mammalian retina.To this aim, we recorded the simultaneous activity fromhundreds of mouse RGCs in response to flashing gratingswith varying phases (as in Gollisch and Meister (2008))and also with varying spatial frequencies. The RGCs weresimultaneously recorded with the Active Pixel SensorCMOS Multi-Electrode Array consisting of 4096 elec-trodes (4096 APS CMOS MEA) spanning an active area of2.67 � 2.67mm (Berdondini et al., 2009, Maccione et al.,2014). These experiments led us to the three main follow-ing observations.
First, contrary to what has been found in salamander(Gollisch and Meister, 2008), in the mouse retina we didnot observe any tuning of the relative latencies to theonset of the stimuli of individual RGC pairs, regardless ofwhether these cells were of the ON, OFF, or ON-OFF type.Inspection of the raster plots of all RGCs we recordedsuggests that this lack of latency tuning may stem fromstrong spontaneous background activity, which is com-mon in the mammalian retina. However, when consideringthe global relative activity pattern, we show that the waveof first stimulus-evoked spikes (WFS) is tuned to thegrating phase.
Second, we found that a significant amount of informa-tion is encoded synergistically in the population response.Thus, the RGC population response described with rela-
Received November 10, 2015; accepted May 4, 2016; First published May 12,2016.1The authors report no conflict of interest.2Author contributions: G.P., P.K., and E.S. designed research; G.P., J.M.B.,
and G.H. performed research; G.P., J.M.B., G.H., T.M., A.M., P.K., and E.S.analyzed data; G.P., J.M.B., G.H., T.M., A.M., S.D.M., L.B., P.K., and E.S.wrote the paper; J.M.B., T.M., S.D.M., and L.B. contributed unpublishedreagents/analytic tools.
3This work was supported by the 7th Framework Program for Research ofthe European Commission [Grant agreement 600847: RENVISION, project ofthe Future and Emerging Technologies (FET) program Neuro-bio-inspiredsystems FET-Proactive Initiative] and the Wellcome Trust (grant 096975/Z/11/Z). We thank Bruno Cessac and Matthias Hennig for their insightful discussionsand the two reviewers who helped to improve the paper.
*G.P. and J.M.B. contributed equally as first authors.‡P.K. and E. S. contributed equally as senior authors.Correspondence should be addressed to Dr Geoffrey Portelli, Biovision
team, Inria Sophia Antipolis Méditerranée, 2004 Route des Lucioles-BP 93,FR-06902 Sophia Antipolis, France. E-mail: [email protected].
DOI:http://dx.doi.org/10.1523/ENEURO.0134-15.2016Copyright © 2016 Portelli et al.This is an open-access article distributed under the terms of the CreativeCommons Attribution 4.0 International, which permits unrestricted use, distri-bution and reproduction in any medium provided that the original work isproperly attributed.
New Research 2 of 18
May/June 2016 2016, 3(3) e0134-15.2016 eNeuro.sfn.org

tive activities might provide efficient coding capabilities.Using a Bayesian framework, we compared the codingperformance of WFS (read-out with a ROC) with a corre-lated spike count code (ROC with spike counts) andclassical spike count- and latency-based codes in a dis-crimination task that consisted of identifying the correctphase from a set of RGC responses.
Finally, we show that relative activities are more efficientthan classical independent codes by comparing the dis-crimination performance with increasing size of the RGCpopulation, and faster by varying the length of the obser-vation window after the stimulus onset.
Materials and MethodsIn this paper, we present results from two retinal data-
sets, D1 and D2, with simultaneous recordings performedwith the 4096 APS CMOS MEA, involving 764 and 649RGCs respectively (D1: 39-day-old and D2: 52-day-oldC57Bl/6 mouse). We had initially performed similar exper-iments using a conventional 60-channel MEA and pooledthe data from several retinas (Dataset D3: 9 retinas, 258RGCs). Mice of both sexes were used.
All experimental procedures were approved by the UKHome Office, Animals (Scientific Procedures) Act 1986.
Stimulus designThe stimuli used in this study were modeled on those
used by Gollisch and Meister (2008). In their study, theauthors used square-wave gratings of varying phase andwith a 300 �m bar width, which is 2.5 times the averageRGC receptive field (RF) size in salamander. Here, thestimuli were 32 square wave gratings with four spatialfrequencies and eight phases. Considering an averagemouse RF of 200–300 �m, the bar widths used were1600, 800, 400, and 200 �m in order to be close to the2.5-fold ratio. As 1° � 30 �m on the mouse retina(Remtulla and Hallett, 1985), the four spatial frequenciescorrespond to 0.009, 0.018, 0.037, and 0.075 cycles perdegree (cpd). We will use the notation mcpd to representcpd values in the 10�3 range. For each spatial frequency,we define eight phases � by applying to the gratings ashift of 1/4 � the bar width, ie, in phase angle � � {0, 45,90, 135, 180, 225, 270, 315}°. The 32 stimuli are sorted byfrequencies: stimuli 1–8 (9 mcpd), 9–16 (18 mcpd), 17–24(37 mcpd), and 25–32 (75 mcpd). Each stimulus waspresented 150 times in randomized blocks of 32 stimuli.Stimuli were flashed for 0.5 s followed by a uniform graymask flashed for 1 s.
For the dataset D1, only the first 105 trials were con-sidered in the analysis.
High-resolution photostimulation and large-scaleRGCs electrophysiological recordings
Datasets D1 and D2 presented here consist of thelight-evoked responses of hundreds of adult mouseRGCs, which were simultaneously recorded using the4096 APS CMOS-MEA platform (Biocam 4096, 3BrainGmbH; Maccione et al., 2014).
Animals were dark-adapted overnight prior to retinalisolation. On the day of the experiment, the mouse waskilled by cervical dislocation, eyes were quickly enucle-
ated and placed in artificial cerebrospinal fluid (aCSF)containing the following (in mM): 118 NaCl, 25 NaHCO3, 1NaH2 PO4, 3 KCl, 1 MgCl2, 2 CaCl2, 10 glucose, and 0.5L-glutamine, equilibrated with 95% O2 and 5% CO2. Theretina was isolated from the eyecup and flattened, RGClayer facing down, onto the active area of the CMOS-MEAchip. Throughout recording, retinas were maintained at32°C and perfused with aCSF at a rate of 1 ml/min. Allsurgical procedures were performed under dim red lightand the room was maintained in darkness throughout theexperiment.
Pan-retinal RGCs responses to visual stimuli wererecorded using the 4096 APS CMOS-MEA platform inte-grated with a custom built high-resolution photostimula-tion system. The photostimulation system is based on aDLP video projector (“lightCrafter”, Texas Instruments),and was designed to project visual stimuli with microme-ter spatial resolution over the entire retina and at sub-millisecond precision. Briefly, retinas were prepared andmaintained on BioChips 4096S� (3Brain GmbH). TheseCMOS-MEAs provide an array of 64 � 64 simultaneouslyrecording electrodes over an active area of 2.67 � 2.67mm and an overall plain area of 6 � 6 mm used to flattenthe retina on the chip, ensuring good contact between thetissue and the electrodes. The platinum electrodes are21 � 21 �m in size (42 �m pitch). Full-array recordingswere performed at a sampling frequency of 7.06 kHz/electrode and a trigger signal generated by the photo-stimulation was simultaneously sampled at the samefrequency in order to precisely synchronize the delivery ofthe light stimuli with the electrophysiological responsesrecorded from the RGCs. The total area covered by thelight patterns is 664 � 664 pixels and each light-pixelcovers 4 � 4 �m2 of the chip active area. Neutral densityfilters (ND 4, mean luminance 1.72 �W/cm2) were used tocontrol the amount of light falling on the retina. Large-scale electrophysiological data from the 4096 electrodeswere analyzed using a spike detector (Quantile-basedevent detection, Maccione et al., 2014; Muthmann et al.,2015) and single-unit spikes were sorted using theT-Distribution Expectation-Maximization algorithm in Of-fline Sorter (Plexon). Sorted units that had a reasonableamount of spike waveforms in relation to the recordinglength (0.1 spikes/s) were then verified by visual in-spection of the found clusters in the 2/3D principle com-ponent feature space (well separated clusters), calculatedISIs (refractory period), and waveforms (differentshapes) in the Offline Sorter GUI. Due to the high densityof electrodes, the same units were sometimes detectedon multiple electrodes. These redundant units were re-moved by comparing coincident spikes between neigh-boring units. Briefly, for each unit, spikes occurring within�2 frames (1 frame � 1/7.06 ms) were detected in all unitson the four closest electrodes and marked. This was donefor all units, and then units with more than 5% coincidentspikes were iteratively removed, such that for each coin-cident group only the one with the largest spike count wasretained. We tested several thresholds but 5% seemedlike a good compromise. Indeed, it is extremely unlikelythat different units would repeatedly and consistently fire
New Research 3 of 18
May/June 2016 2016, 3(3) e0134-15.2016 eNeuro.sfn.org

together within a window as brief as 700 ns (and becauseof the mosaic arrangement of RGC subtypes, it is unlikelyto find responses originating from distinct RGCs, withdifferent kinetics, within 40 �m from each other).
RGCs electrophysiological recordings withconventional 60-MEAs
The dataset D3 consists of data pooled from ninemouse retinas (C57BL/6 mice aged 19–46 postnataldays) where the light-evoked responses of RGCs wererecorded using a conventional 60-channel indium tin ox-ide MEA (60MEA200/30iRITO; Multichannel Systems). Wepresented the stimuli using a 6.5 inch LCD monitor(640 � 480 pixels, 60 Hz refresh rate), focused onto theRGC layer using a pair of lenses (Edmund Optics) and a2� objective on an Olympus IX-71 inverted microscope.Stimuli were generated in MATLAB (MathWorks) and con-trolled using Psychotoolbox (Brainard, 1997; Pelli, 1997;Kleiner et al., 2007). Each monitor pixel covered an area of23.333 � 23.333 �m2, so the four bar widths correspondto spatial frequencies of 10, 20, 40, and 80 mcpd. Retinaswere prepared for recording using the same method as forAPS CMOS-MEA experiments. Extracellular signals wereacquired using an MEA1060-Inv amplifier, digitized, andsampled at 25 kHz by an MC_Card data acquisition cardand recorded using MC_Rack (MultiChannel Systems).Action potentials were extracted offline in MC_Rack usinga voltage threshold set at 6.5–8 standard deviations (SD)below the signal recorded on each channel during a base-line recording taken at the start of each experiment, be-fore the retina was placed on the MEA. Spike sorting wasdone for all channels using the same procedure as fordata recorded on the APS CMOS-MEA.
RGCs selection and classificationBefore the main flashing gratings stimulation, we ap-
plied two sequences for cell selection and classificationpurposes.
One of the sequences consisted of 15 min of randomlyflickering (10 Hz) checkerboard (100 �m square) black orwhite stimuli. For each cell which had an average spike rateacross the entire checkerboard stimulation 0.5 Hz, thespike trains were reverse correlated to the stimulus (spiketriggered average; Chichilnisky, 2001), yielding an average3D volume in space and time that triggers the cell to spike:the estimated RF. We considered the 2D-spatial componentof the 3D RF at the time when the absolute value of the RFreaches its maximum. A custom blob-detection script inMATLAB (MathWorks) was used to select the 2D RFs thatwere well estimated. This approach yielded the selection of764 RGCs for dataset D1, and 649 RGCs for dataset D2.
The other sequence consisted of full-field light stimula-tion with 60 repetitions of alternating homogeneous2-s-white, 2-s-black stimuli. We estimated each unit’sinstantaneous firing rate by convolving its spike train witha Gaussian (SD� 25 ms). We then computed a Bias Index(Carcieri et al., 2003) that measures the relative amplitudeof the ON and the OFF responses. This index ranges from�1 for pure OFF responses to 1 for pure ON responses.We used this bias index to classify the cells into: OFF cells(�1�bias index��0.33), ON-OFF cells (�0.33�bias in-
dex�0.33), and ON cells (0.33�bias index�1). For thedataset D3, any unit firing fewer than 30 spikes to thefull-field stimulus was rejected (assuming a respondingunit should have at least one spike per trial). Responses towhite noise were not recorded in these retinas, so insteadresponsive units were detected using the Rayleigh test fornon-uniformity of circular data on a subset (25/150) of theresponses to the second-largest gratings (which werefound by visual inspection of rasters to evoke the largestresponses). Blocks containing trials used for detectingresponsive units were excluded from further analysis.
Spearman’s rank correlation coefficientThe Spearman rank correlation coefficient � is a non-
parametric measure of statistical dependence betweentwo variables. Applied here for a spike train of size nneurons, the n latencies of the first spikes Ai and Bi relatedto two different stimuli are converted to ranks ai, bi, and �is computed as the Pearson correlation coefficient r be-tween the ranks:
� � rai,bi�
cov(rai, rbi
)
�ai�bi
. (1)
Identical latencies are assigned tied ranks and � iscomputed using the standard formula:
� � 1 �6� �i�1
n(ai � bi)2 � � cf�n(n2 � 1)
with cf �m�m2 � 1�
12, (2)
where cf denotes a correction factor computed for eachtied rank and m denotes the number of observations tiedto a particular rank. As this correlation coefficient is mea-sured on the ranks of spikes, this measure can be inter-preted as a measure of how different are the ranks of thefirst occurring spikes driven by the two different stimuli:� � 1 for identical ranked lists and � � �1 for oppositeranked lists.
Partial information decompositionTo quantify the amount of synergy contained in RGC
population responses, we calculated the partial informa-tion decomposition (PID) for RGC pairs (Williams and Beer2010). We chose PID for two reasons. First, it is asym-metric in that it quantifies mutual information between onerandom variable and an ensemble of random variables,making it a natural fit for experiments where we recordresponses of multiple neurons to a single stimulus. Sec-ond, unlike many other synergy measures used in theneuroscience literature, it is guaranteed to be non-negative and is able to measure synergy and redundancysimultaneously (Timme et al., 2014).
The idea behind PID is to decompose information pro-vided by an ensemble of random variables R (e.g., re-sponses of individual neurons) about another variable S(e.g., a stimulus) into the information provided by eachvariable individually, by each subset of variables, and by
New Research 4 of 18
May/June 2016 2016, 3(3) e0134-15.2016 eNeuro.sfn.org

the whole ensemble. The full derivation of the PID isavailable from Williams and Beer (2010), but the calcula-tion for the two-variable case is described below with thehelp of the partial information diagram in Figure 3A. Thetwo inner circles represent the information carried by eachindividual variable about the stimulus:
I(S ;Ri) � �s
�ri
p(s, ri) log2
p(s, ri)p(s)p(ri)
for i � 1, 2. (3)
Where the two circles overlap is the redundant informationbetween the two variables. To calculate the redundancy, thespecific information provided by each variable Ri about aparticular stimulus value s is first calculated as the Kullback–Leibler divergence between the distribution of Ri conditionedon s and the marginal distribution of Ri, i.e.:
I(S � s ;Ri) � DKL(Ri |S � s||Ri)
� �ri
p(ri |S � s)log2
p(ri |S � s)p(ri)
. (4)
(The specific information is not explicitly expressed as aKullback–Leibler divergence by Williams and Beer (2010),but the equivalence can be shown trivially by applyingBayes’s rule and basic logarithmic identities to their for-mula.) The redundancy is then the expectation over thestimulus distribution of the minimum specific informationprovided by either variable about each stimulus value, i.e.:
Red(S ;R1, R2) � �s
p(s)mini�1,2
I(S � s ;Ri). (5)
The unique information carried by each variable is themutual information between that variable and the stimulusless the redundant information:
Unq(S ;Ri) � I(S ;Ri) � Red(S ;R1, R2). (6)
The outer ellipse in Figure 2A represents the mutualinformation between the pair and the stimulus:
I(S ;R1, R2) � �s
�r1
�r2
p(s, r1, r2)log2
p(s, r1, r2)p(s)p(r1, r2)
.
(7)
Finally, the area of this ellipse not covered by theredundant or unique information is the synergistic in-formation:
Syn(S ;R1, R2) � I(S ;R1, R2) � Unq(S ;R1)� Unq(S ;R2) � Red(S ;R1, R2). (8)
Substituting the equation for Unq(S;Ri) into Equation 8reveals the advantage of the PID over more intuitive mea-sures of synergy, such as the redundancy–synergy index(RSI; used by Schneidman et al., 2011):
RSI(S ;R1, R2) � I(S ;R1, R2) � I(S ;R1) � I(S ;R2), (9)
RSI(S ;R1, R2) � Syn(S ;R1, R2) � Red(S ;R1, R2). (10)
That is, the RSI is the PID synergy less the PID redun-dancy. A positive RSI is often taken to mean synergisticcoding and a negative RSI redundant, but an RSI close tozero could mean anything from independent coding to acode that comprises equal parts synergistic informationand redundant information with no independent informa-tion. Because we were interested in detecting synergyregardless of the nature of the remaining information, thePID was the more natural fit.
The PID can be defined similarly for larger ensembles,but the complexity of the corresponding partial informa-tion diagrams and the resulting expressions become ex-cessively complex extremely quickly as the number ofvariables increases. Additionally, the more neurons areincluded in the ensemble, the higher the dimensionality ofthe underlying probability distributions and the more datais required to estimate them accurately and precisely(note that this limitation applies to all synergy measuresbased on mutual information, not just PID). For thesereasons, we decided to restrict our analysis to the two-variable case, i.e., pairs of neurons.
We took each Ri as the number of spikes fired by the ithneuron of a pair during the presentation of the stimulus.We calculated the PID for every pair of neurons that wasunique up to ordering: that is, if the PID for a pair (i,j) wascalculated, we did not calculate the PID for the pair (j,i).Due to the long presentation times (500 ms), we deemedit unnecessary to include any of the period immediatelyfollowing the stimulus, as 500 ms is sufficient to capturethe entire response of all but the most sustained of cells.
To correct for bias introduced by limited sampling of thedata, each of DKL(Ri|S�s�Ri), I(S;Ri), and I(S;R1,R2) wasseparately bias corrected using the subsampling methodof Gollisch and Meister (2008). Briefly, after obtaining anestimate using the whole data set of N trials, the data israndomly partitioned into halves, thirds, and so on, andnew estimates calculated for each of these partitions. Wefit a second-degree polynomial to the estimate as a func-tion of the number of partitions: the intercept of thispolynomial corresponds to the estimate one would obtainwith infinite samples and is taken as an unbiased estimateof the true value. We also attempted to apply the PID tocontinuous response variables, such as first spike latencyand whole spike trains, but were unable to find a suffi-ciently accurate and unbiased estimator of the underlyingentropies and so those results are not reported here.
Discrimination taskTo quantify the performance of the relative activities in
encoding stimulus information, we used a discriminationtask. Based on RGC responses, the discrimination taskconsists of identifying the phase � � {0, 45, 90, 135, 180,225, 270, 315}° among the eight gratings of a given spatialfrequency. We used a classical supervised Bayesian clas-sifier allowing different codes to be tested within the sameformalism: the independent spike count code, the inde-pendent latency code, the WFS (ROC based on the laten-cies), and a correlated spike count code (ROC based onthe spike counts).
New Research 5 of 18
May/June 2016 2016, 3(3) e0134-15.2016 eNeuro.sfn.org

From the available trials, one-half are randomly chosenas training set for each stimulus and the responses fromthe remaining trials are the testing set, corresponding tothe unknown stimulus �̃. For each �̃, we find an estimate�� using the a maximum a posteriori criterion:
�� � argmin�
�� log(P(� r�̃))� , (11)
where r�̃ represents the set of responses from the testedphase. We used Bayes’s theorem to estimate P (�|r) fromthe response distribution P (r|�), which depends on thecode chosen. For each stimulus �̃ tested, 150 differentconfigurations of training set and test set were randomlychosen. Each time the Bayesian classifier was run toguess the phase ��. Results were stored in a 8 � 8-con-fusion matrix M (M( ��, �̃)) that was incremented after ev-ery classification. Each column of M represents the resultsover all configurations when a given phase �̃ was tested.If the maximum lies along the diagonal, then the imagehas been correctly decoded in a plurality of configura-tions. To quantify the performance, we estimated thefraction of correct predictions as the mean of the diagonalof the confusion matrix. The fraction of correct predictionslies on the interval [0, 1]. If �� is equal to �̃ for all �̃ testedin all trials, the fraction of correct predictions will be 1.
Four coding strategies are evaluated in this paper: (1)the spike count code, where r is the average number ofspikes within the presentation time of the stimulus, wheneach neuron is considered as independent; (2) the latencycode, where r is the latency of the first spike after thestimulus onset, in which case the response probabilitywas estimated using a kernel density estimation (Gauss-ian function, ��0,01 s); (3) the ROC based on the WFS,where r is the rank of the latency time stimulus onset foreach neuron (named ROC with latencies), which can bedirectly obtained from estimating the relative orderingbetween all pairs of RGCs. In that case, for an RGC pair (i,j), the response distribution is defined by:
P(r(i,j)�) � C �T
H(LiT � Lj
T) , (12)
where the sum is over trials T of the training set, LiT is the
latency of neuron i, C is a normalization factor and:
H(s) � �0 if s 0,1 otherwise.
(13)
(4) One could argue that the differences observed be-tween the classical independent codes and the WFS mayonly stem from the correlations taken into account in theROC scheme. Therefore we also included a coding strat-egy where the spike counts are used to rank the cellsinstead of the latencies (named ROC with spike counts),using the same methods as in (3). This can be related to ajoint correlated spike count code.
Using this approach, the fraction of correct predictionsis shown in Figure 5 for the different coding schemes andas a function of the frequency of the gratings. To investi-gate the effect of the size of the RGC population on the
discrimination performance and the variation of the dis-crimination performance across time, only neural re-sponses related to the 18mcpd gratings were considered.To compute the variation of the performance with thenumber of RGCs (Fig. 6), the fraction of correct predic-tions was estimated and averaged over 100 randomlychosen RGC subsets (cross-validation) ranging from 2 to600 RGCs amongst the whole available RGC population.To compute the variation of the performance across time(Fig. 7), the fraction of correct predictions was estimatedusing an observation window that ranged from 0.05 to 0.5s after the stimulus onset.
ResultsWe present the results from two datasets obtained with
the 4096 APS CMOS MEA (D1 with 764 RGCs and D2with 649 RGCs). Initially, we performed similar experi-ments using conventional 60-channel MEAs and reachedthe same conclusions as for D1 and D2 by pooling thedata from several retinas (D3: 9 retinas, 258 RGCs). How-ever, datasets from individual retinas recorded with the60-channel MEA did not produce significant results. Therecording capabilities of the 4096 APS CMOS MEA allowus to simultaneously record from hundreds of RGCs in thesame retina, yielding results with much more robust sta-tistics. Assuming there are 4000 RGCs/mm2 (not includ-ing displaced amacrine cells; Rodriguez et al., 2014), or0.004 RGCs/�m2, we estimate that each electrode-pixelarea (measuring 42 �42 �m, or 1764 �m2) can potentiallyrecord from a maximum of 7 RGCs. We record onaverage from 1 to 2 units per electrode-pixel area, whichamounts to 14–29% of all theoretically available RGCs.This provides a huge step forward compared to what hasbeen achieved with earlier recording platforms, enablingus to acquire a much clearer picture of how concertedspiking patterns across a large RGC population encodeinformation about the stimulus. Despite small variabilitybetween preparations, the overall pattern of results ob-tained by the different techniques is the same, thus sug-gesting that the WFS is a powerful strategy for fastinformation transfer.
Retinal responses are noisy but carry synergisticinformation
Typical RGC responses from the dataset D1 to flashinggratings with different spatial phases are illustrated inFigure 1. Contrary to previous reports in salamander(Gollisch and Meister, 2008), we found no RGC exhibitinga clear latency tuning to the grating phase. However,there is a clear modulation of the RGC spike count withthe grating phase. However, despite that clear link be-tween the spike count and grating phase, substantiallevels of spontaneous activity appear to blur the temporalprecision of the responses to the preferred stimuli in mostcells (Fig. 1).To estimate the overall reproducibility of the RGC re-sponses, we plotted the SD versus the mean latency ofthe first spike for individual RGC responses over 105 trialsof the first phase of the 37 mcpd gratings considering all764 RGCs (Fig. 2A), or separating OFF cells (Fig. 2B),ON-OFF cells (Fig. 2C), and ON cells (Fig. 2D; see Mate-
New Research 6 of 18
May/June 2016 2016, 3(3) e0134-15.2016 eNeuro.sfn.org

Figure 1. Typical RGC responses of the dataset D1 to flashed gratings of spatial frequency 37 mcpd and different phases. Colored ellipsessuperimposed on grating images show the estimated receptive fields of the chosen RGCs. For each RGC chosen, 105 repetitions recorded withthe 4096 APS CMOS MEA are plotted from 0 s (stimulus onset) to 0.5 s. We found no RGC exhibiting a clear latency tuning to the grating phase.However, a clear modulation of the RGC spike count with the grating phase can be observed for some cells.
New Research 7 of 18
May/June 2016 2016, 3(3) e0134-15.2016 eNeuro.sfn.org

rials and Methods). Surprisingly, all cells showed largevariability in the latency of their first spike with a SDcomparable to the mean. Within each cell type, the meanlatency was variable but this variability was qualitativelysimilar in different cell types. These similarities in RGCresponses are striking even when comparing the proba-bility distributions of the SD (Fig. 2E). Thus, here thereproducibility of RGC responses to several presentationsof the same stimulus seems to be quantitatively low, andtherefore these latencies may not be an accurate indicatorof the stimulus content. Similar results were obtained forD2 (data not shown).
Even if the latency of individual cells is noisy, i.e. the SDis large, perhaps the difference between the latencies ofcell pairs (L1–L2) is more reliable, as shown by Gollischand Meister (2008). In other words, the SD of the latencydifferences may be significantly smaller. We computedand plotted the probability distributions of the SD oflatency differences for all cell pairs (black), OFF cell pairs(red), ON-OFF cell pairs (green), and ON cell pairs (red;Fig. 2F; dataset D1). Here again, the latency differences ofRGC subpopulations seem to share the same variationacross repeated presentations of the same stimulus.Thus, this rules out the possibility that there may besubsets of neurons in which the absolute relative latencyis highly repeatable. Moreover, by comparing Figure 2, Eand F, one could argue that the SD of the latency differ-ences may be on average even larger than, or at leastequal to, those of the individual latencies. This demon-strates that the latency differences of cell pairs are not an
accurate indicator of the stimulus content either. Similarresults were obtained for D2 (data not shown).
As modulation of the RGC spike count with the gratingphase is nevertheless conspicuous (Fig. 1), we performeda PID (see Materials and Methods) to quantify the amountof redundant, unique, and synergistic information avail-able in the spike counts (Fig. 3B,C; dataset D1and datasetD2, respectively). This analysis shows that a considerableportion of the available information carried by the spiketrains is synergistic; suggesting that the relative activities,i.e. the concerted spiking pattern of the entire RGC pop-ulation, carries information that is not available in thespiking of individual neurons. Shuffling the responses toeach stimulus of one neuron of each pair relative to theother had a negligible effect on the PID (data not shown),suggesting that the synergy does not arise due to noisecorrelations. This analysis also suggests that although thenoise level (spontaneous activity) may impair the reliabilityof the responses in individual RGCs, more reliable resultsare achieved when considering multiple RGC responsessimultaneously rather than when treating individual RGCresponses separately.
Accessing the synergistic information with therelative activitiesAlthough the PID results suggested there was synergy inRGC pair spiking responses, the limitations of the PID(see Materials and Methods) prevent us from using it toanswer how much synergy there is in larger populations orother response features, such as the timing of spikes. To
0 0.1 0.2 0.3 0.4 0.50
0.05
0.1
0.15
0.2
0.25764 cells
sd [s
]
Mean latency [s]
0 0.1 0.2 0.30
0.05
0.1
0.15
0.2
p
sd(Ln) [s]0 0.1 0.2 0.3
0
0.1
0.2
0.3
p
sd(L1−L2) [s]
0 0.1 0.2 0.3 0.4 0.50
0.05
0.1
0.15
0.2
0.25147 OFF cells
sd [s
]Mean latency [s]
0 0.1 0.2 0.3 0.4 0.50
0.05
0.1
0.15
0.2
0.25111 ONOFF cells
sd [s
]
Mean latency [s]0 0.1 0.2 0.3 0.4 0.5
0
0.05
0.1
0.15
0.2
0.25506 ON cells
sd [s
]
Mean latency [s]
A
E F
B C D
Figure 2. Latency variability. A–F, Considering stimulus 17 (� � 0°, 37mcpd). A, The SD is plotted as a function of the mean latencyover the 105 repetitions, for all 764 RGCs of the dataset D1, for (B) only the 147 OFF cells, for (C) only the 111 ON-OFF cells, or for(D) only the 506 ON cells (see Materials and Methods for the classification method). The black line corresponds to a SD that is equalto the mean latency. This shows the considerable variability of individual latencies. E, The probability distribution of the individuallatency SD for all cells (black), OFF cells (red), ON-OFF cells (green), and ON cells (blue). F, The probability distribution of the SD oflatency difference for all cell pairs (black), OFF cell pairs (red), ON-OFF cells pairs (green), and ON cell pairs (blue).
New Research 8 of 18
May/June 2016 2016, 3(3) e0134-15.2016 eNeuro.sfn.org

Redundancy Unique 1 Unique 2 Synergy Information0
0.2
0.4
0.6
0.8
1
1.2
1.4
Info
rmat
ion
( bits
)
75 mcpd37.5 mcpd18.4 mcpd9.4 mcpd
Redundancy Unique 1 Unique 2 Synergy Information0
0.1
0.2
0.3
0.4
0.5
0.6
0.7
0.8
0.975 mcpd37.5 mcpd18.4 mcpd9.4 mcpd
B
C
A
Info
rmat
ion
( bits
)
Figure 3. A, Partial information diagram for two variables, based on Williams and Beer (2010), their Figure 1. The two inner circlesrepresent the mutual information between two variables, R1 and R2, considered separately, and a third variable S. Where they overlapis the redundant information; where they do not is the unique information provided by each. The outer ellipse represents the mutualinformation between the pair (R1,R2) and S. The area not covered by the inner circles is the synergistic information. Decomposition
New Research 9 of 18
May/June 2016 2016, 3(3) e0134-15.2016 eNeuro.sfn.org
address these questions indirectly, we investigatedwhether the WFS, which takes the relative activities of theentire RGC population into consideration, could be aplausible alternative indicator of the stimulus content. Sohere, the synergistic information conveyed by the WFSrefers to the mean response properties of the neurons, i.e.to signal correlations in the response rather than to noisecorrelation.
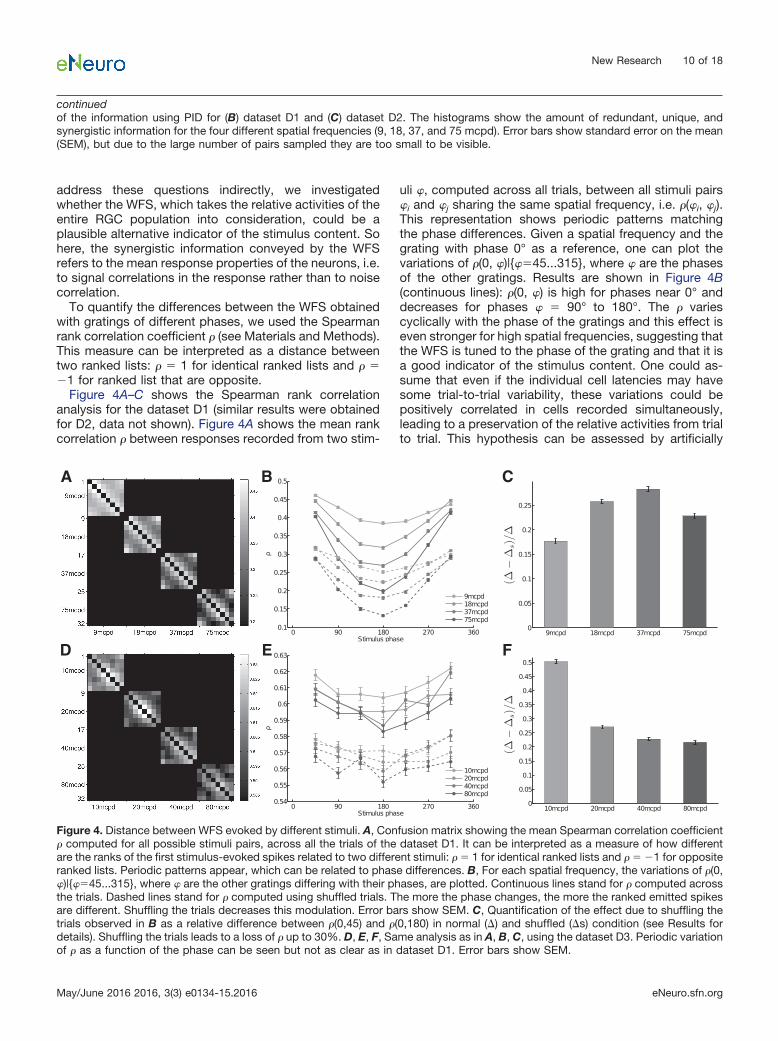
To quantify the differences between the WFS obtainedwith gratings of different phases, we used the Spearmanrank correlation coefficient � (see Materials and Methods).This measure can be interpreted as a distance betweentwo ranked lists: � � 1 for identical ranked lists and � ��1 for ranked list that are opposite.
Figure 4A–C shows the Spearman rank correlationanalysis for the dataset D1 (similar results were obtainedfor D2, data not shown). Figure 4A shows the mean rankcorrelation � between responses recorded from two stim-
uli �, computed across all trials, between all stimuli pairs�i and �j sharing the same spatial frequency, i.e. �(�i, �j).This representation shows periodic patterns matchingthe phase differences. Given a spatial frequency and thegrating with phase 0° as a reference, one can plot thevariations of �(0, �)|{��45...315}, where � are the phasesof the other gratings. Results are shown in Figure 4B(continuous lines): �(0, �) is high for phases near 0° anddecreases for phases � � 90° to 180°. The � variescyclically with the phase of the gratings and this effect iseven stronger for high spatial frequencies, suggesting thatthe WFS is tuned to the phase of the grating and that it isa good indicator of the stimulus content. One could as-sume that even if the individual cell latencies may havesome trial-to-trial variability, these variations could bepositively correlated in cells recorded simultaneously,leading to a preservation of the relative activities from trialto trial. This hypothesis can be assessed by artificially
continuedof the information using PID for (B) dataset D1 and (C) dataset D2. The histograms show the amount of redundant, unique, andsynergistic information for the four different spatial frequencies (9, 18, 37, and 75 mcpd). Error bars show standard error on the mean(SEM), but due to the large number of pairs sampled they are too small to be visible.
0 90 180 270 3600.1
0.15
0.2
0.25
0.3
0.35
0.4
0.45
0.5
Stimulus phase
ρ
9mcpd18mcpd37mcpd75mcpd
0 90 180 270 3600.54
0.55
0.56
0.57
0.58
0.59
0.6
0.61
0.62
0.63
Stimulus phase
ρ
10mcpd20mcpd40mcpd80mcpd
9mcpd 18mcpd 37mcpd 75mcpd0
0.05
0.1
0.15
0.2
0.25(∆
(ρ45
,ρ18
0)−∆ (
ρ 45,ρ
180) sh
uffle
d) /∆(
ρ 45, ρ
180)
10mcpd 20mcpd 40mcpd 80mcpd0
0.05
0.1
0.15
0.2
0.25
0.3
0.35
0.4
0.45
0.5
(∆(ρ
45,ρ
180)−
∆(ρ 45
,ρ18
0) shuf
fled) /
∆(ρ 45
, ρ18
0)
BA C
FED
Figure 4. Distance between WFS evoked by different stimuli. A, Confusion matrix showing the mean Spearman correlation coefficient� computed for all possible stimuli pairs, across all the trials of the dataset D1. It can be interpreted as a measure of how differentare the ranks of the first stimulus-evoked spikes related to two different stimuli: � � 1 for identical ranked lists and � � �1 for oppositeranked lists. Periodic patterns appear, which can be related to phase differences. B, For each spatial frequency, the variations of �(0,�)|{��45...315}, where � are the other gratings differing with their phases, are plotted. Continuous lines stand for � computed acrossthe trials. Dashed lines stand for � computed using shuffled trials. The more the phase changes, the more the ranked emitted spikesare different. Shuffling the trials decreases this modulation. Error bars show SEM. C, Quantification of the effect due to shuffling thetrials observed in B as a relative difference between �(0,45) and �(0,180) in normal (�) and shuffled (�s) condition (see Results fordetails). Shuffling the trials leads to a loss of � up to 30%. D, E, F, Same analysis as in A, B, C, using the dataset D3. Periodic variationof � as a function of the phase can be seen but not as clear as in dataset D1. Error bars show SEM.
New Research 10 of 18
May/June 2016 2016, 3(3) e0134-15.2016 eNeuro.sfn.org

destroying the noise correlation by pairing RGC re-sponses belonging to different trials. By pairing RGCresponses shifted by one trial, Gollisch and Meister (2008)observed a loss of up to 20% of the mutual information.Here, we paired RGC responses by randomly shuffling thetrials, resulting in an overall loss of correlation. Results areshown in dashed lines in Figure 4B. WFSs are less distinctfrom each other, but the shuffling of trials does not com-pletely impair the information contained in the WFS, asthe tuning to the phase is still visible. To quantify the lossrelated to the shuffling of trials for each frequency, wecompared the average difference across trials between�(0,45) and �(0,180) denoted by � and the same quantitywhen trials are shuffled, denoted by �s. Figure 4C shows(���s)/� as a function of the grating frequency. Shufflingthe trials leads to a loss of � up to 30%.
Figure 4D–F shows the Spearman rank correlation anal-ysis for the dataset D3. Both datasets D1 and D3 showsimilar periodic variation of the distance as a function ofthe phase. However, this effect is less clear for datasetD3. In this particular data set, the spikes are ranked withineach recorded retina (responses of RGCs belonging todifferent retinas are not paired). Thus, even if in total thereare 258 RGCs, in practice only a few of them encode thestimulus content simultaneously. For dataset D1, the useof 4096 APS CMOS MEA provides a huge improvement indeciphering the concerted spiking pattern of a large RGCpopulation because here 764 cells are simultaneouslytaken into consideration.
Relative activities provide efficient coding capabilityTo quantify the coding capability of the relative activities,we considered a discrimination task consisting of identi-fying which of the eight gratings is represented in the RGCpopulation response for a given spatial frequency (seeMaterials and Methods). Figure 5 shows a comparison ofthe fraction of correct identifications for the independentspike count code (black), the independent latency code(gray), the ROC with latencies (red), and the ROC withspike counts (blue). All 764 RGCs of dataset D1 (Fig. 5A)and 649 RGCs of dataset D2 (Fig. 5B) were used in thisanalysis. Results show that all the decoders perform wellin this task (close to 1, maximal value), even if the latencydecoder seems to slightly lose performance at the highestspatial frequency. Note that although the individual RGCresponses were not precise in time (large SD values; Fig.2A), the sum of the information contained in the spiking ofindividual RGCs was sufficient to perform well in thistask. This may be due to the large number of RGCsconsidered with different response patterns and the lowspatial complexity of the stimuli used in this task. TheROC with spike counts (correlated spike count) and theROC with latencies (WFS) still appear to outperform theclassical decoders, demonstrating that the relative ac-tivities efficiently encode for spatial information aboutthe stimulus.
Relative activities enable efficient transmission ofvisual information with only few neuronsOne may wonder whether the large number of RGCs mayobscure more subtle differences in the coding efficiency
of the spike count code, the latency code, the ROC withlatencies, and the ROC with spike counts. To address thisquestion, we investigated how the decoders’ perfor-mances vary with the size of the RGC population. Weperformed the discrimination task with increasing num-bers of RGCs and considering only gratings of 18 mcpdspatial frequency. At this spatial frequency and when allthe RGCs are taken into consideration, all four decod-ers performed equally well, with a score �0.9 (Fig. 6).Figure 6 shows the evolution of the fraction of correctidentifications as a function of the number of RGCs,from 2 to 600 RGCs, for the dataset D1 (Fig. 6A) and thedataset D2 (Fig. 6B). As expected, all four decodersperform better when the number of RGCs increases.However, in Figure 6A, the ROC with spike counts andthe ROC with latencies both rapidly outperform theclassical spike count and latency decoders. To illus-trate the benefit of taking correlations in the responseinto account, let us focus on the ROC with latencies inFigure 6A. It reaches a score of 0.8 with only 30 neu-rons. The independent latency decoder needs 300 neu-rons to reach the same 0.8 score. Thus, to reach 80%accuracy level like a correlated latency code (WFS)does with 30 cells, one would need 300 independentcells, i.e. 10 times more independent cells. Even if theoverall performances are better than for dataset D1,similar results were obtained for dataset D2 (Fig. 6B).
Relative activities enable fast transmission of visualinformationFinally, we investigated how fast each of the four codingstrategies can transmit information by computing the frac-tion of correct identifications as the length of the obser-vation window varied from 0.05 to 0.5 s after the stimulusonset. Responses to the 18 mcpd spatial frequency grat-ings were used in this analysis and the results are shownin Figure 7A for dataset D1, and in B for dataset D2.Overall, the performance of all four decoders increaseswith the length of the observation window. In Figure 7A,the independent spike count and the independent la-tency decoders respectively need 0.2 and 0.4 s afterthe stimulus onset to reach their maximal perfor-mances. Once again, the ROC with spike counts andthe ROC with latencies decoders rapidly outperform thetwo independent decoders and they reach their maxi-mal performance within 0.15 s after the stimulus onset.So here, even though both ROCs and independentdecoders are based on the same basic measure (latenciesor spike counts), taking into account the correlationwithin the population significantly improves perfor-mance, enabling rapid transmission of the relevant in-formation. Although the overall performances are betterthan for dataset D1, similar results were observed fordataset D2 (Fig. 7B).
DiscussionSeveral coding strategies have been investigated by dif-ferent groups using mostly artificial stimuli. Two mainstreams of thought have emerged: one considering RGCsas independent encoders, and another one consideringthem as synergistic encoders, i.e. when the relative activ-
New Research 11 of 18
May/June 2016 2016, 3(3) e0134-15.2016 eNeuro.sfn.org

ities in a RGC population contains information that is notavailable in the spiking of individual RGCs. Nirenberget al. (2001) argued that RGCs encode information inde-pendently as they measured very little increase in mutualinformation between stimulus and response when tak-ing into account correlations between RGCs versus
considering them independently. However, as the samegroup notes in a later paper (Latham and Nirenberg2005), synergistic information can exist in a systemwithout pairwise correlations being important for de-coding. Moreover, there is a growing body of evidencethat when RGCs are considered as synergistic encod-
9 18 37 750
0.25
0.5
0.75
1
Spatial frequency [mcpd]
Frac
tion
corr
ect
9 18 37 750
0.25
0.5
0.75
1
Spatial frequency [mcpd]
Frac
tion
corr
ect
A
B
Spike countLatencyRank Order Code w latenciesRank Order Code w spike counts
Spike countLatencyRank Order Code w latenciesRank Order Code w spike counts
Figure 5. Discrimination performance of the spike count, the latency, and the ROC decoders. The fraction of correct identificationsis plotted as a function of the spatial frequency for the spike count code (black), the latency code (gray), the ROC with latencies (red),and the ROC with spike counts (blue). A, All 764 RGCs of the dataset D1 and (B) all the 649 RGCs of the dataset D2 were used inthis analysis. Results show that all the decoders perform well in this task (close to 1, maximal value). The horizontal line indicateschance level. Shaded areas show SEM.
New Research 12 of 18
May/June 2016 2016, 3(3) e0134-15.2016 eNeuro.sfn.org

ers, they carry complementary and more precise infor-mation about the stimulus.
Overall, our findings suggest that synergistic encodingof information in the relative activities of a neuronal pop-ulation is a feature of RGC responses at the population
level. Here, we used the PID (Williams and Beer, 2010) todirectly quantify the amount of synergy in the RGC pop-ulation response and found it to be a considerable fractionof the total information carried by pairs of neurons. Shuf-fling the data did not reduce the synergy, so noise corre-
0
0.25
0.5
0.75
1
Frac
tion
corr
ect
Number of neurons
0
0.25
0.5
0.75
1
Frac
tion
corr
ect
Number of neurons
A
B
Spike countLatencyRank Order Code w latenciesRank Order Code w spike counts
Spike countLatencyRank Order Code w latenciesRank Order Code w spike counts
2 006003002001050301
2 006003002001050301
Figure 6. Discrimination performance as a function of the number of RGCs. The fraction of correct identifications is plotted forthe spike count code (black), the latency code (gray), and the ROC with latencies (red), and the ROC with spike counts (blue),as a function of the number of neurons. A, Responses of the dataset D1 related to stimuli 9 –16 (18 mcpd) are used in thisanalysis. From a population size of 30 RGCs and higher, the ROC with latencies tends to perform better than the latencydecoder. B, Analysis on the responses of the dataset D2 related to the same stimuli as in A. The horizontal line indicates chancelevel. Shaded areas show SEM.
New Research 13 of 18
May/June 2016 2016, 3(3) e0134-15.2016 eNeuro.sfn.org

lations are unlikely to be the source. Therefore, how thissynergy arises is unclear and remains an interesting topicfor future work. It should be noted that, in the absence ofnoise correlations, the synergy defined in Equation 8 re-duces to Red(S;R1,R2) – I(R1;R2), and thus is maximized as
signal correlations go to zero (assuming fixed redun-dancy). This suggests a combinatorial code in which dif-ferent cells encode orthogonal stimulus features. Possibleexamples include distinct cell types providing comple-mentary information about the stimulus or cells with spa-
0.05 0.1 0.15 0.2 0.25 0.3 0.35 0.4 0.45 0.50
0.25
0.5
0.75
1
Time window [s]
Frac
tion
corr
ect
0.05 0.1 0.15 0.2 0.25 0.3 0.35 0.4 0.45 0.50
0.25
0.5
0.75
1
Time window [s]
Frac
tion
corr
ect
A
Spike countLatencyRank Order Code w latenciesRank Order Code w spike counts
Spike countLatencyRank Order Code w latenciesRank Order Code w spike counts
B
Figure 7. Discrimination performance as a function of the time window after the stimulus onset. The fraction of correct identificationsis plotted for the spike count code (black), the latency code (gray), the ROC with latencies (red), and the ROC with spike counts (blue)as a function of the length of the observation window. This time window varied from 0.05 to 0.5 s after the stimulus onset. Responsesof (A) the dataset D1 and (B) the dataset D2, related to stimuli 9–16 (18 mcpd) are used in this analysis. ROC with latencies decoderrapidly outperforms the latency decoder and reaches its maximal performance within 0.15 s after the stimulus onset. B, The curve ofthe ROC with spike counts is hidden by the ROC with latencies. The horizontal line indicates chance level. Shaded areas show SEM.
New Research 14 of 18
May/June 2016 2016, 3(3) e0134-15.2016 eNeuro.sfn.org
tially separate receptive fields providing information aboutthe spatial structure of the stimulus that is unavailablewhen considering individual neurons. As a simple exam-ple of the former, consider an ON cell that fires a singlespike if and only if it sees a light increment in some part ofits receptive field and an OFF cell that responds similarlyto light decrements. Both cells have overlapping receptivefields. Imagine that both cells are illuminated by a uniformgrey field that is replaced, with equal probability, by eithera black field, a white field, or a black and white field splitdown the center of the two receptive fields (this exampleis similar to that used by Williams and Beer (2010), toillustrate the asymmetry of the PID). Either cell alone candistinguish one stimulus from the other two, but not theremaining two from each other (e.g. the ON cell fires toboth the white and split fields but not the black field).Distinguishing all three stimuli requires both cell typesand, according to PID, 21% of the information about thestimulus available in pair responses is synergistic, but theinformation lost by ignoring correlations in this system isexactly zero. Obviously, this example is not representativeof real retinal coding, but rather serves to illustrate howsynergy can arise through different cell types withoutinformative pairwise correlations. The amount of synergymay also depend on the stimulus itself, with differentstimulus classes lending themselves more or less well tosynergistic encoding. Direction selectivity is an exampleof this. Imagine two direction-selective cells with perpen-dicular preferred directions that fire strongly to motionalong their preferred direction, weakly or not at all tomotion against this direction and moderately to motionperpendicular to it. Suppose we wish to distinguish barsmoving in four perpendicular directions aligned with thetwo cell’s preferred directions. Both cells provide redun-dant information about which axis the bar is movingalong. Additionally, each cell provides unique informationabout whether the bar is moving towards or against itspreferred direction. This is all the information there is to beabout the bar’s motion direction: unlike in the split fieldsexample, there is no synergistic information, illustratinghow different stimuli can affect the amount of synergypresent. However, we cannot address the question ofhow the stimulus affects the amount of synergy with thetype of stimulus (square-wave gratings) used here.
Having demonstrated the existence of synergistic infor-mation in the population response, several strategies canbe used to decode the relative activities. Assuming thatthe firing order is stimulus-specific, the simplest algorithmis the winner-take-all decoder (Barnden and Srinivas,1993). In this decoder, for an incoming firing patternacross the entire RGC population, the decision of theclassifier is determined by the RGC with the shortestlatency. However, this decoder can be unreliable, espe-cially if the timing of incoming spikes is variable, forinstance when there is strong spontaneous activity (asobserved in our recordings), or if spikes generated bydifferent RGCs occur in very short succession, or evenbecome completely synchronous. Another possibility is toconsider the spatiotemporal patterns of all spikes within agiven time window and to use the tempotron algorithm
(Gütig and Sompolinsky, 2006). The tempotron consistsof a single integrate-and-fire model neuron (IF) that re-ceives inputs from the population of RGCs. Depending onthe relative timing of the incoming spikes and on theirsynaptic weights (that are a priori determined; supervisedalgorithm), the summation of all the inputs will determinewhether the IF neuron will fire or not. Thus, this model canclassify the input spikes patterns into those that elicit aspike in the IF neuron, as well as those that do not triggerthe IF neuron. The tempotron was used to analyze sala-mander retinal responses and was able to decode com-plex visual features (Gütig et al., 2013). The authorsapplied this decoding strategy to fast-OFF RGCs, using atotal of only 41 pooled RGCs recorded from nine differentretinas. However, how this coding scheme would behavewith other RGC subtypes or with a mixture of RGC sub-types, and how performance will be affected by using alarger RGC population were left as open questions.
In the present study, we investigated in the mouseretina whether the relative latencies between neuron pairscould be a good indicator of the stimulus content, asshown by Gollisch and Meister (2008) for the salamanderretina, but the outcome was negative. RGCs in the sala-mander retina exhibit lower levels of spontaneous activity(Gollisch and Meister, 2008) than in mouse (Fig. 1). There-fore salamander RGCs demonstrate high reproducibilityin their latencies (especially for so-called fast OFF RGCs)to the onset of the same stimulus (with only a few milli-seconds of latency SD), which may explain why the au-thors were able to detect fine-tuning of the absoluterelative latencies between pairs of neurons. Unfortunately,the low reproducibility observed here in mouse RGC re-sponses (Fig. 4) might have hidden fine-tuning of absoluterelative latencies. One could also argue that those animals(salamander vs mouse) are different from an ecologicaland behavioral point of view and that their visual systemsmay have been tuned to fit their own ecological con-strains.
Going further, we investigated whether the populationresponse as a whole could be a better indicator of thestimulus. We have applied a simpler decoding strategybased on the ROC decoder (Thorpe et al., 2001), whichcan take latencies (ROC with latencies, WFS read-out) orspike counts (ROC with spike counts) as inputs, to a large,mixed RGC population (D1: 764 RGCs; D2: 649 RGCs),regardless of their specific functional subtypes. Here, theWFS is represented by the rank of the first stimulus-evoked spikes for each RGC. To assess the performanceof the ROC decoder for the stimuli used in this work, wedesigned a discrimination task where the goal was toidentify the phase of the gratings. We found that the ROCwith latencies and spike counts decoders are able toperform the task better than the spike count- or thelatency-based decoder (Fig. 5). Going a step further, wewondered how the size of the RGC population couldimpact the performance of each decoder in the discrimi-nation task. This question is important since in a morenaturalistic scenario, one could argue that local analysesof spatial structure based on fewer specialized cells willbe required. To answer this question we performed the
New Research 15 of 18
May/June 2016 2016, 3(3) e0134-15.2016 eNeuro.sfn.org

discrimination task using increasing numbers of RGCs(Fig. 6). Even if all decoders increase their performancewith the number of RGCs, the ROC with latencies andspike counts tend to perform better than the classicalindependent decoders for populations of 50 RGCs ormore. The difference in the effect of number of neurons onthe WFS and individual latency codes in particular isconsistent with the findings of Schwartz et al. (2012), whoreported that, for large numbers of neurons, a latencycode assuming independent neurons suffers greatly inperformance compared to one that exploits the full cor-relation structure of the latencies.
Regardless of the RGC subtype and the level of sponta-neous activity, one of the main conclusions is that the WFSrobustly encodes sufficient information about spatial cues tosucceed in this discrimination task. Because there is evi-dence that different RGC subtypes encode different featuresof the stimuli (van Wyk et al., 2006; Zhang et al., 2012), aninteresting perspective would be to further investigate thespecific role of each subpopulation of RGCs within the WFS.More generally, assuming that the functional and morpho-logical characterization of RGCs is available, one could con-sider an ensemble of discrimination tasks and determinewhich subpopulations are relevant for each task.
ROCs convey visual information faster than classicalcoding strategies. This is what we observed by comparingthe discrimination performances of the different decodersas a function of the duration of the time window after thestimulus onset (Fig. 7). Already at the retinal output level,we show that a simple decoder that exploits the relativeactivities allows the visual information to be extractedmuch faster than the classical decoders. These results arein line with previous studies which have suggested thatthe ROC scheme, initially based on the latencies, could bean efficient and fast strategy for processing visual infor-mation (Thorpe et al., 2001; Guyonneau et al., 2005;VanRullen et al., 2005; Masquelier and Thorpe, 2007). Therelevance of the WFS for a whole RGC population read-out by a ROC has been investigated at the retinal levelusing a simulated RGC population (VanRullen andThorpe, 2001). However, since we used multiple trials forthe decoding as in Jacobs et al. (2009), one could arguethat the direct link to the original concept in rapid single-trial classification tasks (Thorpe et al., 1996) is lost. Nev-ertheless, we reran the analysis using all-but-one cross-validation (hence each trial is decoded individually) andfound the WFS (ROC with latencies) to be at least as goodas (in one retina) or better than (in the other) the indepen-dent spike count code and in all cases better than theindependent latency decoder. Figure 7 demonstrates thatthe rank format makes things easier for the classifier(discarding noise, but not signal). This is consistent withthe idea that some of the trial-to-trial variability in thelatencies is shared across cells. This kind of variability isdetrimental to the independent code, but not to the ROCscheme.
Although our results demonstrate the power and effi-ciency of the ROC scheme, they give no hint as to how itmight be implemented biologically. One has to ponderthat a code based on the absolute relative latencies in the
entire population should subsume the WFS code and,hence, could perform better. But to our knowledge, onlymechanisms which are sensitive to a tight spike timingcorrelation, such as spike-timing-dependent plasticity,have been reported in the literature and could plausibly beable to read out the earliest firing inputs, i.e. here the WFS(Guyonneau et al., 2005; Masquelier et al., 2008). Decod-ing latency ranks could be done by biologically plausiblemechanisms, such as shunting inhibition (Thorpe et al.,2001). To our knowledge, no one has ever proposed amechanism to decode spike count ranks.
Nevertheless, one has to note that the ROC with spikecounts tends to perform slightly better than the ROC withlatencies (Figs. 5–7). For this particular task, it is highlypossible that the information provided by the ROC withspike counts is superior to what the other codes investi-gated here are able to provide (but it may not be the casefor more complex stimuli). Already in Figure 1, the mod-ulation of the spike count across the stimuli is visible byeye in the raster plots, which is not the case for thelatencies. Therefore, the information carried by the spikecount would be less noisy than the information carried bylatencies. Thus, even if taking into account correlationsbetween neuron latencies (ROC with latencies) extractsmore of the total information available in the latencies, theROC with spike count wins over, because it there is moreinformation in the firing rates to begin with. The mostimportant point here is that those results are in line withprevious studies where the functional significance of theconcerted firing pattern has been investigated, for in-stance using a model of multineuron spike responses(Pillow et al., 2008). The authors showed that a read-outmodel that exploits the response correlation structureextracts 20% more information about the stimulus than aread-out model based on the independence assumption,and also preserves 40% more visual information thanoptimal linear decoding. Otherwise stated, if there arecorrelations in the firing patterns of a RGC population, it isbeneficial to incorporate this structure in the read-outmodel.
We must remember that the stimuli used in our studyare simple. All the four codes performed the discrimina-tion task equally well. It may be that the discriminationtask, as executed, is not sufficiently demanding to com-pare the potential performance of these codes thor-oughly. The fine encoding provided by combinatorialcodes might not be necessary or might not provide a lotmore useful information about the stimuli than classicalindependent codes already do. Nevertheless, those com-binatorial codes seem to do a better job at extractinginformation about the stimuli with small neural popula-tions and short time windows (Figs. 6, 7). In future studies,it would be interesting to test those codes in a much moredemanding discrimination task involving more complexstimuli.
How those codes would perform with a discriminationtask involving stimuli with richer spatial content is animportant open question and the answer may not betrivial. From Schwartz et al. (2012), when flashing blackand white shapes onto salamander retinas, the authors
New Research 16 of 18
May/June 2016 2016, 3(3) e0134-15.2016 eNeuro.sfn.org

reported that simple linear decoders, i.e. decoders basedon independent spike train coding strategies, can onlydecode coarse stimulus properties such as the overallsize or contrast. Thus, to perform high-fidelity discrimina-tion, one needs nonlinear decoders that take correlationsbetween RGC responses into account. So one couldassume that in a discrimination task involving richer stim-uli, independent coding schemes would perform less wellthan coding schemes that take into account correlationsin the population responses. In other words, the ROC-based scheme, which considers the relative activities,would perform better than classical independent schemesin complex discrimination tasks.
Nevertheless, one could wonder whether the perfor-mance of the WFS represents a true timing code or ismerely an artefact of rate coding. For example, one wouldintuitively expect a cell with a high stimulus-driven firingrate to fire its first spike following the stimulus sooner, onaverage, than a cell with a much lower stimulus-drivenfiring rate. We reran the discrimination analysis with jit-tered spike times (� � 20 ms, data not shown), whichshould destroy timing information while preserving rateinformation, and saw no clear differences in WFS perfor-mance. Combined with the large amount of informationavailable in correlated spike counts (i.e. the ROC withspike counts) here, this is consistent with (but does notprove) a latency code that arises as an epiphenomenon ofrate coding. However, the debate between whether or notlatency coding is an artefact of rate coding is an openquestion and a complete discussion of this is beyond thescope of this paper.
We are not arguing that there is only one reliable neuralcode. Indeed, there might be several concurrent, parallelstreams of information sent from the retina to the brain,each encoding different stimulus features (Masland,2012). Here we show that, in parallel with the classicalindividual spike count and individual latency codes, thecodes based on relative activities, e.g. the WFS, alsocoexist and may encode reliable information about thevisual scene. To our knowledge, our study represents thefirst experimental evidence that the relative activities andin particular the WFS, i.e. the first stimulus-evoked spikesacross the whole RGC population, obtained by large-scale RGC population recordings are relevant, and ourresults suggest that the ROC scheme can be a powerfulmechanism to encode and transmit visual informationthrough visual pathways.
Because understanding how neurons fire with respectto one another is of fundamental importance for decipher-ing neural codes in sensory systems, our results on theWFS may have implications beyond retinal coding. In theolfactory system, the WFS and spike-timing in neuronalensembles play an important role in information encoding(Shusterman et al., 2011; Smear et al., 2011). In thesomatosensory system, it has been shown that the rela-tive timing of the first spikes after stimulus onset containsrich information about the stimulus, such as the direction,the force, and the shape of the surface contacting thefingertip (Johansson and Birznieks, 2004). Similar obser-vations have also been reported in the auditory system
(de Charms and Merzenich, 1996; Chase and Young,2007; Brasselet et al., 2012). All these observations rein-force the universality and power of the WFS, which rep-resents a common denominator in various sensorymodalities, conveying sufficient information for the en-coding and fast transmission of relevant sensory informa-tion to the brain, allowing it to process and produce fastsensory-input driven appropriate responses.
ReferencesBarnden J, Srinivas K (1993) Temporal winner-take-all networks: a
time-based mechanism for fast selection in neural networks. IEEETrans Neural Netw 4:844–853. CrossRef Medline[TQ1][TQ2]
Berdondini L, Imfeld K, Maccione A, Tedesco M, Neukom S,Koudelka-Hep M, Martinoia S (2009) Active pixel sensor array forhigh spatio-temporal resolution electrophysiological recordingsfrom single cell to large scale neuronal networks. Lab Chip9:2644–2651. CrossRef Medline
Brainard D (1997) The Psychophysics Toolbox. Spat Vis 10:433–436.Medline
Brasselet R, Panzeri S, Logothetis NK, Kayser C (2012) Neurons withstereotyped and rapid responses provide a reference frame forrelative temporal coding in primate auditory cortex. J Neurosci32:2998–3008. CrossRef Medline
Carcieri SM, Jacobs AL, Nirenberg S (2003) Classification of retinalganglion cells: a statistical approach. J Neurophysiol 90:1704–1713. CrossRef Medline
de Charms RC, Merzenich MM (1996) Primary cortical representationof sounds by the coordination of action-potential timing. Nature381:13.
Chase SM, Young ED (2007) First-spike latency information in singleneurons increases when referenced to population onset. Proc NatAcad Sci U S A 104:5175–5180. CrossRef
Chichilnisky EJ (2001) A simple white noise analysis of neuronal lightresponses. Network 12:199–213. Medline
Crouzet SM, Kirchner H, Thorpe SJ (2010) Fast saccades towardfaces: face detection in just 100 ms. J Vis 10(4):16 1-17. CrossRef
Gautrais J, Thorpe SJ (1998) Rate coding versus temporal ordercoding: a theoretical approach. Biosystems 48:57–65. Medline
Gollisch T, Meister M (2008) Rapid neural coding in the retina withrelative spike latencies. Science 319:1108–1111. CrossRef Med-line
Greschner M, Thiel A, Kretzberg J, Ammermüller J (2006) Complexspike-event pattern of transient on-off retinal ganglion cells. JNeurophysiol 96:2845–2856. CrossRef Medline
Gütig R, Sompolinsky H (2006) The tempotron: a neuron that learnsspike timing-based decisions. Nat Neurosci 9:420–428. CrossRefMedline
Gütig R, Gollisch T, Sompolinsky H, Meister M (2013) Computingcomplex visual features with retinal spike times. PLoS One8:e53063 CrossRef Medline
Guyonneau R, VanRullen R, Thorpe SJ (2005) Neurons tune to theearliest spikes through stdp. Neural Comput 17:859–879. Cross-Ref Medline
Jacobs AL, Fridman G, Douglas RM, Alam NM, Latham PE, PruskyGT, Nirenberg S (2009) Ruling out and ruling in neural codes. ProcNatl Acad Sci U S A 106:5936–5941. CrossRef Medline
Johansson RS, Birznieks I (2004) First spikes in ensembles of humantactile afferents code complex spatial fingertip events. Nat Neuro-sci 7:170–177. CrossRef Medline
Kirchner H, Thorpe SJ (2006) Ultra-rapid object detection with sac-cadic eye movements: visual processing speed revisited. Vis Res46:1762–1776. CrossRef Medline
Kleiner M, Brainard D, Pelli D (2007) What’s new in Psychtoolbox-3?Perception 36 ECVP Abstract Supplement.
Latham PE, Nirenberg S (2005) Synergy, redundancy, and indepen-dence in population codes, revisited. J Neurosci 25:5195–5206.CrossRef Medline
New Research 17 of 18
May/June 2016 2016, 3(3) e0134-15.2016 eNeuro.sfn.org

Maccione A, Hennig MH, Gandolfo M, Muthmann O, CoppenhagenJ, Eglen SJ, Berdondini L, Sernagor E (2014) Following the ontog-eny of retinal waves: pan-retinal recordings of population dynam-ics in the neonatal mouse. J Physiol 592:1545–1563. CrossRefMedline
Masland RH (2012) The neuronal organization of the retina. Neuron76:266–280. CrossRef
Masquelier T, Thorpe SJ (2007) Unsupervised learning of visualfeatures through spike timing dependent plasticity. PLoS ComputBiol 3:e31 CrossRef Medline
Masquelier T, Guyonneau R, Thorpe SJ (2008) Spike timing depen-dent plasticity finds the start of repeating patterns in continuousspike trains. PLoS One 3:e1377 CrossRef Medline
Muthmann JO, Amin H, Sernagor E, Maccione A, Panas D, Berdon-dini L, Bhalla US, Hennig MH (2015) Spike detection for largeneural populations using high density multielectrode arrays. FrontNeuroinform 9:28 CrossRef Medline
Nirenberg S, Carcieri S, Jacobs A, Latham PE (2001) Retinal ganglioncells act largely as independent encoders. Nature 411:698–701.CrossRef Medline
Pelli D (1997) The VideoToolbox software for visual psychophysics:transforming numbers into movies. Spat Vis 10:437–442. Medline
Pillow JW, Shlens J, Paninski L, Sher A, Litke AM, Chichilnisky E, SimoncelliEP (2008) Spatio-temporal correlations and visual signalling in a com-plete neuronal population. Nature 454:995–999. CrossRef
Remtulla S, Hallett P (1985) A schematic eye for the mouse, andcomparisons with the rat. Vis Res 25:21–31. Medline
Rieke F, Warland D, de Ruyter van Steveninck R, Bialek W (1997)Spikes: exploring the neural code. Boston: MIT.
Rodriguez AR, de Sevilla Müller LP, Brecha NC (2014) The RNAbinding protein RBPMS is a selective marker of ganglion cells inthe mammalian retina. J Comp Neur 522:1411–1443. CrossRefMedline
Schneidman E, Puchalla JL, Segev R, Harris RA, Bialek W, Berry MJ(2011) Synergy from silence in a combinatorial neural code. JNeurosci 31:15732–15741. CrossRef Medline
Schwartz G, Macke J, Amodei D, Tang H, Berry IIM (2012) Low errordiscrimination using a correlated population code. J Neurophysiol108:1069–1088. CrossRef
Shusterman R, Smear MC, Koulakov AA, Rinberg D (2011) Preciseolfactory responses tile the sniff cycle. Nat Neurosci 14:1039–1044. CrossRef Medline
Smear M, Shusterman R, O’Connor R, Bozza T, Rinberg D (2011)Perception of sniff phase in mouse olfaction. Nature 479:397–400.CrossRef Medline
Timme N, Alford W, Flecker B, Beggs JM (2014) Synergy, redun-dancy, and multivariate information measures: an experimental-ist’s perspective. J Comput Neurosci 36:119–140. CrossRef
Thorpe SJ, Fize D, Marlot C (1996) Speed of processing in the humanvisual system. Nature 381:520–522. CrossRef Medline
Thorpe SJ, Delorme A, VanRullen R (2001) Spike based strategies forrapid processing. Neural Netw 14:715–726. CrossRef
VanRullen R, Thorpe SJ (2001) Rate coding versus temporal ordercoding: what the retina ganglion cells tell the visual cortex. NeuralComput 13:1255–1283. Medline
VanRullen R, Guyonneau R, Thorpe SJ (2005) Spike times makesense. Trends Neurosci 28:1–4. CrossRef Medline
Williams PL, Beer RD (2010) Nonnegative decomposition of multi-variate information. arXiv 1004.2515v1
van Wyk M, Taylor W, Vaney D (2006) Local edge detectors: asubstrate for fine spatial vision at low temporal frequencies inrabbit retina. J Neurosci 26:13250 CrossRef Medline
Zhang Y, Kim IJ, Sanes JR, Meister M (2012) The most numerousganglion cell type of the mouse retina is a selective feature detec-tor. Proc Natl Acad Sci U S A 109:E2391–E2398. CrossRef
New Research 18 of 18
May/June 2016 2016, 3(3) e0134-15.2016 eNeuro.sfn.org