ranjita bhagwan, rahul kumar, ram ramjee, george ... bhagwan, rahul kumar, ram ramjee, george...
TRANSCRIPT

Ranjita Bhagwan, Rahul Kumar, Ram Ramjee, George Varghese
Surjyakanta Mohapatra, Hemanth Manoharan, Piyush Shah
MICROSOFT

Publisher
Interfaces
Auctioning,
Algorithms,
…
Publishers:
bing.com,
cnn.com,
…
Advertising
System
Advertiser
Interfaces
Users
Fraud Operators
Servers,
Back-end storage (DB, …)
Logging
Component
Flowers Cars Insurance
Advertisers2
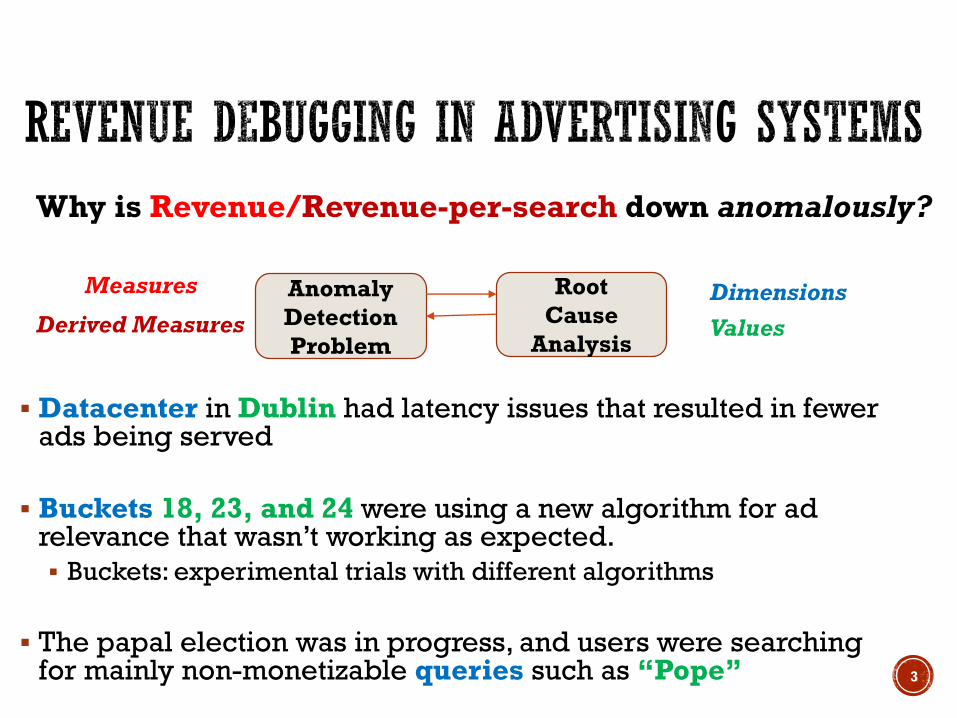
Datacenter in Dublin had latency issues that resulted in fewer ads being served
Buckets 18, 23, and 24 were using a new algorithm for ad relevance that wasn’t working as expected.
Buckets: experimental trials with different algorithms
The papal election was in progress, and users were searching for mainly non-monetizable queries such as “Pope”
DimensionsMeasures
Values
Why is Revenue/Revenue-per-search down anomalously?
Anomaly
Detection
Problem
Root
Cause
Analysis
3
Derived Measures

1. Novel algorithm for root cause analysis in Ad Systems Uses explanatory power, succinctness and surprise
2. Attribution for derived measures E.g., attribute an element’s contribution to revenue-per-search
(revenue/# searches)
3. Adtributor Tool 95+% accuracy in identifying root causes in Ad Systems
Saves 1+ hour on average of manual troubleshooter time
4

Characteristics of Ad systems
Root cause analysis
Attribution for derived measures
Adtributor Demo
Evaluation 5

Front-end
web server
Load Balancers Load Balancers
Database
Back-end
web
server
Front-end
web server
Back-end web
server
Database
#Clicks
Revenue
#Biddable
Keywords
#Ads
shown
#Searches
6

Searches Ads Clicks Revenue
Ads per Search
Clicks per Ad
Revenueper Search
Cost per Click
7

La
ten
cy
System Component
Isolation
End-host Network
Re
ve
nu
e
Users
Users in EU Users in US
Publishers,
Buckets, Advertisers,
System Components,…
Publisher 1 Publisher 2
Publishers
8

Example Expected Revenue: $100, Actual Revenue: $80
Revenue down by 20% anomaly!
Potential root causes One data center had $18 less revenue than forecasted
Three advertisers spent $20 less than forecasted
10 buckets resulted in $20 less revenue than forecasted
Should we attribute root cause to dimension data center, advertiser or bucket? Which values?
9

•Explanatory: root cause should explain most of change
• Succinctness: root cause likely to be few elements
DataCenter == X
Advertiser == A1 OR Advertiser == A3 OR Advertiser == A4
DC
X
90%
DC
Y
10%
Data Center
A1
50%
A2
0%
A3
30%
A4
20%
Advertiser F1
10%F2
10%
F3
10%
F4
10%F5
10%
F6
10%
F7
10%
F8
10%
F9
10%
F10
10%Bucket
Pie charts show contribution to change by dimension-values.
10

•Root cause likely to deviate most from expectation• Relative entropy of actual vs expected probability (JS-divergence)
Data Center Advertiser
Advertiser == A1 OR Advertiser == A3 OR Advertiser == A4
11
0
20
40
60
80
100
DC = X DC = Y
Re
ve
nu
e %
Expected Actual
0
10
20
30
40
50
A1 A2 A3 A4Re
ve
nu
e %
Expected Actual

Find the dimension and smallest set of values that maximally explain the anomalous change while also maximizing surprise
Multi-objective optimization
Greedy algorithm Smallest set each value
contributes > 10% of change
Maximally explains set should explain > 2/3 of change
Maximize surprise
12
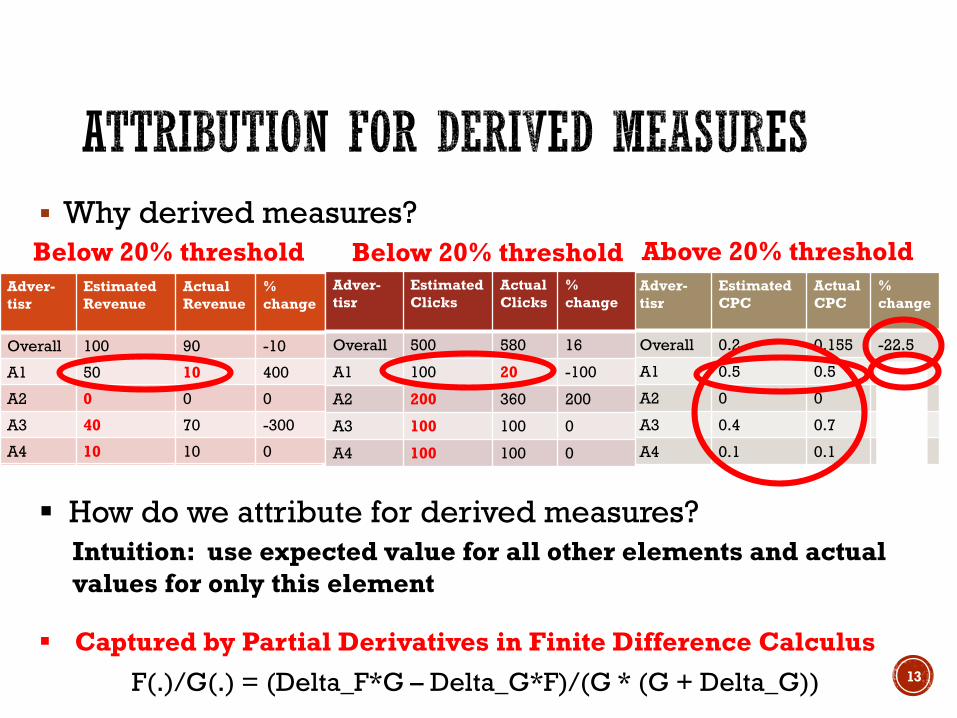
Why derived measures?
Intuition: use expected value for all other elements and actual
values for only this element
Captured by Partial Derivatives in Finite Difference Calculus
Adver-
tiser
Estimated
Revenue
Actual
Revenue
%
change
Overall 100 90 -10
A1 50 10 400
A2 0 0 0
A3 40 70 -300
A4 10 10 0
Adver-
tiser
Estimated
Clicks
Actual
Clicks
%
change
Overall 500 580 16
A1 100 20 -100
A2 200 360 200
A3 100 100 0
A4 100 100 0
Adver-
tisr
Estimated
CPC
Actual
CPC
%
change
Overall 0.2 0.155 -22.5
A1 0.5 0.5 125
A2 0 0 106
A3 0.4 0.7 -131
A4 0.1 0.1 0
Above 20% thresholdBelow 20% thresholdBelow 20% threshold
Adver-
tisr
Estimated
Revenue
Actual
Revenue
%
change
Overall 100 90 -10
A1 50 10 400
A2 0 0 0
A3 40 70 -300
A4 10 10 0
Adver-
tisr
Estimated
Clicks
Actual
Clicks
%
change
Overall 500 580 16
A1 100 20 -100
A2 200 360 200
A3 100 100 0
A4 100 100 0
F(.)/G(.) = (Delta_F*G – Delta_G*F)/(G * (G + Delta_G))
How do we attribute for derived measures?
13


Evaluated 128 alerts generated over a 2 week period over 8 markets (US, UK, DE, FR: PC, Mobile for each)
Compared Adtributor output with manual root-causing
Time saved: 1+ hour on average per alert
Parameter Value
Anomalies 128
No. of matches 118
Manual errors 4
Adtributor’s errors 5
Ambiguous 1
Accuracy 95.3%
15

Multiple Dimensions Derived MeasuresRoot causing
Network Component
Failure Isolation (e.g.,
SCORE, Sherlock, etc.)
Explanatory
Power,
Succinctness
Network Traffic
Pattern Finding
(Autofocus, HHH)
Explanatory
Power,
Succinctness
Explores all combinations
of dimensions dynamically,
Heuristic: unexpectedness
Revenue DebuggingExplanatory
Power,
Succinctness
Explores single dimensions
Pre-declared statically
Surprise: JS divergence
Partial derivative,
Finite differences
Does not handle Does not handle
Does not handle
Data mining
(Summarization,
Surprising Patterns)
Explanatory
Power,
Succinctness
Many techniques (e.g.,
Minimize description
length)
Does not handle
16
17
Publisher
Interfaces
Auctioning,
Algorithms
…Publishers:
bing.com,
cnn.com,
…
Advertising
System
Advertiser
Interfaces
Users
Fraud Operators
Servers,
Back-end storage (DB, …)
Logging
Component
Flowers Cars Insurance
Advertisers
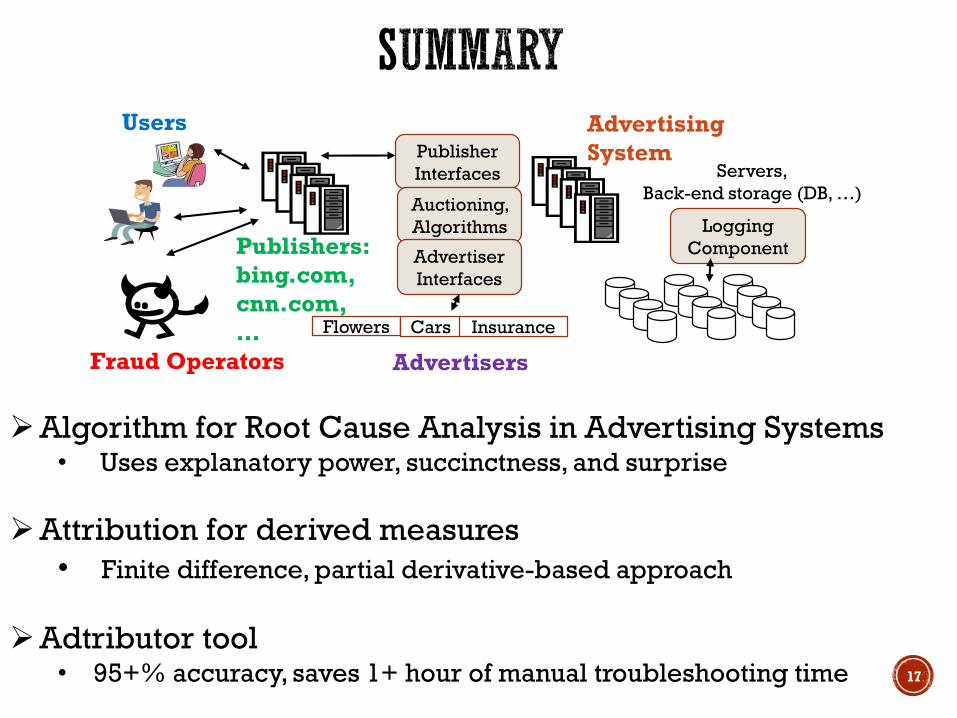
Algorithm for Root Cause Analysis in Advertising Systems• Uses explanatory power, succinctness, and surprise
Attribution for derived measures
• Finite difference, partial derivative-based approach
Adtributor tool• 95+% accuracy, saves 1+ hour of manual troubleshooting time

This problem/solution is not specific to advertising
Datacenter Diagnostics problem (Bodik et al., Eurosys 2010)
Problem: When there is a slowdown in the datacenter, where is the slowdown? Is it CPU, Memory or Disk that is the bottleneck?
Derived metric attribution
MoS score attribution in VOIP networks: which link is responsible for drop in the Mean Opinion Score (MoS) for a given VOIP call?
18

55
%
43
%
2%
DC 1 DC 2
DC 3
60
%
39
%
1%
DC 1 DC 2
DC 3
Dimension: Browser Dimension: Bucket Dimension: Data Center
Maximum surprise (deviation from expected value)
seen for the browser dimension
Configuration error caused no ads to be shown
on B3 for that time
Expected Actual Expected Actual Expected Actual
60%16%
12%
12
%
IE Firefox
Chrome Safari
74%
18%0%
8%
IE Firefox
Chrome Safari
B1 B2
B3 B4
B1 B2
B3 B4
19