range specialist’s reporta123.g.akamai.net/7/123/11558/abc123/forestservic... · ·...
TRANSCRIPT

1
United States Department of Agriculture
Forest Service
Date: December 10, 2013
Prepared By: Gary Hase, Jr., District Range Staff,
Flagstaff Ranger District
Signature: Gary Hase, Jr.
Range Specialist’s Report
Windmill West Range Allotment
Flagstaff and Red Rock Ranger Districts, Coconino National Forest
Coconino and Yavapai Counties, Arizona

2
TABLE OF CONTENTS __________________________
Introduction ..................................................................................................................................... 4
Analysis Area .............................................................................................................................. 4
Grazing History and Management .............................................................................................. 5
Existing Condition ........................................................................................................................ 10
Climate ...................................................................................................................................... 10
Vegetation ................................................................................................................................. 12
Grazing Capability .................................................................................................................... 13
Range Condition and Trend ...................................................................................................... 16
Range Condition ................................................................ Error! Bookmark not defined.17
Summary of Range Condition .............................................................................................. 22
Range Trend Data ................................................................................................................. 23
Summary of Range Trend ..................................................................................................... 27
Estimated Grazing Capacity for the Windmill West Allotment ............................................... 28
Summary of Estimated Grazing Capacity ................................................................................. 30
Desired Condition ......................................................................................................................... 30
Ground Cover, Species Richness and Species Composition .................................................... 31
Soil condition ............................................................................................................................ 31
Management Framework .............................................................................................................. 31
Environmental Consequences ....................................................................................................... 32
No Action Alternative ............................................................................................................... 32
Direct and Indirect Effects .................................................................................................... 32
Cumulative Effects................................................................................................................ 34
Modified Proposed Action Alternative ..................................................................................... 36
Direct and Indirect Effects .................................................................................................... 36
Cumulative Effects................................................................................................................ 42
Modified Proposed Action with South Gyberg Pasture Alternative ......................................... 44
Direct and Indirect Effects .................................................................................................... 45
Cumulative Effects................................................................................................................ 45
Comparison of Alternatives……………………………………………………………………...45
Preparation of Report .................................................................................................................... 48

3
Education and Professional Experience .................................................................................... 48
LITERATURE CITED ................................................................................................................. 49
APPENDIXES .............................................................................................................................. 53
Note about Acreage: All acreage figures shown in this report are approximate and were determined
using GIS software (ESRI ArcGIS). Minor differences in the acreage displayed may occur due to “floating
point rounding errors” in Excel spreadsheets and/or the data accuracy of the various GIS databases accessed.

4
Introduction The Flagstaff Ranger District of the Coconino National Forest proposes to continue to
authorize livestock grazing on Windmill West Allotment in a manner that maintains
resource conditions where allotment conditions are satisfactory, or moves resource
conditions towards meeting Forest Plan objectives and desired on-the-ground conditions
where allotment conditions are unsatisfactory. The Flagstaff District Ranger is the
Responsible Official for this project.
This report includes detailed information and analysis, which is used to inform the Fossil Creek
Allotment Environmental Assessment (EA). In some situations, the EA presents the information
in a slightly different manner. In these situations, the EA was the instrument used to inform the
decision-making process. Specialist reports, including this report, are important reference
sources for more detailed information on affected environment, methodology, and analysis that
was not included in the EA. This is based on the Council for Environmental Quality’s NEPA
regulations (Section 1508.9), which identifies an Environmental Assessment as a “concise public
document” to include “brief discussions” of the proposal, alternatives, environmental impacts of
the alternatives, and a listing of agencies and persons consulted.
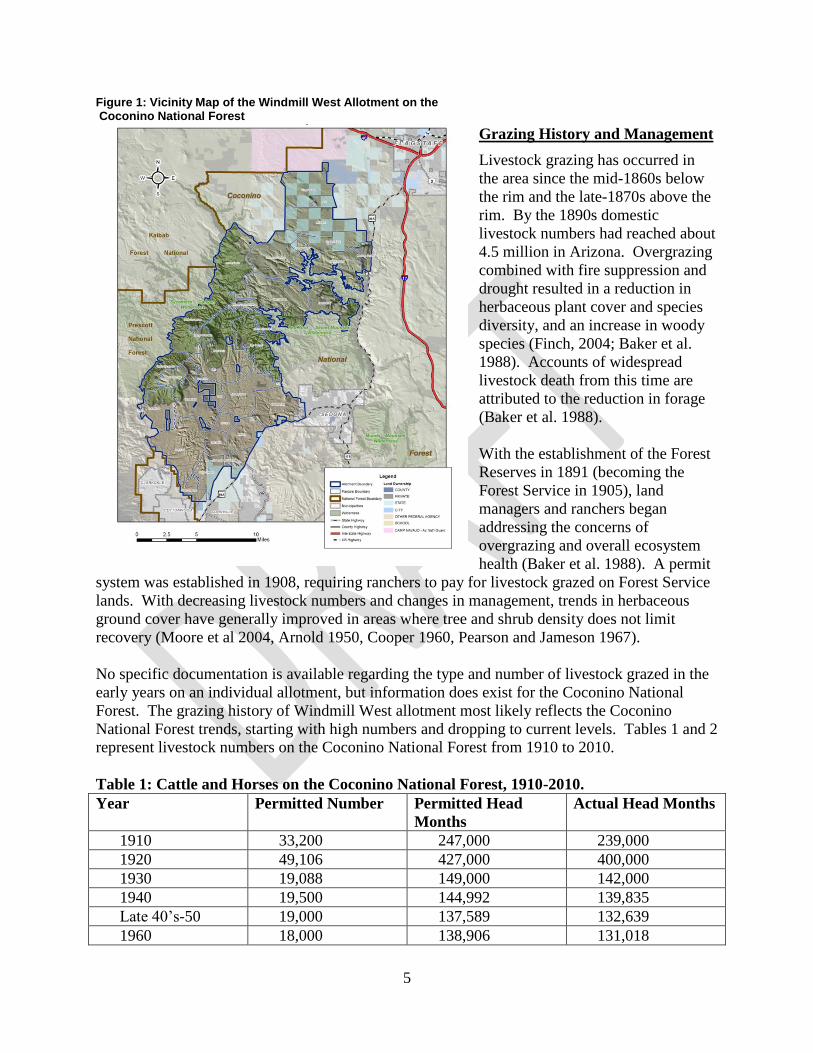
Analysis Area
The Windmill West Allotment is located on the Flagstaff and Red Rock Ranger Districts of the
Coconino National Forest, and is administered and managed by the Flagstaff Ranger District.
The allotment is generally located southwest of Flagstaff and west of Sedona; roughly bounded
by Highway 89A to the east, the city of Cottonwood to the south, the Coconino National Forest
Boundary to the west, and Interstate 40 to the north (Figure 1). The Mogollon Rim bisects the
allotment delineating the summer range to the north and winter range to the south. Elevations
range from 3,300 feet in the winter range on the Red Rock Ranger District to 7,500 feet in the
summer range on the Flagstaff Ranger District. Vegetation communities adhere to typical
elevation regimes: ponderosa pine, mountain meadows and mixed conifer forests are present in
the higher elevations (summer range); pinyon/juniper woodlands, chaparral, semi-desert
grasslands and desert scrub are typical at the mid to lower elevations (winter range).
The Windmill West allotment is approximately 154,000 acres in size. Land ownership within
the Windmill West allotment includes approximately 140,500 acres of National Forest System
lands and approximately 13,500 acres of either Arizona State Trust land or private land. The
Coconino National Forest only has management jurisdiction over National Forest System
acreage, the remaining acreage is managed either by the Arizona State Land Department or
private land owners. Of the 140,500 acres managed by the Coconino National Forest,
approximately 32,400 acres have not been actively grazed in the past 10 years.
5
Figure 1: Vicinity Map of the Windmill West Allotment on the Coconino National Forest
Grazing History and Management
Livestock grazing has occurred in
the area since the mid-1860s below
the rim and the late-1870s above the
rim. By the 1890s domestic
livestock numbers had reached about
4.5 million in Arizona. Overgrazing
combined with fire suppression and
drought resulted in a reduction in
herbaceous plant cover and species
diversity, and an increase in woody
species (Finch, 2004; Baker et al.
1988). Accounts of widespread
livestock death from this time are
attributed to the reduction in forage
(Baker et al. 1988).
With the establishment of the Forest
Reserves in 1891 (becoming the
Forest Service in 1905), land
managers and ranchers began
addressing the concerns of
overgrazing and overall ecosystem
health (Baker et al. 1988). A permit
system was established in 1908, requiring ranchers to pay for livestock grazed on Forest Service
lands. With decreasing livestock numbers and changes in management, trends in herbaceous
ground cover have generally improved in areas where tree and shrub density does not limit
recovery (Moore et al 2004, Arnold 1950, Cooper 1960, Pearson and Jameson 1967).
No specific documentation is available regarding the type and number of livestock grazed in the
early years on an individual allotment, but information does exist for the Coconino National
Forest. The grazing history of Windmill West allotment most likely reflects the Coconino
National Forest trends, starting with high numbers and dropping to current levels. Tables 1 and 2
represent livestock numbers on the Coconino National Forest from 1910 to 2010.
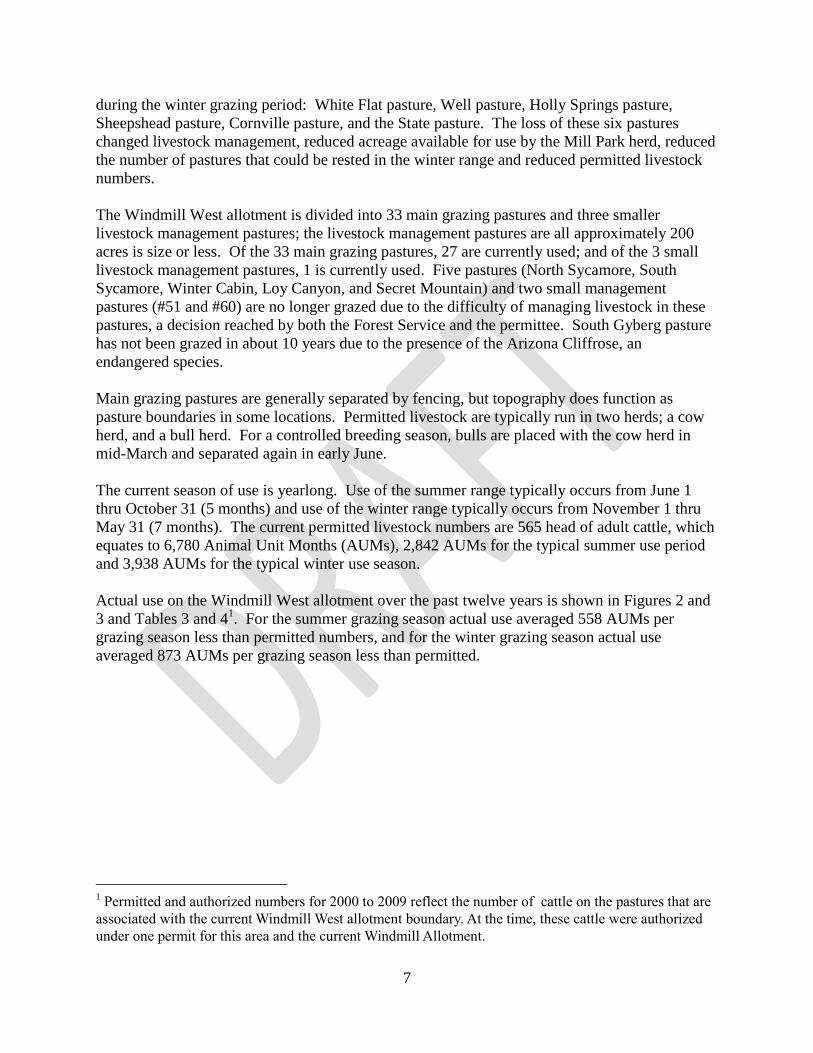
Table 1: Cattle and Horses on the Coconino National Forest, 1910-2010.
Year Permitted Number Permitted Head
Months
Actual Head Months
1910 33,200 247,000 239,000
1920 49,106 427,000 400,000
1930 19,088 149,000 142,000
1940 19,500 144,992 139,835
Late 40’s-50 19,000 137,589 132,639
1960 18,000 138,906 131,018

6
1970 19,000 138,688 123,611
1980 17,350 134,589 112,713
1990 17,540 136,160 96,118
2000 16,271 126,684 88,801
2010 16,318 112,947 75,715
Table 2: Sheep and Goats on the Coconino National Forest, 1910-2010
Year Permitted Number Permitted Head
Months
Actual Head Months
1910 89,550 360,000 300,000
1920 95,090 420,000 350,000
1930 63,080 240,000 200,000
1940 50,000 188,237 153,966
Late 40’s-50 24,000 112,827 94,594
1960 17,000 73,554 66,512
1970 15,000 57,742 53,993
1980 10,000 41,565 13,666
1990 2,670 14,747 12,002
2000 2,670 14,747 10,227
2010 2,670 12,038 12,038
The current Windmill West allotment is the result of several historical allotment combinations
and splits. By 1987 the Windmill, Roger’s Lake, Winter Cabin, Black Springs, and Barney
allotments were combined with the Foxboro, Munds Pocket, Indian Gardens, Geronimo, and T-
Six allotments to form the Windmill allotment. That same year the Black Springs pasture was
removed from the Windmill West allotment through a permit modification. In 2009 the
Windmill allotment was split into what are currently the Windmill and Windmill West
allotments. As a result of these allotment combinations and splits, two periods exist for the
recent grazing history and management of the area currently within the boundaries of the
Windmill West allotment: prior to February, 2009 and after February, 2009.
Prior to the February, 2009 split of Windmill allotment, cattle were managed on the Windmill
allotment in three separate herds; the Munds Park herd, the Foxboro herd, and the Mill Park
herd. Each herd was grazed separately on different areas of the allotment. The Munds Park herd
and the Foxboro herd grazed pastures on what is now currently the Windmill allotment. The
Mill Park herd grazed pastures on what is currently the Windmill West allotment plus the White
Flat, Well, Holly Springs, Sheepshead, Cornville, and State pastures of the current Windmill
allotment. Permitted livestock numbers for the Mill Park herd portion of the Windmill allotment
were 7,164 AUMs until 2009; 3,003 for the summer range and 4,161 for the winter range. The
Mill Park herd was managed using a deferred rest rotation grazing strategy which had been used
since 1995. Under this grazing system, two to three pastures from the winter range and two to
three pastures from summer range of the allotment were rested each year.
With the split of Windmill allotment in February, 2009, the Mill Park Herd was restricted to
grazing solely on what became the Windmill West allotment. The Windmill West allotment
does not include six main grazing pastures that were historically used by the Mill Park herd
7
during the winter grazing period: White Flat pasture, Well pasture, Holly Springs pasture,
Sheepshead pasture, Cornville pasture, and the State pasture. The loss of these six pastures
changed livestock management, reduced acreage available for use by the Mill Park herd, reduced
the number of pastures that could be rested in the winter range and reduced permitted livestock
numbers.
The Windmill West allotment is divided into 33 main grazing pastures and three smaller
livestock management pastures; the livestock management pastures are all approximately 200
acres is size or less. Of the 33 main grazing pastures, 27 are currently used; and of the 3 small
livestock management pastures, 1 is currently used. Five pastures (North Sycamore, South
Sycamore, Winter Cabin, Loy Canyon, and Secret Mountain) and two small management
pastures (#51 and #60) are no longer grazed due to the difficulty of managing livestock in these
pastures, a decision reached by both the Forest Service and the permittee. South Gyberg pasture
has not been grazed in about 10 years due to the presence of the Arizona Cliffrose, an
endangered species.
Main grazing pastures are generally separated by fencing, but topography does function as
pasture boundaries in some locations. Permitted livestock are typically run in two herds; a cow
herd, and a bull herd. For a controlled breeding season, bulls are placed with the cow herd in
mid-March and separated again in early June.
The current season of use is yearlong. Use of the summer range typically occurs from June 1
thru October 31 (5 months) and use of the winter range typically occurs from November 1 thru
May 31 (7 months). The current permitted livestock numbers are 565 head of adult cattle, which
equates to 6,780 Animal Unit Months (AUMs), 2,842 AUMs for the typical summer use period
and 3,938 AUMs for the typical winter use season.
Actual use on the Windmill West allotment over the past twelve years is shown in Figures 2 and
3 and Tables 3 and 41. For the summer grazing season actual use averaged 558 AUMs per
grazing season less than permitted numbers, and for the winter grazing season actual use
averaged 873 AUMs per grazing season less than permitted.
1 Permitted and authorized numbers for 2000 to 2009 reflect the number of cattle on the pastures that are
associated with the current Windmill West allotment boundary. At the time, these cattle were authorized
under one permit for this area and the current Windmill Allotment.

8
Figure 2: Windmill West Allotment Actual Use and Permitted Use in AUMs: 2000 to 2012,
Summer Pastures
Table 3: Actual use numbers compared to permitted use number in AUMs: 2000 to 2012,
Summer Pastures
Grazing
Year
Actual
Use
Permitted
Use
Percent of Permitted
Numbers Authorized
2000 2,575 3,003 85.7%
2001 2,575 3,003 85.7%
2002 2,072 3,003 69.0%
2003 1,921 3,003 64.0%
2004 1,886 3,003 62.8%
2005 2,414 3,003 80.4%
2006 2,691 3,003 89.6%
2007 2,324 3,003 77.4%
2008 2,364 3,003 78.7%
2009 2,842 2,842 100.0%
2010 2,842 2,842 100.0%
2011 2,842 2,842 100.0%
2012 1,786 2,842 62.8%
Average 2,395 2,953 81.1%
0
500
1000
1500
2000
2500
3000
3500
2000 2001 2002 2003 2004 2005 2006 2007 2008 2009 2010 2011 2012
An
imal
Un
it M
on
ths
Grazing Season, June 1-October 31 Actual Use Permitted Use

9
Figure 3: Windmill West Allotment Actual Use and Permitted Use in AUMs: 2000 to 2012,
Winter Pastures
Table 4: Actual use numbers compared to permitted use number in AUMs: 2000 to 2012,
Winter Pastures
Grazing Year Actual
Use
Permitted
Use
Percent of Permitted
Numbers Authorized
2000 3,262 4,161 78.4%
2001 3,624 4,161 87.1%
2002 2,871 4,161 69.0%
2003 3,269 4,161 78.6%
2004 3,882 4,161 93.3%
2005 3,861 4,161 92.8%
2006 2,049 4,161 49.2%
2007 3,206 4,161 77.0%
2008 4,056 4,161 97.5%
2009 3,617 3,938 91.8%
2010 3,422 3,938 86.9%
2011 2,307 3,938 58.6%
2012 2,418 3,938 61.4%
Average 3,219 4,092 78.7%
0500
10001500200025003000350040004500
2000 2001 2002 2003 2004 2005 2006 2007 2008 2009 2010 2011 2012
An
imal
Un
it M
on
ths
Grazing Season, November 1-May 31
Actual Use
Permitted Use

10
Current grazing management for Windmill West allotment uses a deferred, rest-rotation
management strategy. For the summer range, at least two pastures are rested each grazing
season. Livestock use of pastures in the winter range is deferred each grazing season and, if
possible, a pasture may be rested. The decision to rest a pasture is based on stocking levels,
forage production and plant dormancy during winter. The number of planned days each pasture
is grazed varies due to current year’s stocking rate, existing and predicted forage production, and
past year’s utilization. The actual number of days each pasture is grazed is dependent on
stocking rate, forage production and grazing intensity. Due to plant dormancy during winter,
pastures grazed during winter months typically have a longer graze period than pastures grazed
during summer months.
Grazing intensity levels, the amount of herbage removed or trampled during the grazing season,
are managed at the light to moderate level (21 to 50%) for both the summer range and the winter
range. Utilization levels, measured at the end of the growing season, are managed at the
conservative level (35%) for herbaceous and non-riparian woody vegetation in the summer range
and at the moderate level (50%) for herbaceous and non-riparian woody vegetation in the winter
range.
Cattle are moved between the summer range and winter range via the Historic Mooney Livestock
Trail. The Mooney Trail stretches about 4.5 miles, from Section 35, T19N, R4E on the Flagstaff
Ranger District south to Sec29 T18N R4E on the Red Rock Ranger District, and is located
within the Black Tank pasture. About ½ mile of the trail on the Red Rock District is located on
private land. The Mooney trail has been used to drive cattle between the summer and winter
ranges since the early 1900’s.
Existing Condition
Detailed existing condition data, except for Potential Natural Vegetation Types (PNVTs), is only
provided for areas that are being considered for the authorization of livestock grazing in the
range of alternatives. It is assumed that areas that have not been grazed for the past 10-15 years
and are proposed to be removed from the allotment and closed to grazing would have no
difference in effects by the alternatives. Therefore, detailed existing condition data is not needed
for those areas to support the effects analysis.
Climate
Climate on the Windmill West allotment is characterized by a bimodal precipitation pattern with
about 60 percent of precipitation occurring as frontal systems in the winter from December to
March and about 40 percent occurring as monsoons in the summer from July to September. The
summer period (July-September) is characterized by localized high intensity, short duration
thunderstorms. The winter period (December-March) is characterized by frontal activity
resulting in widespread gentle rains in the lower elevations and snow in the higher elevations.
Climate conditions are a major contributing factor affecting range condition and trend in the
southwestern United States. Large year-to-year differences in rainfall and forage production are

11
characteristic of southwestern ranges (Martin 1974). Climate model projections for the
southwest United States predict average temperatures will continue to rise as will the potential
for an increase in the frequency of extreme heat events (Crimmins et al. 2007).
There are six weather stations that approximate the climate of the allotment. Data from two
stations, Williams, AZ and the Sedona Ranger District stations, are derived from the Western
Regional Climate Center; while data from the remaining four stations, Woody Mountain, Red
Hill, Dry Creek Levee and Cottonwood Public Works Yard, are derived from Yavapai County
Government Rainfall Data. Table 5 displays the historical precipitation data for the five sites.
Graphs depicting 8 to 20 year precipitation trends for each gauge can be found in Appendix B,
Figures 1 thru 6.
Table 5: Precipitation data from 6 stations within or adjacent to the Windmill West
grazing allotment
Site Location
Years Read Mean Annual
PPT. (in)
Max. PPT.
(in) (Year)
Min. PPT.
(in) (Year)
Williams, AZ* Sec32
T21N R2E,
13 miles
west of
Roger’s
Lake
pasture
1897-2011 20.42 39.93(1965) 2.19(1903)
Sedona Ranger
District*
Sec7 T17N
R6E,
Junction of
89A and
179
1943-2010 17.95 33.16 (1965) 7.79 (1956)
Woody Mt** Sec10
T20N R6E,
2 miles east
of Roger’s
Lake
pasture
1993-2010 14.23 33.07 (2005) 3.82 (2002)
Red Hill** Sec5, T19N
R5E,
Lockwood
Springs
pasture
1993-2010 17.34 36.22 (2005) 5.59 (1994)
Dry Creek
Levee**
Sec19
T17N R5E,
within or
just SE of
Greasy East
pasture
2001-2012 10.88 17.56(2010) 6.61(2009)
Cottonwood Sec4 T15N 2001-2010 9.97 17.99 (2005) 7.05 (2006)

12
Public Works
Yard**
R3E, 2
miles south
of South
Gyberg
pasture
*Data from Western Regional Climate Center
**Data from Yavapai County Government Rainfall Data
Vegetation
According to the Coconino National Forest database the Potential Natural Vegetation Types
(PNVT) occurring within the Windmill West allotment vary from Semi-Desert Grassland and
Pinyon Juniper Woodlands at the lower elevations to Ponderosa Pine and Mixed Conifer at the
highest elevations. Acres of each PNVT that are within the analysis area are listed in Table 6.
Table 6: Acres of each Potential Natural Vegetation Type within the current Windmill
West allotment boundary
Potential Natural Vegetation Types Sum of
Acres Percentage
Cottonwood Willow Riparian Forest 110 0.1%
Desert Communities 11,839 8.4%
Gallery Coniferous Riparian Forest 2 0.0%
Interior Chaparral 20,432 14.5%
Mixed Broadleaf Deciduous Riparian Forest 469 0.3%
Mixed Conifer with Aspen 0 0.0%
Mixed Conifer with Frequent Fire 1,561 1.1%
Montane Subalpine Grassland 1,337 1.0%
Montane Willow Riparian Forest 67 0.0%
Pinyon Juniper Evergreen Shrub 23,015 16.4%
Pinyon Juniper Woodland (Persistent) 2,015 1.4%
Ponderosa Pine 48,753 34.7%
Semi-Desert Grassland 30,875 22.0%
Wetland or Cienega 89 0.1%
Total 140,564
One of the many contributing factors to rangeland condition and trend is the encroachment and
increasing canopy of juniper and shrub species. Productive grasslands and open pinyon juniper
woodlands with a healthy understory component have been altered over time by the
encroachment of juniper and woody shrubs which decreases the herbaceous perennial grasses,
exposes larger areas of bare soil, and accelerates rates of erosion and decreases overall watershed
and soil function. This loss of perennial vegetative ground cover is primarily due to the increase
in canopy cover which suppresses understory vegetation. Table 6 shows that approximately 40%
of the Windmill West allotment is in potential vegetation types for pinyon juniper and semi-
desert grasslands which are the vegetation types most likely to experience tree and shrub
encroachment.

13
Archer (1994) provided an extensive review of the causes of encroachment of grasslands by
woody species. The encroachment of grasslands by woody species is a global phenomenon
that’s been attributed to atmospheric enrichment with CO2, climate change, livestock grazing,
and/or lack of fire. In some environments, the shift to woody species has been accompanied by
increased erosion where woody species compete directly with grasses for limited soil moisture
and nutrients (Wilcox and Davenport, 1995). This shift from grasslands to woodlands or
shrublands, therefore, has the potential to impact rangeland condition and trend.
Grazing Capability
Grazing capability of a land area is dependent upon the interrelationship of the soils, topography,
plants and animals. Grazing capability is a qualitative expression of the inherent ability of an
ecosystem to support grazing use by various classes of livestock on a sustained yield basis.
Grazing capability is expressed as one of three capability classes: Full Capability, Potential
Capability, and No Capability (Region 3 Rangeland Analysis and Management Training Guide;
July, 1999; 2.8-2.10), which are defined as:
Full Capability - Full Capability areas are those which can be used by grazing animals under
proper management without long-term damage to the soil resource or plant communities.
Typically, this land is stable. Vegetative ground cover is maintaining site productivity and
producing a minimum of 100 pounds of dried forage per acre per year. Soil loss as judged by
available techniques is within tolerance. Potential Capability - : Areas which could be used by grazing animals under proper management but where soil stability is impaired, or range improvements are not adequate under existing conditions to obtain necessary grazing animal distribution. The area is not capable of being fully or adequately utilized by grazing animals. Generally, this land has impaired soil stability, lack of water, steep terrain, lack of access and/or there is insufficient vegetative ground cover to protect the soil, but if treated, developed, or properly managed, could become Full Capability. When determining grazing capacity in the Potential Capability class, conservative allowable use assignments must be made. Rationale for assigned allowable use will be documented. No Capability - No capability areas are those which cannot be used by animals without long-term damage to the soil resource or plant community, or are barren or unproductive naturally. These areas are not capable of being grazed by domestic livestock under reasonable management goals. Grazing capacity will not be assigned to these areas, even though light livestock use may occur.
The analysis of grazing capability on the Windmill West Allotment indicates that the major
factors in determining and classifying capability are soil condition, slope, and site productivity.
Table 7 displays a summary of the criteria used for determining Grazing Capability
classifications for the Windmill West allotment. Table 8 displays soil condition and slope acres
for the areas of the Windmill West allotment that are being considered for the re-authorization of
grazing. Table 9 displays soil condition and slope acres for the South Gyberg pasture. Table 10
displays grazing capability acres for the areas of the Windmill West allotment that are being
14
considered for the re-authorization of grazing and Table 11 displays grazing capability acres for
the South Gyberg pasture.
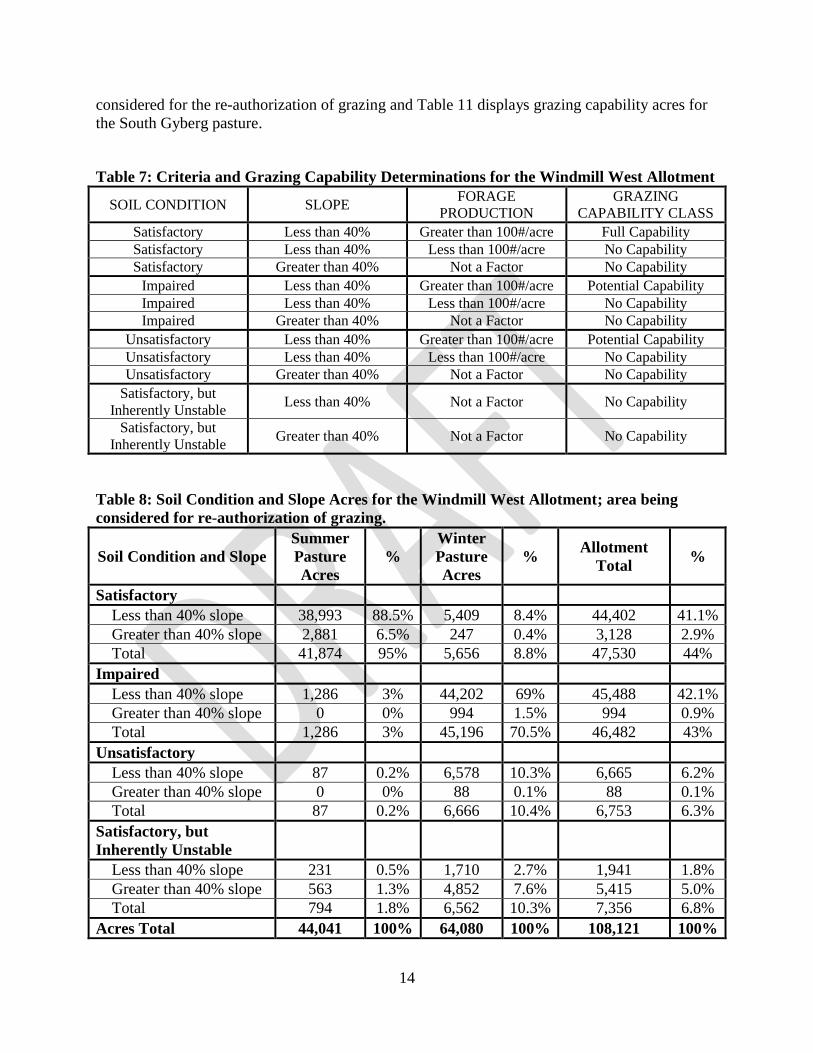
Table 7: Criteria and Grazing Capability Determinations for the Windmill West Allotment
SOIL CONDITION SLOPE FORAGE
PRODUCTION
GRAZING
CAPABILITY CLASS
Satisfactory Less than 40% Greater than 100#/acre Full Capability
Satisfactory Less than 40% Less than 100#/acre No Capability
Satisfactory Greater than 40% Not a Factor No Capability
Impaired Less than 40% Greater than 100#/acre Potential Capability
Impaired Less than 40% Less than 100#/acre No Capability
Impaired Greater than 40% Not a Factor No Capability
Unsatisfactory Less than 40% Greater than 100#/acre Potential Capability
Unsatisfactory Less than 40% Less than 100#/acre No Capability
Unsatisfactory Greater than 40% Not a Factor No Capability
Satisfactory, but
Inherently Unstable Less than 40% Not a Factor No Capability
Satisfactory, but
Inherently Unstable Greater than 40% Not a Factor No Capability
Table 8: Soil Condition and Slope Acres for the Windmill West Allotment; area being
considered for re-authorization of grazing.
Soil Condition and Slope
Summer
Pasture
Acres
%
Winter
Pasture
Acres
% Allotment
Total %
Satisfactory
Less than 40% slope 38,993 88.5% 5,409 8.4% 44,402 41.1%
Greater than 40% slope 2,881 6.5% 247 0.4% 3,128 2.9%
Total 41,874 95% 5,656 8.8% 47,530 44%
Impaired
Less than 40% slope 1,286 3% 44,202 69% 45,488 42.1%
Greater than 40% slope 0 0% 994 1.5% 994 0.9%
Total 1,286 3% 45,196 70.5% 46,482 43%
Unsatisfactory
Less than 40% slope 87 0.2% 6,578 10.3% 6,665 6.2%
Greater than 40% slope 0 0% 88 0.1% 88 0.1%
Total 87 0.2% 6,666 10.4% 6,753 6.3%
Satisfactory, but
Inherently Unstable
Less than 40% slope 231 0.5% 1,710 2.7% 1,941 1.8%
Greater than 40% slope 563 1.3% 4,852 7.6% 5,415 5.0%
Total 794 1.8% 6,562 10.3% 7,356 6.8%
Acres Total 44,041 100% 64,080 100% 108,121 100%

15
Table 9: Soil Condition and Slope Acres for the South Gyberg Pasture
Soil Condition and Slope Acres %
Satisfactory
Less than 40% slope 634 32.4%
Greater than 40% slope 0 0%
Total 634 32.4%
Impaired
Less than 40% slope 1249 63.8%
Greater than 40% slope 3 0.2%
Total 1252 64%
Unsatisfactory
Less than 40% slope 0 0%
Greater than 40% slope 0 0%
Total 0 0%
Satisfactory, but
Inherently Unstable
Less than 40% slope 0 0%
Greater than 40% slope 71 3.6%
Total 71 3.6%
Acres Total 1,957 100%
Table 10: Grazing Capability Classification Acres for the Windmill West Allotment; area
being considered for re-authorization of grazing.
Grazing Capability
Classification
Summer
Pasture Acres
Winter
Pasture Acres
Allotment
Total Description
Full Capability 36,726 5,173 41,899 Sat. Soil Condition and
<40% Slope
Potential Capability 1,373 45,759 47,132 Impaired and Unsat. Soil
Condition and <40% Slope
No Capability 5,942 13,148 19,090
Slopes >40%; areas with
<100# forage prod./acre;
Sat., but Inherently Unstable
soil condition <40% slope
Total 44,041 64,080 108,121

16
Table 11: Grazing Capability Classification Acres for the South Gyberg Pasture
Grazing Capability
Classification Acres Description
Full Capability 240 Sat. Soil Condition and
<40% Slope
Potential Capability 539 Impaired and Unsat. Soil
Condition and <40% Slope
No Capability 1,178
Slopes >40%; areas with
<100# forage prod./acre;
Sat., but Inherently Unstable
soil condition <40% slope
Total 1,957
Range Condition and Trend
Range condition and trend are assessed at permanent monitoring locations and, if necessary, at
additional inventory locations. Pace-Frequency and 1/10 acre ocular macroplot cover methods
are used on the Windmill West allotment.
Twenty seven permanent monitoring plots were established on the allotment between 1952 and
1964; 11 on winter pastures and 16 on summer pastures. Data was collected from these plots
using the Parker 3-Step method through 1990. In 2000, 24 of the original 27 plots were
converted to the Pace-Frequency and 1/10 acre ocular macroplot cover methods. In 2008, 9 plots
from the winter pastures were read using the Pace-Frequency and 1/10 acre ocular macroplot
cover methods, and in 2009 11 of the plots in the summer pastures were read using the Pace-
Frequency and 1/10 acre ocular macroplot cover methods. In 2013, Pace-Frequency and 1/10
acre ocular macroplot cover data was collected from an additional 9 inventory locations in the
winter pastures. Inventory plots were not established to be long term monitoring plots.
Data from a total of 20 long term monitoring plots and 9 inventory locations were used in this
analysis. Inventory plots and long term monitoring plots are located in key areas, the criteria for
which include slopes less than 40%. The Windmill West allotment permanent monitoring plots
and inventory plots are located on 15 of 30 TEUs or TEU groups. These 15 TEUs or TEU
groups represent approximately 91,000 acres (84%) of the Windmill West allotment (see Table
12).

17
Table 12. Monitoring and Inventory Plots by TEU/TEU Groupings
TES Unit/Groupings Ac. < 40% Ac. > 40% Ac. < 40% Ac. > 40%
33 0 0 50 33 83 0% 0% 0 0
45 0 0 329 14 343 0% 0% 0 0
50 87 0 0 0 87 0% 0% 0 0
55 1,286 0 0 0 1,286 1% 1% 1 1,286 1,286
280 0 0 14 0 14 0% 0% 0 0
350 0 0 4,383 788 5,171 5% 4% 3 5,171 4,383
381, 385 0 0 8,417 8 8,425 8% 9% 3 8,425 8,417
383 0 0 136 0 136 0% 0% 0 0
402, 403, 404 0 0 7,328 44 7,372 7% 7% 1 7,372 7,328
414, 417 0 0 5,728 7 5,735 5% 6% 2 5,735 5,728
416 0 0 3,278 190 3,468 3% 3% 0 0
418 0 0 4,937 87 5,024 5% 5% 1 5,024 4,937
420, 430 0 0 3,978 1,089 5,067 5% 4% 3 5,067 3,978
447 0 0 1,833 4 1,837 2% 2% 1 1,837 1,833
448 0 0 1,847 77 1,924 2% 2% 0 0
457, 458 0 0 10,960 397 11,357 11% 11% 1 11,357 10,960
462, 463, 495 0 0 3,187 107 3,294 3% 3% 3 3,294 3,187
471 231 563 1,171 3,113 5,078 5% 1% 0 0
492 0 0 84 0 84 0% 0% 0 0
493 0 0 184 0 184 0% 0% 0 0
536, 546, 549 13,296 451 3 13 13,763 13% 14% 4 13,763 13,299
555 1,810 1,850 52 210 3,922 4% 2% 0 0
550, 582, 584, 585 17,365 322 0 0 17,687 16% 18% 2 17,687 17,365
565 131 0 0 0 131 0% 0% 0 0
567, 578, 579 934 5 0 0 939 1% 1% 2 939 934
572 457 25 0 0 482 0% 0% 1 482 457
575 45 61 0 0 106 0% 0% 0 0
586 3,556 6 0 0 3,562 3% 3% 1 3,562 3,556
595 45 0 0 0 45 0% 0% 0 0
650, 651, 654 1,354 161 0 0 1,515 1% 1% 0 0
TOTAL 40,597 3,444 57,899 6,181 108,121 100% 99% 20 9 91,001 87,648
84.2% 89.0%
Ac. with
Existing Cond.
Data
Ac. < 40% with
Existing Cond.
Data
44,041 64,080
Summer Pastures Winter PasturesTotal Ac.
% of
Allot.
Acres
% of
Graze
Acres
Mon.
Plots
Total Summer Pastures Total Winter Pastures
Inven.
Plots
Range Condition
The following represents a summary of the existing range conditions on the Windmill West
allotment based on data collected in 2008, 2009, and 2013. Since monitoring plots were
established prior to the publication of TES, not all TEUs are represented by long term
monitoring. While we cannot extrapolate existing condition data to TEUs that do not have
monitoring plots, we can determine, based on professional opinion, that conditions observed at
long term monitoring plots and inventory plots are characteristic for all TEUs in both the winter
and summer ranges of the Windmill West allotment. Complete data and monitoring/inventory
forms are located at the Flagstaff Ranger District.
Winter Pastures
TEU 350 (5,171 acres)
Data collected at three inventory plots show that three to five grass species were recorded with
cool season species comprising 0-20% and warm season species comprising 80-100% of the
species composition. Grass canopy cover ranged 11-20%. Four to eight species of forbs were
recorded with a range of 1-2% canopy cover. Nine to ten shrub species were recorded ranging
from 14-17% canopy cover. One to two tree species were recorded ranging from 6-36% canopy
cover. Percent ground cover for bare soil ranged from 11-13%, rock ranged from 58-72%, basal
vegetation ranged from 6-11%, litter greater than 0.5” was recorded at 0% and effective ground
cover ranged from 6-11%.

18
Canopy cover, species richness and species composition for all functional groups (perennial
grass, forbs, shrubs and trees) above fall within the desired conditions for this TEU. Current data
show that effective ground cover should be increased to meet desired conditions.
TEUs 381 and 385 (8,425 acres)
Data collected at three long term monitoring plots show that 2-3 grass species were recorded
with cool season species comprising 0-35% and warm season species comprising 65-100% of the
species composition. Grass canopy cover ranged from 5-30%. Two to four species of forbs
were recorded totaling 1% canopy cover. Ten shrub species were recorded totaling 9% canopy
cover. No trees were recorded in the plots. Percent ground cover for bare soil ranged from 39-
87%, rock ranged from 0-10%, basal vegetation ranged from 4-8%, litter greater than 0.5”
ranged from 0-56% and effective ground cover ranged from 4-64%.
Canopy cover, species richness and species composition for all vegetation groups above, fall
within the desired conditions for this TEU grouping. Effective ground cover meets the desired
conditions for this TEU grouping.
TEUs 402, 403 and 404 (7,372 acres)
Data collected at one long term monitoring plot show that four grass species were recorded with
cool season species comprising 0% and warm season species comprising 100% of the species
composition. Grass canopy cover totaled 15%. Five forb species were recorded totaling 6%
canopy cover. Three shrub species were recorded totaling 1% canopy cover. No trees were
recorded in the plot. Percent ground cover for bare soil totaled 57%, rock totaled 28%, basal
vegetation totaled 7%, litter greater than 0.5” totaled 0% and effective ground cover totaled 7%.
Canopy cover and species richness for all vegetation groups above fall within the desired
conditions for this TEU grouping. Cool season species composition should be increased to meet
desired conditions, (see write up about cool season species). Effective ground cover should be
increased to meet desired conditions.
TEUs 414 and 417 (5,735 acres)
Data collected at two long term monitoring plots show that five to six grass species were
recorded with cool season species comprising 0-33% and warm season species comprising 65-
100% of the species composition. Grass canopy cover ranged from 2-20%. Five to nine forb
species were recorded ranging from 10-26% canopy cover. Eight shrub species were recorded
ranging from 20-23% canopy cover. No trees were recorded in the plot. Percent ground cover
for bare soil ranged from 23-74%, rock ranged from 5-33%, basal vegetation ranged from 8-
10%, litter greater than 0.5” ranged from 0.3-1% and effective ground cover ranged from 8-11%.
Canopy cover, species richness and species composition for all vegetation groups above fall
within the desired conditions for this TEU grouping. Effective ground cover should be increased
to meet desired conditions.

19
TEU 418 (5,024 acres)
Data collected at one long term monitoring plot show that seven grass species were recorded
with cool season species comprising 14% and warm season species comprising 85% of the
species composition. Grass canopy cover totaled 23%. Five forb species were recorded with 1%
canopy cover. Seven shrub species were recorded with 16% canopy cover. One tree species was
recorded with 7% canopy cover. Percent ground cover for bares soil totaled 40%, rock totaled
30%, basal vegetation totaled 6%, litter greater than 0.5” totaled 0% and effective ground cover
totaled 6%.
Canopy cover and species richness for all vegetation groups above, fall within the desired
conditions for this TEU. Warm season species composition for grasses should be reduced to
meet desired conditions. Effective ground cover should be increased to meet the desired
conditions for this TEU.
TEUs 420 and 430 (5,067 acres)
Data collected at three inventory plots show that 3-5 grass species were recorded with cool
season species comprising 0-25% and warm season species comprising 75-100% of the species
composition. Grass canopy cover ranged from 4-26%. Four to six for species were recorded
ranging from 0.5-2% canopy cover. Six to eight shrub species were recorded ranging from 6-
17% canopy cover. One to two tress species were recorded ranging from 5-10% canopy cover.
Percent ground cover for bare soil ranged from 5-28%, rock ranged from 45-56%, basal
vegetation ranged from 8-12%, litter greater than 0.5” ranged from 1-3% and effective ground
cover ranged from 9-15%.
Canopy cover, species richness and species composition for all vegetation groups above, fall
within the desired conditions for this TEU grouping. Effective ground cover should be increased
to meet desired conditions.
TEU 447 (approx. 1,837 acres)
Data collected at one long term monitoring plot show that three grass species were recorded with
cool season species comprising 33% and warm season species comprising 66% of the species
composition. Grass canopy cover totaled 23%. Seven forb species were recorded totaling 2%
canopy cover. Two shrub species were recorded totaling 5% canopy cover. No tree species
were recorded in this plot. Percent ground cover for bare soil totaled 63%, rock totaled 22%,
basal vegetation totaled 6%, litter greater than 0.5” totaled 1% and effective ground cover totaled
7%.
Canopy cover, species richness and species composition for all vegetation groups above, fall
within the desired conditions for this TEU grouping. Effective ground cover should be increased
to meet desired conditions.
TEUs 457 and 458 (11,357 acres)
Data collected at one long term monitoring plot show that two grass species were recorded with
cool season species comprising 0% and warm season species comprising 100% of the species
composition. Grass canopy cover totaled 17%. Two forb species were recorded totaling 7%
canopy cover. Seven shrub species were recorded totaling 10% canopy cover. Two tree species
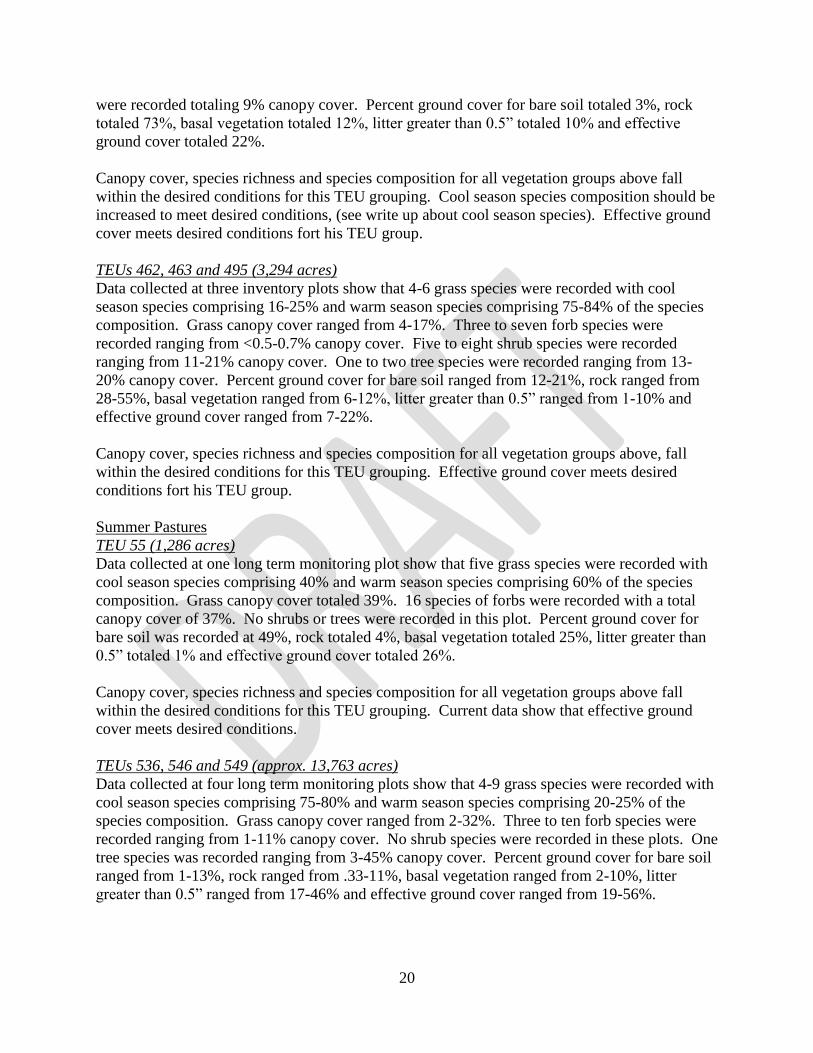
20
were recorded totaling 9% canopy cover. Percent ground cover for bare soil totaled 3%, rock
totaled 73%, basal vegetation totaled 12%, litter greater than 0.5” totaled 10% and effective
ground cover totaled 22%.
Canopy cover, species richness and species composition for all vegetation groups above fall
within the desired conditions for this TEU grouping. Cool season species composition should be
increased to meet desired conditions, (see write up about cool season species). Effective ground
cover meets desired conditions fort his TEU group.
TEUs 462, 463 and 495 (3,294 acres)
Data collected at three inventory plots show that 4-6 grass species were recorded with cool
season species comprising 16-25% and warm season species comprising 75-84% of the species
composition. Grass canopy cover ranged from 4-17%. Three to seven forb species were
recorded ranging from <0.5-0.7% canopy cover. Five to eight shrub species were recorded
ranging from 11-21% canopy cover. One to two tree species were recorded ranging from 13-
20% canopy cover. Percent ground cover for bare soil ranged from 12-21%, rock ranged from
28-55%, basal vegetation ranged from 6-12%, litter greater than 0.5” ranged from 1-10% and
effective ground cover ranged from 7-22%.
Canopy cover, species richness and species composition for all vegetation groups above, fall
within the desired conditions for this TEU grouping. Effective ground cover meets desired
conditions fort his TEU group.
Summer Pastures
TEU 55 (1,286 acres)
Data collected at one long term monitoring plot show that five grass species were recorded with
cool season species comprising 40% and warm season species comprising 60% of the species
composition. Grass canopy cover totaled 39%. 16 species of forbs were recorded with a total
canopy cover of 37%. No shrubs or trees were recorded in this plot. Percent ground cover for
bare soil was recorded at 49%, rock totaled 4%, basal vegetation totaled 25%, litter greater than
0.5” totaled 1% and effective ground cover totaled 26%.
Canopy cover, species richness and species composition for all vegetation groups above fall
within the desired conditions for this TEU grouping. Current data show that effective ground
cover meets desired conditions.
TEUs 536, 546 and 549 (approx. 13,763 acres)
Data collected at four long term monitoring plots show that 4-9 grass species were recorded with
cool season species comprising 75-80% and warm season species comprising 20-25% of the
species composition. Grass canopy cover ranged from 2-32%. Three to ten forb species were
recorded ranging from 1-11% canopy cover. No shrub species were recorded in these plots. One
tree species was recorded ranging from 3-45% canopy cover. Percent ground cover for bare soil
ranged from 1-13%, rock ranged from .33-11%, basal vegetation ranged from 2-10%, litter
greater than 0.5” ranged from 17-46% and effective ground cover ranged from 19-56%.

21
Canopy cover, species richness and species composition for all vegetation groups above, except
shrubs, fall within the desired conditions for this TEU grouping. Effective ground cover meets
desired conditions fort his TEU group.
TEUs 550, 582, 584 and 585 (17,687 acres)
Data collected at two long term monitoring plots show that 6-10 grass species were recorded
with cool season species comprising 60-83% and warm season species comprising 17-40% of the
species composition. Grass canopy cover ranged from 7-28%. Four to seven forb species were
recorded ranging from 1-11% canopy cover. Zero shrub species were recorded. One to two tree
species were recorded ranging from 22-45% canopy cover. Percent ground cover for bare soil
ranged from3-31%, rock ranged from 0.1-2%, basal vegetation ranged from 3-8%, litter greater
than 0.5” ranged from 18-25% and effective ground cover ranged from 21-31%.
Canopy cover, species richness and species composition for all vegetation groups above, fall
within the desired conditions for this TEU grouping. Effective ground cover meets desired
conditions fort his TEU group.
TEUs 567, 578 and 579 (939 acres)
Data collected at two long term monitoring plots show that six grass species were recorded with
cool season species comprising 50% and warm season species comprising 50% of the species
composition. Grass canopy cover ranged from 14-86%. One to five forb species were recorded
with 0.5-3% canopy cover. Zero to five shrub species were recorded with 0-1% canopy cover.
Three tree species were recorded with 7-54% canopy cover. Percent ground cover for bare soil
ranged from 2-19%, rock ranged from 2-15%, basal vegetation ranged from 2-18%, litter greater
than 0.5” ranged from 13-63% and effective ground cover ranged from 15-81%.
Canopy cover, species richness and species composition for all vegetation groups above, fall
within the desired conditions for this TEU grouping. Effective ground cover meets desired
conditions fort his TEU group.
TEU 572 (482 acres)
Data collected at one long term monitoring plots show that 8 grass species were recorded with
cool season species comprising 43% and warm season species comprising 57% of the species
composition. Grass canopy cover was 15%. Five forb species were recorded with 5% canopy
cover. Zero shrub species were recorded. Three tree species were recorded with 21% canopy
cover. Percent ground cover for bare soil was 31%, rock was 6%, basal vegetation was 4%, litter
greater than 0.5” was 13% and effective ground cover was 17%.
Canopy cover, species richness and species composition for all vegetation groups above, fall
within the desired conditions for this TEU grouping. Effective ground cover should be increased
to meet desired conditions for this TEU group.
TEU 586 (3,562 acres)
Data collected at one long term monitoring plots show that 11 grass species were recorded with
cool season species comprising 64% and warm season species comprising 36% of the species
composition. Grass canopy cover was 24%. Eight forb species were recorded with 17% canopy

22
cover. Zero shrub species were recorded. Two tree species were recorded with 18% canopy
cover. Percent ground cover for bare soil was 7%, rock was 19%, basal vegetation was 18%,
litter greater than 0.5” was 9% and effective ground cover was 27%.
Canopy cover, species richness and species composition for all vegetation groups above, fall
within the desired conditions for this TEU grouping. Effective ground cover should be increased
to meet desired conditions for this TEU group.
Summary of Range Condition
Table 12 compares the most recent long term monitoring data with the desired conditions for
various range condition attributes. The comparison between existing conditions and desired
conditions are organized by the TEU, or TEU groupings, that occur within areas of the Windmill
West allotment that are being considered for the re-authorization of grazing.
Table 13. Comparison of long term monitoring data and Range Desired Conditions by
TEU
TEUs
Do Existing Conditions Meet Desired Conditions
Perennial grass
canopy cover
Number of
Perennial Grass
Species
Effective
Ground Cover
Composition of
cool and warm
season grasses
Winter Range
350 Yes Yes No Yes
381, 385 Yes Yes Yes Yes
402, 403, 404 Yes Yes No Yes
414, 417 Yes Yes No Yes
418 Yes Yes No No
420, 430 Yes Yes No Yes
457, 458 Yes Yes Yes No
447 Yes Yes No Yes
462, 463, 495 Yes Yes Yes Yes
Summer Range
55 Yes Yes Yes Yes
536, 546, 549 Yes Yes Yes Yes
550, 582,
584,585 Yes Yes Yes Yes
572 Yes Yes Yes Yes
567, 578, 579 Yes Yes Yes Yes
586 Yes Yes Yes Yes
Perennial grass canopy cover: All TEU groups in the summer range and winter range show
existing percent canopy cover of perennial grass species to be within the range for the desired
condition.
Number of Perennial Grass Species: All TEU groups in the summer range and winter range
show existing numbers of perennial grass species to be within the range for the desired condition.

23
Effective Ground Cover: Effective ground cover for existing conditions is the sum of litter >0.5”
in depth and vegetation basal area. Effective ground cover for desired conditions is greater than
or equal to the percent tolerable vegetation cover (Tol.) found in table three of TES for each TEU
or TEU group. Tolerance soil loss rate is the rate of soil loss that can occur while sustaining
inherent site productivity. The tolerable vegetation cover value (Tol.) listed in table three of TES
indicates the percentage of effective ground cover necessary to meet the tolerance soil loss rate.
All TEUs and TEU groups in the summer range meet the desired conditions for effective ground
cover. For the winter range, three out of nine TEUs or TEU groups meet the desired condition
for effective ground cover. For the six TEUs or TEU groups that do not meet desired condition
for effective ground cover one is within three percentage points of the desired condition (TEU
447), two are within 10 percentage points of the desired condition (TEU groups 402,403,404 and
414,417) and three are within 20 percentage points of the desired condition (TEU 350, TEU 418,
and TEU group 420,430).
It is impossible to determine why some TEU groups are not meting desired conditions for
effective ground cover based on monitoring data. However it is likely that these TEUs and TEU
groups have been impacted by historic land management (i.e. fires suppression, livestock
overstocking rates), wildlife grazing, shrub and tree encroachment and climate.
Composition of cool and warm season grasses
Data from the most currently read 10th
acre canopy cover plots was used to determine existing
species composition and the ratio of cool to warm season grasses. This data was compared to the
natural composition determined by TES.
All TEU groups in the summer range currently meet the desired conditions for the ratio of cool
to warm season grasses determined in TES. Seven out of nine TEU groups in the winter range
currently meet the ratio of cool to warm season grasses determined in TES. However the
absence in the long term monitoring plots of some species listed in TES can be attributed to the
natural percent canopy cover determined in TES. Plants listed as trace (T) or present (P) in
Table 2 of TES (where T=<0.01% canopy cover, and P=present in the area, but not recorded in
the plot) have a possibility of not being recorded in the long term monitoring plots due to limited
and sporadic occurrences within the area.
Range Trend Data
The following discussion reflects ground cover trend using data collected from the permanent
monitoring plots between the 1950s and 2009. Since monitoring plots were established prior to
the publication of TES, not all TEUs are represented by long term monitoring. While we cannot
extrapolate trend data to TEUs that do not have monitoring plots, we can determine, based on
professional opinion, that trends observed at long term monitoring plots are characteristic for all
TEUs in both the winter and summer ranges of the Windmill West allotment.

24
Summer Pastures
TEU55
Roger’s Lake (C1): Ground cover data show an increase in total basal vegetation, bare soil, and
a decrease in litter cover between 2000 and 2009. Canopy cover data show an increase in total
canopy cover for perennial grass between 2000 and 2009. Photo points taken at this location
between 1961 and 2009 for transects 1 and 3 show an increase in vegetation cover between 1961
and 1985; conditions between 1985 and 2009 were static. Transect 2 showed an increase from
1961-1985, a decrease from 1985-2000, and an increase from 2000-2009.
TEUs 536, 546, 549
Barney (C1): Ground Cover data show an increase basal vegetation cover, and a decrease in
litter cover and bare soil between 2000 and 2009. Canopy cover data show an increase in all
functional groups from 2000 to 2009. Photo points for Transect 1 show an increase in cover
from 1958 to 1975, a decrease in cover from 1975 to 2000, and no change from 2000 to 2009.
Transect 2 shows static conditions from 1958 to 1957, a decrease in cover from 1975-2000 and
no change from 2000 to 2009. Transect 3 shows an increase in cover from 1958 to 1957, a
decrease in cover from 1975 to 2000, and no change from 2000 to 2009.
Roger’s Lake (C4): Ground cover data show a decrease in basal vegetation cover and an
increase in litter cover between 2000 and 2009. Bare soil remained static between 2000 and
2009. Canopy cover trend shows an increase in perennial grass and total vegetation cover; and a
decrease in tree cover between 2000 and 2009. Photo points for transect 1 show a decrease in
cover from 1961 to 1985, and increase in cover from 1985 to 2000, and static conditions between
2000 and 2009. Transects 2 and 3 show static conditions from 1961-1985 and an increase in
cover from 1985 to 2000. Photos from 2009 for transects 2 and 3 are of poor quality and cannot
be qualitatively analyzed.
Roger’s Lake (C6): Ground cover data show that basal vegetation cover was static, bare soil
decreased and litter cover increased between 2000 and 2009. Canopy cover data show a
decrease in all functional groups between 2000 and 2009. Photo points from this location show a
static trend in cover from 1961 and 2009 for transect 1. For transects 2 and 3 cover was static
from 1961 to 1985, decreased from 1985 to 2000, and was static from 2000 to 2009.
Roger’s Lake (C10): Ground cover data show a decrease in basal vegetation cover and bare soil
and an increase in litter cover from 2000 to 2009. Canopy cover data show that perennial grass
cover was static from 2000 to 2009 while tree and total plant cover decreased. Photo points for
transect 1 show an increase in cover from 1961 to 1985 and a decrease in cover from 1985 to
2000. The photo quality from the 2009 photo is too poor to use. Transect 2 shows static
conditions from 1961 to 2000 and a decrease in cover from 2000 to 2009. Transect 3 shows
static conditions from 1961 to 20009.
TEU 550, 582, 584, 585
Roger’s Lake (C7): Ground cover data show a decrease in basal vegetation and litter cover, and
an increase in bare soil from 2000 to 2009. Canopy cover data show increase in perennial grass,

25
tree and total plant canopy cover from 2000 to 2009. Photo points for transect 1 show a decrease
in cover from 1961 to 1985, and increase from 1985 to 2000 and static condition from 2000 to
2009. Transect 2 shows static conditions from 1961 to 2000 and a decrease in cover from 2000
to 2009. Transect 3 shows static conditions from 1961 to 2009.
Roger’s Lake (C11): Ground cover data show basal vegetation cover to be static, an increase in
litter cover, and a decrease in bare soil between 1985 and 2009. Canopy cover data show an
increase in perennial grass cover and a decrease in tree and total plant cover. Photo points for all
three transects (except the 2009 photo for Transect 1), show a decrease in cover from 1961 to
1985, a further decrease in cover from 1985 to 2000, and static conditions from 2000 to 2009.
TEU 567, 578, 579
Barney (C2): Ground cover data show an increase in basal vegetation cover and a decrease in
bare soil and litter cover from 2000 to 2009. Canopy cover data show an increase in perennial
grass and total plant canopy cover, and a decrease in shrubs and tree canopy cover from 2000 to
2009. Photo points for transect 1 show an increase in cover from 1958 to 2000 and no change
from 2000 to 2009. Transect 2 shows an increase in cover from 1958 to 1975 and no change
from 1975 to 2000 (the photo quality from the 2009 photo was too poor to make any
interpretations). Transect 3 shows an increase in cover from 1958 to 1975 and a decrease in
cover from 1975 to 2000 (the photo quality from the 2009 photo was too poor to make any
interpretations).
Barney (C5): Ground cover data show that vegetation basal area, litter and bare soil have been
static since 1959. Canopy cover has increased for perennial grass, trees and total plant canopy
cover since 2000. Photo points for transect 1 show an increase in vegetation cover from 1959 to
1976, no change in vegetation cover from 1976 to 2000 and no change in cover from 2000 to
2009. Photos for transect 2 show no change in ground cover from 1959 to. Photos for transect 3
show no change in ground cover from 1959 to 1976, and an increase in vegetation basal cover
from 1976 to 2000 and no change in ground cover from 2000 to 2009.
TEU 572
Winter Cabin (C1): Ground cover data show a decrease in basal vegetation cover and an
increase in bare soil and litter cover from 2000 to 2009. Canopy cover data show an increase in
perennial grass, tree, and total plant cover and a decrease in shrub cover from 2000 to 2009.
Photo points for transect 1 show no change from 1963-1978, an increase in cover from 1978 to
2000 and no change from 2000 to 2009. Transect 2 shows a decrease in cover from 1963 to
1978, and increase from 1978 to 2000 and a decrease from 2000 to 2009. Transect 3 shows a
decrease in cover from 1963 to 1978 and no change from 1978 to 2000 (the photo quality from
the 2009 photo was too poor to make any interpretations).
TEU 586
Roger’s Lake (C3): Ground cover data show an increase in basal vegetation cover and bare soil,
and a decrease in litter cover between 2000 and 2009. Canopy cover data show an increase in
perennial grass and total vegetation canopy and a decrease in shrub and tree canopy. Photo
points for transects 1 and 2 show and increase in cover between 1961 and 1985; and static
conditions from 1985 to 2009. Transect 3 shows a static condition between 1961 and 2009.

26
Winter Pastures
TEU 381, 385
Duff Mesa (C3 – Black Mountain): Ground cover data show an increase in basal vegetation
cover and bare soil and a decrease in litter cover between 2000 and 2008. Canopy cover data
show a decrease in all functional groups from 2000 to 2008. Photo points for Transect 1 show an
increase in cover from 1958 to 1976, no change from 1976 to 2000, and a decrease in cover from
2000 to 2008.
Duff Flat (C5): Ground cover data show a decrease in basal vegetation and litter cover, and an
increase in bare soil between 1990 and 2008. Canopy cover data show a decrease in perennial
grass and total plant canopy cover, and an increase in shrub canopy cover. Photo points for
Transect 1 show no change in cover from 1963 to 1972, an increase in cover from 1972 to 1990,
no change from 1990 to 2000, and a decrease in cover from 2000 to 2008.
Dutch Kid (C4), Read annually since 2007: Ground cover data show an overall decrease in basal
vegetation cover and bare soil, and an increase in litter cover from 2007 to 2011. However data
collected annually during this time period shows a fluctuation in basal cover on a yearly basis.
Basal vegetation cover decreased from 1990 to 2011 with yearly fluctuations observed from
2007 to 2011. Bare soil decreased from 1990 to 2011 with yearly fluctuations observed from
2007-2011. Litter increased from 1990 to 2011 with yearly fluctuations observed from 2007-
2011.
Canopy cover data show that perennial grass and total plant canopy cover decreased from 2000
to 2011. However data collected annually since 2007 shows a fluctuation in canopy cover on a
yearly basis. Shrub canopy cover increased from 2000 to 2011, with yearly fluctuations
observed from 2007 to 2011.
The 2011 reading shows a large decrease in basal vegetation cover but not in canopy cover. The
basal cover values deviate from the year to year fluctuation which was typically within 10%, and
can possibly be attributed to observer error.
Photo points for Transect 1 show no change in cover from 1963 to 1972, an increase in cover
from 1972 to 1990, no change from 1990 to 2000, a decrease in cover from 2000 to 2008 and no
change in cover from 2008 to 2011.
TEU 418
Black Tank (C2-Cox Ranch): Ground cover data show a decrease in basal vegetation cover and
an increase in litter cover and bare soil between 1990 and 2008. Canopy cover data show an
increase in perennial grass and trees and a decrease in shrub and total plant between 2000 and
2008. Photo points from Transect 1 show an increase in cover from 1963-1990, no change from
1990 to 2000, and an increase in cover from 2000 to 2008. Transect 2 shows no change from
1963 to 1972, a decrease in cover from 1972 to 2000, and a decrease in cover from 2000 to 2008.
Transect 3 shows an increase in cover from 1963 to 1990, no change from 1990 to 2000, and a
decrease in cover from 2000 to 2008.

27
TEU 457, 458
Greasy East (C7): Ground cover data show a decrease in basal vegetation cover and soil and an
increase in litter cover between 2000 and 2008. Canopy cover data show an increase in
perennial grass cover and a decrease in shrub, tree and total plant cover from 2000 to 2008.
Photo points from Transect 1 show a decrease in cover from 1963 to 1972, an increase in cover
from 1972 to 1990, a decrease in cover from 1990 to 2000 and no change from 2000 to 2008.
TEU 402, 403, 404
Malpais (C3): Ground cover data show a decrease in basal vegetation and litter cover and bare
soil from 2000 to 2008. Canopy cover data show a decrease in all functional groups from 2000
to 2008. Photo points from Transect 1 show and increase in cover from 1963 to 1990, no change
from 1990 to 2000, and a decrease in cover from 2000 to 2008. Transect 2 shows an increase in
cover from 1963-2000 and a decrease in cover from 2000 to 2008. Transect 3 shows an increase
from 1963 to 1972, a decrease in cover from 1972 to 1990, an increase in cover from 1990 to
2000, and a decrease in cover from 2000 to 2008.
TEU 414, 417
Robber’s Roost (C1 – Black Tank): Ground cover data show a decrease in basal vegetation
cover and an increase in litter cover and bare ground between 2000 and 2008. Canopy cover
data show an increase in perennial grass and tree canopy cover, and a decrease in shrub and total
plant canopy cover. Photo points from Transect 1 show no change in cover from 1963 to 1972
and a decrease in cover form 1972 to 2008. Transects 2 and 3 show no change from 1963 to
1972, a decrease from 1972 to 1990, and increase from 1990 to 2000 and a decrease in cover
from 2000 to 2008.
Grindstone (C1): Ground cover data show an increase in basal vegetation and litter cover and
bare soil between 1976 and 2008. Canopy cover data show a decrease in perennial grass, tree,
and total plant canopy cover, and an increase in shrub canopy cover. Photo points from Transect
1 show no change from 1957 to 1964 and a decrease in cover from 1964 to 2008. Transects 2
and 3 show an increase in cover from 1953 to 1964, and a decrease in cover from 1964 to 2008.
TEU 447
Skeleton Bone (C6 – Duff Flat): Ground cover data show a decrease in basal vegetation cover
and bare soil and static numbers for litter cover between 1990 and 2008. Canopy cover data
show a decrease in perennial grass, tree, shrub and total plant canopy cover. Photo points from
Transect 1 show no change from 1963 to 1972, and increase in cover from 1972 to 1990 and no
change from 1990 to 2000, (there is no photo from 2008). Transect 2 shows no change from
1963 to 1972 and an increase in cover from 1972 to 2000, (there is no photo from 2008).
Transect 3 shows no change from 1963 to 1972, an increase in cover from 1972 to 2000 and a
decrease in cover from 2000 to 2008.
Summary of Range Trend
Trend data collected between the 1950s and 2009 show variations in ground cover and canopy
cover over time, these variations are further emphasized by the annual data collected between
2007 and 2011 at the Dutch Kid C4 plot. Four summer and two winter TEU groups are showing

28
an upward trend for basal vegetation cover. Four summer and seven winter TEU groups are
showing a downward trend for basal vegetation cover. Three winter TEU groups are showing
static trends for basal vegetation cover. Five summer and five winter TEU groups show an
upward trend for litter cover. Five summer and three winter TEU groups show a downward
trend for litter cover. One summer and one winter TEU group show static trends for litter cover.
Precipitation strongly influences plant yield, and “even the slightest reductions from normal
precipitation can cause severe reductions in plant yield” (Holechek et al, 1989), this combined
with changing temperatures can lead to decreased plant productivity, decreased vegetation cover
and decreased litter cover. Comparing vegetation trend data to precipitation trend data shows
that variations in cover for the plots discussed above can be partly attributed to the variable
precipitation.
Estimated Grazing Capacity for the Windmill West Allotment
Grazing capacity is a function of grazing capability, forage production, topography, allowable
use, and the level of management that may be applied. A computer spreadsheet-based analysis
used grazing capability, forage production, topography, and an appropriate allowable use to
determine the estimated grazing capacity. The following describes these factors and their
implications on the calculation of estimated grazing capacity:
1. Grazing Capability: Grazing capability classifications have been determined for the
Windmill West allotment and are described in the Grazing Capability section on pages 13
through 16.
2. Forage Production: Forage production was stratified by TEU.
a. TES units with forage production data: Forage production data collected in 2011 was
used for the forage production values in these TEUs. Forage production was
averaged for TES units with multiple forage production data collections.
b. TES units without forage production data: Forage production estimates (Forg) from
Table 3 of the Terrestrial Ecosystem Survey (TES) of the Coconino National Forest
(1995) were used for the forage production values of these TEUs. Where multiple
forage production values were provided in TES for a single TEU, or in the case of
TEU groups, the smallest forage production value was used. Forage Maximum
(ForgM) figures were not used because they are estimates based on the total annual
yield of native forage plants after elimination of non-forage species.
3. Topography: Adjustments in the grazable land area were made to account for slope. The
following factors were used for topography adjustments on the allotment:
Class 1 - 0 to 10% Slope; No reduction in estimated grazing capacity
Class 2 - 11 to 30% Slope; 30% reduction in estimated grazing capacity
Class 3 - 31 to 40% Slope; 60% reduction in estimated grazing capacity
Class 4 - >40% Slope; 100% reduction in estimated grazing capacity

29
Sources: 1) Region 3 Rangeland Analysis and Management Training Guide; June, 1997;
2.8-2.10. 2) J.L. Holechek, 1988. An approach to setting the stocking rate. Rangelands
10:10-14, Table 3.
4. Allowable Use: Allowable use was established at 35%. This value represents the mid-
point of conservative use (30-40% forage utilization) and represents the combined
utilization level of both livestock and wildlife. Allowable use and therefore grazing
capacity, were assigned only to the following:
a. Acres classified as Full Capability and less than 40% slope.
b. Acres classified as Potential Capability and less than 40% slope.
5. Only the main grazing pastures were used to determine the estimated grazing capacity.
Management pastures (used for gathering, holding, shipping, etc.) less than 200 acres in
size and waterlots were not included in the calculations.
6. Estimated grazing capacity is expressed in Animal Unit Months (AUMs). An Animal
Unit Month is defined as the amount of forage required by an animal unit (mature cow
with or without a nursing calf) for one month; approximately 800 pounds of forage per
AUM (Manske 1998).
Carrying capacity estimates are conservative because they are based on the average forage
production of perennial grasses only. Annual plant species and browse species can make up a
large part of cattle diets in a given year. Using the average forage production data based only on
perennial grass species, underestimates the total forage available for livestock use. This results in
a conservative estimate of the livestock carrying capacity for the allotment.
Estimated Grazing Capacity and relationship to Coconino National Forest Plan
Forest-wide Standards and Guidelines for the Coconino National Forest Plan (as amended)
require that livestock “Permitted use and capacity are assigned based on full capacity range only”
(page 67). The Coconino National Forest Plan (as amended) identifies three Range Capacity
Levels; Full Capacity, Potential Capacity, and No Allowable Capacity. Full Capacity is defined
as “Lands that are presently stable because effective ground cover is holding soil loss to an
acceptable level and are, therefore, suited for grazing and can support a livestock operation”
(page 260).
Determining factors in the Coconino National Forest Plan definition of Full Capacity Range are
“effective ground cover” and “holding soil loss to an acceptable level”. Effective ground cover
is the sum of the basal area of vegetation and litter greater than 0.5” in depth. An acceptable
level of soil loss is achieved when effective ground cover exceeds the tolerable ground cover
level.
Utilizing the criteria identified above for determining effective ground cover and an acceptable
level of soil loss, there are 93,559 acres of Full Capacity Range as defined by the Coconino
National Forest Plan on the Windmill West allotment. The Estimated Grazing Capacity for the
Windmill West allotment assigned capacity to 87,303 acres. The Estimated Grazing Capacity

30
for the Windmill West allotment assigned capacity to 6,256 acres less than the Coconino
National Forest Plan Full Capacity acres.
Permitted use is defined as the number of animals, period of use, and location of use specified in
the term grazing permit (FSM 2230.5). The modified Proposed Action proposes to authorize 565
head of adult cattle for a yearlong period of use on the Windmill West allotment.
565 hd. of cattle yearlong = 6,780 AUMs
Estimated grazing capacity for Windmill West = 9,395 AUMs
Est. grazing capacity is based on assigning capacity to 87,303 acres; this is 6,256 acres
less than the calculated Coconino NF Plan Full Capacity acres (93,559 acres).
Proposed permitted use (6,780 AUMs) is less than the estimated grazing capacity (9,395
AUMs).
Capacity was assigned to fewer acres than Forest Plan Full Capacity acres; permitted use is
based on the assignment of capacity; proposed permitted use is less than the estimated grazing
capacity. Therefore, permitted livestock use is proposed for fewer acres than Forest Plan Full
Capacity acres.
Summary of Estimated Grazing Capacity
Based on the factors used in this analysis, the estimated grazing capacity for the Windmill West
allotment is approximately 4,597 Animal Unit Months (AUMs) in the summer pastures;
approximately 4,673 AUMs in the winter pastures, and approximately 125 AUMs for the South
Gyberg pasture. Total estimated grazing capacity for the Windmill West allotment is 9,395
AUMs (See Appendix D; Tables 1-4). The estimated grazing capacity represents the ability of
the Full Capability lands within the Windmill West allotment to provide forage for wildlife and
livestock use. When elk use2 is estimated and accounted for, the portion of the estimated grazing
capacity that is available for livestock use is greater than the forage that would be utilized by the
maximum permitted livestock (See Appendix D; Tables 5 and 6 for assumptions and associated
calculations).
Desired Condition Allotment-wide there is an increase in the abundance of desired perennial native upland and
riparian species. Allotment-wide, try to maintain species richness, species composition and
percent canopy and ground cover in areas that meet desired conditions; try to move toward
desired conditions in areas where these conditions are not being met. This would help support a
stable and desired plant community. Watersheds and soils are improved towards or maintained in
2 Estimated elk use on the Windmill West allotment is approximately 1,450 AUMs; between 649 and 780
AUMs in the summer pastures and between 685 and 803 AUMS in the winter pastures. Estimated use
based on estimated elk population numbers provided by Arizona Department of Game and Fish.

31
satisfactory condition. Canopy cover has been reduced where canopy encroachment had been
out-competing the herbaceous understory. We are maintaining or improving water quality to the
state water quality standards.
This leads to:
Increases in the perennial herbaceous basal vegetation
Reductions of annuals and non-natives, improving nutrient cycling, forage
production, and fish and wildlife habitat.
Improved watershed condition
Riparian areas, stream reaches and springs are in Proper Functioning Condition or
are trending towards PFC.
Maintaining a viable livestock operation.
Ground Cover, Species Richness and Species Composition
Desired conditions for percent ground cover, species richness and species composition for the
portion of the Windmill West allotment that is being considered for the re-authorization of
grazing are shown in Appendix E; desired conditions are displayed by TEU or TEU group. For
TEUs or TEU groups that are currently meeting desired conditions, the long term goal is to
maintain or improve this condition. For TEUs or TEU groups that are not currently meeting
desired conditions, the long term goal is to move towards desired conditions. If implementation
of the selected alternative is not meeting or moving towards these desired conditions, adaptive
management will be used to adjust grazing management in order to achieve these desired
conditions.
Soil condition
Soil condition ratings are based on a set of three main criteria; nutrient cycling, hydrologic
function and soil stability. Ground cover and species composition are two variables that affect
nutrient cycling and hydrologic function. By meeting or moving towards the desired conditions
for these two variables we are moving towards improving soil condition. However ground cover
and species composition do not affect all criteria associated with soil condition. Therefore it is
possible to meet the desired conditions for ground cover and species composition and still not
detect improvement in soil condition.
Management Framework The Taylor Grazing Act (1934) and FLPMA provide the underlying direction for livestock
grazing on Forest Lands. FLPMA directs that Forest Service Lands, not otherwise designated
would be managed on a basis of multiple use principles and for the purpose of sustained yield.
The Windmill West allotment is scheduled for an environmental analysis of grazing use on the
Coconino National Forest as required by the Rescission Act (Burns Amendment 1995). An
analysis of Forest Plan compliance for all resources can be found in Appendix B of the
Environmental Assessment.

32
Environmental Consequences This section describes the environmental consequences to vegetation found in the uplands,
woodlands, and grasslands. This section does not include detailed information on vegetation in
riparian areas. Information specific to grazing effects on riparian vegetation can be found in the
Soil and Water Specialist Report.
The effects described in this section apply to the no action alternative, the modified proposed
action alternative, and the modified proposed action with South Gyberg pasture alternative as
described in the EA. Unless noted otherwise, effects described in this section for the various
alternatives are effects that would occur on National Forest system lands.
No Action Alternative
Direct and Indirect Effects
Under this alternative, livestock grazing would not occur and as a result, there would be no direct
or indirect effects from cattle grazing on upland vegetation. Wildlife would continue to graze on
lands within the project area, creating localized impacts and potentially creating areas of
excessive utilization.
Vegetation Height and Canopy Cover
Livestock grazing reduces plant height and canopy cover as a result of livestock consumption or
trampling; however this is only a temporary reduction because those plants will recover under
favorable climatic conditions. Under this alternative, seasonal reductions in vegetation height
and canopy cover resulting from livestock grazing would not occur. Seasonal reductions in plant
height and canopy cover would continue in localized areas as a result of wildlife use. Within
these localized areas, recovery of plant height and canopy cover is expected under favorable
climatic conditions except in areas that are continuously grazed by wildlife.
Vegetation Diversity and Density
Changes in range condition and trend, as measured by changes in vegetation density (number of
plants per unit area) and vegetation diversity (number of different plant species present in a given
area) may be observed under this alternative. The degree to which those vegetative changes
would occur, in the absence of livestock grazing are debatable. Scientific studies report a wide
range of outcomes resulting from the absence of livestock grazing. Courtois, et al (2004) found
few differences in species composition, cover, density, and production in comparing 16 long-
term livestock exclosures (65 years) with adjacent areas that had been moderately grazed.
Baxter (1977), however, reported greater species diversity and less bare ground in a comparison
between a relict area (an area that has not been impacted by human activity; including livestock
grazing), an area that has been continuously grazed, and an area that has been grazed under a
rest-rotation management strategy in North-central Arizona. Loeser, et al (2006) found that cattle
removal resulted in little increase in native plant cover and reduced plant species richness
relative to the moderate grazing control in an 8 year study in north-central Arizona.
Due to their palatability and early season availability, cool-season plant species would continue
to receive a disproportionate share of the grazing by wildlife under this alternative. This could
affect the vegetative diversity within portions of the analysis area as cool-season plants are either
allowed to recover from the effects of wildlife grazing or they are continually grazed. In the case
33
of continual grazing, the eventual result may be a reduction in cool-season species which would
reduce plant species diversity (Archer and Smeins 1991; Briske D.D. 1991; Szaro, et al 1999;
Vavra, et al 1994).
Under this alternative, range condition and trend (as measured by changes in vegetation density
and vegetation diversity) within most of the analysis area is expected to remain static or move
upward during periods of favorable climatic conditions. The exception to this would occur in
areas where over story species limit the improvement potential of understory species or in areas
that are continuously grazed by wildlife; range condition and trend in these areas would likely
remain static or continue to decline during periods of favorable climatic conditions. During
periods of unfavorable climatic conditions, range condition and trend is expected to decline at all
locations within the analysis area. Under this alternative, the ability for improvement in range
condition and trend would be most affected by climatic conditions (Sprinkle, et al, 2007).
Vegetation Production and Quality
Changes in vegetation production (amount of plant biomass above ground produced in a given
year) and vegetation quality (the nutritional value and palatability of plant biomass) of forage
species (herbaceous and woody palatable plant species available for food to herbivores) within
the analysis area are expected under this alternative. Holechek (1981) reported that forage
production and quality is maintained and enhanced by light to moderate grazing. Patton, et al
(2007) found that low to moderate levels of grazing can increase vegetative production over no
grazing, but that the level of grazing that maximizes vegetation production depends upon the
growing conditions of the current year.
Under this alternative, livestock grazing would not occur and as a result, vegetation production
and the quality of forage species would not be maintained or enhanced over a large portion of the
analysis area. Changes in vegetation production and quality of non-forage vegetation species is
expected to remain unchanged under this alternative. Wildlife would continue to graze within
the analysis area and provided the wildlife use is seasonal and transitory, vegetation production
and quality of forage species would be maintained in small, localized areas. If wildlife use
within these areas occurs continuously throughout the year, vegetation production and quality
would not be maintained as a decrease in vegetation diversity and density would likely occur.
Existing Structural Range Improvements
Operation and maintenance of existing structural range improvements is the responsibility of the
grazing permittee. Under this alternative livestock grazing not occur and there would be no
grazing permittee; as a result, operation and maintenance of existing structural range
improvements would not occur. This would result in an immediate loss of available water for
wildlife in the winter pastures since the existing pipeline/drinker system would no longer be
operated. Indirect effects due to the lack of improvement maintenance would be realized
through a long-term loss of water available for wildlife as stock tanks fill with sediment and as
the pipeline/drinker system in the winter pastures is no longer operated and degrades.
Additionally, as fences degrade due to lack of maintenance, they would likely become an
entanglement/impalement hazard for wildlife (AZGFD, 2011).

34
New Structural Range Improvements
Under this alternative, new structural range improvements would not be constructed and as a
result there would be no direct or indirect effects relating to that activity.
Mooney Trail
Under this alternative, livestock grazing would no longer occur on the Windmill West allotment
and as a result, the Mooney trail would no longer be used as a livestock drive trail. Additionally,
since there would be no livestock grazing, there would be no grazing permittee to assist with trail
maintenance.
Vegetation Treatments
Under this alternative, vegetation treatments to reduce the density and canopy cover of Pinyon
and Juniper species would not be conducted in the identified Terrestrial Ecosystem Units (TEUs)
where current canopy cover exceeds the potential canopy cover. As a result, there would be no
direct effects relating to this activity. Without the vegetation treatments, pinyon and juniper
density and canopy cover would continue to increase within these locations. Wilcox et al (1995)
reported that as juniper increases in density the understory vegetation decreases. Decreases in
understory vegetation would result in a decrease in vegetation diversity, vegetation density, and
vegetation production. Under this alternative, vegetation diversity, density, and production
would continue to decline within the locations identified for vegetation treatments.
Cumulative Effects
The focus of this analysis is on upland vegetation which receives very little influence from off-
site activities. As a result, the geographical extent of the cumulative effects analysis is confined
to the Windmill West Allotment. The timeframe selected for this analysis is 20 years; 10 years in
the past and 10 years in the future. This timeframe was selected because ground disturbing
activities that have occurred within the analysis area are expected to exhibit recovery within 10
years. The past, present, and reasonably foreseeable future activities considered in the
cumulative effects analysis for upland vegetation include: timber sales, fuels reduction projects,
prescribed burning, weed treatments, recreation, hunting, firewood gathering, OHV use, and
wildlife use.
Livestock grazing, in combination with timber sales, fuels reduction projects, prescribed burning,
dispersed recreation, firewood gathering, weed treatments, hunting, roads, OHV use, and wildlife
herbivory/browsing can cumulatively affect the density, diversity, production, and canopy cover
of understory plants. Under this alternative, there would be no direct or indirect effects from
cattle grazing on vegetation density, vegetation diversity, production, and canopy cover and as a
result, there would be no cumulative effects related to cattle grazing.
This alternative provides the least cumulative impact to upland vegetation by not authorizing
livestock grazing which would be additive to the other activities. Wildlife herbivory and
browsing would continue within the analysis area. Within small portions of the analysis area,
wildlife use would be seasonal and transitory and the density, diversity, production, and canopy
cover of upland vegetation would be maintained. Within other small portions of the analysis
area, heavy wildlife use would occur continuously throughout the year creating areas of
excessive utilization. In these areas, the density, diversity, production, and canopy cover of
upland vegetation production would likely decrease. Timber sales, fuels reduction projects, and

35
prescribed burning would continue within the analysis area and would result in localized,
temporary reductions in vegetation density and canopy cover. These effects would be temporary
and recovery would occur under favorable climatic conditions. Additionally, these activities
would improve vegetation density, vegetation diversity, and canopy cover within the project
areas by reducing the overstory canopy. The other activities identified would also continue,
creating localized impacts to upland vegetation. Changes in road management and OHV use
through the Travel Management Plan would cumulatively lessen the impact to the upland
vegetation across the Windmill West Allotment.
State Trust Land
Under this alternative, livestock grazing would not occur on NFS land within the Windmill West
allotment. However, the Windmill West allotment contains approximately 11,500 acres of State
Trust Land and under this alternative two possibilities exist for these lands:
1. Livestock grazing would continue on the subject State Trust lands.
2. Livestock grazing would cease on the subject State Trust lands.
If grazing continues on the State Trust lands, it is unknown as to what level of livestock use
would occur as those are management actions that would be determined by the Arizona State
Land Department. However, it is likely that additional fencing and water developments would
be constructed on State Trust Land to facilitate livestock grazing.
It is also likely that the loss of the ability to graze the associated NFS lands would result in a
livestock operation that is no longer viable and the State Trust lands would no longer be grazed.
Under this scenario, existing structural range improvements on State Trust Land would no longer
be operated or maintained. The lack of structural range improvement operation and maintenance
would result in a loss of water available for wildlife as stock tanks fill with sediment and as the
pipeline/drinker system in the winter pastures is no longer operated and degrades due to lack of
maintenance. Additionally, as fences degrade due to lack of maintenance, they would likely
become an entanglement/impalement hazard for wildlife.
Climate Change
Vegetation density, diversity, production and canopy cover fluctuate naturally in response to
inter-annual and longer periods of climate variability. Periods of favorable climatic conditions
result in increased vegetation density, diversity, production and canopy cover. Periods of
unfavorable climatic conditions result in decreased vegetation density, diversity, production and
canopy cover.
Climate change is predicted to result in periods of extreme climatic conditions in both
temperature and precipitation. Climate change in the North American southwest is predicted to
lead to decreased winter precipitation throughout the current century (Seager and Vecchi, 2010).
This decline in winter precipitation could lead to a decrease in vegetation dependent on winter
precipitation. Although winter precipitation is important for annuals and cool season grasses as
well as replenishment of soil moisture, rangeland productivity in the southwest is primarily
controlled by summer precipitation delivered by the North American monsoon (McCollum,
et.al., 2011). The effect of climate change on the North American Monsoon, which accounts for

36
roughly half the precipitation on the Windmill West allotment, is uncertain, however; recent
research suggests a delay in the onset of the monsoonal activity with no change in total
precipitation.
Under this alternative, there would be no direct or indirect effects from cattle grazing on
vegetation density, vegetation diversity, production, and canopy cover. As a result, there would
be no effects from this alternative that would be additive to the potential effects of climate
change.
Modified Proposed Action Alternative
Direct and Indirect Effects
Under this alternative, managed livestock grazing would occur and as a result, there would be
direct and indirect effects from cattle grazing on upland vegetation. Adaptive management and
annual implementation monitoring would be used to mitigate the direct and indirect effects of
livestock grazing, as well as the effects of climate variability. Wildlife would continue to graze
on the allotment, creating localized impacts and potentially areas of excessive utilization.
Vegetation Height and Canopy Cover
Livestock grazing effects to vegetation occur through a reduction in plant height and canopy
cover as a result of livestock consumption or trampling. These effects are only temporary
because plant height and canopy cover will recover under favorable climatic conditions. The
livestock grazing effects of reducing plant height and canopy cover are primarily managed
through the length of the grazing period (how long plants are exposed to livestock grazing),
frequency of grazing (how often plants are exposed to livestock grazing), grazing intensity (how
much of a plants growth to date is removed during the grazing period; determined at the end of
the grazing period), and forage utilization guidelines (how much of a plants annual growth is
removed; determined at the end of the growing season).
Under this alternative, the following management guidelines for grazing periods, frequency of
grazing, forage utilization, and grazing intensity by livestock and wildlife would be established:
Livestock Grazing Periods
Management guidelines of:
Winter Pastures/Summer Pastures: Length of the grazing period within the winter
pastures and/or summer pastures would be based upon climatic conditions, existing and
predicted forage production, and the operational needs of the grazing permittee. The
general guideline would be a 6 month grazing period in the winter pastures and a 6 month
grazing period in the summer pastures.
Pasture grazing period: Length of the grazing period within each pasture would be based
upon climatic conditions, existing and predicted forage production, and the need to
provide for plant regrowth following livestock grazing.
North Gyberg pasture: Livestock grazing will only occur from October 1 to January 31.

37
Frequency of Livestock Grazing
Management guidelines of:
Generally pastures would only have one grazing period during the grazing year.
Pasture re-entry: Pasture re-entry may be necessary to facilitate livestock movement on
the allotment. Pasture re-entry will only be authorized if resource conditions are
appropriate and utilization/grazing intensity guidelines would not be exceeded.
North Gyberg pasture: Livestock use will only be allowed every other year.
Grazing Intensity
Management guidelines of:
Summer range: Conservative to moderate grazing intensity (30-50%) in the late spring to early summer months when sufficient opportunity exists for plant regrowth. Conservative grazing intensity (30-40%) during the remainder of the summer grazing period when the potential for plant regrowth is limited.
Winter Range: Conservative grazing intensity (30-40%).
These grazing intensity guidelines represent the grazing intensity level for combined livestock and wildlife use.
Forage Utilization
Management guidelines of:
Allotment wide: Conservative use (30-40%)
Riparian areas: Utilization would not exceed 20% on woody vegetation
North Gyberg pasture: Combined utilization of Arizona cliffrose by livestock and
wildlife would not exceed 20% of current year’s growth for any individual.
These forage utilization guidelines represent the forage utilization level for combined
livestock and wildlife use.
In Galt, et al. (2000), a 25 percent utilization guideline is recommended for livestock, with 25
percent allocated for wildlife and natural disturbance, and the remaining 50 percent left for site
protection. Under this alternative, wildlife use is included within the proposed forage utilization
guideline of 30 and 40 percent. As a result, this alternative leaves 60 to 70 percent of the forage
production available at the end of the growing season for site protection, which exceeds the Galt,
et al. recommendation. During the growing season, the proposed grazing intensity guidelines
maintain forage on site to reproduce, grow to maturity, build necessary root mass, produce seed
heads, produce litter important for nutrient cycling, and propagate and move into new areas.
Under this alternative, reductions in herbaceous vegetation height and canopy cover resulting
from livestock grazing would occur. Reductions in herbaceous plant height and canopy cover
would also continue in localized areas as a result of wildlife use. Under favorable climatic
conditions the reduction of herbaceous vegetation height and canopy cover is temporary and
recovery of plant height and canopy cover is expected within the same growing season except in
areas that are continuously grazed by wildlife. Under favorable climatic conditions, the

38
management guidelines for grazing periods, frequency of grazing, forage utilization, and grazing
intensity are expected to:
Maintain or improve vegetative canopy cover and vegetative ground cover.
Maintain soil condition within the areas currently identified as having satisfactory soil
condition.
Improve soil condition within the areas currently identified as having impaired or
unsatisfactory soil condition except in those areas where overstory species limit the
improvement potential.
Adaptive management and annual implementation monitoring would provide the ability to
modify the management guidelines as needed to maintain vegetation height and canopy cover
during periods of unfavorable climatic conditions. During periods of unfavorable climatic
conditions the management guidelines for grazing periods, frequency of grazing, forage
utilization, and grazing intensity would be modified to accomplish the following:
Maintain, or minimize the reduction of, vegetative canopy cover and vegetative ground
cover.
Maintain, or minimize the reduction of, vegetation necessary for soil stability.
Vegetation Diversity and Density
As previously discussed, this alternative would have direct effects to upland vegetation by
reducing plant height and canopy cover. Usually these effects are only temporary because plant
height and canopy cover recover under favorable climatic conditions. If plant height and canopy
cover do not recover, either due to climate or management actions, the effects of livestock
grazing could result in a decrease in vegetation diversity and density. Annual implementation
monitoring would be used to timely identify resource issues (such as a lack of plant
height/canopy cover recovery) and adaptive management would provide the ability to modify the
management as needed to maintain or improve vegetation conditions.
Livestock grazing can have an effect in improving or decreasing plant species composition
depending on the timing of grazing. For instance, spring and early summer grazing occurs
mainly on cool season species. Once the monsoon season begins, grazing occurs mainly on warm
season species. As the weather cools in the fall, use changes back to cool season species. Under
this alternative, the grazing use period within a pasture is seasonally rotated so that forage is
grazed and rested at different times each year. By alternating the livestock use and rest periods
on cool and warm season species, plant species composition would be maintained or improved.
Additionally, adaptive management and annual implementation monitoring would provide the
necessary resource information and management options to adjust the timing, intensity,
frequency and duration of livestock grazing to ensure that vegetation condition is maintained or
improved.
Under this alternative, through effective implementation of the management guidelines, annual
implementation monitoring, and adaptive management, range condition and trend (as measured
by changes in vegetation diversity and density) is expected to remain static or move upward

39
during periods of favorable climatic conditions, except in areas where over story species limit the
improvement potential of understory species or in areas that are continuously grazed by wildlife.
During periods of unfavorable climatic conditions, range condition and trend is expected to
decline at all locations within the analysis area. The ability for improvement in range condition
and trend would be most affected by climatic conditions (Sprinkle, et al, 2007).
Vegetation Production and Quality
Vegetation production (amount of plant biomass above ground produced in a given year) and
vegetation quality (the nutritional value and palatability of plant biomass) of forage species
(herbaceous and woody palatable plant species available for food to herbivores) within the
analysis area are expected to be maintained under this alternative. Holechek (1981) reported that
forage production and quality is maintained and enhanced by light to moderate grazing. Loeser,
et al. (2004) showed evidence of increased aboveground productivity in response to defoliation
from cattle grazing. Patton, et al (2007) found that low to moderate levels of grazing can
increase vegetative production over no grazing, but that the level of grazing that maximizes
vegetation production depends upon the growing conditions of the current year.
Under this alternative, managed livestock grazing would occur and as a result, vegetation
production and vegetation quality of forage species would be maintained or enhanced over a
large portion of the analysis area. Changes in vegetation production and quality of non-forage
vegetation species is expected to remain unchanged under this alternative. Wildlife would
continue to graze within the analysis area and provided the wildlife use is seasonal and
transitory, vegetation production and quality of forage species would be maintained or enhanced
in combination with managed livestock grazing. If heavy wildlife use occurs continuously
throughout the year in combination with managed livestock grazing, vegetation production and
quality will not be maintained as a decrease in vegetation diversity and density would likely
occur. Vegetation production is expected to be average to above average during periods of
favorable climatic conditions. During periods of unfavorable climatic conditions, vegetation
production is expected to decline.
Existing Structural Range Improvements
Under this alternative, existing structural range improvements will be maintained and
operational. The operation and maintenance of existing structural range improvements would
have short-term direct effects to upland vegetation. Plant height and canopy cover would be
reduced in the immediate area due to maintenance activities; however, plant height and canopy
cover would recover with favorable climate conditions. Operating and maintaining existing
structural improvements will allow for the implementation of managed livestock grazing and
provide the necessary infrastructure to control grazing periods, frequency of grazing, grazing
intensity, and forage utilization.
Existing allotment and pasture fences will be maintained annually. Maintaining existing fences
will reduce the chance of entanglement/impalement for wildlife (AZGFD, 2011). Existing
fences may be modified or upgraded to current wildlife specifications. When existing fences
reach the end of their functional lifespan they will be reconstructed to current wildlife
specifications.

40
Existing earthen stock ponds will be maintained and water distribution systems (wells, pipelines,
water storage tanks, and troughs) will be maintained and operational. Functional livestock water
developments are necessary for managed livestock grazing but they also provide
important/critical water sources for wildlife.
New Structural Range Improvements
Under this alternative, a new pasture fence would be constructed in the northeast corner of the
Rogers Lake pasture; this will create the North Rogers Lake pasture. The construction of this
pasture fence would have short-term direct effects to upland vegetation. Plant height and canopy
cover would be reduced in the immediate area due to fence construction activities; however,
plant height and canopy cover would recover with favorable climate conditions. The proposed
pasture fence is designed to reduce livestock grazing effects to riparian/wetland vegetation and to
protect duck nesting habitat by eliminating livestock use of the Rogers Lake wetland prior to
July 15. Under this alternative, livestock use will not occur within the new North Rogers Lake
pasture before July 15 and only if wildlife utilization on riparian/wetland species is less than
40%. Due to heavy elk utilization of the Rogers Lake wetland, it is not expected to be able to
graze the North Rogers Lake pasture with livestock.
Under this alternative, a wetland exclosure fence may be constructed at Fry Lake; an adaptive
management strategy would be utilized to determine management actions at Fry Lake. Initially,
managing livestock grazing effects to riparian/wetland vegetation and protection of duck nesting
habitat would be accomplished by deferment of livestock grazing in the Fry Park East pasture
until after July 15. A wetland exclosure fence would be constructed at Fry Lake under the
following conditions:
Monitoring reveals a decline in upland vegetation diversity and density in the Fry Park
East pasture, or any of the surrounding pastures, as a result of the continued mid to late
season livestock use of the Fry Park East pasture.
Monitoring reveals a decline in riparian/wetland vegetation at Fry Lake as a result of the
continued mid to late season livestock use of the Fry Park East pasture.
The grazing permittee requests the ability to use Fry Park East pasture early in the
summer grazing period (prior to July 15) to meet the operational needs of the allotment.
Under the first two conditions, the wetland exclosure fence would be constructed so that the Fry
Park East pasture could be used by livestock prior to July 15 which would result in the ability to
provide deferment from early season livestock use in the surrounding pastures. Under the last
condition, the wetland exclosure fence would be constructed to improve the livestock
management efficiency on the allotment. Protection of riparian/wetland vegetation and duck
nesting habitat would be accomplished under all adaptive management strategies.
If necessary to construct the wetland exclosure fence at Fry Lake, the construction of the wetland
exclosure fence would have short-term direct effects to upland and wetland/riparian vegetation.
Plant height and canopy cover would be reduced in the immediate area due to fence construction
activities; however, plant height and canopy cover would recover with favorable climate
conditions. A fenced lane to the existing earthen stock pond which would allow for livestock
watering would be a required design feature of the wetland exclosure fence. Concentrating

41
livestock within this lane would result in compacted soils and reduced upland and
riparian/wetland vegetation within the lane area. The proposed wetland exclosure fence would
be designed to reduce livestock grazing effects to riparian/wetland vegetation and to protect duck
nesting habitat. Improvement of the wetland and riparian vegetation at Fry Lake would largely
be dependent on elk use and on climatic conditions.
Under this alternative, spring restoration activities would occur at Lockwood Spring. Restoration
of Lockwood Spring would include construction of an exclosure fence that would protect the
spring and the associated riparian area but would still allow livestock and wildlife access to the
existing troughs and re-plumbing the spring box to allow a portion of the water to discharge near
the spring’s natural emergence area. These activities would have short-term direct effects to
upland and riparian/wetland vegetation. Plant height and canopy cover would be reduced in the
immediate area due to fence and spring box construction activities; however, plant height and
canopy cover would recover with favorable climate conditions. The proposed fencing and re-
plumbing activities would be designed to aid in the restoration of riparian vegetation, reduce
livestock grazing effects to riparian/wetland vegetation, improve the vigor and extent of
riparian/wetland vegetation at the site, and provide water for livestock and wildlife.
Improvement of the riparian and wetland vegetation within the exclosure at Lockwood Spring
will largely be dependent on elk use and on climatic conditions.
Mooney Trail
Under this alternative, the Mooney trail would continue to be used to drive cattle between the
winter and summer pastures two days per year; one day in May/June and one day in
October/November. Use of the Mooney trail as a livestock drive trail would have short-term
direct effects to upland vegetation. Plant height and canopy cover would be reduced in the area
immediately adjacent to the trail due to livestock trailing activities; however, plant height and
canopy cover would recover with favorable climate conditions. Use of the Mooney trail as a
livestock drive trail would also result in direct effects to recreational users of the Mooney trail
two days per year. Under this alternative, the grazing permittee would continue to provide
assistance with maintenance of the trail.
Vegetation Treatments
Under this alternative, approximately 3,180 acres of potential vegetation treatment acres are
identified. Within the potential vegetation treatment areas, vegetation treatments to reduce the
density and canopy cover of Pinyon and Juniper species would be conducted on approximately
2,500 acres where the current canopy cover exceeds the potential canopy cover identified in the
Terrestrial Ecosystem Survey of the Coconino National Forest (1991). Proposed vegetation
treatments would include:
Hand thinning of pinyon and juniper trees.
Lopping and scattering the resultant slash
In areas where the pre-treatment canopy cover exceeds 40%, hand seeding with a native
seed mixture may be necessary.
Rest or seasonal deferment from livestock grazing may be necessary within treatment
areas for up to one year.

42
Vegetation treatments would have short-term direct effects to upland vegetation. Plant height
and canopy cover would be reduced in the immediate area due to treatment activities; however,
plant height and canopy cover would recover with favorable climate conditions. Vegetation
treatments would reduce the overstory canopy of pinyon and juniper trees which would increase
upland vegetation density and diversity within the treatment areas (Willcox and Davenport,
1995). The increase in upland vegetation within the treatment areas would include an increase in
forage species which would improve allotment conditions and allow for more flexibility in
grazing management. All other factors being equal, the increase in forage production would
improve livestock distribution and result in reduced grazing intensity and forage utilization
levels. The reduced grazing intensity level would provide for an increase in the pasture grazing
period which would provide the opportunity to allow for rest or seasonal deferment for other
pastures.
Closed Pastures
Under this alternative, Winter Cabin (except approximately 284 acres), North Sycamore, South
Sycamore, Loy Canyon, Secret Mountain, South Gyberg, #60, and #51 pastures would be
removed from the Windmill West allotment and closed to livestock grazing. A small portion of
Winter Cabin pasture (approx. 284 acres; located in the southeastern corner of the pasture) would
remain in the Windmill West allotment to continue to serve as a livestock driveway between the
Winter Cabin Holding pasture and the Lockwood Springs pasture. Winter Cabin, North
Sycamore, South Sycamore, Loy Canyon, Secret Mountain, #60, and #51 pastures have not been
grazed in the past 10-15 years due to difficulty with livestock management. The decision to not
graze these pastures was a joint decision between the permittee and the Forest Service. The
South Gyberg pasture has not been grazed in the past 10+ years due to the occurrence of Arizona
cliffrose (Purshia subintegra), an endangered species.
Under this alternative, livestock grazing would not occur in these pastures. Direct, indirect, and
cumulative effects would be the same as described in the No Action alternative.
Cumulative Effects
The geographical extent, timeframe, and past, present, and reasonably foreseeable future
activities are the same as described in the No Action Alternative.
Under this alternative, managed livestock grazing in combination with timber sales, fuels
reduction projects, prescribed burning, weed treatments, recreation, hunting, firewood gathering,
OHV use, and wildlife use would result in cumulative effects to plant height and canopy cover,
vegetation density and diversity, and vegetation production and quality.
Timber sales, fuels reduction projects, and prescribed burning projects within the analysis area
would result in localized, short term reductions in plant height, canopy cover, and vegetation
production due to the physical defoliation and crushing of understory vegetation related to
mechanical tree thinning activities and the consumption of above ground vegetation during
prescribed burning activities. However, these effects would be temporary and recovery would
typically occur in one growing season under favorable climatic conditions.
In the long term, timber sales, fuels reduction projects, and prescribed burning projects would
result in increases in vegetation density, vegetation diversity, plant height and canopy cover, and
43
vegetation production. Tree thinning and prescribed burning would increase vegetation density
(number of plants per unit area) because of the overall increase in the amount of sunlight that
reaches the soil surface, the reduction of competition from over story species, the reduction of
the pine needle litter layer, and the increase in nutrient cycling provided by burning. An increase
in vegetation density would result in an increase plant canopy cover and vegetation production
simply as a result of more plants occupying the site. Additionally, as more of the soil surface
area is exposed to sunlight, vegetation diversity would improve as shade intolerant vegetation
species would increase.
An increase in vegetation density and diversity would include an increase in forage production
which would allow for more flexibility in grazing management. Increased forage production
would improve livestock distribution and result in reduced grazing intensity and forage
utilization levels. The reduced grazing intensity level would provide for an increase in the
pasture grazing period which would provide the opportunity to allow for rest or seasonal
deferment for other pastures.
Weed Treatments would result in localized, short term reductions in plant height, canopy cover,
and vegetation production due to the physical defoliation and crushing of understory vegetation
related to mechanical/vehicular weed treatment activities. However, these effects would be
temporary and recovery would typically occur in one growing season under favorable climatic
conditions. In the long term, weed treatment projects would remove, or control the spread of,
noxious weed species which would result in maintaining vegetation density, vegetation diversity,
plant height and canopy cover, and vegetation production within the analysis area.
Recreation (camping, hiking, biking, etc.), hunting, and firewood gathering all result in
reductions in plant height, canopy cover, and vegetation production due to the physical
defoliation and crushing of understory vegetation primarily related to the vehicular use
associated with these activities. Except in areas that receive continuous recreational and
vehicular use, the effects to plant height, canopy cover, and vegetation production would be
temporary and recovery would typically occur in one growing season under favorable climatic
conditions. Changes in road management through the Travel Management Plan would lessen the
impact to the upland vegetation within the analysis area.
Off Highway Vehicle (OHV) use results in reductions in plant height, canopy cover, and
vegetation production due to the physical defoliation and crushing of understory vegetation.
Except in areas that receive continuous OHV use, the effects to plant height, canopy cover, and
vegetation production would be temporary and recovery would typically occur in one growing
season under favorable climatic conditions. Changes in road and OHV management through the
Travel Management Plan would lessen the impact to the upland vegetation within the analysis
area through a reduction in the number and mileage of roads open for vehicular use and the
elimination of off-road vehicle use.
Wildlife herbivory and browsing would continue within the analysis area. In areas where the
wildlife use is seasonal and transitory, the density, diversity, production, and canopy cover of
upland vegetation would be maintained or enhanced in combination with managed livestock
grazing. In areas where heavy wildlife use occurs continuously throughout the year, the density,

44
diversity, production, and canopy cover of upland vegetation production would likely decrease;
this decrease would occur regardless of the presence or absence of managed livestock grazing.
State Trust Land
Under this alternative, livestock grazing would continue on NFS land within the Windmill West
allotment and it is likely that livestock grazing would continue on the approximately 11,500
acres of State Trust lands within the Windmill West allotment. How long these lands continue to
be utilized for livestock grazing, and to what level livestock use occurs on these lands would be
management actions determined by the Arizona State Land Department. Under this alternative,
it is likely that existing structural range improvements on State Trust Land would remain
operational and would continue to be maintained.
Climate Change
Vegetation density, diversity, production and canopy cover fluctuate naturally in response to
inter-annual and longer periods of climate variability. Periods of favorable climatic conditions
result in increased vegetation density, diversity, production and canopy cover. Periods of
unfavorable climatic conditions result in decreased vegetation density, diversity, production and
canopy cover.
Climate change is predicted to result in periods of extreme climatic conditions in both
temperature and precipitation. Climate change in the North American southwest is predicted to
lead to decreased winter precipitation throughout the current century (Seager and Vecchi, 2010).
This decline in winter precipitation could lead to a decrease in vegetation dependent on winter
precipitation. Although winter precipitation is important for annuals and cool season grasses as
well as replenishment of soil moisture, rangeland productivity in the southwest is primarily
controlled by summer precipitation delivered by the North American monsoon (McCollum,
et.al., 2011). The effect of climate change on the North American Monsoon, which accounts for
roughly half the precipitation on the Windmill West allotment, is uncertain, however; recent
research suggests a delay in the onset of the monsoonal activity with no change in total
precipitation.
Under this alternative, adaptive management and annual implementation monitoring would
provide the ability to modify livestock management as needed to maintain or improve vegetation
conditions under varying climatic conditions. As a result, there would be no effects from this
alternative that would be additive to the potential effects of climate change.
Modified Proposed Action with South Gyberg Pasture Alternative
Under this alternative, livestock grazing on the Windmill West allotment would occur as
described for the Modified Proposed Action but the South Gyberg pasture would be retained and
converted to an actively grazed pasture.
Direct, indirect, and cumulative effects for this alternative are exactly the same as the effects
identified and discussed for the Modified Proposed Action. As a result, only additions, revisions,
or effects that vary from the Modified Proposed Action are described and discussed.

45
Direct and Indirect Effects
Under this alternative, the Management Guidelines described in the Vegetation Height and
Canopy Cover Section would be revised to include requirements for South Gyberg pasture.
Revisions would include:
• Livestock Grazing Periods: North and South Gyberg pastures: Livestock grazing will
only occur from October 1 to January 31.
• Frequency of Livestock Grazing: North and South Gyberg pastures: Livestock use will
only be allowed every other year.
• Forage Utilization: North and South Gyberg pastures: Combined utilization of Arizona
cliffrose (Purshia subintegra) by livestock and wildlife would not exceed 20% of current
year’s growth for any individual.
Under this alternative, several new structural range improvements would need to be constructed
to facilitate livestock management in the South Gyberg pasture. Structural range improvements
that would need to be constructed include: 1) approximately 0.75 miles of water pipeline; 2)
placement/construction of 1 to 2 water troughs; 3) construction of approximately 600 feet to
1,200 feet of water lot fencing. The construction of these structural range improvements would
have short-term direct effects to upland vegetation. Plant height and canopy cover would be
reduced in the immediate area due to construction activities; however, plant height and canopy
cover would recover with favorable climate conditions. The creation of a water lot and the
placement/construction of water troughs will concentrate livestock and result in compacted soils
and reduced upland vegetation within the immediate area.
Under this alternative, South Gyberg pasture would not be removed from the Windmill West
allotment and the area would not be closed to livestock grazing. Arizona cliffrose (Purshia
subintegra), an endangered species, occurs in the South Gyberg pasture and livestock grazing
will be authorized and managed in accordance with the Arizona Cliffrose Recovery Plan.
Cumulative Effects
Cumulative effects for this alternative are the same as the effects identified and discussed for the
Modified Proposed Action.
Comparison of Alternatives This section provides a summary of the effects of implementing each alternative. Information in
the following tables focuses on activities where different levels of effects or outputs can be
distinguished quantitatively or qualitatively among alternatives.
Table 15. Proposed Structural Improvements by Alternative
New Structural
Improvements No Action
Modified
Proposed
Action
Modified
Proposed Action
with South Gyberg
Pasture
Fence – pasture fence 0 0.50 miles 0.50 miles
Fence – wetland exclosure fence at
Fry Lake 0 1.6 miles 1.6 miles
Fence – spring exclosure at 0 450 feet 450 feet

46
Lockwood Spring
Fence – waterlot fencing in South
Gyberg Pasture 0 0 0.10 miles
Pipeline – water distribution
pipeline 0 0 0.70 miles
Trough 0 0 1
Vegetation Treatments –
Grassland Restoration/PJ Thinning 0 2,500 acres 2,500 acres
Table 16. Livestock Grazing Activities by Alternative
Grazing Statistic No Action Modified
Proposed Action
Modified
Proposed Action with
South Gyberg Pasture
Permitted Season of Use None Yearlong Yearlong
Maximum Animal Unit
Months (AUMs) Permitted 0 6,780 6,780
Maximum Permitted
Animal Units (AUs) 0 565 565
Percent change from current
permit/management
100%
reduction 0 0
Summer and Winter
Pastures Graze Period None
Summer: Approx. 6 months
Winter: Approx. 6 months
Summer: Approx. 6 months
Winter: Approx. 6 months
Change from Current
Management
100%
reduction
Add 1 month to summer
graze period. Reduce winter
graze period by 1 month.
Add 1 month to summer
graze period. Reduce winter
graze period by 1 month.
Pasture Grazing Period None Variable; based on
conditions
Variable; based on
conditions
Frequency of Pasture Use None
Pastures will generally only
be grazed once during the
grazing year.
Pastures will generally only
be grazed once during the
grazing year.
Forage Utilization Guideline None 30-40% 30-40%
Percent change from current
management
100%
reduction
No change for Summer
pastures.
20-40% reduction for Winter
pastures.
No change for Summer
pastures.
20-40% reduction for Winter
pastures.
Riparian Utilization
Guideline None 20% on Woody Vegetation 20% on Woody Vegetation
Change from Current
Management
100%
Reduction
No change from current
management
No change from current
management
Grazing Intensity Guideline
Summer Pastures
None
Late Spring/Early Summer:
40-50%
Remainder of the summer
grazing period: 30-40%
Late Spring/Early Summer:
40-50%
Remainder of the summer
grazing period: 30-40%
Change from current
management
100%
Reduction
No change from current
management
No change from current
management
Grazing Intensity Guideline
Winter Pastures None 30-40% 30-40%
Change from current
management
100%
Reduction 20-40% reduction 20-40% reduction
Utilizes Monitoring and
Adaptive Management No Yes Yes

47
Table 17. Alternative Comparison by Purpose and Need
Purpose and Need
Proposed Action Modified
Proposed
Action
Modified
Proposed Action
with South
Gyberg Pasture
Alternative meets or moves the area
towards Forest Plan objectives Yes Yes Yes
Alternative meets or moves the area
towards desired conditions Yes Yes Yes
Alternative maintains or improves
upland vegetation conditions Yes Yes Yes
Table 18. Summary of Environmental Effects
Indicator Unit of
Measure
No Action
Modified
Proposed
Action
Modified
Proposed Action
with South Gyberg
Pasture
Upland
Vegetation
Condition and
Trend
Vegetation
Diversity
and Density
Range condition and trend, as measured by changes in vegetation
diversity and density, is expected to remain static or move upward during
periods of favorable climatic conditions. Exception to this would occur
primarily in areas where overstory species limit improvement potential.
During periods of unfavorable climatic conditions, range condition and
trend is expected to decline. The ability for improvement in range
condition and trend will be most affected by climatic conditions.
Measurable differences in vegetation condition and trend between any of
the alternatives is not expected.
Vegetation
Height and
Canopy
Cover
Short term reductions
in the height and
canopy cover of
herbaceous vegetation
from livestock grazing
would not occur.
Long-term measurable
differences between
any of the alternatives
are not expected
Short term reductions in the height and canopy
cover of herbaceous vegetation from livestock
grazing will occur. The reduction in plant
height and cover, as a result of grazing, does
recover with favorable climatic conditions.
Livestock grazing effects of reducing plant
height and canopy cover will be managed
through controlling the length of the grazing
period, the frequency of grazing, the grazing
intensity, and forage utilization guidelines. Measurable differences between the two action
alternatives are not expected.
Vegetation
Production
and Quality
of Forage
Species
Vegetation production
and quality of forage
species is not expected
to be maintained or
enhanced over a large
portion of the analysis
area.
Vegetation production and quality of forage
species is expected to be maintained and
enhanced by light to moderate grazing.
Measurable differences between the two action
alternatives are not expected.
48
Preparation of Report This report was prepared considering the Best Available Science and locally gathered data. Field
reviews were conducted to: assess forage production and vegetation condition, assess the
condition of existing structural range improvements, evaluate the need for additional structural
range improvements, and to observe livestock use that occurred within the analysis area of the
Windmill West Allotment. Parker 3-Step clusters (established between 1952 and 1964) were
read in 2000 and converted to Pace Frequency and 1/10 acre ocular macro plot cover methods.
These plots were read again 2008 and 2009 and that data was used for condition and tread
assessments for this report. Forage production data and additional vegetation condition data was
also collected in 2011-2013 for use in this report.
A thorough review was also conducted of the historical records and data for the allotment (on file
at the Flagstaff Ranger District). This review included information relating to past grazing
management, historical livestock numbers, past range condition and trend data, past production
and utilization data, and precipitation records. All of this information and data was used in the
preparation of this report.
Education and Professional Experience
My experience includes a Bachelor’s degree in Rangeland Management (Arizona State
University, 1984) and 29 years of experience as a Range Conservationist/Rangeland
Management Specialist (27 years in Northern Arizona). From 1984 to 2002, I was a Range
Conservationist with the Arizona State Land Department; the last 17 years for the Flagstaff Field
Office/Little Colorado Resource Area. From 2002 to 2006, I was a Rangeland Management
Specialist with the US Forest Service for the Williams and Tusayan Ranger Districts of the
Kaibab National Forest. From 2006 to 2007, I was the Range Staff/Rangeland Management
Specialist for the Red Rock and Mogollon Rim Ranger Districts of the Coconino National
Forest. Since October, 2007 I have been the Range Staff/Rangeland Management Specialist for
the Flagstaff Ranger District of the Coconino National Forest.

49
LITERATURE CITED ____________________________
Archer, S. and F.E. Smeins. 1991. Ecosystem-Level Processes. P. 109-134. In: Grazing
Management: An Ecological Perspective. R.K. Heitschmidt and J.W. Stuth (eds.),
Timber Press, Portland, OR.
Archer, S. 1994. Woody plant encroachment into southwestern grasslands and savannas: rates,
patterns and proximate causes. Pages 13–68 in M. Vavra, W. Laycock, and R. Pieper,
editors. Ecological implications of livestock herbivory in the West. Society for Range
Management, Denver, Colorado, USA.
AZGFD. 2011. Wildlife Compatible Fencing. Arizona Game and Fish Department, Phoenix, AZ. 34
pp.
Arnold, J. F. 1950. Changes in ponderosa pine bunchgrass ranges in northern Arizona resulting
from pine regeneration and grazing. Journal of Forestry 48: 118-26.
Baxter, C. 1977. A comparison between grazed and ungrazed juniper woodland. In: Aldon, E. F.,
and T. J. Loring, technical coordinators. Ecology, uses and management of pinyon-
juniper woodlands. USDA Forest Service, General Technical Report RM-39, pp. 25-27.
Baker, Robert D.; Maxwell, R.S.; Treat, V.H.; Dethloff, H.C. 1988. Timeless heritage: a history
of the Forest Service in the Southwest. FS–409. Washington, DC: U.S. Department of
Agriculture, Forest Service. 208 p
Briske D.D. 1991. Developmental Morphology and Physiology of Grasses. P. 85-108. In:
Grazing Management: An Ecological Perspective. R.K. Heitschmidt and J.W. Stuth
(eds.), Timber Press, Portland, OR.
Cooper, C.F., 1960. Changes in Vegetation, Structure, and Growth of Southwestern Pine Forests
since White Settlement. Ecol. Monog. 30(2): pp. 129-164
Cooperative Extension Service, U.S. Department of Agriculture Forest Service, Natural
Resource Conservation Service, Grazing Land Technology Institute, U.S. Department of
the Interior, Bureau of Land Management. 1996. Utilization Studies and Residual
Measurements: Interagency Technical Reference.
Coulloudon, B., K. Eshelman, J. Gianola, N. Habich, L. Hughes, C. Johnson, M. Pellant, P.
Podborny, A. Rasmussen, B. Robles, P. Shaver, J. Spehar, and J. Willoughby. 1999.
Sampling Vegetation Attributes: Interagency Technical Reference. Cooperative
Extension Service, U.S. Department of Agriculture Forest Service, Natural Resource
Conservation Service, Grazing Land Technology Institute, U.S. Department of the
Interior, Bureau of Land Management.
Courtois, D.R., B.L. Perryman, H.S. Hussein. 2004. Vegetation change after 65 years of grazing
and grazing exclusion. Journal of Range Management. 57: 574-582.

50
Crimmins, Michael A., George Zaimes, Niina Haas, Christopher K. Jones, Gregg Garfin, and
Theresa M. Crimmins. 2007. Changes on the Range: Exploring Climate Change with
Range Managers. Journal of Natural Resoures and Life Science Education. Vol. 36, 2007,
pp 76-86
Finch, Deborah M., Editor. 2004. Assessment of grassland ecosystem conditions in the
Southwestern United States. Volume 1. Gen. Tech. Rep. RMRS-GTR-135-vol. 1. Fort
Collins, CO: U.S. Department of Agriculture, Forest Service, Rocky Mountain Research
Station. 167 p.
Galt, D., F. Molinar, J. Navarro, J. Joseph, and J. Holecheck. 2000. Grazing Capacity and
Stocking Rate. Rangelands. 22(6):6-11.
Holechek, Jerry L. 1981. Livestock grazing impacts on public lands: A viewpoint. Journal of
Range Management. 34(3); 251-254.
Holechek, Jerry L. 1988. An approach to setting the stocking rate. Rangelands. 10:10-14, Table
3.
Holecheck, Jerry L., R.D. Peiper and C. H. Herbel. 1989. Range Management. Prentice-Hall,
Inc. Englewood Cliff, N.J. 501p.
Jameson, D.E. 1987. Climax or Alternative Steady States in Woodland Ecology. In:
Proceedings – Pinyon-Juniper Conference. USDA Forest Service General Technical
Report INT-215:9-13. Intermountain Research Station. Ogden,UT.
Khumalo, G., Holechek, J., Thomas, M., and Molinar, F. 2007. Long-term vegetation
productivity and trend under two stocking levels on Chihuahuan Desert Rangeland.
Rangeland Ecology and Management, 60:165-171.
Loeser, Matt R., T. D. Sisk, and T. E. Crews. 2004. Defoliation increased above-ground
productivity in a semi-arid grassland. Journal of Range Management, 57(5):442-447. Loeser, Matt. R., T. D. Sisk and T. E. Crews. 2003a. Evidence of increased above-ground
productivity in a semi-arid grassland in response to defoliation. Submitted to the Journal of Range Management. October, 2003.
Loeser, Matt R., T. D. Sisk and T. E. Crews. 2003b. Five years of cattle removal has little effects
on forb abundance or standing herbaceous matter in a semi-arid grassland. Submitted to
the Journal of Range Management. October, 2003.
Loeser, Matthew R. R., Thomas D. Sisk, and Timothy E. Crews. 2006. Impact of Grazing
Intensity during Drought in an Arizona Grassland. Conservation Biology. 21(1):87-97.

51
Martin, S.C., and D.R. Cable. 1974. Managing semidesert grassshrub ranges: Vegetation
responses to precipitation, grazing, soil texture, and mesquite control. U.S. Dept. Agr.
Tech. Bull. 1480.
McCollum, D.W., Tanaka, J.A., Morgan, J.A., J.E. Mitchell, K.A. Mackzo, L. Hidinger, W.E.
Fox, C.S. Duke. 2011. Climate Change Effects on Rangelands: Affirming the Need for
Monitoring. Unpublished report available at http://www.fs.fed.us/rm/value/docs/climate_
change_effects_rangelands.pdf. 27 p.
Moore, M.M., Deiter, D.A. 1992. Stand Density Index as a predictor of forage production in
Northern Arizona pine forests. Journal of Range Management. 45: 267-271.
Moore, M. M., D. W. Huffman, P. Z. Fule´, W. W. Covington, and J. E. Crouse. 2004.
Comparison of historical and contemporary forest structure and composition on
permanent plots in southwestern ponderosa pine forests. Forest Science 50:162–176.
Manske, Llewellyn. 1998. Animal Unit Equivalent for Beef Cattle based on Metabolic Weight.
North Dakota State University, Dickinson Research Extension Center. 1998.
Patton, Bob. D., Xuejun Dong, Paul E. Nyren, and Anne Nyren. 2007. Effects of Grazing
Intensity, Precipitation, and Temperature on Forage Production. Rangeland Ecology &
Management. 60(6):656-665.
Pearson, Henry A., and D. A. Jameson. 1967. Relationship between timber and cattle production
on ponderosa pine range: The Wild Bill Range. 10 p. Rocky Mt. For. and Range Exp.
Stn., Fort Collins, Colo.
Ruyle, George (ed.). 1997. Some Methods for Monitoring Rangelands and Other Natural Area
Vegetation. University of Arizona, College of Agriculture, Cooperative Extension Report
9043.
Seager, R., Vecchi, G.A., 2010. Greenhouse warming and the 21st century hydroclimate of
southwestern North America. Proceedings of the National Academy of Sciences of the
United States of America 107, 21277e21282.
Sprinkle, Jim, Mick Holder, Chas Erickson, Al Medina, Dan Robinett, George Ruyle, Jim
Maynard, Sabrina Tuttle, John Hays, Jr., Walt Meyer, Scott Stratton, Alix Rogstad, Kevin
Eldredge, Joe Harris, Larry Howery, and Wesley Srpinkle. 2007. Dutchwoman Butte
Revisited; Examining paradigms for livestock grazing exclusion. Rangelands. 29 (6):21-
34.
Szaro, R.C., N.C. Johnson, W.T. Sexton, and A.J. Malke (Ed.). 1999. Ecological Stewardship –
A Common Reference for Ecosystem Management. Volume II. Elsevier Science Ltd.
Kidlington, Oxford OX5 1GB, UK.

52
Tausch, R.J. and N.E. West. 1994. Plant Species Composition Patterns with Differences in Tree
Dominance on a Southwestern Utah Pinion-Juniper Site. In: Desired Future Conditions
for Pinion-Juniper Ecosystems. USDA Forest Service General Technical Report RM-258:
16-23. Rocky Mountain Forest and Range Experiment Station. Fort Collins, CO.
Vavra, M., W.A. Laycock, and R. D. Pieper. 1994. Ecological Implications of Livestock
Herbivory in the West. Society for Range Management. Denver, CO.
Wilcox, Bradford P. David W. Davenport. 1995. Juniper Encroachment: Potential Impacts to
Soil Erosion and Morphology. Interior Columbia Basin Ecosystem Management Project.
USDA Forest Service. Forest Service Manual 2200: Range Management. USDA Forest Service. Forest Service Handbook 2200.13: Grazing Permit Administration
Handbook. USDA, Forest Service Handbook 2209.13, Chapter 90 (Grazing Permit Administration;
Rangeland Management Decision making). USDA Forest Service. 1987a. Coconino National Forest Land Management Plan, and all
subsequent amendments. USDA Forest Service. 1995. Terrestrial Ecosystems Survey of the Coconino National Forest,
Region 3. 405 pp. USDA Forest Service Records. (Various Dates). Red Rock Ranger Station, Coconino National
Forest. United States Department of Agriculture.
USDA Forest Service. 1997. Rangeland Analysis and Training Guide, Southwestern Region 3.

53
Appendix A: Monitoring Requirements
Both qualitative and quantitative monitoring methods would be used in accordance with the
Interagency Technical References, Region 3 Rangeland Analysis and Management Training
Guide, and the Region 3 Allotment Analysis Handbook. Monitoring frequency varies by each
activity and would be accomplished collaboratively by Forest Service personnel, permittee, and
cooperating agencies.
Implementation Monitoring Implementation monitoring would be conducted on an annual basis and includes: permit
compliance, livestock actual use data, grazing intensity, utilization, assessments of forage
production and ground cover, precipitation, and allotment inspections.
Permit Compliance: Throughout each grazing season, Forest Service personnel would monitor
activities on the allotment to ensure compliance with Permit terms and conditions, the Allotment
Management Plan, and the Annual Operating Instructions.
Livestock Actual Use: Permittee would keep accurate records regarding actual livestock
numbers and pasture use dates on the form supplied as part of the Annual Operating Instructions.
This form would be submitted to the Forest Service at the end of the grazing season.
Grazing Intensity: Grazing intensity monitoring would occur within each of the main grazing
pastures during, or immediately after, the period when livestock are grazing the pasture. Grazing
intensity is defined as the amount of herbage removed through grazing or trampling during the
grazing period. Grazing intensity would be used by the Forest Service and the permittee to
control actual pasture moves. Livestock may need to be moved out of a pasture sooner if the
grazing intensity guideline is reached before the planned move date. Likewise, livestock may
stay longer in a pasture if grazing intensity is below the established guideline when the planned
move date arrives.
Grazing intensity measurements would be taken in key areas which reflect grazing effects within
an entire pasture. A minimum of one key area would be established within each main grazing
pasture, at existing long-term monitoring sites if possible, to represent the overall grazing
intensity within the pasture.
Utilization: Utilization monitoring would occur at the end of the growing season within each of
the main grazing pastures. Utilization is defined as the proportion or degree of current year’s
forage production that is consumed or destroyed by animals (including insects). It is a
comparison of the amount of herbage left compared with the amount of herbage produced during
the year. Utilization is measured at the end of the growing season when the total annual
production can be accounted for and the effects of grazing in the whole management unit can be
assessed.
Utilization measurements would be taken in key areas which reflect grazing effects within an
entire pasture. A minimum of one key area would be established within each main grazing
pasture, at existing long-term monitoring sites if possible, to represent overall pasture utilization.

54
Utilization guidelines are not intended as inflexible limits. Utilization measurements can indicate
the need for management changes prior to this need being identified through long term
monitoring. Utilization data would not be used alone, but would be used along with climate and
condition/trend data, to determine stocking levels and pasture rotations for future years.
If monitoring shows that the utilization guideline was exceeded in a pasture, the grazing schedule
and/or cattle numbers would be adjusted for the following year. If utilization is exceeded after
these adjustments are made, then changes would be made to the grazing management system.
Utilization on Arizona Cliffrose: Monitoring of livestock and wildlife utilization on the current
year’s growth of Arizona Cliffrose would occur before, during, and after periods of livestock
use. Three permanent utilization transects have been established in the North Gyberg pasture in
areas that contain Arizona Cliffrose and are accessible to livestock. Utilization of current year’s
growth on Arizona Cliffrose will be determined using the Extensive Browse Method as
described in Interagency Technical Reference, Utilization Studies and Residual Measurements
(1996).
Forage Production and Ground Cover: Forage production assessments would be made to
determine stocking levels for the grazing season and would also be used during the grazing
season to determine if adjustments in the stocking level should be made. Qualitative assessments
of ground cover would also be made and used as an indicator of condition and trend; observed
changes may indicate the need to conduct effectiveness monitoring (condition and trend) prior to
the scheduled interval.
Precipitation: Precipitation is currently recorded at 4 sites that approximate the precipitation for
the allotment. Additional precipitation gauges may be placed on the allotment for more localized
information.
Allotment Inspection: A written summary would be completed each year by Forest Service
personnel to document the overall history of that year’s grazing. This document would include a
monitoring summary, livestock actual use, weather history, and a discussion of the year’s
accomplishments and problems. Information from this report would be used in preparing the
following year’s grazing plan.
Effectiveness Monitoring
Effectiveness monitoring would be used to evaluate the success of management in achieving the
desired objectives. Effectiveness monitoring would occur within key areas on permanent
transects at an interval of 10 years or less. Effectiveness monitoring may also be conducted if
data and observations from implementation monitoring (annual monitoring) indicate a need.
Effectiveness monitoring would include forage production and vegetation condition and trend.
Forage Production: Forage production surveys would be conducted using the best available
methods at that time. Forage production data would be used as a tool to manage this allotment,
but would not be the sole measurement to establish carrying capacity. The most recent forage
production survey was completed in 2006. The next survey is scheduled to occur after 2015.

55
Condition and Trend: Twenty seven Parker Three-Step clusters were established within the
analysis area between 1952 and 1964; 11 on the winter use pastures and 16 on the summer use
pastures. These transects are one of the best historic records of range condition and trend. The
photo points and vegetative ground cover data show how the site has changed over time. Twenty
of these historic monitoring locations were converted to use the Pace Frequency method and one-
tenth acre canopy cover plots in 2000 (seven historic locations have not been relocated). The
change in monitoring methods was necessary to obtain ground cover and vegetation data that
correlate with data presented in the Terrestrial Ecosystem Survey of the Coconino National
Forest (1995).
Frequency and ground cover data would be collected using the widely accepted plant frequency
method (University of Arizona, Extension Report 9043, 1997). These plots monitor trends in
plant species abundance, plant species distribution and ground cover. This would provide
information on plant composition and additional information on regeneration.
Ocular plant canopy cover 0.10-acre plots would be used to compare existing conditions with
potential and desired vegetative community conditions. Over time, these plots would document
canopy cover changes.
The most recent data collection from these monitoring locations was completed in 2008 and
2009. These monitoring locations would be read at least every 10 years by Forest Service
personnel.

56
Appendix B: Precipitation Trends
Blue line represents precipitation trend; Red line represents average precipitation/year
Figure 1: Williams, AZ; 20 Year Precipitation Trend; 20 year average = 20.36 inches/year
Figure 2: Sedona Ranger Station; 18 Year Precipitation Trend; 18 year average = 17.38
inches/year
0
5
10
15
20
25
30
35
PP
T (i
n)
Year
Williams, AZ Precipitation Gauge #029359
0
5
10
15
20
25
30
PP
T (i
n)
Year
Sedona Ranger Station Precipitation Gauge #027708

57
Figure 3: Woody Mountain; 19 Year Precipitation Trend; 19 year average = 14.45 inches/year
Figure 4: Red Hill; 20 Year Precipitation Trend; 20 year average = 16.93 inches/year
0
5
10
15
20
25
30
35
PP
T (i
n)
Year
Woody Mountain Precipitation Gauge #110
0
5
10
15
20
25
30
35
40
19
93
19
94
19
95
19
96
19
97
19
98
19
99
20
00
20
01
20
02
20
03
20
04
20
05
20
06
20
07
20
08
20
09
20
10
20
11
20
12
PP
T (i
n)
Year
Red Hill Precipitation Gauge #120

58
Figure 5: Dry Creek Levee; 11 Year Precipitation Trend; 11 year average = 12.03 inches/year
Figure 6: Cottonwood; 8 Year Precipitation Trend (data missing for 2003 & 2004); 8 year
average = 10.15 inches/year
0
5
10
15
20
2002 2003 2004 2005 2006 2007 2008 2009 2010 2011 2012
PP
T (i
n)
Year
Dry Creek Levee Precipitation Gauge #175
0
2
4
6
8
10
12
14
16
18
20
2001 2002 2003 2004 2005 2006 2007 2008 2009 2010 2011
PP
T (i
n)
Year
Cottonwood Precipitation Gauge #430

59
Appendix C: Field Data for Forage Production
Forage Production
Forage production data was collected at 51 locations in October and November, 2011 (Table 1).
Average forage production by TES unit or TES grouping is shown in Table 2.
Table 1. Windmill West Forage Production Data
Pasture TES
Unit
Date Data
Collected
Forage
Production
(pounds/acre)
North Gyberg 280 11/2/2011 111
Duff Flat 350 11/2/2011 819
Duff Flat 350 11/2/2011 499
Duff Flat 381 11/2/2011 314
Duff Flat 381 11/2/2011 772
Dutch Kid 381 11/2/2011 495
North Gyberg 381 11/2/2011 277
North Gyberg 381 11/2/2011 128
North Gyberg 381 11/2/2011 227
South Gyberg 381 11/2/2011 160
Duff Flat 385 11/2/2011 651
Duff Flat 385 11/2/2011 617
Duff Flat 385 11/2/2011 298
Black Tank 403 11/2/2011 57
Dutch Kid 403 11/2/2011 360
Greasy 403 11/2/2011 153
Greasy West 403 11/1/2011 113
Wheatfield 403 11/1/2011 101
Wheatfield 403 11/2/2011 389
Black Tank 414 10/31/2011 30
Wheatfield 414 11/1/2011 185
Wheatfield 414 11/1/2011 115
Greasy West 416 10/31/2011 187
Black Tank 417 10/31/2011 80
Greasy 417 11/2/2011 146
Black Tank 418 10/31/2011 48

60
Black Tank 418 10/31/2011 136
Black Tank 418 10/31/2011 140
Black Tank 418 11/1/2011 56
Black Tank 418 11/1/2011 61
Black Tank 418 11/2/2011 68
Greasy 420 11/2/2011 486
Malpais 420 11/2/2011 144
Malpais 420 11/2/2011 132
Malpais 420 11/2/2011 70
Duff Flat 447 11/2/2011 234
Duff Flat 447 11/2/2011 807
Dutch Kid 447 11/2/2011 354
Wheatfield 447 11/2/2011 465
Dutch Kid 448 11/2/2011 252
Dutch Kid 448 11/2/2011 390
Dutch Kid 448 11/2/2011 64
Dutch Kid 448 11/2/2011 585
Black Tank 457 10/31/2011 285
Greasy 457 11/2/2011 92
Greasy 457 11/2/2011 106
Greasy 457 11/2/2011 82
Black Tank 458 10/31/2011 103
Black Tank 463 10/31/2011 98
Black Tank 463 10/31/2011 82
Black Tank 463 10/31/2011 156
Table 2. Avg. Forage Production by TES Unit or TES
Grouping
TES
Unit/Group
Avg. Forage
Production
# of Data
Locations
280 111 1
350 659 2
381, 385 394 10
402, 403, 404 196 6
414, 417 111 5
416, 457, 458 143 6

61
418 85 6
420, 430 208 4
447, 448 394 8
462, 463, 495 112 3
Total # of Data Locations 51

62
Appendix D Table 1: Codes and Abbreviations Used in Capacity Calculation Tables
Column Heading Abbreviation Abbreviated term Additional Information
Soil Condition
Sat.(green) Satisfactory See Glossary
Imp. (blue) Impaired See Glossary
UnSat.
(pink)
Unsatisfactory See Glossary
Sat./Unstable
(yellow)
Satisfactory but
Inherently
Unstable
See Glossary
Slope Class
1 0-10% slope No reduction in estimated
grazing capacity
2 11-30% slope 30% reduction in estimated
grazing capacity
3 31-40% slope 60% reduction in estimated
grazing capacity
4 Greater than
40% slope
100% reduction in estimated
grazing capacity
NFS acres NFS National Forest
System
Acres of National Forest
Systems lands within the
pasture.
Range
Capability
Class
NC No Capability See Glossary under
Capability
PC Potential
Capability
See Glossary under
Capability
FC Full Capability See Glossary under
Capability
FP and FP
Source
FP Forage
Production
See Glossary
FD Field Data Field data collected in 2011
TES Terrestrial
Ecosystem
System
1991 data source, See
Glossary for details
Grazing
Capacity in
AUMs
AUM Animal Unit
Month
See Glossary
Calculations used for determining the Animal Unit Months within estimated capacity tables:
Acres x FP x Slope Reduction Factor x Allowable Use ÷ 800 lbs. of forage/AUM = AUMs

63
Table 2: Estimated Livestock Grazing Capacity based on Full Capability – Summer Pastures in the Windmill West Allotment
Summer Pasture TES Unit
Soil Condition
Slope Class
NFS Acres
Range Capability
Class FP
FP Source
Slope Reduction
Factor
Allowable Utilization
Grazing Capacity in AUMs
Roger's Lake North 50 UnSat. 1 87 PC 2,850 TES 1 0 0.0
Roger's Lake North 50 UnSat. 2 0 PC 2,850 TES 0.7 0 0.0
Roger's Lake North 582 Sat. 1 51 FC 250 TES 1 0.35 5.6
Roger's Lake North 582 Sat. 2 52 FC 250 TES 0.7 0.35 4.0
Roger's Lake North 582 Sat. 3 1 FC 250 TES 0.4 0.35 0.0
Roger's Lake North 582 Sat. 4 0 NC 250 TES 0 0 0.0
Roger's Lake North 585 Sat. 1 2 FC 225 TES 1 0.35 0.2
Roger's Lake North 585 Sat. 2 0 FC 225 TES 0.7 0.35 0.0
Roger's Lake North 595 Sat. 1 44 FC 2,600 TES 1 0.35 50.1
Roger's Lake North 595 Sat. 2 1 FC 2,600 TES 0.7 0.35 0.8
Roger's Lake North NFS Acres 238 Roger's Lake North Estimated Grazing Capacity 61
Roger's Lake 586 Sat. 1 4 FC 250 TES 1 0.35 0.4
Roger's Lake 611 Sat. 1 0 FC 400 TES 1 0.35 0.0
Roger's Lake 585 Sat. 1 571 FC 225 TES 1 0.35 56.2
Roger's Lake 585 Sat. 2 72 FC 225 TES 0.7 0.35 5.0
Roger's Lake 55 Imp. 1 167 PC 2,000 TES 1 0.35 146.1
Roger's Lake 55 Imp. 2 0 PC 2,000 TES 0.7 0.35 0.0
Roger's Lake 582 Sat. 1 766 FC 250 TES 1 0.35 83.8
Roger's Lake 582 Sat. 2 34 FC 250 TES 0.7 0.35 2.6
Roger's Lake 582 Sat. 3 0 FC 250 TES 0.4 0.35 0.0
Roger's Lake 582 Sat. 4 0 NC 250 TES 0 0 0.0
Roger's Lake 586 Sat. 1 317 FC 250 TES 1 0.35 34.7
Roger's Lake 586 Sat. 2 99 FC 250 TES 0.7 0.35 7.6
Roger's Lake 586 Sat. 3 2 FC 250 TES 0.4 0.35 0.1
Roger's Lake 586 Sat. 4 1 NC 250 TES 0 0 0.0

64
Summer Pasture TES Unit
Soil Condition
Slope Class
NFS Acres
Range Capability
Class FP
FP Source
Slope Reduction
Factor
Allowable Utilization
Grazing Capacity in AUMs
Roger's Lake 536 Sat. 1 77 FC 300 TES 1 0.35 10.1
Roger's Lake 536 Sat. 2 29 FC 300 TES 0.7 0.35 2.7
Roger's Lake 536 Sat. 3 1 FC 300 TES 0.4 0.35 0.1
Roger's Lake 536 Sat. 4 0 NC 300 TES 0 0 0.0
Roger's Lake 584 Sat. 1 45 FC 275 TES 1 0.35 5.4
Roger's Lake 584 Sat. 2 106 FC 275 TES 0.7 0.35 8.9
Roger's Lake 584 Sat. 3 3 FC 275 TES 0.4 0.35 0.1
Roger's Lake 584 Sat. 4 0 NC 275 TES 0 0 0.0
Roger's Lake 585 Sat. 1 354 FC 225 TES 1 0.35 34.8
Roger's Lake 585 Sat. 2 31 FC 225 TES 0.7 0.35 2.1
Roger's Lake 55 Imp. 1 77 PC 2,000 TES 1 0.35 67.4
Roger's Lake 555 Sat. 1 4 NC 50 TES 1 0 0.0
Roger's Lake 555 Sat. 2 35 NC 50 TES 0.7 0 0.0
Roger's Lake 555 Sat. 3 25 NC 50 TES 0.4 0 0.0
Roger's Lake 555 Sat. 4 26 NC 50 TES 0 0 0.0
Roger's Lake 582 Sat. 1 146 FC 250 TES 1 0.35 16.0
Roger's Lake 582 Sat. 2 15 FC 250 TES 0.7 0.35 1.1
Roger's Lake 586 Sat. 1 77 FC 250 TES 1 0.35 8.4
Roger's Lake 586 Sat. 2 3 FC 250 TES 0.7 0.35 0.2
Roger's Lake 586 Sat. 3 0 FC 250 TES 0.4 0.35 0.0
Roger's Lake 584 Sat. 1 1 FC 275 TES 1 0.35 0.1
Roger's Lake 584 Sat. 2 5 FC 275 TES 0.7 0.35 0.4
Roger's Lake 584 Sat. 3 1 FC 275 TES 0.4 0.35 0.0
Roger's Lake 584 Sat. 4 0 NC 275 TES 0 0 0.0
Roger's Lake 585 Sat. 1 116 FC 225 TES 1 0.35 11.4
Roger's Lake 585 Sat. 2 11 FC 225 TES 0.7 0.35 0.8

65
Summer Pasture TES Unit
Soil Condition
Slope Class
NFS Acres
Range Capability
Class FP
FP Source
Slope Reduction
Factor
Allowable Utilization
Grazing Capacity in AUMs
Roger's Lake 585 Sat. 3 0 FC 225 TES 0.4 0.35 0.0
Roger's Lake 55 Imp. 1 3 PC 2,000 TES 1 0.35 2.6
Roger's Lake 582 Sat. 1 394 FC 250 TES 1 0.35 43.1
Roger's Lake 582 Sat. 2 24 FC 250 TES 0.7 0.35 1.8
Roger's Lake 582 Sat. 3 0 FC 250 TES 0.4 0.35 0.0
Roger's Lake 586 Sat. 1 26 FC 250 TES 1 0.35 2.8
Roger's Lake 586 Sat. 2 13 FC 250 TES 0.7 0.35 1.0
Roger's Lake 536 Sat. 1 0 FC 300 TES 1 0.35 0.0
Roger's Lake 536 Sat. 2 0 FC 300 TES 0.7 0.35 0.0
Roger's Lake 584 Sat. 1 29 FC 275 TES 1 0.35 3.5
Roger's Lake 584 Sat. 2 85 FC 275 TES 0.7 0.35 7.2
Roger's Lake 584 Sat. 3 21 FC 275 TES 0.4 0.35 1.0
Roger's Lake 584 Sat. 4 17 NC 275 TES 0 0 0.0
Roger's Lake 582 Sat. 1 10 FC 250 TES 1 0.35 1.1
Roger's Lake 582 Sat. 2 1 FC 250 TES 0.7 0.35 0.1
Roger's Lake 536 Sat. 1 0 FC 300 TES 1 0.35 0.0
Roger's Lake 536 Sat. 2 0 FC 300 TES 0.7 0.35 0.0
Roger's Lake 584 Sat. 1 0 FC 275 TES 1 0.35 0.0
Roger's Lake 584 Sat. 2 0 FC 275 TES 0.7 0.35 0.0
Roger's Lake 585 Sat. 1 0 FC 225 TES 1 0.35 0.0
Roger's Lake 585 Sat. 2 0 FC 225 TES 0.7 0.35 0.0
Roger's Lake NFS Acres 3,844 Roger's Lake Estimated Grazing Capacity 571
Metz 55 Imp. 1 0 PC 2,000 TES 1 0.35 0.0
Metz 582 Sat. 1 0 FC 250 TES 1 0.35 0.0
Metz 582 Sat. 2 0 FC 250 TES 0.7 0.35 0.0
Metz 586 Sat. 1 32 FC 250 TES 1 0.35 3.5
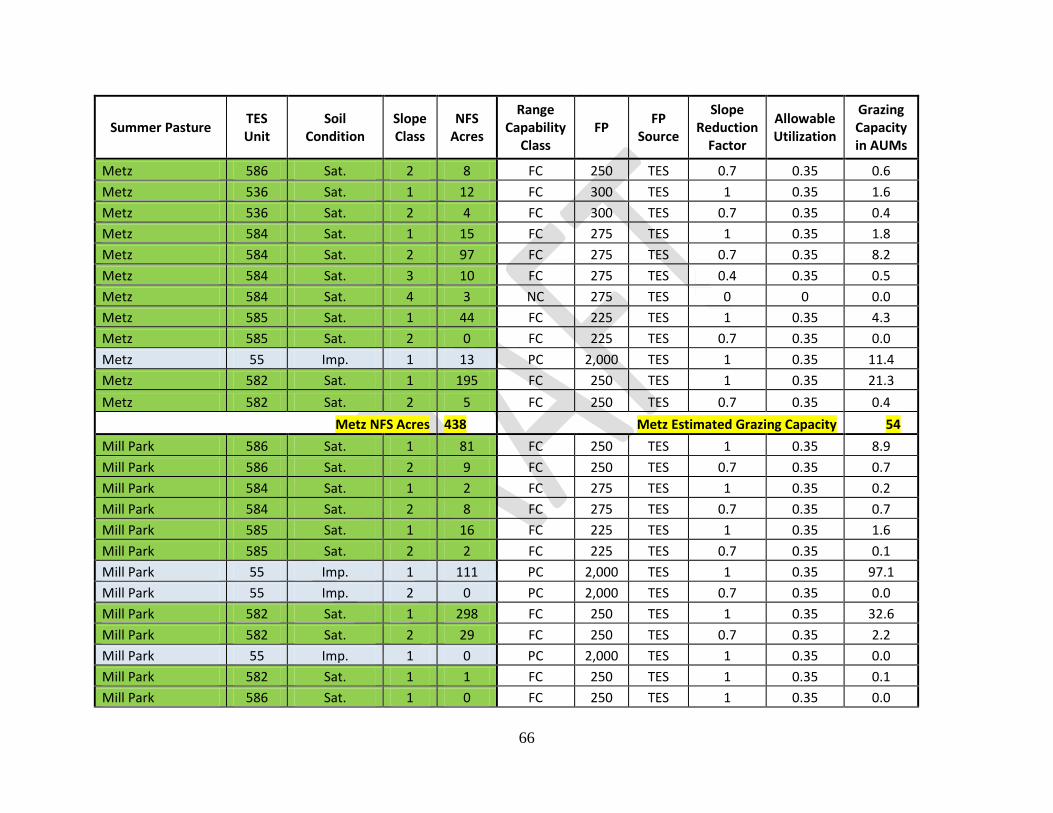
66
Summer Pasture TES Unit
Soil Condition
Slope Class
NFS Acres
Range Capability
Class FP
FP Source
Slope Reduction
Factor
Allowable Utilization
Grazing Capacity in AUMs
Metz 586 Sat. 2 8 FC 250 TES 0.7 0.35 0.6
Metz 536 Sat. 1 12 FC 300 TES 1 0.35 1.6
Metz 536 Sat. 2 4 FC 300 TES 0.7 0.35 0.4
Metz 584 Sat. 1 15 FC 275 TES 1 0.35 1.8
Metz 584 Sat. 2 97 FC 275 TES 0.7 0.35 8.2
Metz 584 Sat. 3 10 FC 275 TES 0.4 0.35 0.5
Metz 584 Sat. 4 3 NC 275 TES 0 0 0.0
Metz 585 Sat. 1 44 FC 225 TES 1 0.35 4.3
Metz 585 Sat. 2 0 FC 225 TES 0.7 0.35 0.0
Metz 55 Imp. 1 13 PC 2,000 TES 1 0.35 11.4
Metz 582 Sat. 1 195 FC 250 TES 1 0.35 21.3
Metz 582 Sat. 2 5 FC 250 TES 0.7 0.35 0.4
Metz NFS Acres 438 Metz Estimated Grazing Capacity 54
Mill Park 586 Sat. 1 81 FC 250 TES 1 0.35 8.9
Mill Park 586 Sat. 2 9 FC 250 TES 0.7 0.35 0.7
Mill Park 584 Sat. 1 2 FC 275 TES 1 0.35 0.2
Mill Park 584 Sat. 2 8 FC 275 TES 0.7 0.35 0.7
Mill Park 585 Sat. 1 16 FC 225 TES 1 0.35 1.6
Mill Park 585 Sat. 2 2 FC 225 TES 0.7 0.35 0.1
Mill Park 55 Imp. 1 111 PC 2,000 TES 1 0.35 97.1
Mill Park 55 Imp. 2 0 PC 2,000 TES 0.7 0.35 0.0
Mill Park 582 Sat. 1 298 FC 250 TES 1 0.35 32.6
Mill Park 582 Sat. 2 29 FC 250 TES 0.7 0.35 2.2
Mill Park 55 Imp. 1 0 PC 2,000 TES 1 0.35 0.0
Mill Park 582 Sat. 1 1 FC 250 TES 1 0.35 0.1
Mill Park 586 Sat. 1 0 FC 250 TES 1 0.35 0.0

67
Summer Pasture TES Unit
Soil Condition
Slope Class
NFS Acres
Range Capability
Class FP
FP Source
Slope Reduction
Factor
Allowable Utilization
Grazing Capacity in AUMs
Mill Park 536 Sat. 1 0 FC 300 TES 1 0.35 0.0
Mill Park 55 Imp. 1 0 PC 2,000 TES 1 0.35 0.0
Mill Park 582 Sat. 1 1 FC 250 TES 1 0.35 0.1
Mill Park 586 Sat. 1 5 FC 250 TES 1 0.35 0.5
Mill Park 586 Sat. 2 2 FC 250 TES 0.7 0.35 0.2
Mill Park 536 Sat. 1 233 FC 300 TES 1 0.35 30.6
Mill Park 536 Sat. 2 12 FC 300 TES 0.7 0.35 1.1
Mill Park 584 Sat. 1 14 FC 275 TES 1 0.35 1.7
Mill Park 584 Sat. 2 19 FC 275 TES 0.7 0.35 1.6
Mill Park 584 Sat. 3 0 FC 275 TES 0.4 0.35 0.0
Mill Park 585 Sat. 1 161 FC 225 TES 1 0.35 15.8
Mill Park 585 Sat. 2 61 FC 225 TES 0.7 0.35 4.2
Mill Park 55 Imp. 1 100 PC 2,000 TES 1 0.35 87.5
Mill Park 55 Imp. 2 2 PC 2,000 TES 0.7 0.35 1.2
Mill Park 582 Sat. 1 27 FC 250 TES 1 0.35 3.0
Mill Park 582 Sat. 2 1 FC 250 TES 0.7 0.35 0.1
Mill Park 55 Imp. 1 65 PC 2,000 TES 1 0.35 56.9
Mill Park 55 Imp. 2 0 PC 2,000 TES 0.7 0.35 0.0
Mill Park 582 Sat. 1 453 FC 250 TES 1 0.35 49.5
Mill Park 582 Sat. 2 6 FC 250 TES 0.7 0.35 0.5
Mill Park 586 Sat. 1 231 FC 250 TES 1 0.35 25.3
Mill Park 586 Sat. 2 32 FC 250 TES 0.7 0.35 2.5
Mill Park 586 Sat. 3 0 FC 250 TES 0.4 0.35 0.0
Mill Park 565 Sat. 1 23 FC 200 TES 1 0.35 2.0
Mill Park 565 Sat. 2 93 FC 200 TES 0.7 0.35 5.7
Mill Park 565 Sat. 3 2 FC 200 TES 0.4 0.35 0.1
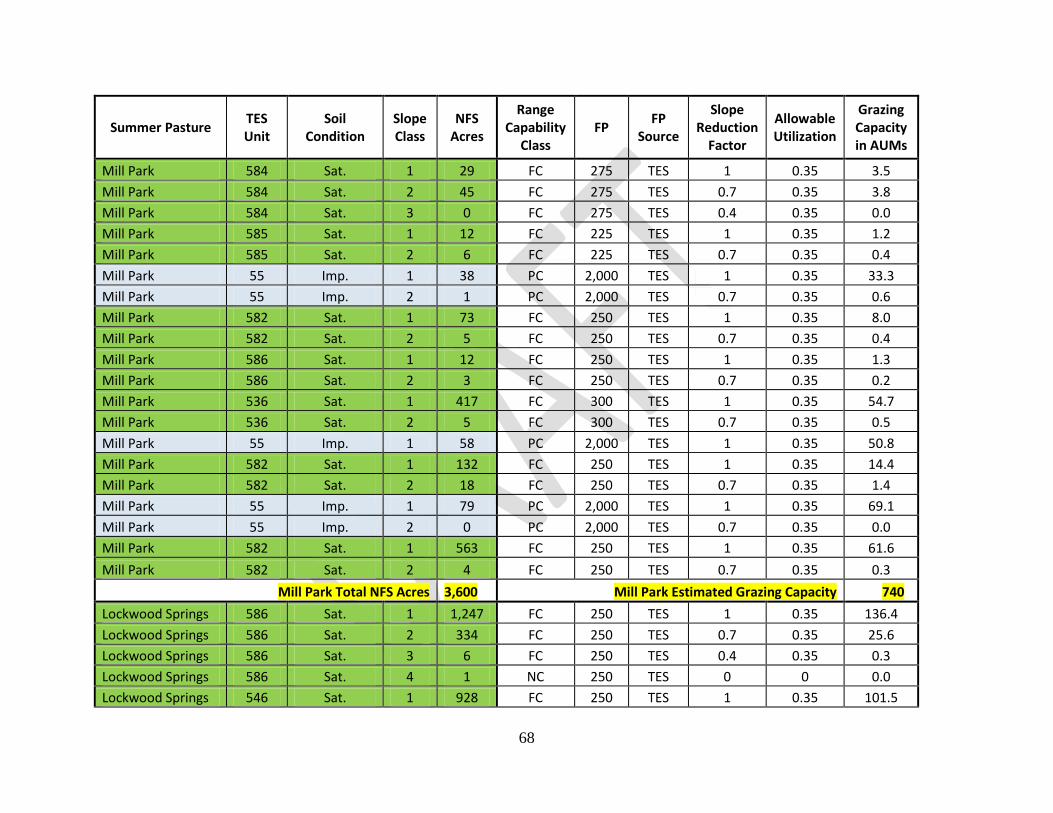
68
Summer Pasture TES Unit
Soil Condition
Slope Class
NFS Acres
Range Capability
Class FP
FP Source
Slope Reduction
Factor
Allowable Utilization
Grazing Capacity in AUMs
Mill Park 584 Sat. 1 29 FC 275 TES 1 0.35 3.5
Mill Park 584 Sat. 2 45 FC 275 TES 0.7 0.35 3.8
Mill Park 584 Sat. 3 0 FC 275 TES 0.4 0.35 0.0
Mill Park 585 Sat. 1 12 FC 225 TES 1 0.35 1.2
Mill Park 585 Sat. 2 6 FC 225 TES 0.7 0.35 0.4
Mill Park 55 Imp. 1 38 PC 2,000 TES 1 0.35 33.3
Mill Park 55 Imp. 2 1 PC 2,000 TES 0.7 0.35 0.6
Mill Park 582 Sat. 1 73 FC 250 TES 1 0.35 8.0
Mill Park 582 Sat. 2 5 FC 250 TES 0.7 0.35 0.4
Mill Park 586 Sat. 1 12 FC 250 TES 1 0.35 1.3
Mill Park 586 Sat. 2 3 FC 250 TES 0.7 0.35 0.2
Mill Park 536 Sat. 1 417 FC 300 TES 1 0.35 54.7
Mill Park 536 Sat. 2 5 FC 300 TES 0.7 0.35 0.5
Mill Park 55 Imp. 1 58 PC 2,000 TES 1 0.35 50.8
Mill Park 582 Sat. 1 132 FC 250 TES 1 0.35 14.4
Mill Park 582 Sat. 2 18 FC 250 TES 0.7 0.35 1.4
Mill Park 55 Imp. 1 79 PC 2,000 TES 1 0.35 69.1
Mill Park 55 Imp. 2 0 PC 2,000 TES 0.7 0.35 0.0
Mill Park 582 Sat. 1 563 FC 250 TES 1 0.35 61.6
Mill Park 582 Sat. 2 4 FC 250 TES 0.7 0.35 0.3
Mill Park Total NFS Acres 3,600 Mill Park Estimated Grazing Capacity 740
Lockwood Springs 586 Sat. 1 1,247 FC 250 TES 1 0.35 136.4
Lockwood Springs 586 Sat. 2 334 FC 250 TES 0.7 0.35 25.6
Lockwood Springs 586 Sat. 3 6 FC 250 TES 0.4 0.35 0.3
Lockwood Springs 586 Sat. 4 1 NC 250 TES 0 0 0.0
Lockwood Springs 546 Sat. 1 928 FC 250 TES 1 0.35 101.5

69
Summer Pasture TES Unit
Soil Condition
Slope Class
NFS Acres
Range Capability
Class FP
FP Source
Slope Reduction
Factor
Allowable Utilization
Grazing Capacity in AUMs
Lockwood Springs 546 Sat. 2 453 FC 250 TES 0.7 0.35 34.7
Lockwood Springs 546 Sat. 3 18 FC 250 TES 0.4 0.35 0.8
Lockwood Springs 546 Sat. 4 7 NC 250 TES 0 0 0.0
Lockwood Springs 584 Sat. 1 425 FC 275 TES 1 0.35 51.1
Lockwood Springs 584 Sat. 2 807 FC 275 TES 0.7 0.35 68.0
Lockwood Springs 584 Sat. 3 116 FC 275 TES 0.4 0.35 5.6
Lockwood Springs 584 Sat. 4 58 NC 275 TES 0 0 0.0
Lockwood Springs 585 Sat. 1 1,245 FC 225 TES 1 0.35 122.6
Lockwood Springs 585 Sat. 2 251 FC 225 TES 0.7 0.35 17.3
Lockwood Springs 585 Sat. 3 17 FC 225 TES 0.4 0.35 0.7
Lockwood Springs 585 Sat. 4 5 NC 225 TES 0 0 0.0
Lockwood Springs 549 Sat. 1 180 FC 250 TES 1 0.35 19.7
Lockwood Springs 549 Sat. 2 425 FC 250 TES 0.7 0.35 32.5
Lockwood Springs 549 Sat. 3 98 FC 250 TES 0.4 0.35 4.3
Lockwood Springs 549 Sat. 4 84 NC 250 TES 0 0 0.0
Lockwood Springs 651 Sat. 1 11 FC 150 TES 1 0.35 0.7
Lockwood Springs 651 Sat. 2 81 FC 150 TES 0.7 0.35 3.7
Lockwood Springs 651 Sat. 3 40 FC 150 TES 0.4 0.35 1.1
Lockwood Springs 651 Sat. 4 21 NC 150 TES 0 0 0.0
Lockwood Springs 55 Imp. 1 37 PC 2,000 TES 1 0.35 32.4
Lockwood Springs 55 Imp. 2 2 PC 2,000 TES 0.7 0.35 1.2
Lockwood Springs 555 Sat. 1 27 NC 50 TES 1 0 0.0
Lockwood Springs 555 Sat. 2 178 NC 50 TES 0.7 0 0.0
Lockwood Springs 555 Sat. 3 116 NC 50 TES 0.4 0 0.0
Lockwood Springs 555 Sat. 4 151 NC 50 TES 0 0 0.0
Lockwood Springs 579 Sat. 1 273 FC 225 TES 1 0.35 26.9
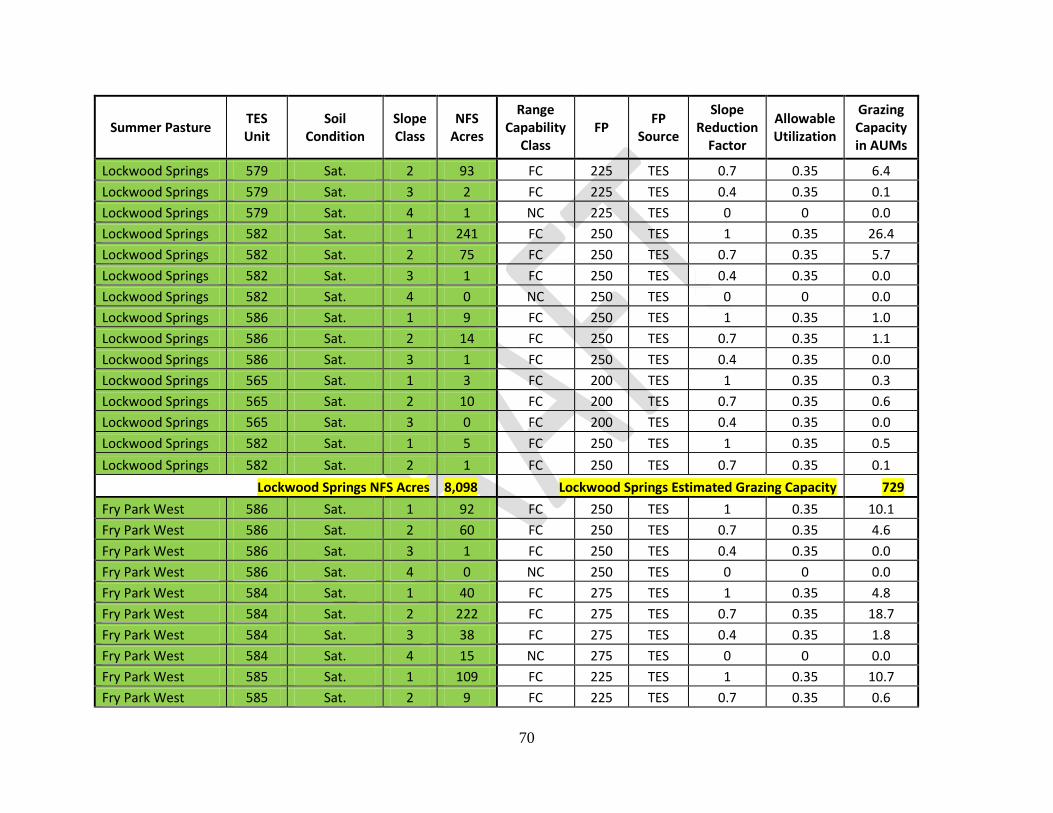
70
Summer Pasture TES Unit
Soil Condition
Slope Class
NFS Acres
Range Capability
Class FP
FP Source
Slope Reduction
Factor
Allowable Utilization
Grazing Capacity in AUMs
Lockwood Springs 579 Sat. 2 93 FC 225 TES 0.7 0.35 6.4
Lockwood Springs 579 Sat. 3 2 FC 225 TES 0.4 0.35 0.1
Lockwood Springs 579 Sat. 4 1 NC 225 TES 0 0 0.0
Lockwood Springs 582 Sat. 1 241 FC 250 TES 1 0.35 26.4
Lockwood Springs 582 Sat. 2 75 FC 250 TES 0.7 0.35 5.7
Lockwood Springs 582 Sat. 3 1 FC 250 TES 0.4 0.35 0.0
Lockwood Springs 582 Sat. 4 0 NC 250 TES 0 0 0.0
Lockwood Springs 586 Sat. 1 9 FC 250 TES 1 0.35 1.0
Lockwood Springs 586 Sat. 2 14 FC 250 TES 0.7 0.35 1.1
Lockwood Springs 586 Sat. 3 1 FC 250 TES 0.4 0.35 0.0
Lockwood Springs 565 Sat. 1 3 FC 200 TES 1 0.35 0.3
Lockwood Springs 565 Sat. 2 10 FC 200 TES 0.7 0.35 0.6
Lockwood Springs 565 Sat. 3 0 FC 200 TES 0.4 0.35 0.0
Lockwood Springs 582 Sat. 1 5 FC 250 TES 1 0.35 0.5
Lockwood Springs 582 Sat. 2 1 FC 250 TES 0.7 0.35 0.1
Lockwood Springs NFS Acres 8,098 Lockwood Springs Estimated Grazing Capacity 729
Fry Park West 586 Sat. 1 92 FC 250 TES 1 0.35 10.1
Fry Park West 586 Sat. 2 60 FC 250 TES 0.7 0.35 4.6
Fry Park West 586 Sat. 3 1 FC 250 TES 0.4 0.35 0.0
Fry Park West 586 Sat. 4 0 NC 250 TES 0 0 0.0
Fry Park West 584 Sat. 1 40 FC 275 TES 1 0.35 4.8
Fry Park West 584 Sat. 2 222 FC 275 TES 0.7 0.35 18.7
Fry Park West 584 Sat. 3 38 FC 275 TES 0.4 0.35 1.8
Fry Park West 584 Sat. 4 15 NC 275 TES 0 0 0.0
Fry Park West 585 Sat. 1 109 FC 225 TES 1 0.35 10.7
Fry Park West 585 Sat. 2 9 FC 225 TES 0.7 0.35 0.6

71
Summer Pasture TES Unit
Soil Condition
Slope Class
NFS Acres
Range Capability
Class FP
FP Source
Slope Reduction
Factor
Allowable Utilization
Grazing Capacity in AUMs
Fry Park West 585 Sat. 3 0 FC 225 TES 0.4 0.35 0.0
Fry Park West 585 Sat. 4 0 NC 225 TES 0 0 0.0
Fry Park West 549 Sat. 1 36 FC 250 TES 1 0.35 3.9
Fry Park West 549 Sat. 2 43 FC 250 TES 0.7 0.35 3.3
Fry Park West 549 Sat. 3 4 FC 250 TES 0.4 0.35 0.2
Fry Park West 549 Sat. 4 1 NC 250 TES 0 0 0.0
Fry Park West 651 Sat. 1 1 FC 150 TES 1 0.35 0.1
Fry Park West 651 Sat. 2 25 FC 150 TES 0.7 0.35 1.1
Fry Park West 651 Sat. 3 2 FC 150 TES 0.4 0.35 0.1
Fry Park West 651 Sat. 4 0 NC 150 TES 0 0 0.0
Fry Park West 55 Imp. 1 16 PC 2,000 TES 1 0.35 14.0
Fry Park West 55 Imp. 2 2 PC 2,000 TES 0.7 0.35 1.2
Fry Park West 55 Imp. 3 0 PC 2,000 TES 0.4 0.35 0.0
Fry Park West 555 Sat. 1 4 NC 50 TES 1 0 0.0
Fry Park West 555 Sat. 2 36 NC 50 TES 0.7 0 0.0
Fry Park West 555 Sat. 3 30 NC 50 TES 0.4 0 0.0
Fry Park West 555 Sat. 4 37 NC 50 TES 0 0 0.0
Fry Park West 582 Sat. 1 1 FC 250 TES 1 0.35 0.1
Fry Park West 582 Sat. 2 0 FC 250 TES 0.7 0.35 0.0
Fry Park West NFS Acres 824 Fry Park West Estimated Grazing Capacity 75
Mexican Pocket 578 Sat. 1 0 FC 250 TES 1 0.35 0.0
Mexican Pocket 578 Sat. 2 3 FC 250 TES 0.7 0.35 0.2
Mexican Pocket 578 Sat. 3 0 FC 250 TES 0.4 0.35 0.0
Mexican Pocket 575 Sat. 1 0 FC 150 TES 1 0.35 0.0
Mexican Pocket 575 Sat. 2 13 FC 150 TES 0.7 0.35 0.6
Mexican Pocket 575 Sat. 3 27 FC 150 TES 0.4 0.35 0.7

72
Summer Pasture TES Unit
Soil Condition
Slope Class
NFS Acres
Range Capability
Class FP
FP Source
Slope Reduction
Factor
Allowable Utilization
Grazing Capacity in AUMs
Mexican Pocket 575 Sat. 4 60 NC 150 TES 0 0 0.0
Mexican Pocket 584 Sat. 1 23 FC 275 TES 1 0.35 2.8
Mexican Pocket 584 Sat. 2 213 FC 275 TES 0.7 0.35 17.9
Mexican Pocket 584 Sat. 3 69 FC 275 TES 0.4 0.35 3.3
Mexican Pocket 584 Sat. 4 39 NC 275 TES 0 0 0.0
Mexican Pocket 585 Sat. 1 1 FC 225 TES 1 0.35 0.1
Mexican Pocket 585 Sat. 2 2 FC 225 TES 0.7 0.35 0.1
Mexican Pocket 585 Sat. 3 0 FC 225 TES 0.4 0.35 0.0
Mexican Pocket 585 Sat. 4 0 NC 225 TES 0 0 0.0
Mexican Pocket 471 Sat./Unstable 1 4 NC 100 TES 1 0 0.0
Mexican Pocket 471 Sat./Unstable 2 18 NC 100 TES 0.7 0 0.0
Mexican Pocket 471 Sat./Unstable 3 16 NC 100 TES 0.4 0 0.0
Mexican Pocket 471 Sat./Unstable 4 142 NC 100 TES 0 0 0.0
Mexican Pocket 555 Sat. 1 7 NC 50 TES 1 0 0.0
Mexican Pocket 555 Sat. 2 18 NC 50 TES 0.7 0 0.0
Mexican Pocket 555 Sat. 3 12 NC 50 TES 0.4 0 0.0
Mexican Pocket 555 Sat. 4 130 NC 50 TES 0 0 0.0
Mexican Pocket 582 Sat. 1 285 FC 250 TES 1 0.35 31.2
Mexican Pocket 582 Sat. 2 366 FC 250 TES 0.7 0.35 28.0
Mexican Pocket 582 Sat. 3 14 FC 250 TES 0.4 0.35 0.6
Mexican Pocket 582 Sat. 4 5 NC 250 TES 0 0 0.0
Mexican Pocket 471 Sat./Unstable 3 0 NC 100 TES 0.4 0 0.0
Mexican Pocket NFS Acres 1,467 Mexican Pocket Estimated Grazing Capacity 86
Harding Point 550 Sat. 1 22 FC 250 TES 1 0.35 2.4
Harding Point 550 Sat. 2 89 FC 250 TES 0.7 0.35 6.8
Harding Point 550 Sat. 3 18 FC 250 TES 0.4 0.35 0.8

73
Summer Pasture TES Unit
Soil Condition
Slope Class
NFS Acres
Range Capability
Class FP
FP Source
Slope Reduction
Factor
Allowable Utilization
Grazing Capacity in AUMs
Harding Point 550 Sat. 4 7 NC 250 TES 0 0 0.0
Harding Point 654 Sat. 1 5 FC 150 TES 1 0.35 0.3
Harding Point 654 Sat. 2 74 FC 150 TES 0.7 0.35 3.4
Harding Point 654 Sat. 3 20 FC 150 TES 0.4 0.35 0.5
Harding Point 654 Sat. 4 3 NC 150 TES 0 0 0.0
Harding Point 578 Sat. 1 86 FC 250 TES 1 0.35 9.4
Harding Point 578 Sat. 2 60 FC 250 TES 0.7 0.35 4.6
Harding Point 578 Sat. 3 1 FC 250 TES 0.4 0.35 0.0
Harding Point 578 Sat. 4 0 NC 250 TES 0 0 0.0
Harding Point 546 Sat. 1 571 FC 250 TES 1 0.35 62.5
Harding Point 546 Sat. 2 535 FC 250 TES 0.7 0.35 41.0
Harding Point 546 Sat. 3 21 FC 250 TES 0.4 0.35 0.9
Harding Point 546 Sat. 4 8 NC 250 TES 0 0 0.0
Harding Point 575 Sat. 1 2 FC 150 TES 1 0.35 0.1
Harding Point 575 Sat. 2 2 FC 150 TES 0.7 0.35 0.1
Harding Point 575 Sat. 3 1 FC 150 TES 0.4 0.35 0.0
Harding Point 575 Sat. 4 1 NC 150 TES 0 0 0.0
Harding Point 584 Sat. 1 74 FC 275 TES 1 0.35 8.9
Harding Point 584 Sat. 2 598 FC 275 TES 0.7 0.35 50.4
Harding Point 584 Sat. 3 138 FC 275 TES 0.4 0.35 6.6
Harding Point 584 Sat. 4 48 NC 275 TES 0 0 0.0
Harding Point 585 Sat. 1 515 FC 225 TES 1 0.35 50.7
Harding Point 585 Sat. 2 333 FC 225 TES 0.7 0.35 22.9
Harding Point 585 Sat. 3 21 FC 225 TES 0.4 0.35 0.8
Harding Point 585 Sat. 4 29 NC 225 TES 0 0 0.0
Harding Point 471 Sat./Unstable 1 0 NC 100 TES 1 0 0.0

74
Summer Pasture TES Unit
Soil Condition
Slope Class
NFS Acres
Range Capability
Class FP
FP Source
Slope Reduction
Factor
Allowable Utilization
Grazing Capacity in AUMs
Harding Point 471 Sat./Unstable 2 4 NC 100 TES 0.7 0 0.0
Harding Point 471 Sat./Unstable 3 4 NC 100 TES 0.4 0 0.0
Harding Point 471 Sat./Unstable 4 9 NC 100 TES 0 0 0.0
Harding Point 549 Sat. 1 80 FC 250 TES 1 0.35 8.8
Harding Point 549 Sat. 2 438 FC 250 TES 0.7 0.35 33.5
Harding Point 549 Sat. 3 110 FC 250 TES 0.4 0.35 4.8
Harding Point 549 Sat. 4 59 NC 250 TES 0 0 0.0
Harding Point 651 Sat. 1 37 FC 150 TES 1 0.35 2.4
Harding Point 651 Sat. 2 163 FC 150 TES 0.7 0.35 7.5
Harding Point 651 Sat. 3 23 FC 150 TES 0.4 0.35 0.6
Harding Point 651 Sat. 4 14 NC 150 TES 0 0 0.0
Harding Point 55 Imp. 1 32 PC 2,000 TES 1 0.35 28.0
Harding Point 55 Imp. 2 0 PC 2,000 TES 0.7 0.35 0.0
Harding Point 555 Sat. 1 7 NC 50 TES 1 0 0.0
Harding Point 555 Sat. 2 35 NC 50 TES 0.7 0 0.0
Harding Point 555 Sat. 3 17 NC 50 TES 0.4 0 0.0
Harding Point 555 Sat. 4 20 NC 50 TES 0 0 0.0
Harding Point 579 Sat. 1 55 FC 225 TES 1 0.35 5.4
Harding Point 579 Sat. 2 72 FC 225 TES 0.7 0.35 5.0
Harding Point 579 Sat. 3 1 FC 225 TES 0.4 0.35 0.0
Harding Point 579 Sat. 4 0 NC 225 TES 0 0 0.0
Harding Point 582 Sat. 1 1,057 FC 250 TES 1 0.35 115.6
Harding Point 582 Sat. 2 528 FC 250 TES 0.7 0.35 40.4
Harding Point 582 Sat. 3 16 FC 250 TES 0.4 0.35 0.7
Harding Point 582 Sat. 4 11 NC 250 TES 0 0 0.0
Harding Point 550 Sat. 3 0 FC 250 TES 0.4 0.35 0.0

75
Summer Pasture TES Unit
Soil Condition
Slope Class
NFS Acres
Range Capability
Class FP
FP Source
Slope Reduction
Factor
Allowable Utilization
Grazing Capacity in AUMs
Harding Point 550 Sat. 4 0 NC 250 TES 0 0 0.0
Harding Point 584 Sat. 4 0 NC 275 TES 0 0 0.0
Harding Point 471 Sat./Unstable 3 0 NC 100 TES 0.4 0 0.0
Harding Point 471 Sat./Unstable 4 0 NC 100 TES 0 0 0.0
Harding Point 549 Sat. 2 0 FC 250 TES 0.7 0.35 0.0
Harding Point 549 Sat. 3 0 FC 250 TES 0.4 0.35 0.0
Harding Point 549 Sat. 4 0 NC 250 TES 0 0 0.0
Harding Point 555 Sat. 2 0 NC 50 TES 0.7 0 0.0
Harding Point 555 Sat. 3 0 NC 50 TES 0.4 0 0.0
Harding Point 555 Sat. 4 0 NC 50 TES 0 0 0.0
Harding Point Total NFS Acres 6,074 Harding Point Estimated Grazing Capacity 526
West Barney 586 Sat. 1 359 FC 250 TES 1 0.35 39.3
West Barney 586 Sat. 2 179 FC 250 TES 0.7 0.35 13.7
West Barney 586 Sat. 3 13 FC 250 TES 0.4 0.35 0.6
West Barney 586 Sat. 4 4 NC 250 TES 0 0 0.0
West Barney 650 Sat. 1 21 FC 150 TES 1 0.35 1.4
West Barney 650 Sat. 2 32 FC 150 TES 0.7 0.35 1.5
West Barney 650 Sat. 3 2 FC 150 TES 0.4 0.35 0.1
West Barney 650 Sat. 4 1 NC 150 TES 0 0 0.0
West Barney 654 Sat. 1 1 FC 150 TES 1 0.35 0.1
West Barney 654 Sat. 2 30 FC 150 TES 0.7 0.35 1.4
West Barney 654 Sat. 3 9 FC 150 TES 0.4 0.35 0.2
West Barney 654 Sat. 4 4 NC 150 TES 0 0 0.0
West Barney 546 Sat. 1 2,809 FC 250 TES 1 0.35 307.2
West Barney 546 Sat. 2 1,100 FC 250 TES 0.7 0.35 84.2
West Barney 546 Sat. 3 71 FC 250 TES 0.4 0.35 3.1
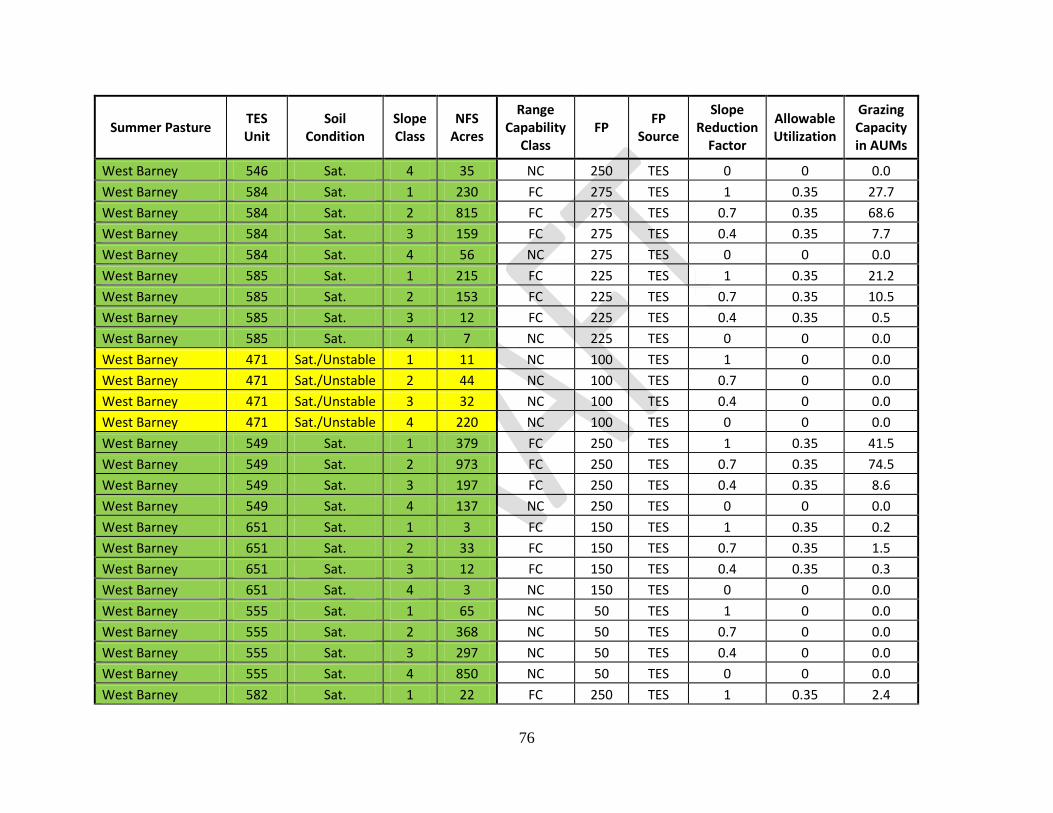
76
Summer Pasture TES Unit
Soil Condition
Slope Class
NFS Acres
Range Capability
Class FP
FP Source
Slope Reduction
Factor
Allowable Utilization
Grazing Capacity in AUMs
West Barney 546 Sat. 4 35 NC 250 TES 0 0 0.0
West Barney 584 Sat. 1 230 FC 275 TES 1 0.35 27.7
West Barney 584 Sat. 2 815 FC 275 TES 0.7 0.35 68.6
West Barney 584 Sat. 3 159 FC 275 TES 0.4 0.35 7.7
West Barney 584 Sat. 4 56 NC 275 TES 0 0 0.0
West Barney 585 Sat. 1 215 FC 225 TES 1 0.35 21.2
West Barney 585 Sat. 2 153 FC 225 TES 0.7 0.35 10.5
West Barney 585 Sat. 3 12 FC 225 TES 0.4 0.35 0.5
West Barney 585 Sat. 4 7 NC 225 TES 0 0 0.0
West Barney 471 Sat./Unstable 1 11 NC 100 TES 1 0 0.0
West Barney 471 Sat./Unstable 2 44 NC 100 TES 0.7 0 0.0
West Barney 471 Sat./Unstable 3 32 NC 100 TES 0.4 0 0.0
West Barney 471 Sat./Unstable 4 220 NC 100 TES 0 0 0.0
West Barney 549 Sat. 1 379 FC 250 TES 1 0.35 41.5
West Barney 549 Sat. 2 973 FC 250 TES 0.7 0.35 74.5
West Barney 549 Sat. 3 197 FC 250 TES 0.4 0.35 8.6
West Barney 549 Sat. 4 137 NC 250 TES 0 0 0.0
West Barney 651 Sat. 1 3 FC 150 TES 1 0.35 0.2
West Barney 651 Sat. 2 33 FC 150 TES 0.7 0.35 1.5
West Barney 651 Sat. 3 12 FC 150 TES 0.4 0.35 0.3
West Barney 651 Sat. 4 3 NC 150 TES 0 0 0.0
West Barney 555 Sat. 1 65 NC 50 TES 1 0 0.0
West Barney 555 Sat. 2 368 NC 50 TES 0.7 0 0.0
West Barney 555 Sat. 3 297 NC 50 TES 0.4 0 0.0
West Barney 555 Sat. 4 850 NC 50 TES 0 0 0.0
West Barney 582 Sat. 1 22 FC 250 TES 1 0.35 2.4

77
Summer Pasture TES Unit
Soil Condition
Slope Class
NFS Acres
Range Capability
Class FP
FP Source
Slope Reduction
Factor
Allowable Utilization
Grazing Capacity in AUMs
West Barney 582 Sat. 2 59 FC 250 TES 0.7 0.35 4.5
West Barney 582 Sat. 3 3 FC 250 TES 0.4 0.35 0.1
West Barney 582 Sat. 4 2 NC 250 TES 0 0 0.0
West Barney 471 Sat./Unstable 1 0 NC 100 TES 1 0 0.0
West Barney 471 Sat./Unstable 2 1 NC 100 TES 0.7 0 0.0
West Barney 471 Sat./Unstable 3 1 NC 100 TES 0.4 0 0.0
West Barney 471 Sat./Unstable 4 20 NC 100 TES 0 0 0.0
West Barney 555 Sat. 2 0 NC 50 TES 0.7 0 0.0
West Barney 555 Sat. 3 0 NC 50 TES 0.4 0 0.0
West Barney 555 Sat. 4 11 NC 50 TES 0 0 0.0
West Barney NFS Acres 10,060 West Barney Estimated Grazing Capacity 722
East Barney 650 Sat. 1 71 FC 150 TES 1 0.35 4.7
East Barney 650 Sat. 2 42 FC 150 TES 0.7 0.35 1.9
East Barney 650 Sat. 3 8 FC 150 TES 0.4 0.35 0.2
East Barney 650 Sat. 4 5 NC 150 TES 0 0 0.0
East Barney 654 Sat. 1 7 FC 150 TES 1 0.35 0.5
East Barney 654 Sat. 2 86 FC 150 TES 0.7 0.35 4.0
East Barney 654 Sat. 3 21 FC 150 TES 0.4 0.35 0.6
East Barney 654 Sat. 4 6 NC 150 TES 0 0 0.0
East Barney 546 Sat. 1 1,930 FC 250 TES 1 0.35 211.1
East Barney 546 Sat. 2 490 FC 250 TES 0.7 0.35 37.5
East Barney 546 Sat. 3 32 FC 250 TES 0.4 0.35 1.4
East Barney 546 Sat. 4 19 NC 250 TES 0 0 0.0
East Barney 584 Sat. 1 19 FC 275 TES 1 0.35 2.3
East Barney 584 Sat. 2 133 FC 275 TES 0.7 0.35 11.2
East Barney 584 Sat. 3 21 FC 275 TES 0.4 0.35 1.0

78
Summer Pasture TES Unit
Soil Condition
Slope Class
NFS Acres
Range Capability
Class FP
FP Source
Slope Reduction
Factor
Allowable Utilization
Grazing Capacity in AUMs
East Barney 584 Sat. 4 9 NC 275 TES 0 0 0.0
East Barney 585 Sat. 1 69 FC 225 TES 1 0.35 6.8
East Barney 585 Sat. 2 55 FC 225 TES 0.7 0.35 3.8
East Barney 585 Sat. 3 4 FC 225 TES 0.4 0.35 0.2
East Barney 585 Sat. 4 2 NC 225 TES 0 0 0.0
East Barney 471 Sat./Unstable 1 6 NC 100 TES 1 0 0.0
East Barney 471 Sat./Unstable 2 33 NC 100 TES 0.7 0 0.0
East Barney 471 Sat./Unstable 3 21 NC 100 TES 0.4 0 0.0
East Barney 471 Sat./Unstable 4 113 NC 100 TES 0 0 0.0
East Barney 549 Sat. 1 66 FC 250 TES 1 0.35 7.2
East Barney 549 Sat. 2 234 FC 250 TES 0.7 0.35 17.9
East Barney 549 Sat. 3 53 FC 250 TES 0.4 0.35 2.3
East Barney 549 Sat. 4 50 NC 250 TES 0 0 0.0
East Barney 651 Sat. 1 95 FC 150 TES 1 0.35 6.2
East Barney 651 Sat. 2 313 FC 150 TES 0.7 0.35 14.4
East Barney 651 Sat. 3 86 FC 150 TES 0.4 0.35 2.3
East Barney 651 Sat. 4 104 NC 150 TES 0 0 0.0
East Barney 555 Sat. 1 52 NC 50 TES 1 0 0.0
East Barney 555 Sat. 2 288 NC 50 TES 0.7 0 0.0
East Barney 555 Sat. 3 175 NC 50 TES 0.4 0 0.0
East Barney 555 Sat. 4 582 NC 50 TES 0 0 0.0
East Barney 567 Sat. 1 50 FC 250 TES 1 0.35 5.5
East Barney 567 Sat. 2 35 FC 250 TES 0.7 0.35 2.7
East Barney 567 Sat. 3 4 FC 250 TES 0.4 0.35 0.2
East Barney 567 Sat. 4 4 NC 250 TES 0 0 0.0
East Barney 579 Sat. 1 143 FC 225 TES 1 0.35 14.1

79
Summer Pasture TES Unit
Soil Condition
Slope Class
NFS Acres
Range Capability
Class FP
FP Source
Slope Reduction
Factor
Allowable Utilization
Grazing Capacity in AUMs
East Barney 579 Sat. 2 37 FC 225 TES 0.7 0.35 2.5
East Barney 579 Sat. 3 1 FC 225 TES 0.4 0.35 0.0
East Barney 579 Sat. 4 0 NC 225 TES 0 0 0.0
East Barney 471 Sat./Unstable 2 0 NC 100 TES 0.7 0 0.0
East Barney 471 Sat./Unstable 4 0 NC 100 TES 0 0 0.0
East Barney 651 Sat. 4 0 NC 150 TES 0 0 0.0
East Barney 555 Sat. 1 0 NC 50 TES 1 0 0.0
East Barney 555 Sat. 2 1 NC 50 TES 0.7 0 0.0
East Barney 555 Sat. 3 2 NC 50 TES 0.4 0 0.0
East Barney 555 Sat. 4 35 NC 50 TES 0 0 0.0
East Barney NFS Acres 5,612 East Barney Estimated Grazing Capacity 362
Winter Cabin Holding 550 Sat. 1 14 FC 250 TES 1 0.35 1.5
Winter Cabin Holding 550 Sat. 2 40 FC 250 TES 0.7 0.35 3.1
Winter Cabin Holding 550 Sat. 3 4 FC 250 TES 0.4 0.35 0.2
Winter Cabin Holding 550 Sat. 4 0 NC 250 TES 0 0 0.0
Winter Cabin Holding 546 Sat. 1 40 FC 250 TES 1 0.35 4.4
Winter Cabin Holding 546 Sat. 2 19 FC 250 TES 0.7 0.35 1.5
Winter Cabin Holding 546 Sat. 3 2 FC 250 TES 0.4 0.35 0.1

80
Summer Pasture TES Unit
Soil Condition
Slope Class
NFS Acres
Range Capability
Class FP
FP Source
Slope Reduction
Factor
Allowable Utilization
Grazing Capacity in AUMs
Winter Cabin Holding 546 Sat. 4 0 NC 250 TES 0 0 0.0
Winter Cabin Holding 584 Sat. 1 5 FC 275 TES 1 0.35 0.6
Winter Cabin Holding 584 Sat. 2 11 FC 275 TES 0.7 0.35 0.9
Winter Cabin Holding 584 Sat. 3 0 FC 275 TES 0.4 0.35 0.0
Winter Cabin Holding 584 Sat. 4 0 NC 275 TES 0 0 0.0
Winter Cabin Holding 471 Sat./Unstable 1 1 NC 100 TES 1 0 0.0
Winter Cabin Holding 471 Sat./Unstable 2 13 NC 100 TES 0.7 0 0.0
Winter Cabin Holding 471 Sat./Unstable 3 13 NC 100 TES 0.4 0 0.0
Winter Cabin Holding 471 Sat./Unstable 4 44 NC 100 TES 0 0 0.0
Winter Cabin Holding 572 Sat. 1 151 NC 50 TES 1 0 0.0
Winter Cabin Holding 572 Sat. 2 273 NC 50 TES 0.7 0 0.0
Winter Cabin Holding 572 Sat. 3 33 NC 50 TES 0.4 0 0.0
Winter Cabin Holding 572 Sat. 4 25 NC 50 TES 0 0 0.0
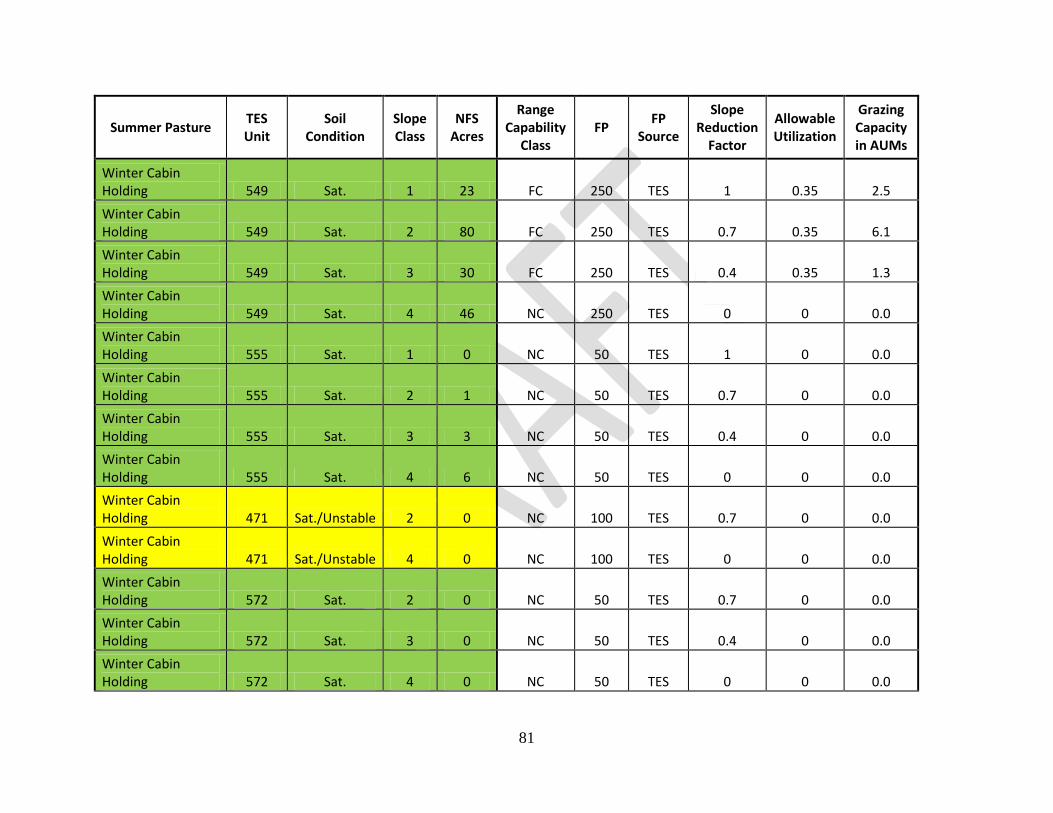
81
Summer Pasture TES Unit
Soil Condition
Slope Class
NFS Acres
Range Capability
Class FP
FP Source
Slope Reduction
Factor
Allowable Utilization
Grazing Capacity in AUMs
Winter Cabin Holding 549 Sat. 1 23 FC 250 TES 1 0.35 2.5
Winter Cabin Holding 549 Sat. 2 80 FC 250 TES 0.7 0.35 6.1
Winter Cabin Holding 549 Sat. 3 30 FC 250 TES 0.4 0.35 1.3
Winter Cabin Holding 549 Sat. 4 46 NC 250 TES 0 0 0.0
Winter Cabin Holding 555 Sat. 1 0 NC 50 TES 1 0 0.0
Winter Cabin Holding 555 Sat. 2 1 NC 50 TES 0.7 0 0.0
Winter Cabin Holding 555 Sat. 3 3 NC 50 TES 0.4 0 0.0
Winter Cabin Holding 555 Sat. 4 6 NC 50 TES 0 0 0.0
Winter Cabin Holding 471 Sat./Unstable 2 0 NC 100 TES 0.7 0 0.0
Winter Cabin Holding 471 Sat./Unstable 4 0 NC 100 TES 0 0 0.0
Winter Cabin Holding 572 Sat. 2 0 NC 50 TES 0.7 0 0.0
Winter Cabin Holding 572 Sat. 3 0 NC 50 TES 0.4 0 0.0
Winter Cabin Holding 572 Sat. 4 0 NC 50 TES 0 0 0.0

82
Summer Pasture TES Unit
Soil Condition
Slope Class
NFS Acres
Range Capability
Class FP
FP Source
Slope Reduction
Factor
Allowable Utilization
Grazing Capacity in AUMs
Winter Cabin Holding 555 Sat. 2 0 NC 50 TES 0.7 0 0.0
Winter Cabin Holding 555 Sat. 3 0 NC 50 TES 0.4 0 0.0
Winter Cabin Holding 555 Sat. 4 0 NC 50 TES 0 0 0.0
Winter Cabin Holding NFS Acres 877 Winter Cabin Holding Estimated Grazing Capacity 22
Fry Park East 586 Sat. 1 162 FC 250 TES 1 0.35 17.7
Fry Park East 586 Sat. 2 13 FC 250 TES 0.7 0.35 1.0
Fry Park East 584 Sat. 1 6 FC 275 TES 1 0.35 0.7
Fry Park East 584 Sat. 2 92 FC 275 TES 0.7 0.35 7.7
Fry Park East 584 Sat. 3 23 FC 275 TES 0.4 0.35 1.1
Fry Park East 584 Sat. 4 6 NC 275 TES 0 0 0.0
Fry Park East 585 Sat. 1 471 FC 225 TES 1 0.35 46.4
Fry Park East 585 Sat. 2 104 FC 225 TES 0.7 0.35 7.2
Fry Park East 585 Sat. 3 4 FC 225 TES 0.4 0.35 0.2
Fry Park East 585 Sat. 4 2 NC 225 TES 0 0 0.0
Fry Park East 471 Sat./Unstable 1 2 NC 100 TES 1 0 0.0
Fry Park East 471 Sat./Unstable 2 4 NC 100 TES 0.7 0 0.0
Fry Park East 471 Sat./Unstable 3 3 NC 100 TES 0.4 0 0.0
Fry Park East 471 Sat./Unstable 4 15 NC 100 TES 0 0 0.0
Fry Park East 549 Sat. 1 8 FC 250 TES 1 0.35 0.9
Fry Park East 549 Sat. 2 8 FC 250 TES 0.7 0.35 0.6
Fry Park East 549 Sat. 3 3 FC 250 TES 0.4 0.35 0.1
Fry Park East 549 Sat. 4 1 NC 250 TES 0 0 0.0
Fry Park East 55 Imp. 1 481 PC 2,000 TES 1 0.35 420.9

83
Summer Pasture TES Unit
Soil Condition
Slope Class
NFS Acres
Range Capability
Class FP
FP Source
Slope Reduction
Factor
Allowable Utilization
Grazing Capacity in AUMs
Fry Park East 55 Imp. 2 2 PC 2,000 TES 0.7 0.35 1.2
Fry Park East 55 Imp. 3 0 PC 2,000 TES 0.4 0.35 0.0
Fry Park East 555 Sat. 1 1 NC 50 TES 1 0 0.0
Fry Park East 555 Sat. 2 3 NC 50 TES 0.7 0 0.0
Fry Park East 555 Sat. 3 2 NC 50 TES 0.4 0 0.0
Fry Park East 555 Sat. 4 1 NC 50 TES 0 0 0.0
Fry Park East 582 Sat. 1 1,097 FC 250 TES 1 0.35 120.0
Fry Park East 582 Sat. 2 109 FC 250 TES 0.7 0.35 8.3
Fry Park East 582 Sat. 3 2 FC 250 TES 0.4 0.35 0.1
Fry Park East 582 Sat. 4 0 NC 250 TES 0 0 0.0
Fry Park East NFS Acres 2,625 Fry Park East Estimated Grazing Capacity 634
Winter Cabin Driveway 546 Sat. 1 1 FC 250 TES 1 0.35 0.1
Winter Cabin Driveway 546 Sat. 2 10 FC 250 TES 0.7 0.35 0.8
Winter Cabin Driveway 549 Sat. 1 0 FC 250 TES 1 0.35 0.0
Winter Cabin Driveway 549 Sat. 2 4 FC 250 TES 0.7 0.35 0.3
Winter Cabin Driveway 549 Sat. 3 4 FC 250 TES 0.4 0.35 0.2
Winter Cabin Driveway 549 Sat. 4 4 NC 250 TES 0 0 0.0
Winter Cabin Driveway 555 Sat. 2 1 NC 50 TES 0.7 0 0.0
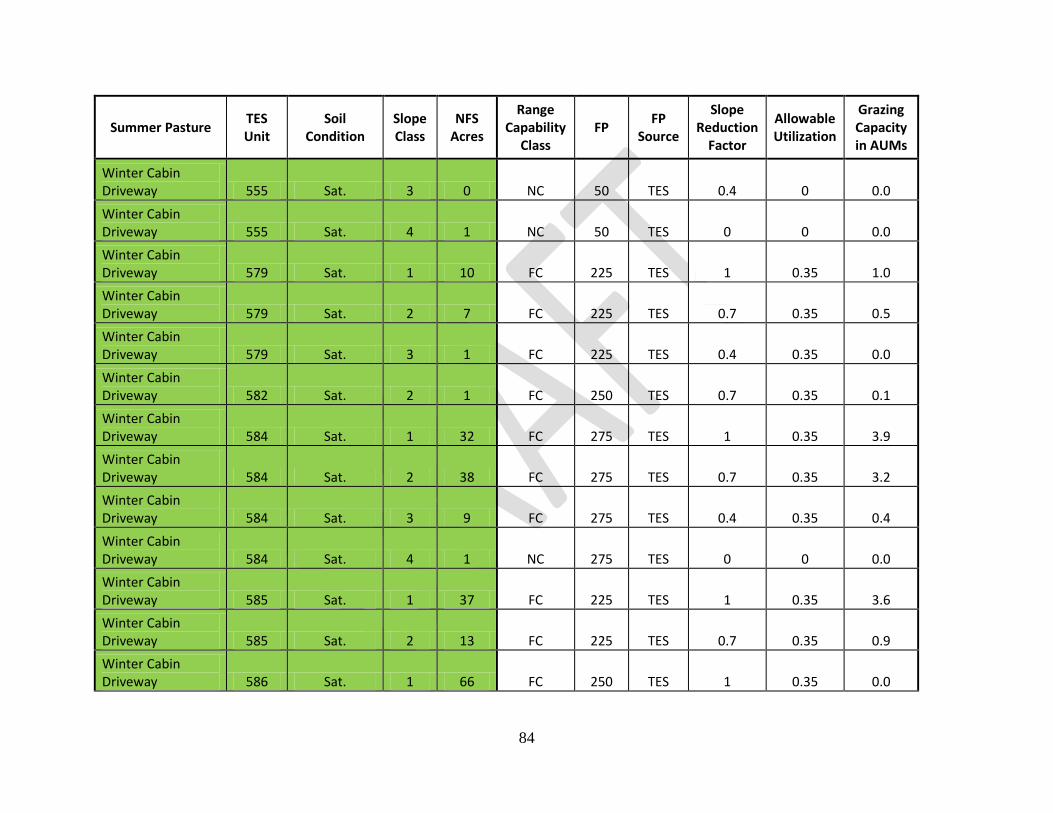
84
Summer Pasture TES Unit
Soil Condition
Slope Class
NFS Acres
Range Capability
Class FP
FP Source
Slope Reduction
Factor
Allowable Utilization
Grazing Capacity in AUMs
Winter Cabin Driveway 555 Sat. 3 0 NC 50 TES 0.4 0 0.0
Winter Cabin Driveway 555 Sat. 4 1 NC 50 TES 0 0 0.0
Winter Cabin Driveway 579 Sat. 1 10 FC 225 TES 1 0.35 1.0
Winter Cabin Driveway 579 Sat. 2 7 FC 225 TES 0.7 0.35 0.5
Winter Cabin Driveway 579 Sat. 3 1 FC 225 TES 0.4 0.35 0.0
Winter Cabin Driveway 582 Sat. 2 1 FC 250 TES 0.7 0.35 0.1
Winter Cabin Driveway 584 Sat. 1 32 FC 275 TES 1 0.35 3.9
Winter Cabin Driveway 584 Sat. 2 38 FC 275 TES 0.7 0.35 3.2
Winter Cabin Driveway 584 Sat. 3 9 FC 275 TES 0.4 0.35 0.4
Winter Cabin Driveway 584 Sat. 4 1 NC 275 TES 0 0 0.0
Winter Cabin Driveway 585 Sat. 1 37 FC 225 TES 1 0.35 3.6
Winter Cabin Driveway 585 Sat. 2 13 FC 225 TES 0.7 0.35 0.9
Winter Cabin Driveway 586 Sat. 1 66 FC 250 TES 1 0.35 0.0

85
Summer Pasture TES Unit
Soil Condition
Slope Class
NFS Acres
Range Capability
Class FP
FP Source
Slope Reduction
Factor
Allowable Utilization
Grazing Capacity in AUMs
Winter Cabin Driveway 586 Sat. 2 42 FC 250 TES 0.7 0.35 0.0
Winter Cabin Driveway 586 Sat. 3 2 FC 250 TES 0.4 0.35 0.0
Winter Cabin Driveway NFS Acres 284 Winter Cabin Driveway Estimated Grazing Capacity 15
TOTAL NFS ACRES WITHIN SUMMER PASTURES 44,041 TOTAL ESTIMATED GRAZING CAPACITY FOR SUMMER PASTURE (AUMs)
4,597

86
Table 3: Estimated Livestock Grazing Capacity based on Full Capability – Winter Pastures in the Windmill West Allotment
Winter Pasture TES Unit
Soil Condition
Slope Class
NFS Acres
Range Capability
Class FP
FP Source
Slope Reduction
Factor
Allowable Utilization
Grazing Capacity in AUMs
Black Tank 471 Sat./Unstable 3 0 NC 100 TES 0.4 0 0.0
Black Tank 471 Sat./Unstable 4 0 NC 100 TES 0 0 0.0
Black Tank 45 Sat. 1 143 FC 300 TES 1 0.35 18.8
Black Tank 45 Sat. 2 46 FC 300 TES 0.7 0.35 4.2
Black Tank 45 Sat. 3 4 FC 300 TES 0.4 0.35 0.2
Black Tank 45 Sat. 4 1 NC 300 TES 0 0 0.0
Black Tank 495 Sat. 2 0 FC 112 FD 0.7 0.35 0.0
Black Tank 495 Sat. 3 0 FC 112 FD 0.4 0.35 0.0
Black Tank 495 Sat. 4 0 NC 112 FD 0 0 0.0
Black Tank 457 Imp. 1 317 PC 141 FD 1 0.35 19.6
Black Tank 457 Imp. 2 190 PC 141 FD 0.7 0.35 8.2
Black Tank 457 Imp. 3 15 PC 141 FD 0.4 0.35 0.4
Black Tank 457 Imp. 4 9 NC 141 FD 0 0 0.0
Black Tank 418 UnSat. 1 1,129 NC 85 FD 1 0 0.0
Black Tank 418 UnSat. 2 1,523 NC 85 FD 0.7 0 0.0
Black Tank 418 UnSat. 3 289 NC 85 FD 0.4 0 0.0
Black Tank 418 UnSat. 4 81 NC 85 FD 0 0 0.0
Black Tank 463 Imp. 1 113 PC 112 FD 1 0.35 5.5
Black Tank 463 Imp. 2 362 PC 112 FD 0.7 0.35 12.4
Black Tank 463 Imp. 3 89 PC 112 FD 0.4 0.35 1.7
Black Tank 463 Imp. 4 36 NC 112 FD 0 0 0.0
Black Tank 417 Imp. 1 587 PC 111 FD 1 0.35 28.5
Black Tank 417 Imp. 2 379 PC 111 FD 0.7 0.35 12.9
Black Tank 417 Imp. 3 12 PC 111 FD 0.4 0.35 0.2
Black Tank 417 Imp. 4 2 NC 111 FD 0 0 0.0
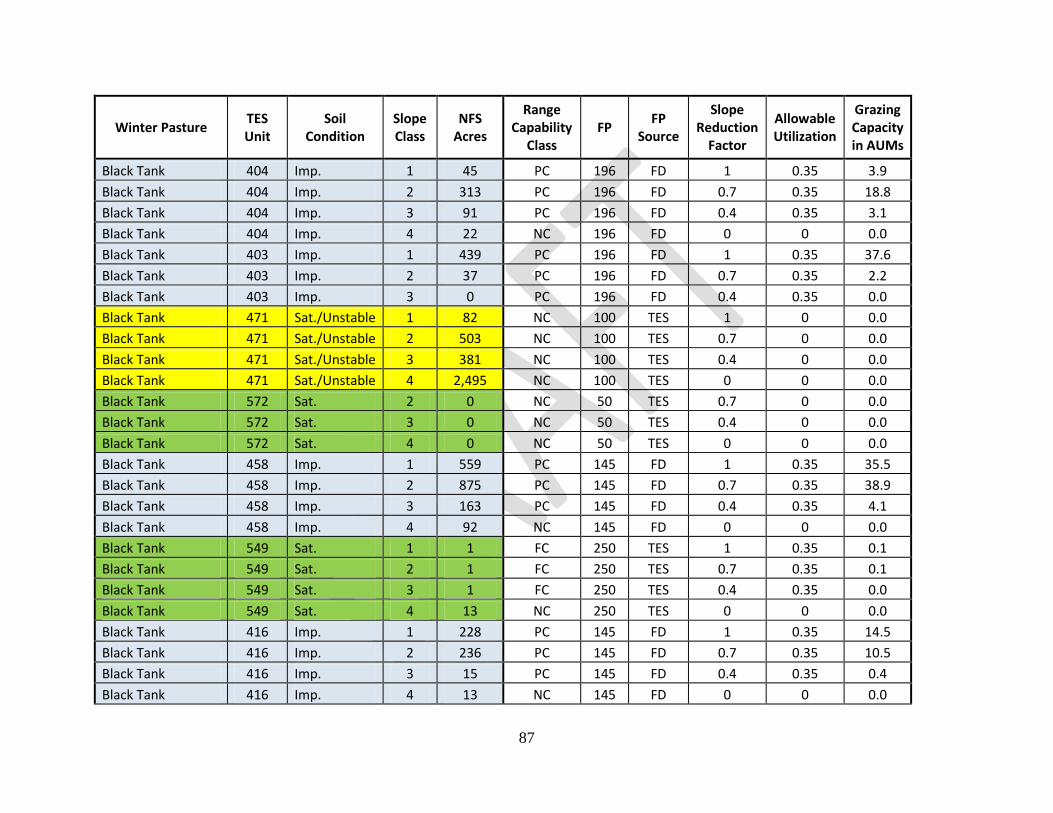
87
Winter Pasture TES Unit
Soil Condition
Slope Class
NFS Acres
Range Capability
Class FP
FP Source
Slope Reduction
Factor
Allowable Utilization
Grazing Capacity in AUMs
Black Tank 404 Imp. 1 45 PC 196 FD 1 0.35 3.9
Black Tank 404 Imp. 2 313 PC 196 FD 0.7 0.35 18.8
Black Tank 404 Imp. 3 91 PC 196 FD 0.4 0.35 3.1
Black Tank 404 Imp. 4 22 NC 196 FD 0 0 0.0
Black Tank 403 Imp. 1 439 PC 196 FD 1 0.35 37.6
Black Tank 403 Imp. 2 37 PC 196 FD 0.7 0.35 2.2
Black Tank 403 Imp. 3 0 PC 196 FD 0.4 0.35 0.0
Black Tank 471 Sat./Unstable 1 82 NC 100 TES 1 0 0.0
Black Tank 471 Sat./Unstable 2 503 NC 100 TES 0.7 0 0.0
Black Tank 471 Sat./Unstable 3 381 NC 100 TES 0.4 0 0.0
Black Tank 471 Sat./Unstable 4 2,495 NC 100 TES 0 0 0.0
Black Tank 572 Sat. 2 0 NC 50 TES 0.7 0 0.0
Black Tank 572 Sat. 3 0 NC 50 TES 0.4 0 0.0
Black Tank 572 Sat. 4 0 NC 50 TES 0 0 0.0
Black Tank 458 Imp. 1 559 PC 145 FD 1 0.35 35.5
Black Tank 458 Imp. 2 875 PC 145 FD 0.7 0.35 38.9
Black Tank 458 Imp. 3 163 PC 145 FD 0.4 0.35 4.1
Black Tank 458 Imp. 4 92 NC 145 FD 0 0 0.0
Black Tank 549 Sat. 1 1 FC 250 TES 1 0.35 0.1
Black Tank 549 Sat. 2 1 FC 250 TES 0.7 0.35 0.1
Black Tank 549 Sat. 3 1 FC 250 TES 0.4 0.35 0.0
Black Tank 549 Sat. 4 13 NC 250 TES 0 0 0.0
Black Tank 416 Imp. 1 228 PC 145 FD 1 0.35 14.5
Black Tank 416 Imp. 2 236 PC 145 FD 0.7 0.35 10.5
Black Tank 416 Imp. 3 15 PC 145 FD 0.4 0.35 0.4
Black Tank 416 Imp. 4 13 NC 145 FD 0 0 0.0

88
Winter Pasture TES Unit
Soil Condition
Slope Class
NFS Acres
Range Capability
Class FP
FP Source
Slope Reduction
Factor
Allowable Utilization
Grazing Capacity in AUMs
Black Tank 462 Imp. 1 14 PC 112 FD 1 0.35 0.7
Black Tank 462 Imp. 2 12 PC 112 FD 0.7 0.35 0.4
Black Tank 462 Imp. 3 4 PC 112 FD 0.4 0.35 0.1
Black Tank 462 Imp. 4 3 NC 112 FD 0 0 0.0
Black Tank 555 Sat. 1 4 NC 50 TES 1 0 0.0
Black Tank 555 Sat. 2 17 NC 50 TES 0.7 0 0.0
Black Tank 555 Sat. 3 13 NC 50 TES 0.4 0 0.0
Black Tank 555 Sat. 4 188 NC 50 TES 0 0 0.0
Black Tank NFS Acres 12,187 Black Tank Estimated Grazing Capacity 282
Casner Mountain 471 Sat./Unstable 2 0 NC 100 TES 0.7 0 0.0
Casner Mountain 555 Sat. 2 0 NC 50 TES 0.7 0 0.0
Casner Mountain 495 Sat. 1 267 FC 112 FD 1 0.35 13.1
Casner Mountain 495 Sat. 2 180 FC 112 FD 0.7 0.35 6.2
Casner Mountain 495 Sat. 3 11 FC 112 FD 0.4 0.35 0.2
Casner Mountain 495 Sat. 4 10 NC 112 FD 0 0 0.0
Casner Mountain 418 UnSat. 2 0 NC 85 FD 0.7 0 0.0
Casner Mountain 418 UnSat. 3 0 NC 85 FD 0.4 0 0.0
Casner Mountain 418 UnSat. 4 0 NC 85 FD 0 0 0.0
Casner Mountain 417 Imp. 1 3 PC 111 FD 1 0.35 0.1
Casner Mountain 417 Imp. 2 24 PC 111 FD 0.7 0.35 0.8
Casner Mountain 417 Imp. 3 0 PC 111 FD 0.4 0.35 0.0
Casner Mountain 417 Imp. 4 0 NC 111 FD 0 0 0.0
Casner Mountain 404 Imp. 2 13 PC 196 FD 0.7 0.35 0.8
Casner Mountain 404 Imp. 3 9 PC 196 FD 0.4 0.35 0.3
Casner Mountain 404 Imp. 4 3 NC 196 FD 0 0 0.0
Casner Mountain 471 Sat./Unstable 1 3 NC 100 TES 1 0 0.0
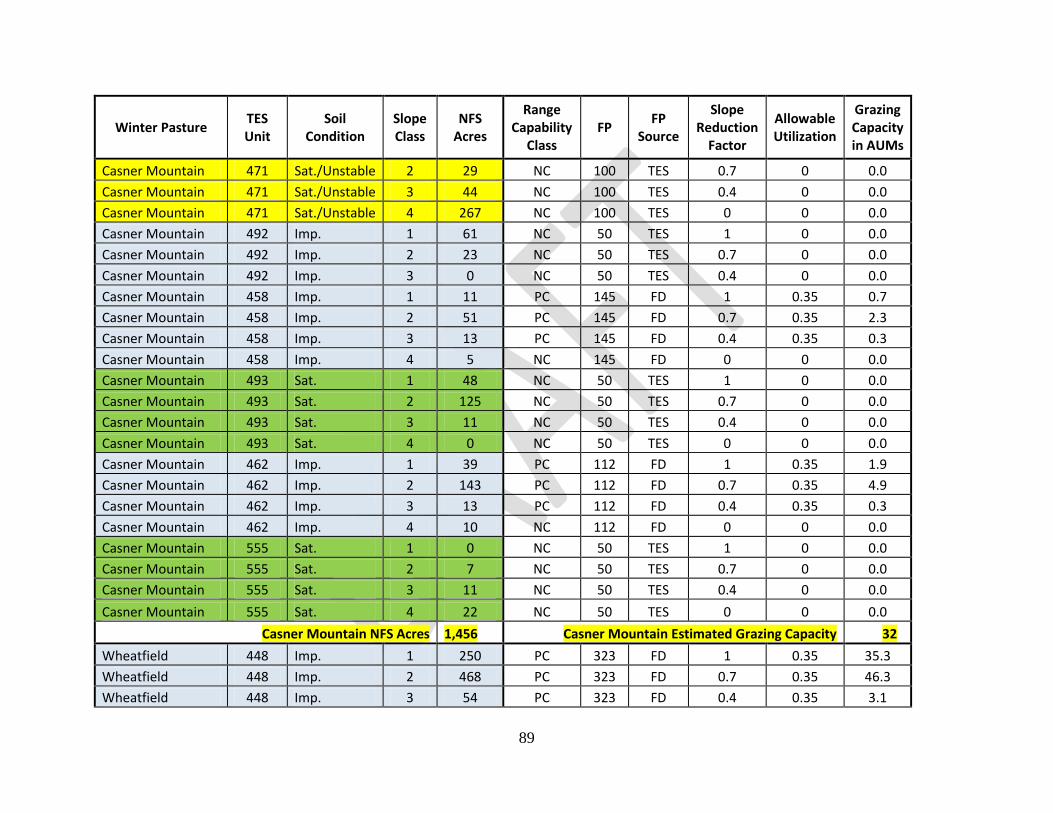
89
Winter Pasture TES Unit
Soil Condition
Slope Class
NFS Acres
Range Capability
Class FP
FP Source
Slope Reduction
Factor
Allowable Utilization
Grazing Capacity in AUMs
Casner Mountain 471 Sat./Unstable 2 29 NC 100 TES 0.7 0 0.0
Casner Mountain 471 Sat./Unstable 3 44 NC 100 TES 0.4 0 0.0
Casner Mountain 471 Sat./Unstable 4 267 NC 100 TES 0 0 0.0
Casner Mountain 492 Imp. 1 61 NC 50 TES 1 0 0.0
Casner Mountain 492 Imp. 2 23 NC 50 TES 0.7 0 0.0
Casner Mountain 492 Imp. 3 0 NC 50 TES 0.4 0 0.0
Casner Mountain 458 Imp. 1 11 PC 145 FD 1 0.35 0.7
Casner Mountain 458 Imp. 2 51 PC 145 FD 0.7 0.35 2.3
Casner Mountain 458 Imp. 3 13 PC 145 FD 0.4 0.35 0.3
Casner Mountain 458 Imp. 4 5 NC 145 FD 0 0 0.0
Casner Mountain 493 Sat. 1 48 NC 50 TES 1 0 0.0
Casner Mountain 493 Sat. 2 125 NC 50 TES 0.7 0 0.0
Casner Mountain 493 Sat. 3 11 NC 50 TES 0.4 0 0.0
Casner Mountain 493 Sat. 4 0 NC 50 TES 0 0 0.0
Casner Mountain 462 Imp. 1 39 PC 112 FD 1 0.35 1.9
Casner Mountain 462 Imp. 2 143 PC 112 FD 0.7 0.35 4.9
Casner Mountain 462 Imp. 3 13 PC 112 FD 0.4 0.35 0.3
Casner Mountain 462 Imp. 4 10 NC 112 FD 0 0 0.0
Casner Mountain 555 Sat. 1 0 NC 50 TES 1 0 0.0
Casner Mountain 555 Sat. 2 7 NC 50 TES 0.7 0 0.0
Casner Mountain 555 Sat. 3 11 NC 50 TES 0.4 0 0.0
Casner Mountain 555 Sat. 4 22 NC 50 TES 0 0 0.0
Casner Mountain NFS Acres 1,456 Casner Mountain Estimated Grazing Capacity 32
Wheatfield 448 Imp. 1 250 PC 323 FD 1 0.35 35.3
Wheatfield 448 Imp. 2 468 PC 323 FD 0.7 0.35 46.3
Wheatfield 448 Imp. 3 54 PC 323 FD 0.4 0.35 3.1

90
Winter Pasture TES Unit
Soil Condition
Slope Class
NFS Acres
Range Capability
Class FP
FP Source
Slope Reduction
Factor
Allowable Utilization
Grazing Capacity in AUMs
Wheatfield 448 Sat./Unstable 4 21 NC 323 FD 0 0 0.0
Wheatfield 457 Imp. 1 24 PC 141 FD 1 0.35 1.5
Wheatfield 457 Imp. 2 34 PC 141 FD 0.7 0.35 1.5
Wheatfield 457 Imp. 3 8 PC 141 FD 0.4 0.35 0.2
Wheatfield 457 Imp. 4 9 NC 141 FD 0 0 0.0
Wheatfield 463 Imp. 1 1 PC 112 FD 1 0.35 0.0
Wheatfield 463 Imp. 2 25 PC 112 FD 0.7 0.35 0.9
Wheatfield 463 Imp. 3 8 PC 112 FD 0.4 0.35 0.2
Wheatfield 463 Imp. 4 5 NC 112 FD 0 0 0.0
Wheatfield 414 UnSat. 1 803 PC 111 FD 1 0 0.0
Wheatfield 414 UnSat. 2 158 PC 111 FD 0.7 0 0.0
Wheatfield 414 UnSat. 3 1 PC 111 FD 0.4 0 0.0
Wheatfield 414 UnSat. 4 1 NC 111 FD 0 0 0.0
Wheatfield 417 Imp. 1 41 PC 111 FD 1 0.35 2.0
Wheatfield 417 Imp. 2 37 PC 111 FD 0.7 0.35 1.3
Wheatfield 417 Imp. 3 2 PC 111 FD 0.4 0.35 0.0
Wheatfield 417 Imp. 4 1 NC 111 FD 0 0 0.0
Wheatfield 447 Imp. 1 350 PC 465 FD 1 0.35 71.2
Wheatfield 447 Imp. 2 101 PC 465 FD 0.7 0.35 14.4
Wheatfield 447 Imp. 3 3 PC 465 FD 0.4 0.35 0.2
Wheatfield 447 Imp. 4 2 NC 465 FD 0 0 0.0
Wheatfield 404 Imp. 1 74 PC 196 FD 1 0.35 6.3
Wheatfield 404 Imp. 2 345 PC 196 FD 0.7 0.35 20.7
Wheatfield 404 Imp. 3 40 PC 196 FD 0.4 0.35 1.4
Wheatfield 404 Imp. 4 12 NC 196 FD 0 0 0.0
Wheatfield 403 Imp. 1 1,803 PC 196 FD 1 0.35 154.6

91
Winter Pasture TES Unit
Soil Condition
Slope Class
NFS Acres
Range Capability
Class FP
FP Source
Slope Reduction
Factor
Allowable Utilization
Grazing Capacity in AUMs
Wheatfield 403 Imp. 2 167 PC 196 FD 0.7 0.35 10.0
Wheatfield 403 Imp. 3 4 PC 196 FD 0.4 0.35 0.1
Wheatfield 403 Imp. 4 2 NC 196 FD 0 0 0.0
Wheatfield 471 Sat./Unstable 1 2 NC 100 TES 1 0 0.0
Wheatfield 471 Sat./Unstable 2 20 NC 100 TES 0.7 0 0.0
Wheatfield 471 Sat./Unstable 3 34 NC 100 TES 0.4 0 0.0
Wheatfield 471 Sat./Unstable 4 207 NC 100 TES 0 0 0.0
Wheatfield 430 Sat./Unstable 1 1 NC 208 FD 1 0 0.0
Wheatfield 430 Sat./Unstable 2 116 NC 208 FD 0.7 0 0.0
Wheatfield 430 Sat./Unstable 3 191 NC 208 FD 0.4 0 0.0
Wheatfield 430 Sat./Unstable 4 491 NC 208 FD 0 0 0.0
Wheatfield 458 Imp. 1 48 PC 145 FD 1 0.35 3.0
Wheatfield 458 Imp. 2 177 PC 145 FD 0.7 0.35 7.9
Wheatfield 458 Imp. 3 38 PC 145 FD 0.4 0.35 1.0
Wheatfield 458 Imp. 4 18 NC 145 FD 0 0 0.0
Wheatfield 350 Sat. 1 9 FC 659 FD 1 0.35 2.6
Wheatfield 350 Sat. 2 69 FC 659 FD 0.7 0.35 13.9
Wheatfield 350 Sat. 3 51 FC 659 FD 0.4 0.35 5.9
Wheatfield 350 Sat./Unstable 4 95 NC 659 FD 0 0 0.0
Wheatfield 416 Imp. 1 222 PC 145 FD 1 0.35 14.1
Wheatfield 416 Imp. 2 232 PC 145 FD 0.7 0.35 10.3
Wheatfield 416 Imp. 3 57 PC 145 FD 0.4 0.35 1.4
Wheatfield 416 Imp. 4 43 NC 145 FD 0 0 0.0
Wheatfield 462 Imp. 2 0 PC 112 FD 0.7 0.35 0.0
Wheatfield 462 Imp. 3 0 PC 112 FD 0.4 0.35 0.0
Wheatfield NFS Acres 6,975 Wheatfield Estimated Grazing Capacity 436

92
Winter Pasture TES Unit
Soil Condition
Slope Class
NFS Acres
Range Capability
Class FP
FP Source
Slope Reduction
Factor
Allowable Utilization
Grazing Capacity in AUMs
Black Mountain 463 Imp. 1 138 PC 112 FD 1 0.35 6.8
Black Mountain 463 Imp. 2 698 PC 112 FD 0.7 0.35 23.9
Black Mountain 463 Imp. 3 92 PC 112 FD 0.4 0.35 1.8
Black Mountain 463 Imp. 4 23 NC 112 FD 0 0 0.0
Black Mountain 404 Imp. 2 8 PC 196 FD 0.7 0.35 0.5
Black Mountain 404 Imp. 3 5 PC 196 FD 0.4 0.35 0.2
Black Mountain 404 Imp. 4 1 NC 196 FD 0 0 0.0
Black Mountain 471 Sat./Unstable 1 0 NC 100 TES 1 0 0.0
Black Mountain 471 Sat./Unstable 2 3 NC 100 TES 0.7 0 0.0
Black Mountain 471 Sat./Unstable 3 3 NC 100 TES 0.4 0 0.0
Black Mountain 471 Sat./Unstable 4 23 NC 100 TES 0 0 0.0
Black Mountain 430 Sat./Unstable 1 1 NC 208 FD 1 0 0.0
Black Mountain 430 Sat./Unstable 2 9 NC 208 FD 0.7 0 0.0
Black Mountain 430 Sat./Unstable 3 19 NC 208 FD 0.4 0 0.0
Black Mountain 430 Sat./Unstable 4 60 NC 208 FD 0 0 0.0
Black Mountain 462 Imp. 1 640 PC 112 FD 1 0.35 31.4
Black Mountain 462 Imp. 2 257 PC 112 FD 0.7 0.35 8.8
Black Mountain 462 Imp. 3 11 PC 112 FD 0.4 0.35 0.2
Black Mountain 462 Imp. 4 7 NC 112 FD 0 0 0.0
Black Mountain NFS Acres 1,998 Black Mountain Estimated Grazing Capacity 74
Sugarloaf 418 UnSat. 1 84 NC 85 FD 1 0 0.0
Sugarloaf 418 UnSat. 2 54 NC 85 FD 0.7 0 0.0
Sugarloaf 418 UnSat. 3 2 NC 85 FD 0.4 0 0.0
Sugarloaf 417 Imp. 1 104 PC 111 FD 1 0.35 5.1
Sugarloaf 417 Imp. 2 37 PC 111 FD 0.7 0.35 1.3
Sugarloaf 417 Imp. 3 0 PC 111 FD 0.4 0.35 0.0

93
Winter Pasture TES Unit
Soil Condition
Slope Class
NFS Acres
Range Capability
Class FP
FP Source
Slope Reduction
Factor
Allowable Utilization
Grazing Capacity in AUMs
Sugarloaf 403 Imp. 1 102 PC 196 FD 1 0.35 8.7
Sugarloaf 403 Imp. 2 6 PC 196 FD 0.7 0.35 0.4
Sugarloaf 403 Imp. 3 0 PC 196 FD 0.4 0.35 0.0
Sugarloaf 471 Sat./Unstable 2 1 NC 100 TES 0.7 0 0.0
Sugarloaf 471 Sat./Unstable 3 2 NC 100 TES 0.4 0 0.0
Sugarloaf 471 Sat./Unstable 4 21 NC 100 TES 0 0 0.0
Sugarloaf 458 Imp. 1 12 PC 145 FD 1 0.35 0.8
Sugarloaf 458 Imp. 2 31 PC 145 FD 0.7 0.35 1.4
Sugarloaf 458 Imp. 3 7 PC 145 FD 0.4 0.35 0.2
Sugarloaf 458 Imp. 4 5 NC 145 FD 0 0 0.0
Sugarloaf 416 Imp. 1 75 PC 145 FD 1 0.35 4.8
Sugarloaf 416 Imp. 2 74 PC 145 FD 0.7 0.35 3.3
Sugarloaf 416 Imp. 3 8 PC 145 FD 0.4 0.35 0.2
Sugarloaf 416 Imp. 4 8 NC 145 FD 0 0 0.0
Sugarloaf NFS Acres 633 Sugarloaf Estimated Grazing Capacity 26
048 (Blk. Tank Holding) 418 UnSat. 1 4 NC 85 FD 1 0 0.0
048 (Blk. Tank Holding) 418 UnSat. 2 1 NC 85 FD 0.7 0 0.0
048 (Blk. Tank Holding) 403 Imp. 1 36 PC 196 FD 1 0 0.0
048 (Blk. Tank Holding) 403 Imp. 2 1 PC 196 FD 0.7 0 0.0
048 (Black Tank Holding) NFS Acres 42 048 (Black Tank Holding) Estimated Grazing Capacity 0
Greasy West 45 Sat. 1 2 FC 300 TES 1 0.35 0.3
Greasy West 45 Sat. 2 0 FC 300 TES 0.7 0.35 0.0
Greasy West 45 Sat. 3 0 FC 300 TES 0.4 0.35 0.0

94
Winter Pasture TES Unit
Soil Condition
Slope Class
NFS Acres
Range Capability
Class FP
FP Source
Slope Reduction
Factor
Allowable Utilization
Grazing Capacity in AUMs
Greasy West 45 Sat. 4 0 NC 300 TES 0 0 0.0
Greasy West 457 Imp. 1 2,061 PC 141 FD 1 0.35 127.1
Greasy West 457 Imp. 2 196 PC 141 FD 0.7 0.35 8.5
Greasy West 457 Imp. 3 5 PC 141 FD 0.4 0.35 0.1
Greasy West 457 Imp. 4 2 NC 141 FD 0 0 0.0
Greasy West 418 UnSat. 1 661 NC 85 FD 1 0 0.0
Greasy West 418 UnSat. 2 476 NC 85 FD 0.7 0 0.0
Greasy West 418 UnSat. 3 21 NC 85 FD 0.4 0 0.0
Greasy West 418 UnSat. 4 5 NC 85 FD 0 0 0.0
Greasy West 414 UnSat. 1 87 PC 111 FD 1 0 0.0
Greasy West 414 UnSat. 2 11 PC 111 FD 0.7 0 0.0
Greasy West 417 Imp. 1 935 PC 111 FD 1 0.35 45.4
Greasy West 417 Imp. 2 88 PC 111 FD 0.7 0.35 3.0
Greasy West 417 Imp. 3 0 PC 111 FD 0.4 0.35 0.0
Greasy West 417 Imp. 4 0 NC 111 FD 0 0 0.0
Greasy West 403 Imp. 1 392 PC 196 FD 1 0.35 33.6
Greasy West 403 Imp. 2 23 PC 196 FD 0.7 0.35 1.4
Greasy West 471 Sat./Unstable 1 2 NC 100 TES 1 0 0.0
Greasy West 471 Sat./Unstable 2 8 NC 100 TES 0.7 0 0.0
Greasy West 471 Sat./Unstable 3 3 NC 100 TES 0.4 0 0.0
Greasy West 471 Sat./Unstable 4 3 NC 100 TES 0 0 0.0
Greasy West 458 Imp. 1 167 PC 145 FD 1 0.35 10.6
Greasy West 458 Imp. 2 128 PC 145 FD 0.7 0.35 5.7
Greasy West 458 Imp. 3 5 PC 145 FD 0.4 0.35 0.1
Greasy West 458 Imp. 4 1 NC 145 FD 0 0 0.0
Greasy West 416 Imp. 1 671 PC 145 FD 1 0.35 42.6

95
Winter Pasture TES Unit
Soil Condition
Slope Class
NFS Acres
Range Capability
Class FP
FP Source
Slope Reduction
Factor
Allowable Utilization
Grazing Capacity in AUMs
Greasy West 416 Imp. 2 519 PC 145 FD 0.7 0.35 23.0
Greasy West 416 Imp. 3 65 PC 145 FD 0.4 0.35 1.6
Greasy West 416 Imp. 4 68 NC 145 FD 0 0 0.0
Greasy West 420 Imp. 1 15 PC 208 FD 1 0.35 1.4
Greasy West 420 Imp. 2 57 PC 208 FD 0.7 0.35 3.6
Greasy West 420 Imp. 3 3 PC 208 FD 0.4 0.35 0.1
Greasy West NFS Acres 6,680 Greasy West Estimated Grazing Capacity 309
Red 448 Imp. 1 2 PC 323 FD 1 0.35 0.3
Red 448 Imp. 2 3 PC 323 FD 0.7 0.35 0.3
Red 448 Imp. 3 0 PC 323 FD 0.4 0.35 0.0
Red 448 Sat./Unstable 4 0 NC 323 FD 0 0 0.0
Red 418 UnSat. 1 203 NC 85 FD 1 0 0.0
Red 418 UnSat. 2 51 NC 85 FD 0.7 0 0.0
Red 418 UnSat. 3 2 NC 85 FD 0.4 0 0.0
Red 418 UnSat. 4 1 NC 85 FD 0 0 0.0
Red 417 Imp. 1 454 PC 111 FD 1 0.35 22.0
Red 417 Imp. 2 9 PC 111 FD 0.7 0.35 0.3
Red 417 Imp. 3 0 PC 111 FD 0.4 0.35 0.0
Red 403 Imp. 1 333 PC 196 FD 1 0.35 28.6
Red 403 Imp. 2 23 PC 196 FD 0.7 0.35 1.4
Red 403 Imp. 3 0 PC 196 FD 0.4 0.35 0.0
Red 416 Imp. 1 2 PC 145 FD 1 0.35 0.1
Red 416 Imp. 2 2 PC 145 FD 0.7 0.35 0.1
Red NFS Acres 1,085 Red Estimated Grazing Capacity 53
Duff Mesa 457 Imp. 1 212 PC 141 FD 1 0.35 13.1
Duff Mesa 457 Imp. 2 120 PC 141 FD 0.7 0.35 5.2

96
Winter Pasture TES Unit
Soil Condition
Slope Class
NFS Acres
Range Capability
Class FP
FP Source
Slope Reduction
Factor
Allowable Utilization
Grazing Capacity in AUMs
Duff Mesa 457 Imp. 3 6 PC 141 FD 0.4 0.35 0.1
Duff Mesa 457 Imp. 4 3 NC 141 FD 0 0 0.0
Duff Mesa 34 Imp. 4 0 NC 175 TES 0 0 0.0
Duff Mesa 381 Imp. 1 1,413 PC 339 FD 1 0.35 209.6
Duff Mesa 381 Imp. 2 133 PC 339 FD 0.7 0.35 13.8
Duff Mesa 381 Imp. 3 2 PC 339 FD 0.4 0.35 0.1
Duff Mesa 381 Imp. 4 1 NC 339 FD 0 0 0.0
Duff Mesa 463 Imp. 1 9 PC 112 FD 1 0.35 0.4
Duff Mesa 463 Imp. 2 25 PC 112 FD 0.7 0.35 0.9
Duff Mesa 463 Imp. 3 6 PC 112 FD 0.4 0.35 0.1
Duff Mesa 463 Imp. 4 12 NC 112 FD 0 0 0.0
Duff Mesa 414 Imp. 1 37 PC 111 FD 1 0.35 1.8
Duff Mesa 414 Imp. 2 27 PC 111 FD 0.7 0.35 0.9
Duff Mesa 414 Imp. 3 4 PC 111 FD 0.4 0.35 0.1
Duff Mesa 414 Imp. 4 3 NC 111 FD 0 0 0.0
Duff Mesa 404 Imp. 2 13 PC 196 FD 0.7 0.35 0.8
Duff Mesa 404 Imp. 3 7 PC 196 FD 0.4 0.35 0.2
Duff Mesa 404 Imp. 4 4 NC 196 FD 0 0 0.0
Duff Mesa 383 Imp. 1 122 PC 200 TES 1 0.35 10.7
Duff Mesa 383 Imp. 2 14 PC 200 TES 0.7 0.35 0.9
Duff Mesa 383 Imp. 3 0 PC 200 TES 0.4 0.35 0.0
Duff Mesa 403 Imp. 1 37 PC 196 FD 1 0.35 3.2
Duff Mesa 403 Imp. 2 21 PC 196 FD 0.7 0.35 1.3
Duff Mesa 403 Imp. 3 0 PC 196 FD 0.4 0.35 0.0
Duff Mesa 471 Sat./Unstable 1 3 NC 100 TES 1 0 0.0
Duff Mesa 471 Sat./Unstable 2 21 NC 100 TES 0.7 0 0.0

97
Winter Pasture TES Unit
Soil Condition
Slope Class
NFS Acres
Range Capability
Class FP
FP Source
Slope Reduction
Factor
Allowable Utilization
Grazing Capacity in AUMs
Duff Mesa 471 Sat./Unstable 3 27 NC 100 TES 0.4 0 0.0
Duff Mesa 471 Sat./Unstable 4 93 NC 100 TES 0 0 0.0
Duff Mesa 385 Imp. 1 109 PC 522 FD 1 0.35 24.9
Duff Mesa 385 Imp. 2 130 PC 522 FD 0.7 0.35 20.8
Duff Mesa 385 Imp. 3 12 PC 522 FD 0.4 0.35 1.1
Duff Mesa 385 Imp. 4 1 NC 522 FD 0 0 0.0
Duff Mesa 430 Sat./Unstable 1 5 NC 208 FD 1 0 0.0
Duff Mesa 430 Sat./Unstable 2 101 NC 208 FD 0.7 0 0.0
Duff Mesa 430 Sat./Unstable 3 96 NC 208 FD 0.4 0 0.0
Duff Mesa 430 Sat./Unstable 4 323 NC 208 FD 0 0 0.0
Duff Mesa 33 Imp. 1 13 PC 350 TES 1 0.35 2.0
Duff Mesa 33 Imp. 2 13 PC 350 TES 0.7 0.35 1.4
Duff Mesa 33 Imp. 3 4 PC 350 TES 0.4 0.35 0.2
Duff Mesa 33 Imp. 4 23 NC 350 TES 0 0 0.0
Duff Mesa 350 Sat. 1 27 FC 659 FD 1 0.35 7.8
Duff Mesa 350 Sat. 2 179 FC 659 FD 0.7 0.35 36.1
Duff Mesa 350 Sat. 3 82 FC 659 FD 0.4 0.35 9.5
Duff Mesa 350 Sat./Unstable 4 156 NC 659 FD 0 0 0.0
Duff Mesa 416 Imp. 1 214 PC 145 FD 1 0.35 13.6
Duff Mesa 416 Imp. 2 551 PC 145 FD 0.7 0.35 24.5
Duff Mesa 416 Imp. 3 107 PC 145 FD 0.4 0.35 2.7
Duff Mesa 416 Imp. 4 58 NC 145 FD 0 0 0.0
Duff Mesa 420 Imp. 1 60 PC 208 FD 1 0.35 5.5
Duff Mesa 420 Imp. 2 158 PC 208 FD 0.7 0.35 10.1
Duff Mesa 420 Imp. 3 33 PC 208 FD 0.4 0.35 1.2
Duff Mesa 420 Imp. 4 12 NC 208 FD 0 0 0.0

98
Winter Pasture TES Unit
Soil Condition
Slope Class
NFS Acres
Range Capability
Class FP
FP Source
Slope Reduction
Factor
Allowable Utilization
Grazing Capacity in AUMs
Duff Mesa NFS Acres 4,842 Duff Mesa Estimated Grazing Capacity 449
Greasy East 45 Sat. 1 95 FC 300 TES 1 0.35 12.5
Greasy East 45 Sat. 2 32 FC 300 TES 0.7 0.35 2.9
Greasy East 45 Sat. 3 7 FC 300 TES 0.4 0.35 0.4
Greasy East 45 Sat. 4 13 NC 300 TES 0 0 0.0
Greasy East 457 Imp. 1 1,526 PC 141 FD 1 0.35 94.1
Greasy East 457 Imp. 2 417 PC 141 FD 0.7 0.35 18.0
Greasy East 457 Imp. 3 3 PC 141 FD 0.4 0.35 0.1
Greasy East 457 Imp. 4 0 NC 141 FD 0 0 0.0
Greasy East 463 Imp. 1 6 PC 112 FD 1 0.35 0.3
Greasy East 463 Imp. 2 21 PC 112 FD 0.7 0.35 0.7
Greasy East 463 Imp. 3 3 PC 112 FD 0.4 0.35 0.1
Greasy East 463 Imp. 4 1 NC 112 FD 0 0 0.0
Greasy East 414 UnSat. 2 0 PC 111 FD 0.7 0 0.0
Greasy East 402 UnSat. 1 0 PC 196 FD 1 0 0.0
Greasy East 402 UnSat. 2 1 PC 196 FD 0.7 0 0.0
Greasy East 403 Imp. 1 317 PC 196 FD 1 0.35 27.2
Greasy East 403 Imp. 2 23 PC 196 FD 0.7 0.35 1.4
Greasy East 403 Imp. 3 1 PC 196 FD 0.4 0.35 0.0
Greasy East 403 Imp. 4 0 NC 196 FD 0 0 0.0
Greasy East 471 Sat./Unstable 2 0 NC 100 TES 0.7 0 0.0
Greasy East 471 Sat./Unstable 3 0 NC 100 TES 0.4 0 0.0
Greasy East 471 Sat./Unstable 4 4 NC 100 TES 0 0 0.0
Greasy East 458 Imp. 1 1,459 PC 145 FD 1 0.35 92.6
Greasy East 458 Imp. 2 1,740 PC 145 FD 0.7 0.35 77.3
Greasy East 458 Imp. 3 277 PC 145 FD 0.4 0.35 7.0

99
Winter Pasture TES Unit
Soil Condition
Slope Class
NFS Acres
Range Capability
Class FP
FP Source
Slope Reduction
Factor
Allowable Utilization
Grazing Capacity in AUMs
Greasy East 458 Imp. 4 253 NC 145 FD 0 0 0.0
Greasy East 420 Imp. 1 25 PC 208 FD 1 0.35 2.3
Greasy East 420 Imp. 2 170 PC 208 FD 0.7 0.35 10.8
Greasy East 420 Imp. 3 75 PC 208 FD 0.4 0.35 2.7
Greasy East 420 Imp. 4 54 NC 208 FD 0 0 0.0
Greasy East NFS Acres 6,523 Greasy East Estimated Grazing Capacity 350
DK Unit 418 UnSat. 1 378 NC 85 FD 1 0 0.0
DK Unit 418 UnSat. 2 59 NC 85 FD 0.7 0 0.0
DK Unit 418 UnSat. 3 0 NC 85 FD 0.4 0 0.0
DK Unit 418 UnSat. 4 0 NC 85 FD 0 0 0.0
DK Unit 403 Imp. 1 1,013 PC 196 FD 1 0.35 86.9
DK Unit 403 Imp. 2 33 PC 196 FD 0.7 0.35 2.0
DK Unit 403 Imp. 3 0 PC 196 FD 0.4 0.35 0.0
DK Unit 403 Imp. 4 0 NC 196 FD 0 0 0.0
DK Unit 350 Sat. 1 1 FC 659 FD 1 0.35 0.3
DK Unit 350 Sat. 2 0 FC 659 FD 0.7 0.35 0.0
DK Unit 420 Imp. 1 1 PC 208 FD 1 0.35 0.1
DK Unit 420 Imp. 2 0 PC 208 FD 0.7 0.35 0.0
DK Unit NFS Acres 1,485 DK Unit Estimated Grazing Capacity 89
Duff Flat 448 Imp. 1 134 PC 323 FD 1 0.35 18.9
Duff Flat 448 Imp. 2 247 PC 323 FD 0.7 0.35 24.4
Duff Flat 448 Imp. 3 7 PC 323 FD 0.4 0.35 0.4
Duff Flat 448 Sat./Unstable 4 6 NC 323 FD 0 0 0.0
Duff Flat 34 Imp. 2 0 PC 175 TES 0.7 0.35 0.0
Duff Flat 34 Imp. 3 0 PC 175 TES 0.4 0.35 0.0
Duff Flat 381 Imp. 1 1,047 PC 339 FD 1 0.35 155.3
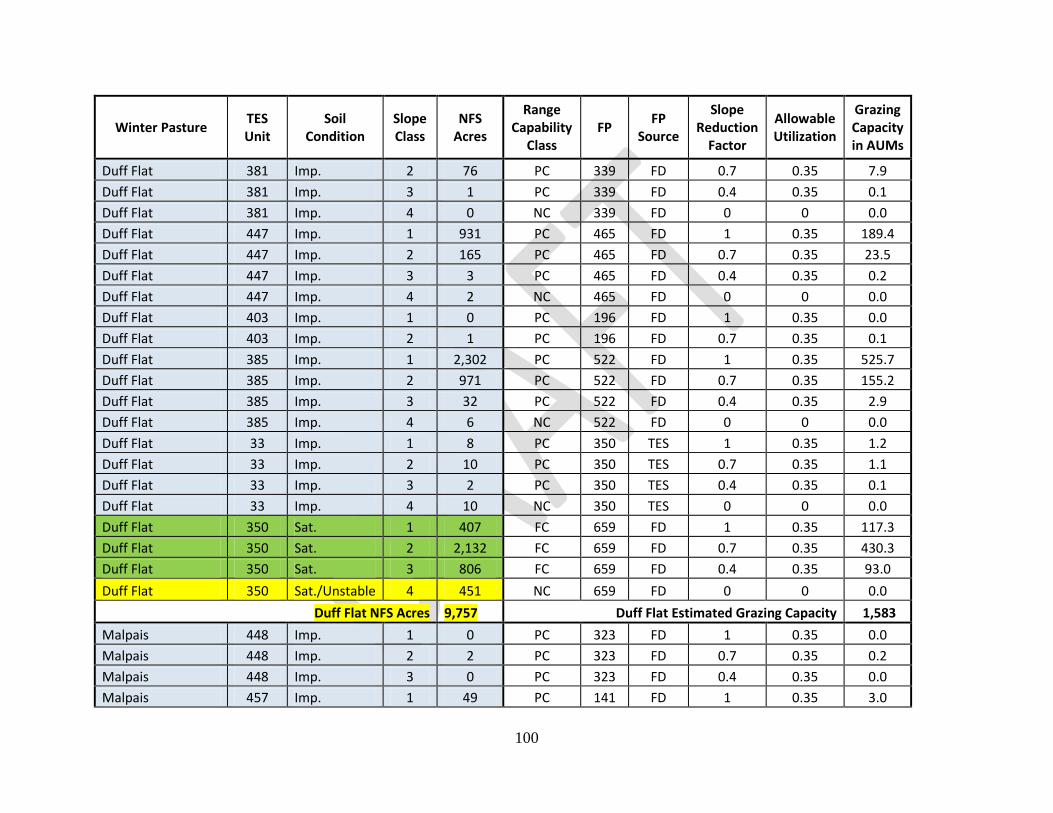
100
Winter Pasture TES Unit
Soil Condition
Slope Class
NFS Acres
Range Capability
Class FP
FP Source
Slope Reduction
Factor
Allowable Utilization
Grazing Capacity in AUMs
Duff Flat 381 Imp. 2 76 PC 339 FD 0.7 0.35 7.9
Duff Flat 381 Imp. 3 1 PC 339 FD 0.4 0.35 0.1
Duff Flat 381 Imp. 4 0 NC 339 FD 0 0 0.0
Duff Flat 447 Imp. 1 931 PC 465 FD 1 0.35 189.4
Duff Flat 447 Imp. 2 165 PC 465 FD 0.7 0.35 23.5
Duff Flat 447 Imp. 3 3 PC 465 FD 0.4 0.35 0.2
Duff Flat 447 Imp. 4 2 NC 465 FD 0 0 0.0
Duff Flat 403 Imp. 1 0 PC 196 FD 1 0.35 0.0
Duff Flat 403 Imp. 2 1 PC 196 FD 0.7 0.35 0.1
Duff Flat 385 Imp. 1 2,302 PC 522 FD 1 0.35 525.7
Duff Flat 385 Imp. 2 971 PC 522 FD 0.7 0.35 155.2
Duff Flat 385 Imp. 3 32 PC 522 FD 0.4 0.35 2.9
Duff Flat 385 Imp. 4 6 NC 522 FD 0 0 0.0
Duff Flat 33 Imp. 1 8 PC 350 TES 1 0.35 1.2
Duff Flat 33 Imp. 2 10 PC 350 TES 0.7 0.35 1.1
Duff Flat 33 Imp. 3 2 PC 350 TES 0.4 0.35 0.1
Duff Flat 33 Imp. 4 10 NC 350 TES 0 0 0.0
Duff Flat 350 Sat. 1 407 FC 659 FD 1 0.35 117.3
Duff Flat 350 Sat. 2 2,132 FC 659 FD 0.7 0.35 430.3
Duff Flat 350 Sat. 3 806 FC 659 FD 0.4 0.35 93.0
Duff Flat 350 Sat./Unstable 4 451 NC 659 FD 0 0 0.0
Duff Flat NFS Acres 9,757 Duff Flat Estimated Grazing Capacity 1,583
Malpais 448 Imp. 1 0 PC 323 FD 1 0.35 0.0
Malpais 448 Imp. 2 2 PC 323 FD 0.7 0.35 0.2
Malpais 448 Imp. 3 0 PC 323 FD 0.4 0.35 0.0
Malpais 457 Imp. 1 49 PC 141 FD 1 0.35 3.0

101
Winter Pasture TES Unit
Soil Condition
Slope Class
NFS Acres
Range Capability
Class FP
FP Source
Slope Reduction
Factor
Allowable Utilization
Grazing Capacity in AUMs
Malpais 457 Imp. 2 5 PC 141 FD 0.7 0.35 0.2
Malpais 414 Imp. 1 1,388 PC 111 FD 1 0.35 67.4
Malpais 414 Imp. 2 168 PC 111 FD 0.7 0.35 5.7
Malpais 414 Imp. 3 1 PC 111 FD 0.4 0.35 0.0
Malpais 414 Imp. 4 0 NC 111 FD 0 0 0.0
Malpais 447 Imp. 1 19 PC 465 FD 1 0.35 3.9
Malpais 447 Imp. 2 3 PC 465 FD 0.7 0.35 0.4
Malpais 402 UnSat. 1 248 PC 196 FD 1 0 0.0
Malpais 402 UnSat. 2 29 PC 196 FD 0.7 0 0.0
Malpais 402 UnSat. 3 0 PC 196 FD 0.4 0 0.0
Malpais 403 Imp. 1 300 PC 196 FD 1 0.35 25.7
Malpais 403 Imp. 2 18 PC 196 FD 0.7 0.35 1.1
Malpais 403 Imp. 3 0 PC 196 FD 0.4 0.35 0.0
Malpais 403 Imp. 4 0 NC 196 FD 0 0 0.0
Malpais 458 Imp. 1 5 PC 145 FD 1 0.35 0.3
Malpais 458 Imp. 2 6 PC 145 FD 0.7 0.35 0.3
Malpais 458 Imp. 3 0 PC 145 FD 0.4 0.35 0.0
Malpais 458 Imp. 4 0 NC 145 FD 0 0 0.0
Malpais 420 Imp. 1 668 PC 208 FD 1 0.35 60.8
Malpais 420 Imp. 2 997 PC 208 FD 0.7 0.35 63.5
Malpais 420 Imp. 3 119 PC 208 FD 0.4 0.35 4.3
Malpais 420 Imp. 4 73 NC 208 FD 0 0 0.0
Malpais NFS Acres 4,098 Malpais Estimated Grazing Capacity 236
Dutch Kid 448 Imp. 1 63 PC 323 FD 1 0.35 8.9
Dutch Kid 448 Imp. 2 364 PC 323 FD 0.7 0.35 36.0
Dutch Kid 448 Imp. 3 78 PC 323 FD 0.4 0.35 4.4

102
Winter Pasture TES Unit
Soil Condition
Slope Class
NFS Acres
Range Capability
Class FP
FP Source
Slope Reduction
Factor
Allowable Utilization
Grazing Capacity in AUMs
Dutch Kid 448 Sat./Unstable 4 33 NC 323 FD 0 0 0.0
Dutch Kid 381 Imp. 1 812 PC 339 FD 1 0.35 120.4
Dutch Kid 381 Imp. 2 35 PC 339 FD 0.7 0.35 3.6
Dutch Kid 381 Imp. 3 0 PC 339 FD 0.4 0.35 0.0
Dutch Kid 381 Imp. 4 0 NC 339 FD 0 0 0.0
Dutch Kid 414 UnSat. 1 38 PC 111 FD 1 0 0.0
Dutch Kid 414 UnSat. 2 16 PC 111 FD 0.7 0 0.0
Dutch Kid 447 Imp. 1 141 PC 465 FD 1 0.35 28.7
Dutch Kid 447 Imp. 2 47 PC 465 FD 0.7 0.35 6.7
Dutch Kid 447 Imp. 3 0 PC 465 FD 0.4 0.35 0.0
Dutch Kid 447 Imp. 4 0 NC 465 FD 0 0 0.0
Dutch Kid 403 Imp. 1 562 PC 196 FD 1 0.35 48.2
Dutch Kid 403 Imp. 2 52 PC 196 FD 0.7 0.35 3.1
Dutch Kid 403 Imp. 3 0 PC 196 FD 0.4 0.35 0.0
Dutch Kid 420 Imp. 1 110 PC 208 FD 1 0.35 10.0
Dutch Kid 420 Imp. 2 160 PC 208 FD 0.7 0.35 10.2
Dutch Kid 420 Imp. 3 9 PC 208 FD 0.4 0.35 0.3
Dutch Kid 420 Imp. 4 3 NC 208 FD 0 0 0.0
Dutch Kid NFS Acres 2,523 Dutch Kid Estimated Grazing Capacity 306
Strip 414 Imp. 1 244 PC 111 FD 1 0.35 11.8
Strip 414 Imp. 2 17 PC 111 FD 0.7 0.35 0.6
Strip 414 Imp. 3 0 PC 111 FD 0.4 0.35 0.0
Strip 402 UnSat. 1 148 PC 196 FD 1 0 0.0
Strip 402 UnSat. 2 68 PC 196 FD 0.7 0 0.0
Strip 402 UnSat. 3 1 PC 196 FD 0.4 0 0.0
Strip 402 UnSat. 4 0 NC 196 FD 0 0 0.0

103
Winter Pasture TES Unit
Soil Condition
Slope Class
NFS Acres
Range Capability
Class FP
FP Source
Slope Reduction
Factor
Allowable Utilization
Grazing Capacity in AUMs
Strip 403 Imp. 1 68 PC 196 FD 1 0.35 5.8
Strip 403 Imp. 2 6 PC 196 FD 0.7 0.35 0.4
Strip 403 Imp. 3 0 PC 196 FD 0.4 0.35 0.0
Strip 403 Imp. 4 0 NC 196 FD 0 0 0.0
Strip 420 Imp. 1 154 PC 208 FD 1 0.35 14.0
Strip 420 Imp. 2 329 PC 208 FD 0.7 0.35 21.0
Strip 420 Imp. 3 74 PC 208 FD 0.4 0.35 2.7
Strip 420 Imp. 4 71 NC 208 FD 0 0 0.0
Strip NFS Acres 1,180 Strip Estimated Grazing Capacity 56
North Gyberg 448 Imp. 1 19 PC 323 FD 1 0.35 2.7
North Gyberg 448 Imp. 2 63 PC 323 FD 0.7 0.35 6.2
North Gyberg 448 Imp. 3 31 PC 323 FD 0.4 0.35 1.8
North Gyberg 448 Sat./Unstable 4 17 NC 323 FD 0 0 0.0
North Gyberg 381 Imp. 1 801 PC 339 FD 1 0.35 118.8
North Gyberg 381 Imp. 2 34 PC 339 FD 0.7 0.35 3.5
North Gyberg 381 Imp. 3 0 PC 339 FD 0.4 0.35 0.0
North Gyberg 447 Imp. 1 56 PC 465 FD 1 0.35 11.4
North Gyberg 447 Imp. 2 14 PC 465 FD 0.7 0.35 2.0
North Gyberg 447 Imp. 3 0 PC 465 FD 0.4 0.35 0.0
North Gyberg 447 Imp. 4 0 NC 465 FD 0 0 0.0
North Gyberg 403 Imp. 1 1 PC 196 FD 1 0.35 0.1
North Gyberg 403 Imp. 2 1 PC 196 FD 0.7 0.35 0.1
North Gyberg 280 UnSat. 1 14 PC 111 FD 1 0 0.0
North Gyberg 280 UnSat. 2 0 PC 111 FD 0.7 0 0.0
North Gyberg 385 Imp. 1 280 PC 522 FD 1 0.35 63.9
North Gyberg 385 Imp. 2 129 PC 522 FD 0.7 0.35 20.6

104
Winter Pasture TES Unit
Soil Condition
Slope Class
NFS Acres
Range Capability
Class FP
FP Source
Slope Reduction
Factor
Allowable Utilization
Grazing Capacity in AUMs
North Gyberg 385 Imp. 3 2 PC 522 FD 0.4 0.35 0.2
North Gyberg 385 Imp. 4 0 NC 522 FD 0 0 0.0
North Gyberg 350 Sat. 1 69 FC 659 FD 1 0.35 19.9
North Gyberg 350 Sat. 2 392 FC 659 FD 0.7 0.35 79.1
North Gyberg 350 Sat. 3 159 FC 659 FD 0.4 0.35 18.3
North Gyberg 350 Sat./Unstable 4 86 NC 659 FD 0 0 0.0
North Gyberg NFS Acres 2,168 North Gyberg Estimated Grazing Capacity 348
Sheepshead Holding 448 Imp. 1 25 PC 323 FD 1 0.35 3.5
Sheepshead Holding 448 Imp. 2 37 PC 323 FD 0.7 0.35 3.7
Sheepshead Holding 448 Imp. 3 0 PC 323 FD 0.4 0.35 0.0
Sheepshead Holding 381 Imp. 1 80 PC 339 FD 1 0.35 11.9
Sheepshead Holding 381 Imp. 2 16 PC 339 FD 0.7 0.35 1.7
Sheepshead Holding 381 Imp. 3 0 PC 339 FD 0.4 0.35 0.0
Sheepshead Holding 414 UnSat. 1 13 PC 111 FD 1 0 0.0
Sheepshead Holding 414 UnSat. 2 3 PC 111 FD 0.7 0 0.0
Sheepshead Holding 402 UnSat. 1 1 PC 196 FD 1 0 0.0
Sheepshead Holding 402 UnSat. 2 1 PC 196 FD 0.7 0 0.0
Sheepshead Holding 402 UnSat. 3 0 PC 196 FD 0.4 0 0.0
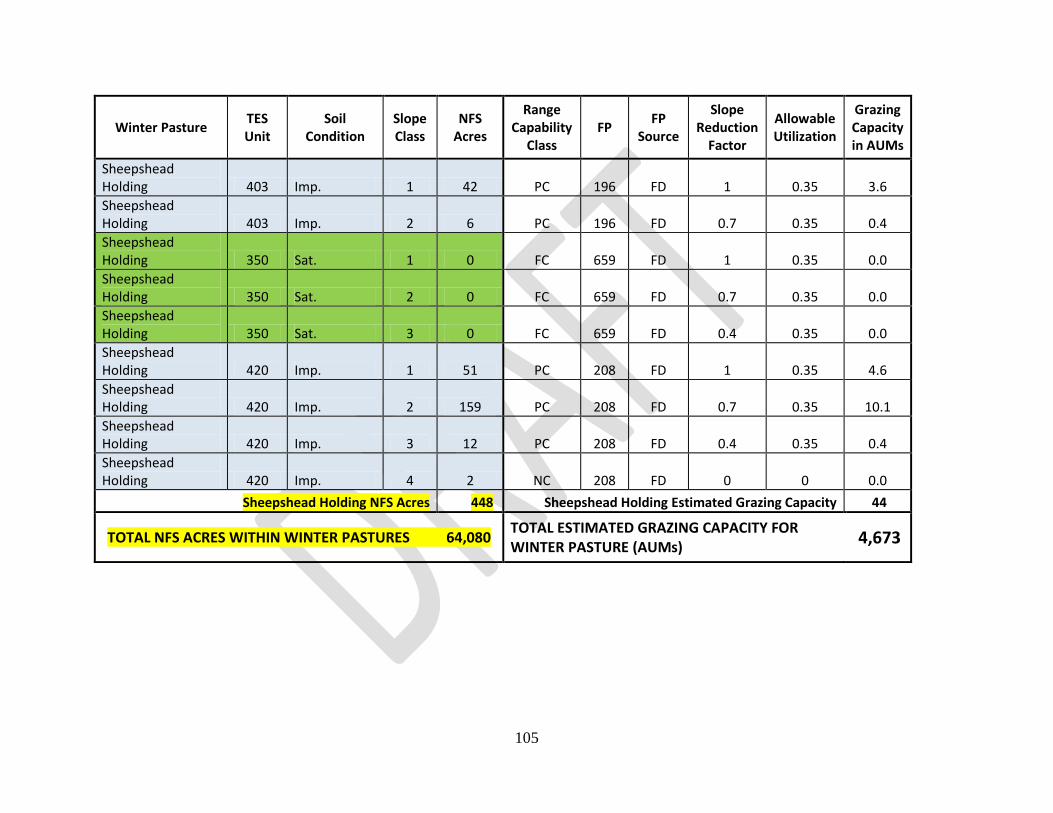
105
Winter Pasture TES Unit
Soil Condition
Slope Class
NFS Acres
Range Capability
Class FP
FP Source
Slope Reduction
Factor
Allowable Utilization
Grazing Capacity in AUMs
Sheepshead Holding 403 Imp. 1 42 PC 196 FD 1 0.35 3.6
Sheepshead Holding 403 Imp. 2 6 PC 196 FD 0.7 0.35 0.4
Sheepshead Holding 350 Sat. 1 0 FC 659 FD 1 0.35 0.0
Sheepshead Holding 350 Sat. 2 0 FC 659 FD 0.7 0.35 0.0
Sheepshead Holding 350 Sat. 3 0 FC 659 FD 0.4 0.35 0.0
Sheepshead Holding 420 Imp. 1 51 PC 208 FD 1 0.35 4.6
Sheepshead Holding 420 Imp. 2 159 PC 208 FD 0.7 0.35 10.1
Sheepshead Holding 420 Imp. 3 12 PC 208 FD 0.4 0.35 0.4
Sheepshead Holding 420 Imp. 4 2 NC 208 FD 0 0 0.0
Sheepshead Holding NFS Acres 448 Sheepshead Holding Estimated Grazing Capacity 44
TOTAL NFS ACRES WITHIN WINTER PASTURES 64,080 TOTAL ESTIMATED GRAZING CAPACITY FOR WINTER PASTURE (AUMs) 4,673
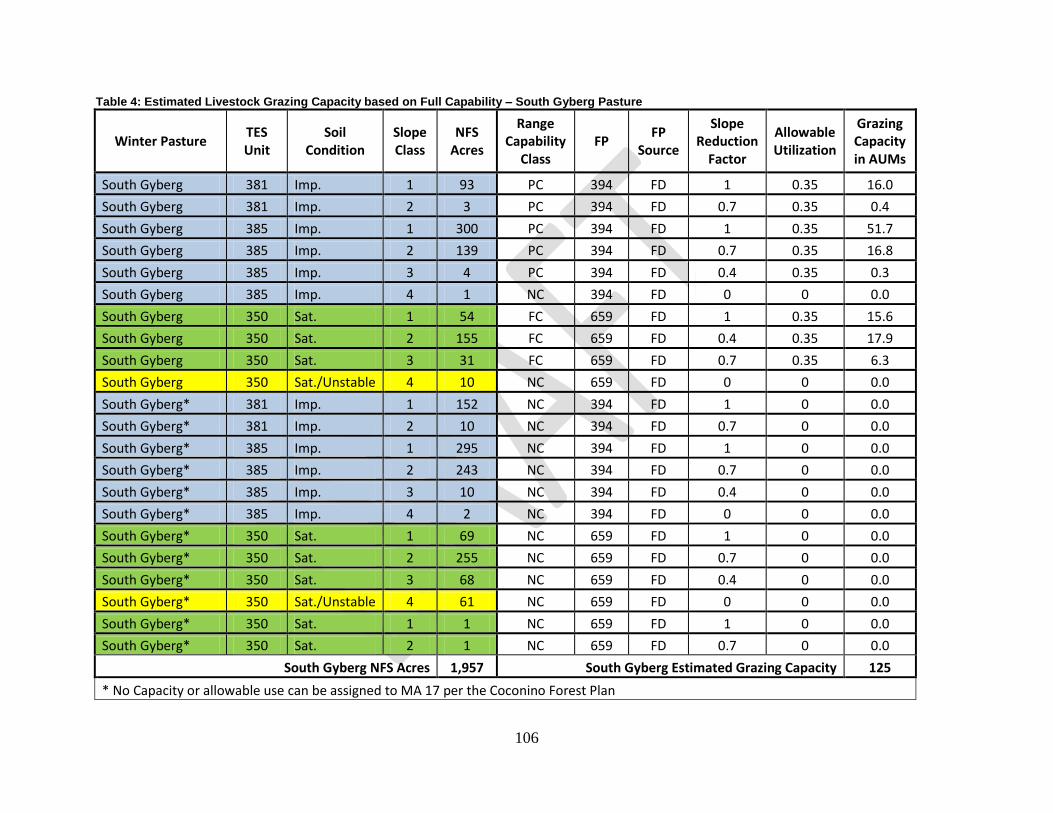
106
Table 4: Estimated Livestock Grazing Capacity based on Full Capability – South Gyberg Pasture
Winter Pasture TES Unit
Soil Condition
Slope Class
NFS Acres
Range Capability
Class FP
FP Source
Slope Reduction
Factor
Allowable Utilization
Grazing Capacity in AUMs
South Gyberg 381 Imp. 1 93 PC 394 FD 1 0.35 16.0
South Gyberg 381 Imp. 2 3 PC 394 FD 0.7 0.35 0.4
South Gyberg 385 Imp. 1 300 PC 394 FD 1 0.35 51.7
South Gyberg 385 Imp. 2 139 PC 394 FD 0.7 0.35 16.8
South Gyberg 385 Imp. 3 4 PC 394 FD 0.4 0.35 0.3
South Gyberg 385 Imp. 4 1 NC 394 FD 0 0 0.0
South Gyberg 350 Sat. 1 54 FC 659 FD 1 0.35 15.6
South Gyberg 350 Sat. 2 155 FC 659 FD 0.4 0.35 17.9
South Gyberg 350 Sat. 3 31 FC 659 FD 0.7 0.35 6.3
South Gyberg 350 Sat./Unstable 4 10 NC 659 FD 0 0 0.0
South Gyberg* 381 Imp. 1 152 NC 394 FD 1 0 0.0
South Gyberg* 381 Imp. 2 10 NC 394 FD 0.7 0 0.0
South Gyberg* 385 Imp. 1 295 NC 394 FD 1 0 0.0
South Gyberg* 385 Imp. 2 243 NC 394 FD 0.7 0 0.0
South Gyberg* 385 Imp. 3 10 NC 394 FD 0.4 0 0.0
South Gyberg* 385 Imp. 4 2 NC 394 FD 0 0 0.0
South Gyberg* 350 Sat. 1 69 NC 659 FD 1 0 0.0
South Gyberg* 350 Sat. 2 255 NC 659 FD 0.7 0 0.0
South Gyberg* 350 Sat. 3 68 NC 659 FD 0.4 0 0.0
South Gyberg* 350 Sat./Unstable 4 61 NC 659 FD 0 0 0.0
South Gyberg* 350 Sat. 1 1 NC 659 FD 1 0 0.0
South Gyberg* 350 Sat. 2 1 NC 659 FD 0.7 0 0.0
South Gyberg NFS Acres 1,957 South Gyberg Estimated Grazing Capacity 125
* No Capacity or allowable use can be assigned to MA 17 per the Coconino Forest Plan

107
Table 5: Estimated Livestock and Elk Use (AUMs) Based on Potential Livestock Use Dates for Windmill West Summer
Pastures
Period of
Livestock Use
for Summer
Pastures 1
Livestock Use at
Maximum
Permitted
Numbers
(AUMs)
Estimated
Summer Elk
Use 2,3
(AUMs)
Total Livestock
and Estimated Elk
Summer Use
(AUMs)
Estimated
Capacity of
Summer Pastures
at 35% Use 4
(AUMs)
Estimated
Capacity Not
Used by
Livestock or Elk
(AUMs)
6/1 to 10/31 2,842 847 3,689 4,597 + 908
5/16 to 10/31 3,139 847 3,986 4,597 + 607
5/16 to 11/15 3,417 847 4,264 4,597 + 333 1) Periods of livestock use reflect a range of use periods that are likely to occur on the summer pastures of the Windmill West allotment.
2) Estimated Elk Use assumes that (a) the herd size is an average of 500 elk in the summer range (source: personal communication with L.
Luedeker 2013) (b) one elk has an animal unit equivalent of 0.6 (source: USDA National Range Handbook) (c) Period of elk use in the
summer range is assumed to average April 1 to November 30 (244 days) (d) Elk in this population range throughout game management unit
6B. In the summer elk range, since all habitat is fairly similar, it is assumed that the amount of forage utilized by elk within the Windmill
West summer pastures is approximately equivalent to the proportion of Unit 6B summer elk range that occurs on FS acres within the Windmill
West allotment (35.2%).
3) Deer, antelope and other wildlife are not considered here because they have little dietary overlap with livestock and are expected to have a
negligible effect on forage levels.
4) See Appendix D; Table 2.
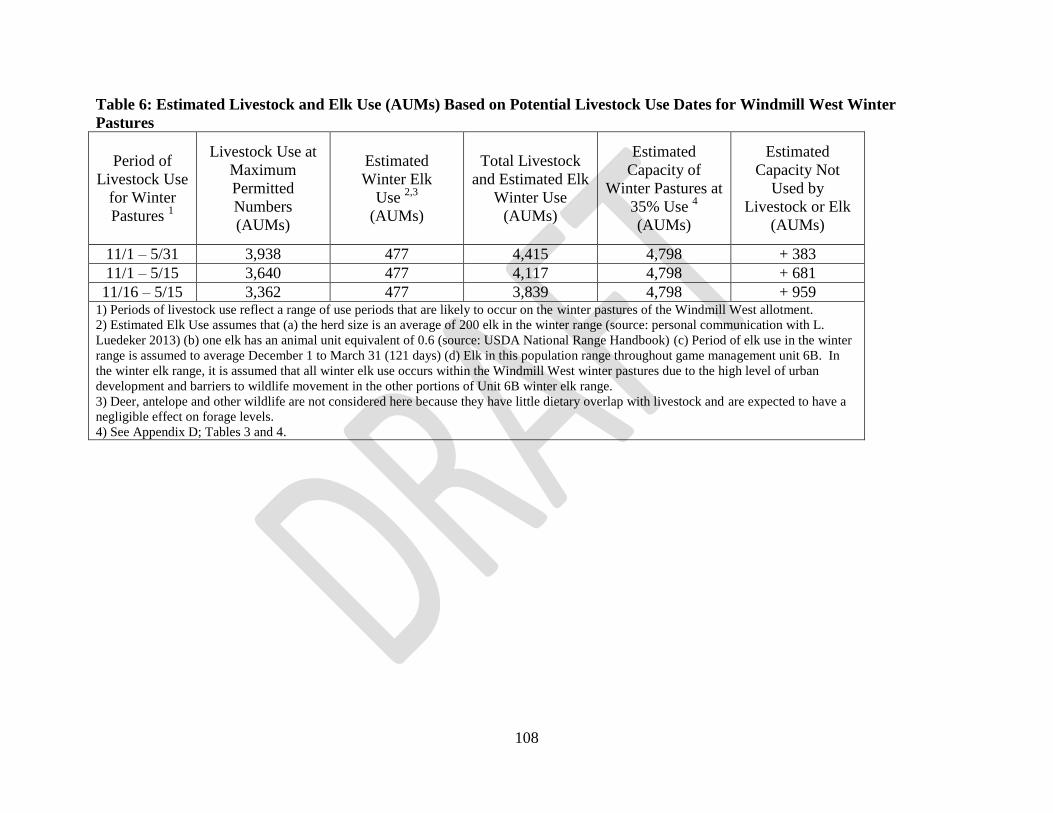
108
Table 6: Estimated Livestock and Elk Use (AUMs) Based on Potential Livestock Use Dates for Windmill West Winter
Pastures
Period of
Livestock Use
for Winter
Pastures 1
Livestock Use at
Maximum
Permitted
Numbers
(AUMs)
Estimated
Winter Elk
Use 2,3
(AUMs)
Total Livestock
and Estimated Elk
Winter Use
(AUMs)
Estimated
Capacity of
Winter Pastures at
35% Use 4
(AUMs)
Estimated
Capacity Not
Used by
Livestock or Elk
(AUMs)
11/1 – 5/31 3,938 477 4,415 4,798 + 383
11/1 – 5/15 3,640 477 4,117 4,798 + 681
11/16 – 5/15 3,362 477 3,839 4,798 + 959 1) Periods of livestock use reflect a range of use periods that are likely to occur on the winter pastures of the Windmill West allotment.
2) Estimated Elk Use assumes that (a) the herd size is an average of 200 elk in the winter range (source: personal communication with L.
Luedeker 2013) (b) one elk has an animal unit equivalent of 0.6 (source: USDA National Range Handbook) (c) Period of elk use in the winter
range is assumed to average December 1 to March 31 (121 days) (d) Elk in this population range throughout game management unit 6B. In
the winter elk range, it is assumed that all winter elk use occurs within the Windmill West winter pastures due to the high level of urban
development and barriers to wildlife movement in the other portions of Unit 6B winter elk range.
3) Deer, antelope and other wildlife are not considered here because they have little dietary overlap with livestock and are expected to have a
negligible effect on forage levels.
4) See Appendix D; Tables 3 and 4.

109
APPENDIX E: EXISTING AND DESIRED CONDITIONS
Table 1:
Windmill West Allotment - TES Unit 55
General Description: TES Unit 55 - Mountain grasslands located on valley plains on the northen region of the Windmill West allotment with a slope of 0-5%. Typical grass species includes blue grama,
carex, Arizona fescue, mountain muhly, spike muhly, mutton bluegrass, Kentucky bluegrass. There are approximately 1,300 acres in these aggregated TES units.
Vegetation Soil (Ground Cover %)
Potential Grasses Forbs Shrubs Trees
Condition 8-12 species 7-15 Species 0-1 Species 0-1 Species Bare Soil 10-15%
51-73% c. cover 3-16% c. cover <0.5% c. cover <0.5% c. cover Rock 5%
cool season species composition 50% Basal Vegetation 35-50%
warm season species composition 50% Effective Litter (>0.5") 40-50%
FEAR 5-30% c. cover Acmil 0.5-5% c. cover CHNA (P) PIPO *Effective Ground Cover 80-90%
POPR 10-30% c. cover POAN 0.1-5% c. cover
MUMO 5-10% c. cover ARFR 0.1-3% c. cover
Desired Condition Grasses Forbs Shrubs Trees
5-10 species 7-16 species 0-1 species 0-1 Species Bare soil 10-40%
39-73% c. cover 15-30% c. cover <0.5% c. cover <0.5% c. cover Rock 4%
cool season species composition 40-60% Basal Vegetation 25-50%
warm season species composition 40-60% Effective Litter (>.5") 5-30%
FEAR 0-30% c. cover Acmil 0.5-5% c. cover CHNA (P) PIPO *Effective Ground Cover >/=20%
POPR 10-30% c. cover POAN 0.1-5% c. cover
MUMO 2-10% c. cover ARFR 0.1-5% c. cover
Existing Condition Grasses Forbs Shrubs Trees
5 species 16 species 0 species 0 species Bare Soil 49%
39% c. cover 37% c. cover 0 0% Rock 4%
cool season species composition 40% Basal Vegetation 25%
warm season species composition 60% Effective Litter (>0.5") 1%
FEAR 0% c. cover Acmil 2% c. cover *Effective Ground Cover 26%
POPR 10% c. cover POAN 3% c. cover
MUMO 2% c. cover ARFR 0.2% c. cover
Rangeland Capability Potential capabilty with production >100lbs/acre and slopes less than 40% on 1,300 acres
Trend
Soil Cond. Rating Impaired for all acres in this TEU group.
Objectives Maintain or improve existing conditions while grazing cattle. Reduce Ponderosa pine overstory to promote understory vegetation.
Monitoring Continue monitoring of frequency and ground cover plots at long term sites to determine trend.
*Effective Ground Cover = Basal Vegetation + Litter >0.5"
c. cover = Canopy Cover

110
Table 2: Windmill West Allotment - TES Unit 350
General Description: TES Unit 350 - Desert shrubland located on hills/escarpments on the southern region of the Windmill West allotment with a slope of 35-40%. Typical grass species includes three
awn, black grama and stipa comata. There are approximately 5,000 acres in this TEU; 4,200 acres on slopes less than 40% and 800 acres on slopes greater than 40%.
Vegetation Soil (Ground Cover %)
Potential Grasses Forbs Shrubs Trees Bare Soil 15-20%
Condition 12 Species 4-5 Species 16 Species 1 Specie Rock 60-65%
24-26% c. cover 2-3% c. cover 14-19% c. cover 2% c. cover Basal Vegetation 10%
Cool season species composition 33% Effective Litter (>0.5") 10%
Warm season species composition 67% *Effective Ground Cover 20%
Arist 5% c. cover GUSA <0.5-1% c. cover CAHO 8-12% c. cover JUER 2% c. cover
BOCU 2% c.c over ERCI 0.5% c. cover BEHA 2% c. cover
Stipa 10-12% c. cover ERWR 0.5% c. cover Krpag 1% c. cover
Desired Condition 4-10 Species 4-8 Species 9-12 Species 1-2 Species Bare Soil 11-20%
15-24% c. cover 1-3% c. cover 14-19% c. cover 2-25% c. cover Rock 58-72%
Cool season species composition 10-25% Basal Vegetation 6-11%
Warm season species composition 67-80% Effective Litter (>0.5") 2-8%
Arist 2-5% c. cover GUSA <0.5-2% c. cover CAHO 4-8% c. cover JUER <0.5-2% c. cover
*Effective Ground Cover
>/=25%
BOCU 2-4% c. cover ERCI <0.5-0.5% c. cover BEHA <0.5-2% c. cover JUMO 0-25% c. cover
Stipe 1-8% c. cover ERWR <0.5-0.5% c. cover Krpag <0.5-1% c. cover PIED <0.5-2% c. cover
Existing Condition 3-5 Species 4-8 Species 9-10 Species 1-2 Species Bare Soil 11-13%
11-20% c. cover 1-2% c. cover 14-17% c. cover 6-36% c. cover Rock 58-72%
Cool season species composition 0-20% Basal Vegetation 6-11%
Warm season species composition 80-100% Effective Litter (>0.5") 0%
Arist 2-3% c. cover GUSA <0.5-2% c. cover CAHO 4-8% c. cover JUER 0% c. cover *Effective Ground Cover 6-11%
BOCU 3-4% c. cover ERCI 0% c. cover BEHA 0% c. cover JUMO 3-36% c. cover
Stipa 0-1% c. cover ERWR 0% c. cover Krpag 1-2% c. cover PIED 0-3% c. cover
Rangeland Capability
Potential capabilty with production >100lbs/acre and slopes less than 40% on 4,200 acres; no capability on slopes greater than 40% on
800 acres.
Trend
Soil Cond. Rating Satisfactory on all acres in this TEU with slopes below 40%.
Objectives Maintain or improve existing conditions while grazing cattle.
Monitoring Continue monitoring of frequency and ground cover plots at long term sites to determine trend.
*Effective Ground Cover = Basal Vegetation + Litter >0.5"; values for Desired Conditions derived from Tol. in table 3 of TES.
c. cover = canopy cover

111
Table 3: Windmill West Allotment - TES Units 381, 385
General Description: TES Units 381 and 385 - Verde Valley desert communities located on valley plains on the southern region of the Windmill West allotment with a slope of 0-10%. Typical grass species includes aristida, black grama and needle-and-thread There are approximately 8,410 acres in these aggregated TES units; 8,400 acres on slopes less than 40%, 10 acres on slopes greater than
40%.
Vegetation Soil (Ground Cover %)
Potential Grasses Forbs Shrubs Trees
Condition 10-12 Species 4-12 species 13-16 species 0-1 species Bare soil 45-65%
24-35% c. cover 1-2% c. cover 13-18 c. cover 0-2% c. cover Rock 5-35%
Cool season species composition 30% Basal vegetation 10-20%
Warm season species composition 70% Effective Litter (>0.5") 10%
ARIST 4-5% c. cover ERCI 0.5% c. cover ACGR 0.1-1% c. cover JUER 2% c. cover
*Effective ground cover 20-
30%
BOER 4-17% c. cover GUSA 0.5-1% c. cover ATCA 0.1-1 % c. cover
STCO 6-12% c. cover Krpag 1% c. cover
Desired Condition Grasses Forbs Shrubs Trees
3-10 species 2-10 species 10-14 species 0-1 species Bare soil 39-80%
5-35%c. cover 1-2% c. cover 9-16% c. cover 0-1% c. cover Rock 0-10%
Cool season species composition 5-35% Basal vegetation 6-15%
Warm season species composition 65-90% Effective litter (>0.5") 5-50%
ARIST 2-8%c. cover ERCI 0.5% c. cover ACGR 0.1-1% c. cover JUER 0-1% c. cover *Effective ground cover >/=10%
BOER 4-17% c. cover GUSA 0.5-4% c. cover ATCA 0.1-1% c. cover
STCO 1-8% c. cover Krpag 1-2% c. cover
Existing Condition Grasses Forbs Shrubs Trees
2-3 species 2-4 species 10 species 0 species Bare soil 39-87%
5-30% c. cover 1% c. cover 9% c. cover 0% c. cover Rock 0-10%
Cool season species composition 0-35% Basal vegetation 4-8%
Warm season species composition 65-100% Effective litter (>0.5") 0-56%
ARIST 1-10% c. cover ERCI 0% c. cover ACGR 0-0.1% c. cover JUER 0% c. cover
*Effective ground cover 4-
64%
BOER 4-15% c. cover GUSA 1-5% c. cover ATCA 0-0.4% c. cover
STCO 0% c. cover Krapg 0-2% c. cover
Rangeland Capability
Potential capabilty with production >100lbs/acre and slopes less than 40% on 8,400 acres; no capability on slopes with greater than 40%
slope on 10 acres
Trend
Soil Cond. Rating Impaired for all acres in this TEU group.
Objectives Maintain or improve existing conditions while grazing cattle.
Monitoring Continue monitoring of frequency and ground cover plots at long term sites to determine trend.
*Effective Ground Cover = Basal Vegetation + Litter >0.5"
c. cover = canopy cover

112
Table 4: Windmill West Allotment - TES Units 402, 403, 404
General Description: TES Units 402, 403 and 404- Verde Valley desert communities located on valley plains and in wilderness areas on the southern region of the Windmill West allotment with a slope of 0-20%. Typical grass species includes tobosa, blue grama and sideoats grama. There are approximately 7,340 acres in these aggregated TES units; 7,300 acres on slopes less than 40% and 40 acres
on slopes greater than 40%.
Vegetation Soil (Ground Cover %)
Potential Grasses Forbs Shrubs Trees
Condition 9-12 species 8-13 species 12-17 species 1-2 species Bare soil 20-65%
22-42% c. cover 2-7% c. cover 8-18% c. cover 5-12% c. cover Rock 5-55%
Cool season species composition 25% Basal vegetation 10-20%
Warm season species composition 75% Effective litter (>0.5") 10-15%
HIMU 2-15% c. cover ASTRA <0.5% c. cover ACGR <0.5-2% c. cover JUER 0-2% c. cover
*Effective ground cover 20-
35%
BOGR 1-18% c. cover GUSA <0.5-1% c. cover MIBI <0.5-2% c. cover JUOS 0-10% c. cover
BOCU 0.5-8% c. cover PLANT <0.5-1% c. cover QUTU 1-3% c. cover
Desired Condition 4-10 species 5-10 species 3-12 species 0-2 Species
15-35% c. cover 2-7% c. cover 1-10% c. cover 0-8% c. cover Bare soil 20-65%
Cool season species composition 5-15% Rock 5-55%
Warm season species composition 60-75% Basal vegetation 7-20%
HIMU 2-10% c. cover ASTRA <0.5% c. cover ACGR <0.5-1% c. cover JUER 0-2% c. cover Effective litter (>0.5") 5-15%
BOGER 1-10% c. cover GUSA <0.5-1% c. cover MIBI <0.5-1% c. cover JUOS 0-10% c. cover *Effective ground cover >/=15%
BOCU 0.5-6% c. cover PLANT <0.5-1% c. cover QUTU <0.5-1% c. cover
Existing Condition 4 species 5 species 3 species 0 species
15% c. cover 6% c. cover 1% c. cover 0% c. cover Bare soil 57%
Cool season species composition 0% Rock 28%
Warm season species composition 100% Basal vegetation 7%
HIMU 0% c. cover ASTRA 0% c. cover ACGR 0% c. cover JUER 0% c. cover Effective litter (>0.5") 0%
BOGR 0% c. cover GUSA 0% c. cover MIBI 0% c. cover JUOS 0% c. cover *Effective ground cover 7%
BOCU 0% c. cover PLANT 0% c. cover QUTU 0% c. cover
Rangeland
Capability
Potential capabilty with production >100lbs/acre and slopes less than 40% on 7,300 acres; no capability on slopes greater than 40% on 40
acres
Trend
Soil Cond. Rating Impaired on approximately 6,230 acres and unsatisfactory on approximately 1,110 acres.
Objectives Maintain or improve existing conditions while grazing cattle.
Monitoring Continue monitoring of frequency and ground cover plots at long term sites to determine trend.
*Effective Ground Cover = Basal Vegetation + Litter >0.5"
c. cover = canopy cover

113
Table 5:
Windmill West Allotment - TES Units 414 and 417
General Description: TES Units 414 and 417 - Verde Valley desert communities located on valley plains and in wilderness areas on the southern region of the Windmill West allotment with a slope of
0-5%. Typical grass species includes tobosa, blue grama and aristida. There are approximately 5,710 acres in these aggregated TES units; 5,700 acres on slopes less than 40% and 10 acres on slopes greater than 40%.
Vegetation Soil (Ground Cover %)
Potential Grasses Forbs Shrubs Trees
Condition 11-13 species 8-10 species 15-17 species 1-2 species Bare soil 60-65%
17-20% c. cover 3-5% c. cover 8-13% c. cover 2-7% c. cover Rock 10-20%
Cool season species composition 20-30% Basal vegetation 10-15%
Warm season species composition 70-80% Effective litter (>0.5") 10%
HIMU 2-12% c. cover ERCI 0.3-0.5% c. cover ACGR 1-3% c. cover JUMO 0-<0.5% c. cover
*Effective ground cover 20-
25%
BOGR 1-5% c. cover ERFL 0.1% c. cover PRVE 2-7% c.cover JUOS 2-7% c. cover
ARIST 1-2% c. cover SPHAE 0.1% c. cover YUEL 0.5% c. cover
Desired Condition 5-10 species 5-9 species 8-15 species 0-2 species
2-20% c. cover 5-20% c. cover 10-20% c. cover 0-7% c. cover Bare soil 23-70%
Cool season species composition 5-33% Rock 5-33%
Warm season species composition 65-90% Basal vegetation 8-15%
HIMU 1-8% c. cover ERCI 0.3-0.5% c. cover ACGR 2-8% c. cover JUMO 0-<0.5% c. cover Effective litter (>0.5") 1-8%
BOGER 0.2-10% c. cover ERFL 0.1% c. cover PRVE 1-10% c. cover JUOS 0-7% c. cover *Effective ground cover >/=15%
ARIST 0.2-2% c. cover SPHAE 0.1-0.2% c. cover YUEL 0-0.5% c. cover
Existing Condition 5-6 species 5-9 species 8 species 0 species
2-20% c. cover 10-26% c. cover 20-23% c. cover 0% c. cover Bare soil 23-74%
Cool season species composition 0-33% Rock 5-33%
Warm season species composition 65-100% Basal vegetation 8-10%
HIMU 0% c. cover ERCI 0% c. cover ACGR 2-10% c. cover JUMO 0% c. cover Effective litter (>0.5") 0.3-1%
BOGR 0.2-12% c. cover ERFL 0% c. cover PRVE 1-10% c. cover JUOS 0% c. cover *Effective ground cover 8-11%
ARIST 0.2-2% c. cover SPHAE 0-0.2% c. cover YUEL 0% c. cover
Rangeland
Capability
Potential capabilty with production >100lbs/acre and slopes less than 40% on 5,700 acres; no capability on slopes greater than 40% on 10
acres
Trend
Soil Cond. Rating Impaired on approximately 4,580 acres, and unsatisfactory on approximately 1,130 acres.
Objectives Maintain or improve existing conditions while grazing cattle.
Monitoring Continue monitoring of frequency and ground cover plots at long term sites to determine trend.
*Effective Ground Cover = Basal Vegetation + Litter >0.5"
c. cover = canopy
cover

114
Table 6:
Windmill West Allotment - TES Unit 418 General Description: TES Unit 418 - Verde Valley desert communities located on valley plains and in wilderness areas on the southern region of the Windmill West allotment with a slope of 15-20%.
Typical grass species includes needle and thread, black grama and squirrel tail. There are approximately 5,100 acres in these aggregated TES units; 5,000 acres on slopes less than 40% and 100 acres on
slopes greater than 40%.
Vegetation Soil (Ground Cover %)
Potential Grasses Forbs Shrubs Trees
Condition 11 species 6 species 14-16 species 2 species Bare soil 30-35%
7-9% c. cover 3% c. cover 22-28% c. cover 5% c. cover Rock 45%
Cool season species composition 36% Basal vegetation 5-10%
Warm season species composition 63% Effective litter (>0.5") 15%
BOER 1% c. cover GUSA 2% c. cover MIBI 10-15% c. cover JUER <0.5% c. cover *Effective ground cover 20-25%
SIHY 1.5-2% c. cover PLANT 0.5% c. cover PRVE 5% c. cover JUOS 5% c. cover
STCO <0.5-2% c. cover MIMU 0.2% c. cover QUTU 2-5% c. cover
Desired Condition
7-11 species 5-6 species 7-14 species 1-2 species Bare soil 30-40%
7-23% c. cover 1-3% c. cover 16-28% c. cover 5-7% c. cover Rock 30-40%
Cool season species composition 14-25% Basal vegetation 5-10%
Warm season species composition 65-85% Effective litter (<0.5") 1-10%
BOER 1-3% c. cover GUSA 2% c. cover MIBI 1-8% c. cover JUER <0.5% c. cover
*Effective ground cover
>/=25%
SIHY <0.5-1.5% c. cover PLANT <0.5-0.5% c. cover PRVE 1-3% c. cover JUOS 5-7% c. cover
STCO <0.5-1% c. cover MIMU <0.5-0.2% c. cover QUTU 5-7% c. cover
Existing Condition
7 species 5 species 7 species 1 species Bare soil 40%
23% c. cover 1% c. cover 16% c. cover 7% canopy cover Rock 30%
Cool season species composition 14% Basal vegetation 6%
Warm season species composition 85% Effective litter (>0.5") 0%
BOER 3% c. cover GUSA 2% c. cover MIBI 0% c. cover JUER 0% c. cover *Effective ground cover 6%
SIHY 0% c. cover PLANT 0% c. cover PRVE 0% c.cover JUOS 7% c. cover
STCO 0% c. cover MIMU 0% c. cover QUTU 7% c. cover
Rangeland
Capability
Potential capabilty with production >100lbs/acre and slopes less than 40% on 5,000 acres; no capability on slopes greater than 40% on 100
acres
Trend
Soil Cond. Rating Unsatisfactory for all acres in this TEU.
Objectives Maintain or improve existing conditions while grazing cattle.
Monitoring Continue monitoring of frequency and ground cover plots at long term sites to determine trend.
*Effective Ground Cover = Basal Vegetation + Litter >0.5"
c. cover = canopy cover

115
Table 7:
Windmill West Allotment - TES Unit 420 and 430
General Description: TES Unit 420 and 430 - Desert shrubland located on hills on the southern region of the Windmill West allotment with a slope of 20-25%. Typical grass species includes sideoats grama, black grama and
bottlebrush squirreltail. There are approximately 5,000 acres in this TEU; 4,000 acres on slopes less than 40% and 1,000 acres on slopes greater than 40%.
Vegetation Soil (Ground Cover %)
Potential Grasses Forbs Shrubs Trees Bare Soil 10-20%
Condition 12-15 Species 10-11 Species 18-20 Species 2-5 Species Rock 60-70%
6-10% c. cover 2-4% c. cover 14-27% c. cover 8-22% c. cover Basal Vegetation 10%
Cool season species composition 20-25% Effective Litter (>0.5") 10%
Warm season species composition 75-80% *Effective Ground Cover 20%
BOCU 1-3% c. cover Astrag <0.5% c. cover CAHO 1-5% c. cover JUER <0.5-2% c. cover
BOER 1-2% c. cover ERIOG 1% c. cover Krpag 0-1% c. cover JUOS 7-10% c. cover
HIMU 1-2% c. cover GUSA 1% c. cover PRVE 1-3% c. cover PIFA 0-12% c. cover
Desired Condition 3-8 Species 4-8 Species 6-10 Species 1-2 Species Bare Soil 5-25%
4-26% c. cover 0.5-2% c. cover 6-17% c. cover 5-10% c. cover Rock 45-56%
Cool season species composition 5-25% Basal Vegetation 8-12% c. cover
Warm season species composition 75-95% Effective Litter (>0.5") 2-7%
BOCU <0.5-2% c.cover Astrag <0.5% c. cover CAHO <0.5-10% c. cover JUER <0.5-1% c. cover *Effective Ground Cover >/=30%
BOER <0.5-1% c. cover ERIOG <0.5-1% c. cover Krpag <0.5-1% c. cover JUOS <0.5-5% c. cover
HIMU <0.5-15% c. cover GUSA <0.5-1% c. cover PRVE <0.5-2% c. cover JUMO <0.5-8% c. cover
Existing Condition 3-5 Species 4-6 Species 6-8 Species 1-2 Species Bare Soil 5-28%
4-26% c. cover 0.5-2% c. cover 6-17% c. cover 5-10% c. cover Rock 45-56%
Cool season species composition 0-25% Basal Vegetation 8-12%
Warm season species composition 75-100% Effective Litter (>0.5") 1-3%
BOCU 0-0.5% c. cover Astrag 0-<0.5% c. cover CAHO 0-15% c. cover JUER 0% c. cover *Effective Ground Cover 9-15%
BOER 0% c. cover ERIOG 0% c. cover Krpag 0-1% c. cover JUOS 0% c. cover
HIMU 0-20% c. cover GUSA <0.5-1% c. cover PRVE 0% c. cover JUMO <0.5-10% c. cover
Rangeland Capability Potential capabilty with production >100lbs/acre and slopes less than 40%; no capability on slopes greater than 40%
Trend
Soil Cond. Rating Impaired for all acres in this TEU group.
Objectives Maintain or improve existing conditions while grazing cattle.
Monitoring Continue monitoring of frequency and ground cover plots at long term sites to determine trend.
*Effective Ground Cover = Basal Vegetation + Litter >0.5"; values for Desired Conditions derived from Tol. in table 3 of TES.
c. cover = canopy cover

116
Table 8:
Windmill West Allotment - TES Units 447
General Description: TES Unit 447 - Verde Valley desert communities located on valley plains on the southern region of the Windmill West allotment with a slope of 0-10%. Typical grass species includes sideoats grama, blue grama and needle and thread. There are approximately 1,800 acres in this TES unit; allacres are on slopes less than 40%.
Vegetation Soil (Ground Cover %)
Potential Grasses Forbs Shrubs Trees
Condition 12 species 5-6 species 15 species 4 species Bare soil 35-55%
10% c. cover 1-2% c. cover 21% c. cover 20-25% c. cover Rock 15-40%
Cool season species composition 25-30% Basal vegetation 10%
Warm season species composition 70-75% Effective litter (>0.5") 15-20%
BOCU 1% c. cover ERIOG 1% c. cover ATCA 5% c. cover PIFA 12-15% c. cover
*Effective ground cover 25-
30%
BOGR 1% c. cover ERWR <0.5-1% c. cover QUTU 5% c. cover JUOS 8-10% c. cover
STCO 6% c. cover GUSA <0.5% c. cover CEMO 4% c. cover JUMO <0.5% c. cover
Desired Condition
3-10 species 5-7 species 2-10 species 0-2 species Bare soil 35-60%
10-23% c. cover 1-2% c. cover 5-10% c. cover 0-10% c. cover Rock 15-40%
Cool season species composition 25-33% Basal vegetation 6-10%
Warm season species composition 66-75% Effective litter (>0.5") 5-10%
BOCU 1-5% c. cover ERIOG <0.5-1% c. cover ATCA <0.5-5% c. cover PIFA 0-5% c. cover *Effective ground cover >/=10%
BOGR <0.5-1% c. cover ERWR <0.5-1% c. cover QUTU <0.5-5% c. cover JUOS 0-5% c. cover
STCO 5-16% c. cover GUSA 2-5% CEMO <0.5-5% c. cover JUMO 0-5% c. cover
Existing Condition
3 species 7 species 2 species 0 species Bare soil 63%
23% c. cover 2% c. cover 5% c. cover 0% c. cover Rock 22%
Cool season species composition 33% Basal vegetation 6%
Warm season species composition 66% Effective litter (>0.5") 1%
BOCU 5% c. cover ERIOG <0.5% c. cover ATCA 0% c. cover PIFA 0% c. cover *Effective ground cover 7%
BOGR 0% c. cover ERWR <0.5% c. cover QUTU 0% c. cover JUOS 0% c. cover
STCO 16% c. cover GUSA 5% c. cover CEMO 0% c. cover JUMO 0% c. cover
Rangeland
Capability
Potential capabilty with production >100lbs/acre and slopes less than 40% on 4,000 acres; no capability on slopes greater than 40% on 100
acres
Trend
Soil Cond. Rating Impaired for all acres in this TEU group.
Objectives Maintain or improve existing conditions while grazing cattle.
Monitoring Continue monitoring of frequency and ground cover plots at long term sites to determine trend.
*Effective Ground Cover = Basal Vegetation + Litter >0.5"
c. cover = canopy
cover
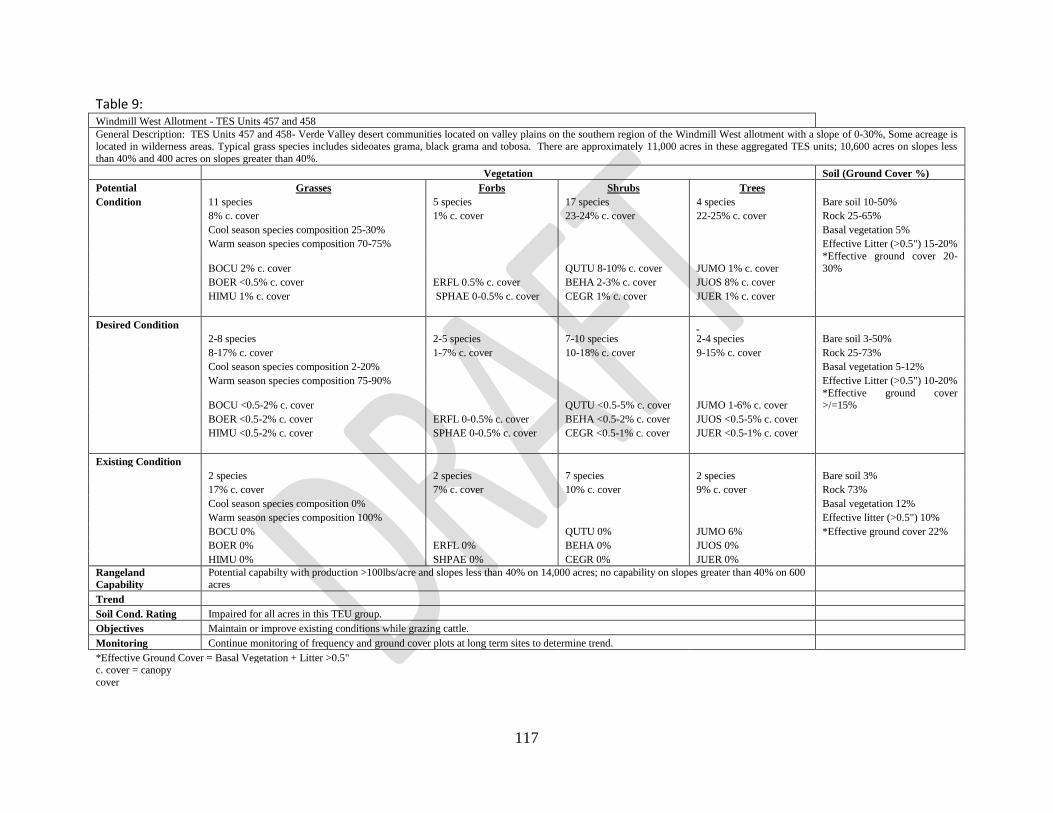
117
Table 9: Windmill West Allotment - TES Units 457 and 458
General Description: TES Units 457 and 458- Verde Valley desert communities located on valley plains on the southern region of the Windmill West allotment with a slope of 0-30%, Some acreage is located in wilderness areas. Typical grass species includes sideoates grama, black grama and tobosa. There are approximately 11,000 acres in these aggregated TES units; 10,600 acres on slopes less
than 40% and 400 acres on slopes greater than 40%.
Vegetation Soil (Ground Cover %)
Potential Grasses Forbs Shrubs Trees
Condition 11 species 5 species 17 species 4 species Bare soil 10-50%
8% c. cover 1% c. cover 23-24% c. cover 22-25% c. cover Rock 25-65%
Cool season species composition 25-30% Basal vegetation 5%
Warm season species composition 70-75% Effective Litter (>0.5") 15-20%
BOCU 2% c. cover QUTU 8-10% c. cover JUMO 1% c. cover
*Effective ground cover 20-
30%
BOER <0.5% c. cover ERFL 0.5% c. cover BEHA 2-3% c. cover JUOS 8% c. cover
HIMU 1% c. cover SPHAE 0-0.5% c. cover CEGR 1% c. cover JUER 1% c. cover
Desired Condition
2-8 species 2-5 species 7-10 species 2-4 species Bare soil 3-50%
8-17% c. cover 1-7% c. cover 10-18% c. cover 9-15% c. cover Rock 25-73%
Cool season species composition 2-20% Basal vegetation 5-12%
Warm season species composition 75-90% Effective Litter (>0.5") 10-20%
BOCU <0.5-2% c. cover QUTU <0.5-5% c. cover JUMO 1-6% c. cover *Effective ground cover >/=15%
BOER <0.5-2% c. cover ERFL 0-0.5% c. cover BEHA <0.5-2% c. cover JUOS <0.5-5% c. cover
HIMU <0.5-2% c. cover SPHAE 0-0.5% c. cover CEGR <0.5-1% c. cover JUER <0.5-1% c. cover
Existing Condition
2 species 2 species 7 species 2 species Bare soil 3%
17% c. cover 7% c. cover 10% c. cover 9% c. cover Rock 73%
Cool season species composition 0% Basal vegetation 12%
Warm season species composition 100% Effective litter (>0.5") 10%
BOCU 0% QUTU 0% JUMO 6% *Effective ground cover 22%
BOER 0% ERFL 0% BEHA 0% JUOS 0%
HIMU 0% SHPAE 0% CEGR 0% JUER 0%
Rangeland
Capability
Potential capabilty with production >100lbs/acre and slopes less than 40% on 14,000 acres; no capability on slopes greater than 40% on 600 acres
Trend
Soil Cond. Rating Impaired for all acres in this TEU group.
Objectives Maintain or improve existing conditions while grazing cattle.
Monitoring Continue monitoring of frequency and ground cover plots at long term sites to determine trend.
*Effective Ground Cover = Basal Vegetation + Litter >0.5" c. cover = canopy
cover
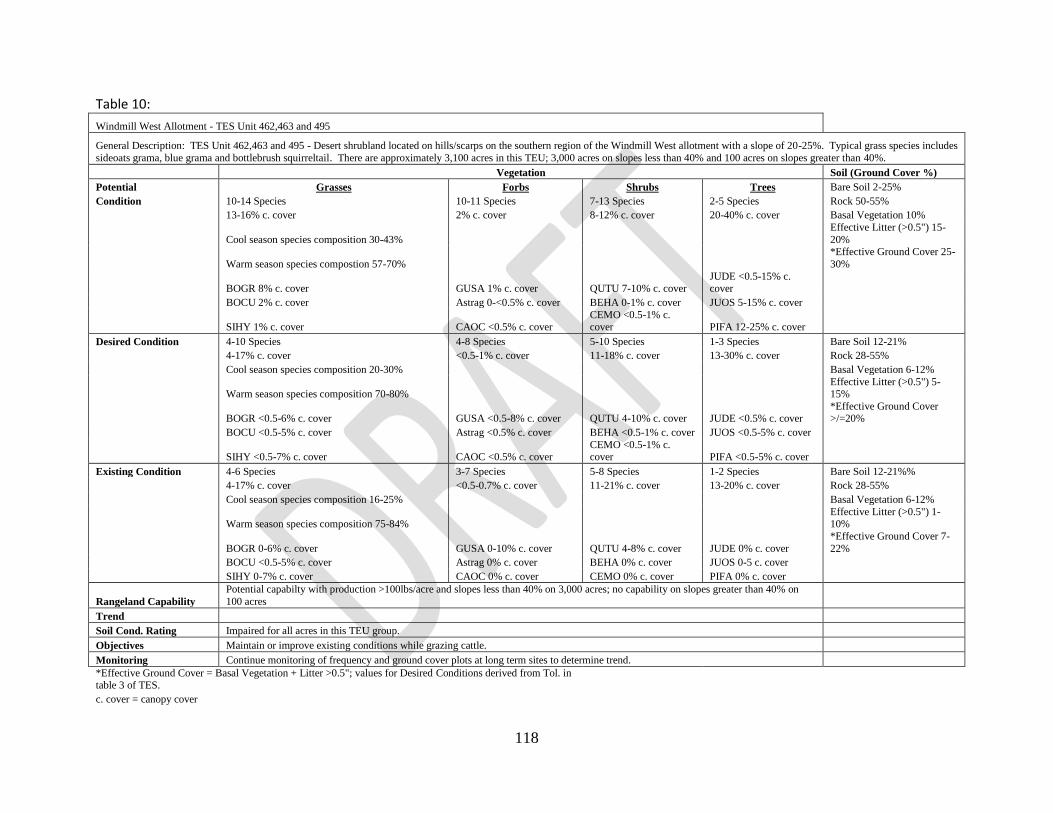
118
Table 10:
Windmill West Allotment - TES Unit 462,463 and 495
General Description: TES Unit 462,463 and 495 - Desert shrubland located on hills/scarps on the southern region of the Windmill West allotment with a slope of 20-25%. Typical grass species includes
sideoats grama, blue grama and bottlebrush squirreltail. There are approximately 3,100 acres in this TEU; 3,000 acres on slopes less than 40% and 100 acres on slopes greater than 40%.
Vegetation Soil (Ground Cover %)
Potential Grasses Forbs Shrubs Trees Bare Soil 2-25%
Condition 10-14 Species 10-11 Species 7-13 Species 2-5 Species Rock 50-55%
13-16% c. cover 2% c. cover 8-12% c. cover 20-40% c. cover Basal Vegetation 10%
Cool season species composition 30-43%
Effective Litter (>0.5") 15-
20%
Warm season species compostion 57-70%
*Effective Ground Cover 25-
30%
BOGR 8% c. cover GUSA 1% c. cover QUTU 7-10% c. cover JUDE <0.5-15% c. cover
BOCU 2% c. cover Astrag 0-<0.5% c. cover BEHA 0-1% c. cover JUOS 5-15% c. cover
SIHY 1% c. cover CAOC <0.5% c. cover CEMO <0.5-1% c. cover PIFA 12-25% c. cover
Desired Condition 4-10 Species 4-8 Species 5-10 Species 1-3 Species Bare Soil 12-21%
4-17% c. cover <0.5-1% c. cover 11-18% c. cover 13-30% c. cover Rock 28-55%
Cool season species composition 20-30% Basal Vegetation 6-12%
Warm season species composition 70-80% Effective Litter (>0.5") 5-15%
BOGR <0.5-6% c. cover GUSA <0.5-8% c. cover QUTU 4-10% c. cover JUDE <0.5% c. cover *Effective Ground Cover >/=20%
BOCU <0.5-5% c. cover Astrag <0.5% c. cover BEHA <0.5-1% c. cover JUOS <0.5-5% c. cover
SIHY <0.5-7% c. cover CAOC <0.5% c. cover CEMO <0.5-1% c. cover PIFA <0.5-5% c. cover
Existing Condition 4-6 Species 3-7 Species 5-8 Species 1-2 Species Bare Soil 12-21%%
4-17% c. cover <0.5-0.7% c. cover 11-21% c. cover 13-20% c. cover Rock 28-55%
Cool season species composition 16-25% Basal Vegetation 6-12%
Warm season species composition 75-84% Effective Litter (>0.5") 1-10%
BOGR 0-6% c. cover GUSA 0-10% c. cover QUTU 4-8% c. cover JUDE 0% c. cover
*Effective Ground Cover 7-
22%
BOCU <0.5-5% c. cover Astrag 0% c. cover BEHA 0% c. cover JUOS 0-5 c. cover
SIHY 0-7% c. cover CAOC 0% c. cover CEMO 0% c. cover PIFA 0% c. cover
Rangeland Capability
Potential capabilty with production >100lbs/acre and slopes less than 40% on 3,000 acres; no capability on slopes greater than 40% on
100 acres
Trend
Soil Cond. Rating Impaired for all acres in this TEU group.
Objectives Maintain or improve existing conditions while grazing cattle.
Monitoring Continue monitoring of frequency and ground cover plots at long term sites to determine trend.
*Effective Ground Cover = Basal Vegetation + Litter >0.5"; values for Desired Conditions derived from Tol. in table 3 of TES.
c. cover = canopy cover

119
Table 11:
Windmill West Allotment - TES Units 536, 546, 549
General Description: TES Units 536, 546 and 549- Ponderosa pine and mixed conifer communities located on elevated plains and hills and in wilderness areas on the northernregion of the Windmill
West allotment with a slope of 0-30%. Typical grass species includes Arizona fescue, muttongrass, mountain muhly. There are approximately 13,500 acres in these aggregated TES units; 13,000 acres on slopes less than 40% and 500 acres on slopes greater than 40%.
Vegetation Soil (Ground Cover %)
Potential Grasses Forbs Shrubs Trees
Condition 9-12 species 11-18 species 5-6 species 2-3 species Bare soil 0-5%
16-31% c. cover 8-10% c. cover 1-5% c. cover 65-66% c. cover Rock 10-40%
Cool season species composition 36-50% Basal vegetation 10-15%
Warm season species composition 50-63% Effective litter (>0.5") 70-80%
FEAR 5-10% c. cover Acmil 3-5% c. cover CEFE <0.5% c. cover JUSC <0.5% c. cover
*Effective ground cover 80-
95%
MUMO 3% c. cover ANRO 0.5% c. cover CHNA <0.5% c. cover PIPO 65% c. cover
POFE 3% c. cover LUAR 2-4% c. cover RONE <0.5% c. cover QUGA <0.5-1% c. cover
Desired Condition
4-12 species 3-13 species 1-3 species 1-2 species Bare soil 1-10%
4-32% c. cover 1-11% c. cover <0.5-1% c. cover 5-50% c. cover Rock .33-11%
Cool season species composition 36-75% Basal vegetation 2-10%
Warm season species composition 25-50% Effective litter (>0.5") 20-55%
FEAR <0.5-8% c. cover Acmil <0.5-3% c. cover CEFE <0.5% c. cover JUSC 0-<0.5% c. cover
*Effective ground cover
>/=30%
MUMO <0.5-5% c. cover ANRO 0.5-8% c. cover CHNA <0.5% c. cover PIPO 20-50% c. cover
POFE <0.5-2% c. cover LUAR <0.5-2% c. cover RONE <0.5% c. cover QUGA 0-<0.5% c. cover
Existing Condition
4-9 species 3-10 species 0 species 1 species Bare soil 1-13%
2-32% c. cover 1-11% c. cover 0% c. cover 3-45% c. cover Rock .33-11%
Cool season species composition 75-80% Basal vegetation 2-10% c. cover
Warm season species composition 20-25% Effective litter (>0.5") 17-46%
FEAR 0-6% c. cover ACMIL 0-<0.5% c. cover CEFE 0% c. cover JUSC 0% c. cover
*Effective ground cover 19-
56%
MUMO 0-5% c. cover ANRO 0-8% c. cover CHNA 0% c. cover PIPO 3-45% c. cover
POFE 0-<0.5% c. cover LUAR 0-<0.5% c. cover RONE 0% c. cover QUGA 0-<0.5% c. cover
Rangeland Capability
Full capabilty with production >100lbs/acre and slopes less than 40% on 13,000 acres; no capability on slopes greater than 40% on 500 acres
Trend
Soil Cond. Rating Satisfactory for all acres in this TEU group.
Objectives Maintain or improve existing conditions while grazing cattle.
Monitoring Continue monitoring of frequency and ground cover plots at long term sites to determine trend.
*Effective Ground Cover = Basal Vegetation + Litter >0.5"; values for Desired Conditions derived from Tol. in table 3 of TES. c. cover = canopy
cover

120
Table 12: Windmill West Allotment - TES Units 550, 582, 584 and 585
General Description: TES Units 550, 582, 584 and 585- Ponderosa pine and mixed conifer communities located on elevated plains and hills and in wilderness areas on the northernregion of the Windmill West allotment with a slope of 0-30%. Typical grass species includes Arizona fescue, muttongrass, mountain muhly. There are approximately 17,700 acres in these aggregated TES units;
17,400 acres on slopes with less than 40% and 300 acres on slopes greater than 40%.
Vegetation Soil (Ground Cover %)
Potential Grasses Forbs Shrubs Trees
Condition 8 species 12-14 species 5 species 3 species Bare soil 5%
12-15% c. cover 10% c. cover 5% c. cover 56-66% c. cover Rock 25-65%
Cool season species composition 50-60% Basal vegetation 10%
Warm season species composition 40-50%
Effective litter (>0.5") 65-
75%
FEAR 2-5% c. cover ACMIL 1-5% c. cover CEFE <0.5% c. cover JUSC <0.5% c. cover
*Effective ground cover 75-
85%
MUMO 1-3% c. cover ANRO <0.5-0.5% c. cover RICE <0.5% c. cover PIPO 40-65% c. cover
POFE 2-3% c. cover LUAR 2-4% c. cover RONE <0.5% c. cover QUGA 1-5% c. cover
Desired Condition
7-10 species 4-10 species 1-3 species 1-3 species Bare soil 3-25%
7-28% c. cover 1-11% c. cover <0.5-3% c. cover 22-55% c. cover Rock 0.1-2%
Cool season species composition 50-80% Basal vegetation 3-10%
Warm season species composition 20-50%
Effective litter (>0.5") 18-
30%
FEAR <0.5-15% c. cover ACMIL 0.5-5% c. cover CEFE <0.5-0.5% c. cover JUSC <0.5% c. cover *Effective ground cover >/=30%
MUMO <0.5-3% c. cover ANRO <0.5-10% c. cover RICE <0.5-0.5% c. cover PIPO 20-50% c. cover
POFE <0.5-3% c. cover LUAR <0.5-3% c. cover RONE <0.5-0.5% c. cover QUGA 0-3% c. cover
Existing Condition
6-10 species 4-7 species 0 species 1-2 species Bare soil 3-31%
7-28% c. cover 1-11% c. cover 0% c. cover 22-45% c. cover Rock 0.1-2%
Cool season species composition 60-83% Basal vegetation 3-8%
Warm season species composition 17-40%
Effective litter (>0.5") 18-
25%
FEAR 0-1% c. cover ACMIL 0-0.5% c. cover CEFE 0% c. cover JUSC 0% c. cover
*Effective ground cover 21-
31%
MUMO 0-<0.5% c. cover ANRO <0.5-10% c. cover RICE 0% c. cover PIPO 20-45% c. cover
POFE 0-2% c. cover LUAR 0-<0.5% c. cover RONE 0% c. cover QUGA 0-2% c. cover
Rangeland
Capability
Full capabilty with production >100lbs/acre and slopes less than 40% on 21,000 acres; no capability on slopes with greater than 40% slope on
400 acres
Trend
Soil Cond. Rating Satisfactory for a ll acres in this TEU group.
Objectives Maintain or improve existing conditions while grazing cattle.
Monitoring Continue monitoring of frequency and ground cover plots at long term sites to determine trend.
*Effective Ground Cover = Basal Vegetation + Litter >0.5"; values for Desired Conditions derived from Tol. in table 3 of TES.
c. cover = canopy cover
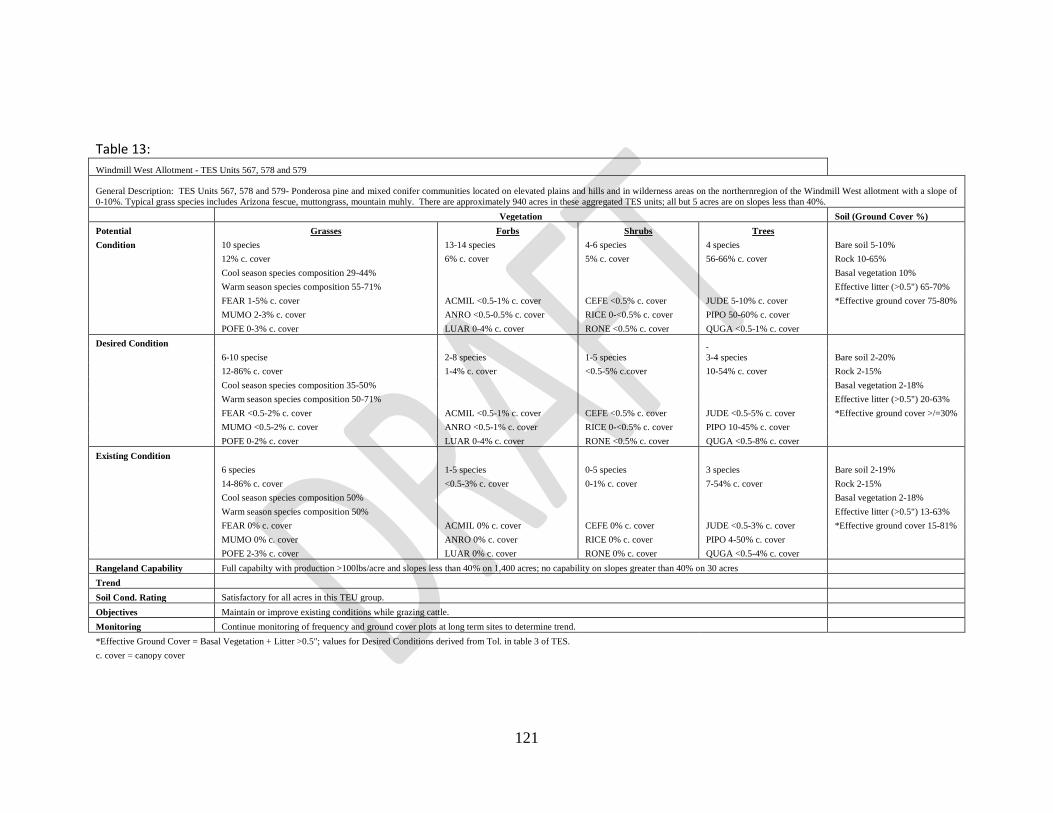
121
Table 13:
Windmill West Allotment - TES Units 567, 578 and 579
General Description: TES Units 567, 578 and 579- Ponderosa pine and mixed conifer communities located on elevated plains and hills and in wilderness areas on the northernregion of the Windmill West allotment with a slope of
0-10%. Typical grass species includes Arizona fescue, muttongrass, mountain muhly. There are approximately 940 acres in these aggregated TES units; all but 5 acres are on slopes less than 40%.
Vegetation Soil (Ground Cover %)
Potential Grasses Forbs Shrubs Trees
Condition 10 species 13-14 species 4-6 species 4 species Bare soil 5-10%
12% c. cover 6% c. cover 5% c. cover 56-66% c. cover Rock 10-65%
Cool season species composition 29-44% Basal vegetation 10%
Warm season species composition 55-71% Effective litter (>0.5") 65-70%
FEAR 1-5% c. cover ACMIL <0.5-1% c. cover CEFE <0.5% c. cover JUDE 5-10% c. cover *Effective ground cover 75-80%
MUMO 2-3% c. cover ANRO <0.5-0.5% c. cover RICE 0-<0.5% c. cover PIPO 50-60% c. cover
POFE 0-3% c. cover LUAR 0-4% c. cover RONE <0.5% c. cover QUGA <0.5-1% c. cover
Desired Condition
6-10 specise 2-8 species 1-5 species 3-4 species Bare soil 2-20%
12-86% c. cover 1-4% c. cover <0.5-5% c.cover 10-54% c. cover Rock 2-15%
Cool season species composition 35-50% Basal vegetation 2-18%
Warm season species composition 50-71% Effective litter (>0.5") 20-63%
FEAR <0.5-2% c. cover ACMIL <0.5-1% c. cover CEFE <0.5% c. cover JUDE <0.5-5% c. cover *Effective ground cover >/=30%
MUMO <0.5-2% c. cover ANRO <0.5-1% c. cover RICE 0-<0.5% c. cover PIPO 10-45% c. cover
POFE 0-2% c. cover LUAR 0-4% c. cover RONE <0.5% c. cover QUGA <0.5-8% c. cover
Existing Condition
6 species 1-5 species 0-5 species 3 species Bare soil 2-19%
14-86% c. cover <0.5-3% c. cover 0-1% c. cover 7-54% c. cover Rock 2-15%
Cool season species composition 50% Basal vegetation 2-18%
Warm season species composition 50% Effective litter (>0.5") 13-63%
FEAR 0% c. cover ACMIL 0% c. cover CEFE 0% c. cover JUDE <0.5-3% c. cover *Effective ground cover 15-81%
MUMO 0% c. cover ANRO 0% c. cover RICE 0% c. cover PIPO 4-50% c. cover
POFE 2-3% c. cover LUAR 0% c. cover RONE 0% c. cover QUGA <0.5-4% c. cover
Rangeland Capability Full capabilty with production >100lbs/acre and slopes less than 40% on 1,400 acres; no capability on slopes greater than 40% on 30 acres
Trend
Soil Cond. Rating Satisfactory for all acres in this TEU group.
Objectives Maintain or improve existing conditions while grazing cattle.
Monitoring Continue monitoring of frequency and ground cover plots at long term sites to determine trend.
*Effective Ground Cover = Basal Vegetation + Litter >0.5"; values for Desired Conditions derived from Tol. in table 3 of TES.
c. cover = canopy cover

122
Table 14: Windmill West Allotment - TES Unit 572
General Description: TES Units 572- Ponderosa pine and mixed conifer communities located on elevated plains and hills and in wilderness areas on the northernregion of the Windmill West allotment
with a slope of 0-10%. Typical grass species includes Arizona fescue, muttongrass, mountain muhly. There are approximately 1,430 acres in these aggregated TES units; 1,400 acres on slopes less than
40% and 30 acres on slopes greater than 40%.
Vegetation Soil (Ground Cover %)
Potential Grasses Forbs Shrubs Trees
Condition 8 species 8 species 7 species 4 species Bare soil 5%
9% c. cover 1% c. cover 13% c. cover 62% c. cover Rock 40%
Cool season species composition 28-30% Basal vegetation 10%
Warm season species composition 70-72% Effective litter (>0.5") 70%
FEAR 1% c. cover ACMIL <0.5% c. cover ARPU 10% c. cover JUDE 10% c. cover *Effective ground cover 80%
MUMO 3% c. cover ANRO <0.5% c. cover NOMI 1% c. cover PIPO 50% c. cover
SIHY 1% c. cover ERRA 0.5% c. cover QUTU 2% c. cover QUGA <0.5% c. cover
Desired Condition
6-10 species 5-9 species 1-4 species 2-4 species Bare soil 15-25%
8-15% c. cover 1-5% c. cover <0.5-5% c.cover 21-30% c. cover Rock 6%
Cool season species composition 30-45% Basal vegetation 4-10%
Warm season species composition 50-66%
Effective litter (>0.5") 20-
50%
FEAR <0.5-2% c. cover ACMIL <0.5-1% c. cover ARPU <0.5-1% c. cover
JUDE <0.5-5% c. cover
*Effective ground cover >/=30%
MUMO <0.5-2% c. cover ANRO <0.5-1% c. cover
NOMI <0.5-1% c.
cover PIPO 10-45% c. cover
POFE 0-2% c. cover ERRA <0.5-1% c. cover
QUTU <0.5-1% c.
cover
QUGA <0.5-8% c.
cover
Existing Condition
8 species 5 species 0 species 3 species Bare Soil 31%
15% c. cover 5% c. cover 0% c. cover 21% c. cover Rock 6%
Cool season species composition 43% Basal Vegetation 4%
Warm season species composition 57% Effective litter (>0.5") 13%
FEAR 0% c. cover ACMIL 0 % c. cover ARPU 0% c. cover JUDE 1% c. cover *Effective ground cover 17%
MUMO 0% c. cover ANRO 0% c. cover NOMI 0% c. cover PIPO 10% c. cover
SIHY <0.5% c. cover ERRA 0% c. cover QUTU 0% c. cover QUGA 10% c. cover
Rangeland Capability Full capabilty with production >100lbs/acre and slopes less than 40% on 1,400 acres; no capability on slopes greater than 40% on 30 acres
Trend
Soil Cond. Rating Satisfactory for all acres in this TEU group.
Objectives Maintain or improve existing conditions while grazing cattle.
Monitoring Continue monitoring of frequency and ground cover plots at long term sites to determine trend.
*Effective Ground Cover = Basal Vegetation + Litter >0.5"; values for Desired Conditions derived from Tol. in
table 3 of TES.
c. cover = canopy cover

123
Table 15: Windmill West Allotment - TES Units 586
General Description: TES Units 586- Ponderosa pine and mixed conifer communities located on elevated plains and hills and in wilderness areas on the northernregion of the Windmill West allotment
with a slope of 0-30%. Typical grass species includes Arizona fescue, muttongrass, mountain muhly. There are approximately 17,700 acres in these aggregated TES units; 17,400 acres on slopes with
less than 40% and 300 acres on slopes greater than 40%.
Vegetation Soil (Ground Cover %)
Potential Grasses Forbs Shrubs Trees
Condition 8 species 14 species 5 species 3 species Bare soil 5%
12% c. cover 10% c. cover 4% c. cover 61-66% c. cover Rock 50%
Cool season species composition 56-58% Basal vegetation 10%
Warm season species composition 42-44% Effective litter (>0.5") 75%
FEAR 5% c. cover ACMIL 5% c. cover CEFE <0.5% c. cover JUSC <0.5% c. cover *Effective ground cover 85%
MUMO 1% c. cover ANRO 0.5% c. cover QUGA 4% c. cover PIPO 60-65% c. cover
POFE 3% c. cover LUAR 4% c. cover RICE <0.5% c. cover QUGA 1% c. cover
Desired Condition
4-11 species 8-15 species 1-3 species 1-3 species Bare soil 5-10%
12-24% c. cover 9-15% c. cover <0.5-3% c. cover 20-50% c. cover Rock 19%
Cool season species composition 56-64% Basal vegetation 10-18%
Warm season species composition 36-44%
Effective litter (>0.5") 15-
50%
FEAR <0.5-15% c. cover ACMIL 0.5-5% c. cover CEFE <0.5-0.5% c. cover JUSC <0.5% c. cover *Effective ground cover >/=30%
MUMO <0.5-3% c. cover ANRO <0.5-10% c. cover RICE <0.5-0.5% c. cover PIPO 20-50% c. cover
POFE <0.5-3% c. cover LUAR <0.5-3% c. cover RONE <0.5-0.5% c. cover QUGA 0-3% c. cover
Existing Condition
11 species 8 species 0 species 2 species Bare soil 7%
24% c. cover 17% c. cover 0% c. cover 18% c. cover Rock 19%
Cool season species composition 64% Basal vegetation 18%
Warm season species composition 36% Effective litter (>0.5") 9%
FEAR <0.5% c. cover ACMIL <0.5% c. cover CEFE 0% c. cover JUSC 0% c. cover *Effective ground cover 27%
MUMO 0% c. cover ANRO 0% c. cover QUGA 0% c. cover PIPO 15% c. cover
POFE <0.5% c. cover LUAR 0% c. cover RICE 0% c. cover QUGA 3% c.cover
Rangeland
Capability
Full capabilty with production >100lbs/acre and slopes less than 40% on 21,000 acres; no capability on slopes with greater than 40% slope on
400 acres
Trend
Soil Cond. Rating Satisfactory for a ll acres in this TEU group.
Objectives Maintain or improve existing conditions while grazing cattle.
Monitoring Continue monitoring of frequency and ground cover plots at long term sites to determine trend.
*Effective Ground Cover = Basal Vegetation + Litter >0.5"; values for Desired Conditions derived from Tol. in table 3 of TES.
c. cover = canopy
cover