range of motion and stiffness of the pediatric ankle and ... · range of motion and stiffness of...
TRANSCRIPT

Range of Motion and Stiffness of the Pediatric Ankle and Implications for Current ATDs
Laura C. Boucher, Ajit M.W. Chaudhari, Yun Seok Kang, John Bolte IV
Abstract Pediatric anthropomorphic test devices (ATDs) do not contain instrumentation below the knee, making it difficult to directly measure forces applied to the leg during impact. The goal of this study was to evaluate the anthropometric characteristics and stiffness response of the pediatric ankle in order to gain valuable data for the development of a more biofidelic ATD ankle. Forty-two children between the ages of 4-12 years old were placed into 2 groups (n=21, 4-7 years and 8-12 years). Anthropometry measurements were taken bilaterally on the lower extremity. Ankle range-of-motion (ROM) measurements were taken using a universal goniometer. Lastly, active stiffness of the ankle was measured using a Biodex Isokinetic Dynamometer. Increased plantar flexion (PF) and dorsiflexion (DF) motion in the younger group was seen. Significant differences were noted between groups both in active and passive DF and in stiffness at 30°/sec and 60°/sec. Stiffness data were then used to develop specific stiffness targets for use with the development of an instrumented 6 and 10 year old ATD leg. The information gained from this study will allow researchers to gain insight into the injury mechanism and forces experienced by the leg, with the overall goal of decreasing injury risk to children.
Keywords Ankle range of motion, dynamic ankle stiffness, isokinetic dynamometer, pediatric injury
I. INTRODUCTION
Motor vehicle accidents (MVAs) represent the leading cause of death for children over the age of 3 years old [1] and account for an estimated 50% of pediatric trauma, with 15% - 28% resulting in lower extremity orthopedic injury [2-4]. In both the adult and the pediatric population injury to the lower extremity is often reported second in prevalence to head injury when discussing all possible injuries sustained in motor vehicle accidents [3, 4]. As vehicles continue to get safer, fewer children are dying, shifting the paradigm and increasing the need to understand other non-life threatening injuries sustained in the MVA. As survival rates increase, non-life threatening injuries that often require medical attention also increase. There are approximately 18 children hospitalized and 400 children receiving medical treatment for every fatality [1]. All areas of the body at risk for injury need to be studied in order to gain a better understanding of the exact mechanism causing the injury. Incomplete instrumentation and a lack of biofidelity in the extremities of the child anthropomorphic test device (ATD) pose even greater challenges to studying some regions of the body known to interact with the interior of the vehicle.
As children are turned to the forward facing position, the child is at a greater risk for lower extremity injury as the legs collide with the front seatback. Forces are then transmitted up through the ankle, tibia and knee, especially in a frontal collision. As the foot-ankle-lower leg complex makes contact with the front row seatback, injuries to the tibial physes, tibial plafond and talus are fairly common and very serious [5-9]. Some lower extremity injuries are missed while the child is in the Emergency Department (ED), due to evaluative focus on the head, thorax and abdomen [6].
Another confounding variable which can increase injury severity in the lower extremity involves improperly restrained or unrestrained children in MVAs [2-3, 10]. Studies evaluating child restraint misuse show an increase in morbidity and mortality for children in MVAs [11]. Brown [2] found a large increase in
L. C. Boucher is a PhD. Candidate in Anatomy at The Ohio State University, Columbus, Ohio and an Instructor in the Health and Sport Sciences Department at Capital University, Columbus, Ohio (phone: 614-236-6629, e-mail: [email protected]). A. Chaudhari is Co-Director of Movement Analysis & Performance Program and Assistant Professor in the Department of Orthopaedics at The Ohio State University. Y-S Kang is the Director of the Injury Biomechanics Research Lab at The Ohio State University. J. Bolte IV is the Director of the Injury Biomechanics Research Center and Associate Professor in the Division of Anatomy at The Ohio State University, Columbus, Ohio.
IRC-13-28 IRCOBI Conference 2013
- 195 -

orthopedic injuries in the unrestrained population. Those sitting in the front seat were more likely to suffer thorax, abdominal, pelvis and orthopedic injuries. This group also had the greatest percent of fatalities at 16.18%. Brown [1] was also able to assess the protective value of seatbelts, which showed a decrease in the risk of orthopedic injury from 40% if unbelted to 15% if belted.
Anatomic differences between the child and the adult play an important role in the different injury responses between these populations. One of the key anatomical differences is the presence of physes and epiphyses, which are also known as growth plates. Primary ossification of the tibia, calcaneus, cuboid, talus and phalanges often occurs by birth; however, secondary ossification takes place later into childhood [6]. The phalanges, metatarsals and navicular often do not ossify until around 3 years, the calcaneus may not ossify until the age of 10 [6] and the distal tibial physes asymmetrically ossifies around the age of 14 [12]. Delayed physeal closure and the inherent cartilaginous nature of the bone may account for some of the variation in pediatric injuries [6].
Pediatric injury biomechanics of the lower extremity is an area in need of more research in order to gain a better understanding of both low and high velocity trauma mechanisms, like those seen in MVAs. There has been significant advancement in the sophistication of the instrumentation in the adult ATDs, but the pediatric population has not yet seen the same advancements; for example, the Hybrid III adult male and female ATDs have instrumentation in the lower extremity, providing valuable data in frontal impact testing. Up to this point, little work has been done in the area of pediatric lower extremity injury, due in part to a lack of sufficient instrumentation on pediatric ATDs. The pediatric ATDs have a simple clevis ankle, which does not react realistically, and therefore the forces that are transmitted through the ankle may not be reflective of the actual event. The mechanisms of lower extremity injury are not clearly understood and there is currently no efficient way to directly measure them.
The objective of this study is to evaluate the anthropometric characteristics, range of motion of the ankle and dynamic ankle stiffness on pediatric volunteers between the ages of 4-12 years old. These data will be used to gain a better understanding of the characteristics and response of the pediatric ankle with the goal to develop a more realistic ankle on the pediatric ATD.
II. METHODS
Forty-two children between the ages of 4-12 years old were divided into two groups; Group A: ages 4-7 years old and Group B: ages 8-12 years old (Table 1). Group A corresponds to the 6 year old ATD and Group B corresponds to the 10 year old ATD. Exclusion criteria included any previous ankle injury or surgery. Prior to participation all procedures were discussed with each subject and guardian. Parental consent was obtained in accordance with the Institutional Review Board (IRB# 2011H0300) of The Ohio State University. All data were collected in one testing session in the Sports Biomechanics Laboratory at The Ohio State University.
TABLE 1
SUBJECT DEMOGRAPHICS (MEAN ±SD) Group Total Sex Average Age (years) Average Weight (kg.)
Group A:
4-7 years old
21 M = 9
F = 12
5.7 (±1.1) 21.9 (±4.5)
Group B:
8-12 years old
21 M = 12
F = 9
9.4 (±1.2) 36.6 (±8.0)
Anthropometry Measurements Anthropometry measurements were recorded for each subject following the NHTSA Test Reference
Guidelines [13]. Additional measurements were taken following [14] for completeness (Appendix A). All measurements were measured bilaterally using appropriate anthropometry instruments (Rosscraft Innovations Inc).
IRC-13-28 IRCOBI Conference 2013
- 196 -
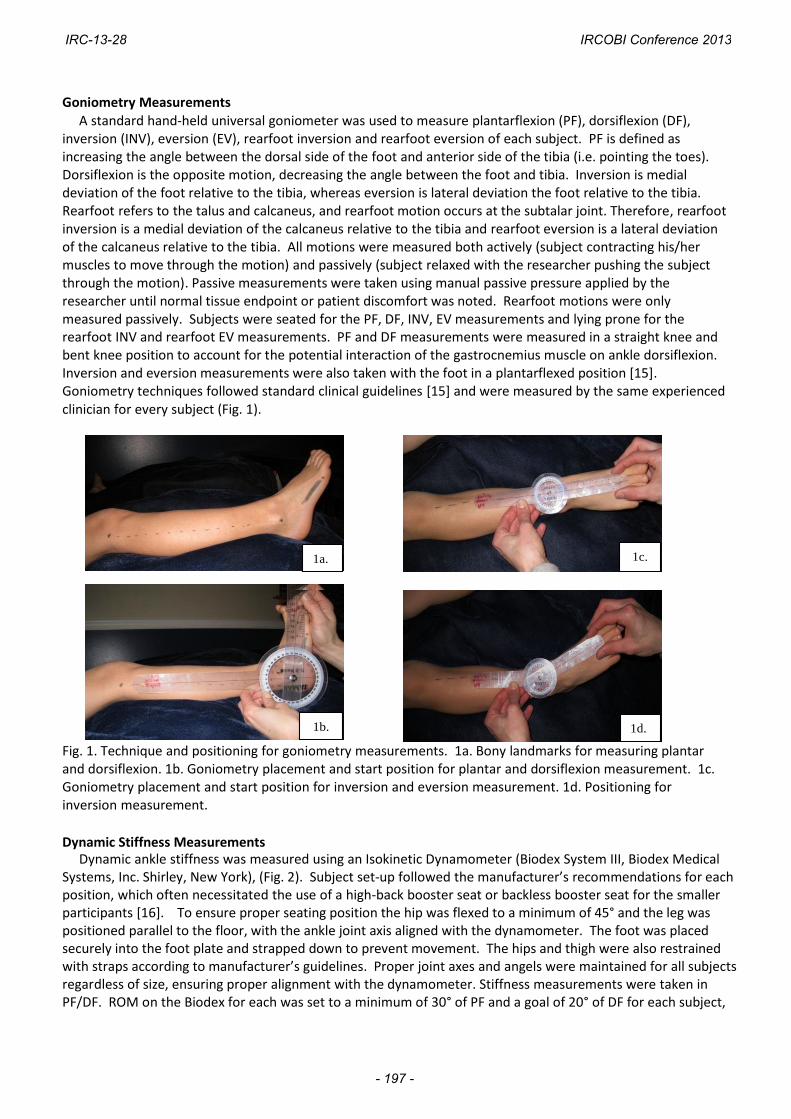
Goniometry Measurements A standard hand-held universal goniometer was used to measure plantarflexion (PF), dorsiflexion (DF),
inversion (INV), eversion (EV), rearfoot inversion and rearfoot eversion of each subject. PF is defined as increasing the angle between the dorsal side of the foot and anterior side of the tibia (i.e. pointing the toes). Dorsiflexion is the opposite motion, decreasing the angle between the foot and tibia. Inversion is medial deviation of the foot relative to the tibia, whereas eversion is lateral deviation the foot relative to the tibia. Rearfoot refers to the talus and calcaneus, and rearfoot motion occurs at the subtalar joint. Therefore, rearfoot inversion is a medial deviation of the calcaneus relative to the tibia and rearfoot eversion is a lateral deviation of the calcaneus relative to the tibia. All motions were measured both actively (subject contracting his/her muscles to move through the motion) and passively (subject relaxed with the researcher pushing the subject through the motion). Passive measurements were taken using manual passive pressure applied by the researcher until normal tissue endpoint or patient discomfort was noted. Rearfoot motions were only measured passively. Subjects were seated for the PF, DF, INV, EV measurements and lying prone for the rearfoot INV and rearfoot EV measurements. PF and DF measurements were measured in a straight knee and bent knee position to account for the potential interaction of the gastrocnemius muscle on ankle dorsiflexion. Inversion and eversion measurements were also taken with the foot in a plantarflexed position [15]. Goniometry techniques followed standard clinical guidelines [15] and were measured by the same experienced clinician for every subject (Fig. 1).
Fig. 1. Technique and positioning for goniometry measurements. 1a. Bony landmarks for measuring plantar and dorsiflexion. 1b. Goniometry placement and start position for plantar and dorsiflexion measurement. 1c. Goniometry placement and start position for inversion and eversion measurement. 1d. Positioning for inversion measurement.
Dynamic Stiffness Measurements Dynamic ankle stiffness was measured using an Isokinetic Dynamometer (Biodex System III, Biodex Medical Systems, Inc. Shirley, New York), (Fig. 2). Subject set-up followed the manufacturer’s recommendations for each position, which often necessitated the use of a high-back booster seat or backless booster seat for the smaller participants [16]. To ensure proper seating position the hip was flexed to a minimum of 45° and the leg was positioned parallel to the floor, with the ankle joint axis aligned with the dynamometer. The foot was placed securely into the foot plate and strapped down to prevent movement. The hips and thigh were also restrained with straps according to manufacturer’s guidelines. Proper joint axes and angels were maintained for all subjects regardless of size, ensuring proper alignment with the dynamometer. Stiffness measurements were taken in PF/DF. ROM on the Biodex for each was set to a minimum of 30° of PF and a goal of 20° of DF for each subject,
1a. 1c.
1b. 1d.
1a. 1c.
1b.
IRC-13-28 IRCOBI Conference 2013
- 197 -

without sacrificing the child’s comfort. Each subject completed 1 set of 4 repetitions at 5°/sec., followed by 1 set of 5 repetitions at 30°/sec, and a third set at 60°/sec. in PF and DF. Angular position and torque from the dynamometer was collected at 100Hz. The testing position order was randomized for each subject. The degrees and torque values were recorded throughout the entire ROM. Subjects were instructed to push against the dynamometer as it moved through the ROM and were given verbal encouragement as well as visual feedback on the computer screen for each repetition to ensure maximum effort.
Fig. 2. Child seating position on the Biodex System III Isokinetic Dynamometer: 2a. 4 yr. old child position with a high back booster seat. 2b. 8 yr. old child position without a booster seat.
Statistical Methods Ankle ROM is expressed as means and standard deviations (SD). Paired T-Tests were used to compare right
and left sides for ROM and stiffness. Mean and standard deviations were calculated for each variable. Two-tailed, Independent measures T-test was used to evaluate ROM and stiffness between groups in both the 30°/sec and 60°/sec conditions. Two-tailed, Independent measures T-tests were also used to compare within-group differences in stiffness to evaluate the effect of speed on stiffness. Lastly stiffness targets were developed based on the average means for Group A and B in DF and PF at 30°/sec and 60°/sec. IBM SPSS 20.0 statistical software was used for all statistical analyses.
III. RESULTS
Anthropometry Measurements
Anthropometry measurements showed an increase in all measures from Group A to Group B. A description of the anthropometry measurement procedures is located in Appendix A. All of the measurements of the pediatric volunteers are located in Appendix B. Selected values were compared to the current Hybrid III 6 year old and 10 year old ATD. These data are presented in Fig 3.
Fig. 3. Selected anthropometry data comparing Group A (4-7 yr. old volunteers) to the Hybrid III 6 year old ATD and Group B (8-12 yr. old volunteers) to the 10 year old ATD.
2a. 2b.
IRC-13-28 IRCOBI Conference 2013
- 198 -

Goniometry Measurements All range of motion measurements and averages are listed in Appendix C. Independent measures t-tests (two-tailed) with a statistical significance of α=.05 were used to evaluate the ROM between Group A and Group B. Range of motion data with significant between-group differences are presented in Table 2.
TABLE 2
Statistically significant range of motion values between Group A and Group B
Motion (°) Group A (SD) Group B (SD) P-value
Active DF Straight Leg – Left 12.6 (±5.8) 8.6 (±4.3) 0.014
Passive DF Straight Leg – Right 17.9 (±7.3) 13.1 (±4.9) 0.017
Passive DF Straight Leg – Left 18.5 (±6.6) 12.3 (±4.5) 0.001
Active DF Bent Leg – Right 20.3 (±5.7) 14.8 (±5.4) 0.002
Active DF Bent Leg – Left 20.8 (±6.6) 16.6 (±6.3) 0.043
Passive DF Bent Leg – Right 26.5 (±5.5) 19.9 (±4.3) 0.000
Passive DF Bent Leg – Left 27.8 (±7.7) 21.2 (±6.1) 0.004
Passive Eversion – Left 21.9 (±6.8) 17.8 (±5.6) 0.040 Statistical analyses revealed no difference in range of motion between the right and the left ankle, so values were averaged across groups for each motion measured. All of the average ROM values are listed in Appendix C. The average ROM values were then compared to the published normal ROM values from the American Medical Association (AMA) and the American Academy of Orthopaedic Surgeons (AAOS), along with values from the 6 year old ATD. Table 3 presents the published normal ROM as well as the average bent knee passive ROM values from the volunteer data for Group A and Group B.
TABLE 3 Published Normal ROM vs. Measured Pediatric Average Passive ROM vs. Hybrid III 6 year old ROM (°)
Motion AMA1 AAOS2 Group A Hybrid Group B (Degrees) III 6y.o.
Dorsiflexion 20 20 27.2 50 20.4
Plantar flexion 40 50 76.5 50 72.3
Inversion 30 35 44.8 ---- 42.3
Eversion 20 15 21.9 ---- 18.1
Rearfoot ---- 5 13.4 ---- 13.4 Inversion Rearfoot ---- 5 6.5 ---- 5.8 Eversion 1American Medical Association
2American Academy of Orthopaedic Surgeons
Dynamic Stiffness Measurements Due to a lack of within-subject repeatability the trials recorded at 5°/sec were thrown out. Both the 30°/sec
and 60°/sec conditions were analyzed. The middle three trials of each set were individually plotted (torque vs. displacement). A linear regression line was fit to the slope of each plot. The trials with an r2 value ≥0.80 were considered valid trials and were averaged together with the other trials from the same set. Once the average of the trial was obtained another linear regression line was fit to the newly calculated trial average. The slope of the trial average is considered the dynamic stiffness. The process is shown in Fig. 3. This process was conducted for all 42 subjects on both the right and left leg. The stiffness values for DF and PF are presented in Tables 4 & 5.
IRC-13-28 IRCOBI Conference 2013
- 199 -

Fig. 3. Dorsiflexion Stiffness calculation: Individual trials were plotted and then averaged if the r2 value was above 0.08. A linear regression line was then used to find the new slope of the average, which is representative of the dynamic stiffness for the subject.
TABLE 4 AVERAGE STIFFNESS (Nm/°): GROUP A
Dorsiflexion Right (SD) Left (SD) Plantar Flexion Right (SD) Left (SD) 30°/sec 1.06 (0.76)
N=18 1.02 (0.69)
N=18 30°/sec 0.30 (0.21)
N=10 0.27 (0.16)
N=13 60°/sec 1.36 (0.97)
N=13 1.23 (0.71)
N=16 60°/sec 0.41 (0.21)
N=7 0.39 (.022)
N=9
TABLE 5 AVERAGE STIFFNESS (Nm/°): GROUP B
Dorsiflexion Right (SD) Left (SD) Plantar Flexion Right (SD) Left (SD)
30°/sec 2.02 (0.48) N=18
1.90 (0.77) N=17
30°/sec 0.62 (0.23) N=16
0.61 (0.24) N=19
60°/sec 2.36 (0.78) N=19
2.23 (0.91) N=19
60°/sec 0.76 (0.22) N=15
0.72 (0.24) N=18
Paired T-tests (2-tailed) were used to evaluate right and left ankle stiffness values for each position and speed measured. An alpha level of P=0.05 was set a priori for all analyses. No significant difference was found between
the right and left ankles in Group A in DF at 30°/sec and 60°/sec (P=0.50, P=0.46) and in PF at 30°/sec and 60°/sec (P=0.86, P=0.72). No significance differences were found in Group B in DF at 30°/sec and 60°/sec (P=0.78, P=0.51), or PF at 30°/sec or 60°/sec (P=0.645, P=0.627). Because there were no differences between right and
IRC-13-28 IRCOBI Conference 2013
- 200 -

left ankles, the data were averaged together for the remaining analyses, as the ATD will have the same ankle for both the right and left sides. Within-group comparisons for the effect of speed were not significant for Group A or Group B. Stiffness comparison between Group A and Group B did reveal significant differences at both speeds where Group A has significantly less average stiffness than Group B (DF Stiffness at 30°/sec P=.000, DF stiffness at 60°/sec P=.000, PF Stiffness at 30°/sec P=.000, PF stiffness at 60°/sec P=.001) (Fig. 4).
Group
60deg/sec30deg/sec
BABA
4
3
2
1
0
Sti
ffn
ess (
Nm
/d
eg
)
Average Dorsiflexion Between Group Differences
C1
60deg/sec30deg/sec
BABA
1.2
1.0
0.8
0.6
0.4
0.2
0.0
Sti
ffn
ess (
Nm
/d
eg
)
Average Plantar Flexion Between Group Differences
Fig. 4. Average dorsiflexion and plantar flexion plots comparing Group A and Group B.
Once stiffness was calculated, the mean curves for both groups at 30°/sec and 60°/sec were used to create
stiffness targets of ± 1 S.D. (Fig. 5 and Fig. 6). The negative values seen in Figure 5 are assigned by the Biodex to identify the difference between DF and PF, and are representative of 0-12° of measured DF stiffness. As DF increases, so does the stiffness of the ankle joint. This same trend is seen in PF; as PF increases so does the stiffness. The targets can be used to help guide the proper ankle stiffness range for a more biofidelic ATD ankle.
Fig. 5. Dorsiflexion targets for the 6 and 10 yr. old ATD based on average stiffness of Groups A and B.
Fig. 6. Plantar flexion targets for 6 and 10 yr. old ATD based on average stiffness of Groups A and B.
IRC-13-28 IRCOBI Conference 2013
- 201 -

IV. DISCUSSION
The data from this study help to confirm the developmental differences in the pediatric population when
comparing Group A, with an average age of 5.7 years old, to Group B, with an average age of 9.4 years old.
Differences in anthropometry were expected between the groups. When comparing the volunteer
measurements to the measurements of the 6 and 10 year old ATDs, the results were quite similar and are
reassuring that the current external dimensions and weight is representative of the population. Some of the
variation in the data, including both ROM values and average dynamic stiffness values, highlight some of the
vast neuromuscular and musculoskeletal differences between these two groups of children.
Motion at the ankle can vary due to many factors, some of those being age and gender. Range of motion is known to change throughout life. Newborns have double the dorsiflexion motion, as compared to adults, but within the first five years this value should decrease [15]. Plantar flexion in the newborn is less than adults, but a newborn quickly gains this motion within the first few weeks of life [15]. The ROM presented in Table 2 depicts the significant differences between Group A and Group B. Though many of the measurements were not statistically significant between Group A and B, all of the ROM measures were greater in the younger population. Adult average ROM values as reported by the AMA and AAOS are reported in Table 3 and are clearly different than those in the pediatric population showing the importance of using pediatric data when making reference to ankle range of motion. Soucie [17] reports pediatric ROM in 2-8 year old volunteers similar to ours in DF and PF values, reporting DF of 24.8° and PF of 67.1°. As the pediatric musculoskeletal system continues to develop, the motion around certain joints also experiences changes. This is seen specifically in ankle range of motion, as the amount of available motion changes throughout the lifespan. Both plantar and dorsiflexion motion decreases with age [15],[18]. Studies have shown a wide variability in range of motion in all populations, but this is especially true in children [19]. The decreases in ankle motion with age seem to be related to decreased extensibility of the musculotendinous unit [20]. Differences in motion between the right and left limb are also documented in the literature [18-19], but were not observed in this study.
Joint stiffness is a complex interaction of the passive and active restraints about a joint. The tissues contributing to joint stiffness come from the muscles, tendons, ligaments, joint capsule, skin, fascia and the cartilage that surround a given joint [21]. It is believed that increased stiffness is desirable, especially for protection against injurious forces [21]. The gastrocnemius muscle plays an important role in the stiffness of the ankle joint. Because the gastrocnemius muscle crosses both the knee joint and the ankle joint, placing the knee in a flexed position will lessen the influence that the gastrocnemius has at the ankle. The Biodex protocol in this study called for the subjects to be positioned in a flexed knee position, which best represents the positioning of the child when seated in the rear seat of a vehicle and should lead to the most relevant measured ankle stiffness. Though the child’s leg may extend to make contact with the front seatback in a collision, some degree of knee flexion will most likely remain present.
Assessing quasi-static and dynamic stiffness in children can be a challenging task. Variability in neuromuscular development, strength and individual effort all contribute to this challenge. It is well documented that a task as basic as walking does not reach a mature gait pattern, on average, until the age of seven years old. We must refrain from thinking of the growing and developing child as a small adult, as their complex and variable development provides one of the greatest challenges in pediatric research [22]. The DF stiffness for Group A was between 1.02-1.23Nm/° and Group B with values ranging from 1.90-2.36Nm/° (Table 4). PF stiffness for group A ranged from .27-.41Nm/° and .61-.76Nm/° for Group B (Table 5). It is important to note the number of subjects actually included in each measurement, as there was widespread variability in some of the subjects and, therefore, some data were excluded from this analysis. DF trials were much more consistent when compared to the plantar flexion trials. Trials at 30°/sec were also more consistent when compared to the trials at 60°/sec. Some of the lack of repeatability within subjects may demonstrate some of the variability in neuromuscular and strength development in this young population. Regardless of this variability, there was typically a consistent pattern through a given ROM for each subject. It is also important to highlight the highly significant differences in stiffness between Group A and Group B, considering that these two populations are less than 4 years apart.
The stiffness targets also point out some important developmental differences between the two groups.
IRC-13-28 IRCOBI Conference 2013
- 202 -

The target for Group A is visibly wider, depicting the wider variability of the younger group. The DF targets cross 0 at just under 20Nm of torque for Group A compared with almost 40Nm of torque for Group B, demonstrating some additional developmental differences. Group B has approximately double the amount of torque production/degree when compared to the younger group. The PF stiffness targets show less drastic trends, whereas Group B presents with greater torque values for the entire target, but only approximately 5Nm greater than the younger group. This is an important point which helps to highlight the vast differences in the growing child.
Limitations One of the limitations to this study was the vast variability between the subjects, especially during the active
stiffness measurement. Many of the trials were discarded due to a lack of repeatability. The protocol on the Biodex may have also been too challenging to some of the volunteers. Though all subjects completed the protocol without incident, the actual task they were being asked to complete may have been more advanced than their current neuromuscular developmental state. Both of these challenges demonstrate the importance for larger sample sizes when dealing with a pediatric population. It should also be noted that our stiffness values were not calculated at the physiological end range of motion, where injury is more likely to occur at the ankle, though the stiffness values calculated do provide important information when considering load transmission to more proximal regions, such as the tibia, knee, femur, and pelvis. Another limitation of this study was that electromyography data was not collected and therefore % MVC of muscle activation cannot be determined. Only assumptions can be made regarding how much muscular effort was being used during each trial. The children were asked to put forth maximal effort throughout the ROM and were provided both verbal and visual feedback.
V. CONCLUSIONS
The results of this investigation demonstrate differences between the 6 and 10 year old child groups in anthropometry, ROM and stiffness, creating more realistic design guidelines for increasing the biofidelity of 6 and 10 year old ATDs. Not only will a properly instrumented pediatric ATD allow for advances in automotive safety and manufacturing of safer child restraint systems, but it will also allow us to directly measure optimal and suboptimal positioning of the child with a more accurate picture of the forces experienced by the vulnerable lower extremity. Understanding the entire scope of the accident is critical in lessening the severity and frequency of such injuries. It is important to take into consideration the rapid growth and developmental changes in children in potential future research designs. However, the ability to collect data from pediatric volunteers is extremely valuable and should be encouraged in future projects. The information gained by this study may also give clinicians a greater understanding of the pediatric ankle tolerance and response to injury, which may assist in further understanding ankle injuries suffered in sport and other types of accidents.
VI. ACKNOWLEDGEMENT
I would like to thank the Center for Children’s Injury Prevention Studies (CChIPS) for funding this research
project. I would like to also thank the staff in the Sport Biomechanics Laboratory for permission to use the
facility for data collection. Lastly, I would like to thank the staff and students in the Injury Biomechanics
Research Center who assisted with various portions of this project.
IRC-13-28 IRCOBI Conference 2013
- 203 -

VII. REFERENCES
[1] Durbin D, Child passenger safety, Pediatrics, 127(4):e1050-e1066, 2011, doi:10.1542/peds.2011-0215.
[2] Brown JK, Jing Y, Wang S, Ehrlich PF, Patterns of severe injury in pediatric car crash victims: Crash Injury
Research Engineering Network database, Journal of Pediatric Surgery, 41(2):362-367, 2011.
[3] Jermakian JS, Locey CM, Haughey LJ, Lower extremity injuries in children seated in forward facing child
restraint systems, Traffic Injury Prevention, 8:171-179, 2007.
[4] Meier R, Krettek C, Grimme K, Regel G, Remmers D, Harwood P, Pape HC, The Multiply Injured Child, Clinical Orthopaedics and Related Research, 432, 127-131, 2005. [5] Marsh JS, Daigneult JP, Ankle injuries in the pediatric population, Current Opinion in Pediatrics, 12(1), 52- 60, 2000. [6] Kay RM, Tang CW, Pediatric Foot Fractures: Evaluation and Treatment, Journal of the American Academy of Orthopedic Surgeons, 9, 308-319, 2001. [7] Rohmiller MT, Gaynor TP, Pawelek J, Salter-Harris I and II of the Distal Tibia: Does Mechanism of Injury Relate to Premature Physeal Closure? Journal of Pediatric Orthopedics, 26(3), 322-328, 2006. [8] Ribbans WJ, Natarajan R, Alavala S, Pediatric Foot Fractures, Clinical Orthopaedics and Related Research, 432, 107-115, 2005. [9] Seel EH, Brasel KJ, Stahovic L, Paulson J, Schneeberger B, Kuhn EM, Outcome of distal tibial physeal injuries, Journal of Pediatric Orthopedics, 20(4), 242-248., 2011. [10] Johnston C, Rivara FP, Soderberg R, Children in Car Crashes: Analysis of Data for Injury and Use of Restraints, Pediatrics, 93(6), 960-965, 1994. [11] Bulger EM, Kaufman R, Mock C, Childhood Crash Injury Patterns Associated with restraint Misuse: Implications for Field Triage, Prehospital and Disaster Medicine, 23(1), 9-15, 2008. [12] Sarraff LM, Haines CJ, Common Orthopedic Injuries in the Pediatric ED – Part II, Pediatric Emergency Medicine Reports, 2010, Accessed September 13, 2010.
[13] NHTSA Test Reference Guidelines, Version 2, Volume 5 (2006).
[14] Crandall JR, Biomechanical Response and Physical Properties of the Leg Foot and Ankle, Society of Automotive Engineers, 173-192, 1996. [15] Norkin CC, White DJ, Measurement of Joint Motion: A Guide to Goniometry (4th ed.), F.A. Davis Company, Philadelphia, PA, 2009.
[16] http://biodex.com/sites/default/files/manuals/850000man_08262reva.pdf. [Accessed April 1, 2013].
[17] Soucie J, Wang C, Forsyth A., Funk S, Denny M., Roach K, Boone D, Range of motion measurements: reference values and a database for comparison studies, Haemophilia, 17(3), 500-507, 2011. doi:10.1111/j.1365-2516.2010.02399.
IRC-13-28 IRCOBI Conference 2013
- 204 -
[18] James B, Parker AW, Active and Passive Mobility of the Lower Limb Joints in Elderly Men and Women, American Journal of Physical Medicine and Rehabilitation, 68(4), 162-167, 1989. [19] Alanan JT, Levola J, Helenius H, Kyist M, Ankle Joint Complex Mobility in Children 7 to 14 Years Old, Journal of Pediatric Orthopedics, 21(6), 731-73, 2001. [20] Nigg B, Fisher V, Allinger T, Ronsky J, & Engsberg J, Range of motion of the foot as a function of age, Foot & Ankle, 13(6), 336-343, 1992. [21] Riemann BL, The Effects of Sex, Joint Angle, and the Gastrocnemius Muscle on Passive Ankle Joint Complex Stiffness, Journal of Athletic Training, 36(4), 369-377,2011.
[22] Sutherland D, The development of mature gait, Gait and Posture, 6, 163-170, 1997.
VIII. APPENDIX
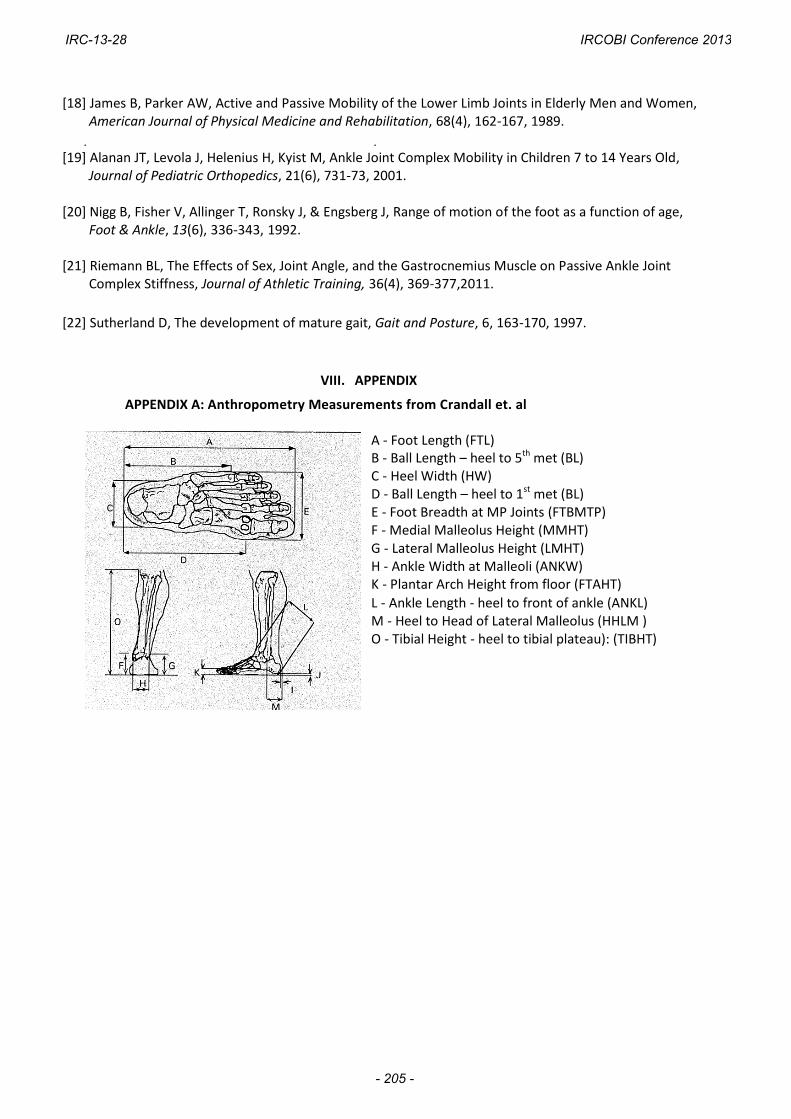
APPENDIX A: Anthropometry Measurements from Crandall et. al
A - Foot Length (FTL) B - Ball Length – heel to 5th met (BL) C - Heel Width (HW) D - Ball Length – heel to 1st met (BL) E - Foot Breadth at MP Joints (FTBMTP) F - Medial Malleolus Height (MMHT) G - Lateral Malleolus Height (LMHT) H - Ankle Width at Malleoli (ANKW) K - Plantar Arch Height from floor (FTAHT)
L - Ankle Length - heel to front of ankle (ANKL) M - Heel to Head of Lateral Malleolus (HHLM ) O - Tibial Height - heel to tibial plateau): (TIBHT)
IRC-13-28 IRCOBI Conference 2013
- 205 -

APPENDIX B:
Anthropometry Measurements (Right / Left)
Measurement (cm) Group 1 Group 2
Foot Length 17.5 / 17.5 20.5 / 20.3
Ball Length (5th Metatarsal) 12.2 / 12.2 14.4 / 14.3
Ball Length (1st Metatarsal) 13.5 / 13.4 15.6 / 15.4
Heel Width 3.8 / 3.8 4.2 / 4.2
Foot Breadth at MTP Joint 6.6 / 6.5 7.5 / 7.5
Medial Malleolus Height 6.0 / 6.0 6.5 / 6.4
Lateral Malleolus Height 4.5 / 4.4 5.1 / 5.1
Ankle Width at Malleoli 5.0 / 5.0 6.3 / 6.2
Plantar Arch Height 2.0 / 2.1 1.7 / 1.6
Ankle Length 8.6 / 8.6 9.9 / 9.8
Heel to Head of Lateral Malleolus 4.3 / 4.2 4.6 / 4.7
Tibial Height 30.1 / 31.0 37.9 / 37.6
Tibial Length 28.2 / 27.4 32.8 / 32.6
Seated Height 63.0 72.1
Knee Seated Height 36.5 / 36.6 44.4 / 44.2
Calf Circumference 23.0 / 23.0 25.8 / 25.6
Ankle Circumference 15.4 / 15.3 18.2 / 18.2
IRC-13-28 IRCOBI Conference 2013
- 206 -

APPENDIX C:
Group A: Range of Motion Measurements
Motion (°) Right (SD) Left (SD) Average R & L
Straight Leg Plantar Flexion: Active 67.7 (7.4) 69.0 (6.5) 68.4
Straight Leg Plantar Flexion: Passive 72.7 (6.5) 74.4 (7.0) 73.6 Straight Leg Dorsiflexion: Active 11.6 (6.9) 12.6 (5.8) 12.1
Straight Leg Dorsiflexion: Passive 17.9 (7.3) 18.5 (6.6) 18.2 Bent Knee Plantar Flexion: Active 70.4 (6.4) 73.4 (6.9) 71.9
Bent Knee Plantar Flexion: Passive 75.8 (5.9) 77.2 (7.56) 76.5 Bent Knee Dorsiflexion: Active 20.3 (5.7) 20.8 (6.6) 20.6
Bent Knee Dorsiflexion: Passive 26.5 (5.4) 27.8 (7.7) 27.2
Inversion: Active 35.5 (9.1) 37.4 (6.4) 36.5 Inversion: Passive 45.1 (10.4) 44.4 (8.2) 44.8
Eversion: Active 16.0 (6.6) 15.8 (5.4) 15.9 Eversion: Passive 21.9 (6.7) 21.9 (6.8) 21.9
Rearfoot Inversion 13.2 (4.7) 13.4 (5.3) 13.3 Rearfoot Eversion 6.2 (3.3) 6.8 (2.7) 6.5
Group B: Range of Motion Measurements
Motion (°) Right (±SD) Left (±SD) Average R & L
Straight Leg Plantar Flexion: Active 68.1 (8.9) 67.9 (10.6) 68.0
Straight Leg Plantar Flexion: Passive 72.1 (8.1) 71.2 (9.6) 71.7 Straight Leg Dorsiflexion: Active 9.1 (5.3) 8.6 (4.3) 8.9
Straight Leg Dorsiflexion: Passive 13.1 (4.8) 12.3 (4.5) 12.7 Bent Knee Plantar Flexion: Active 69.3 (7.3) 70.1 (8.7) 69.7
Bent Knee Plantar Flexion: Passive 71.9 (7.1) 72.6 (7.8) 72.3 Bent Knee Dorsiflexion: Active 14.8 (5.4) 16.6 (6.3) 15.7
Bent Knee Dorsiflexion: Passive 19.6 (4.3) 21.2 (6.1) 20.4
Inversion: Active 36.6 (5.3) 35.5 (5.5) 36.1 Inversion: Passive 43.1 (6.2) 41.4 (6.8) 42.3
Eversion: Active 13.6 (4.7) 13.8 (5.1) 13.7 Eversion: Passive 18.4 (5.1) 17.8 (5.6) 18.1
Rearfoot Inversion 13.9 (5.4) 12.8 (3.8) 13.4 Rearfoot Eversion 5.7 (2.7) 5.9 (2.0) 5.8
IRC-13-28 IRCOBI Conference 2013
- 207 -