rand corporation and iza - econstor.eu
TRANSCRIPT

econstorMake Your Publications Visible.
A Service of
zbwLeibniz-InformationszentrumWirtschaftLeibniz Information Centrefor Economics
Lei, Xiaoyan; Smith, James P.; Sun, Xiaoting; Zhao, Yaohui
Working Paper
Gender Differences in Cognition in China andReasons for Change over Time: Evidence fromCHARLS
IZA Discussion Papers, No. 7536
Provided in Cooperation with:IZA – Institute of Labor Economics
Suggested Citation: Lei, Xiaoyan; Smith, James P.; Sun, Xiaoting; Zhao, Yaohui (2013) : GenderDifferences in Cognition in China and Reasons for Change over Time: Evidence from CHARLS,IZA Discussion Papers, No. 7536, Institute for the Study of Labor (IZA), Bonn
This Version is available at:http://hdl.handle.net/10419/80560
Standard-Nutzungsbedingungen:
Die Dokumente auf EconStor dürfen zu eigenen wissenschaftlichenZwecken und zum Privatgebrauch gespeichert und kopiert werden.
Sie dürfen die Dokumente nicht für öffentliche oder kommerzielleZwecke vervielfältigen, öffentlich ausstellen, öffentlich zugänglichmachen, vertreiben oder anderweitig nutzen.
Sofern die Verfasser die Dokumente unter Open-Content-Lizenzen(insbesondere CC-Lizenzen) zur Verfügung gestellt haben sollten,gelten abweichend von diesen Nutzungsbedingungen die in der dortgenannten Lizenz gewährten Nutzungsrechte.
Terms of use:
Documents in EconStor may be saved and copied for yourpersonal and scholarly purposes.
You are not to copy documents for public or commercialpurposes, to exhibit the documents publicly, to make thempublicly available on the internet, or to distribute or otherwiseuse the documents in public.
If the documents have been made available under an OpenContent Licence (especially Creative Commons Licences), youmay exercise further usage rights as specified in the indicatedlicence.
www.econstor.eu

DI
SC
US
SI
ON
P
AP
ER
S
ER
IE
S
Forschungsinstitut zur Zukunft der ArbeitInstitute for the Study of Labor
Gender Differences in Cognition in China and Reasons for Change over Time: Evidence from CHARLS
IZA DP No. 7536
July 2013
Xiaoyan LeiJames P. SmithXiaoting SunYaohui Zhao

Gender Differences in Cognition in China and Reasons for Change over Time:
Evidence from CHARLS
Xiaoyan Lei CCER and IZA
James P. Smith
RAND Corporation and IZA
Xiaoting Sun CCER
Yaohui Zhao
CCER and IZA
Discussion Paper No. 7536 July 2013
IZA
P.O. Box 7240 53072 Bonn
Germany
Phone: +49-228-3894-0 Fax: +49-228-3894-180
E-mail: [email protected]
Any opinions expressed here are those of the author(s) and not those of IZA. Research published in this series may include views on policy, but the institute itself takes no institutional policy positions. The IZA research network is committed to the IZA Guiding Principles of Research Integrity. The Institute for the Study of Labor (IZA) in Bonn is a local and virtual international research center and a place of communication between science, politics and business. IZA is an independent nonprofit organization supported by Deutsche Post Foundation. The center is associated with the University of Bonn and offers a stimulating research environment through its international network, workshops and conferences, data service, project support, research visits and doctoral program. IZA engages in (i) original and internationally competitive research in all fields of labor economics, (ii) development of policy concepts, and (iii) dissemination of research results and concepts to the interested public. IZA Discussion Papers often represent preliminary work and are circulated to encourage discussion. Citation of such a paper should account for its provisional character. A revised version may be available directly from the author.

IZA Discussion Paper No. 7536 July 2013
ABSTRACT
Gender Differences in Cognition in China and Reasons for Change over Time: Evidence from CHARLS*
In this paper, we model gender differences in cognitive ability in China using a new sample of middle-aged and older Chinese respondents. Modeled after the American Health and Retirement Survey (HRS), CHARLS respondents are 45 years and older and are nationally representative of the Chinese population in this age span. Our measures of cognition in CHARLS relies on two measures that proxy for different dimensions of adult cognition – episodic memory and intact mental status. We relate these cognitive measures to adult health and SES outcomes during the adult years. We find large cognitive differences to the detriment of women that were mitigated by large gender differences in education among these generations of Chinese people. These gender differences in cognition are especially concentrated in the older age groups and poorer communities within the sample. We also investigated historical, geographical, and cultural characteristics of communities to understand how they impact cognition. Economic development and environmental improvement such as having electricity, increase in wage per capita and green coverage ratio generally contribute to higher cognition ability. Women benefit more from the fruits of development – electricity and growth of green coverage ratio are conducive to lessening female disadvantage in cognition. JEL Classification: H10 Keywords: China, cognition Corresponding author: James P. Smith RAND Corporation 1776 Main Street PO Box 2138 Santa Monica, CA 90407 USA E-mail: [email protected]
* This research was supported by grants from the National Institute on Aging and Natural Science Foundation of China.
3
1. Introduction
Cognitive skills are important for many decisions including those that involve health and
financial outcomes. This may be especially true for older populations in a country such as China
where individuals often have to make important life decisions without the aid of professionals
specializing on those topics and where levels of cognitive ability are not high. This may be
particularly so for Chinese women who often outlive their husbands and will then have to start
making these decisions on their own. Largely due to the absence of relevant data for China, the
importance of cognitive skills for older populations in China has until recently received little
scholarly attention.1
In traditional low-income environments such as rural China, families may emphasize
development of human capital skills broadly defined in favor of sons at the expense of daughters.
This appears to be the case with standard measures of human capital such as schooling where
large gender gaps in schooling exist in low-income settings (Parish and Willis, 1993). As per-
capita incomes increase and education expands, education growth is much stronger for women
than for men so that gender disparities appear to begin to dissipate (Becker et al., 2010). In this
paper, we investigate whether these gender disparities extend ever deeper to basic cognitive
skills and how gender disparities in cognition change as economic development improves over
time.
In this research, we use a new data source—the Chinese Health and Retirement
Longitudinal Survey (CHARLS)—that is nationally representative of those ages 45 and over in
the Chinese population in 2011. This data contain detailed demographic, health, economic and
1 In a previous paper (Lei et al., 2011), we examined these cognition issues using the CHARLS pilot sample that only included people in two very distinct Chinese provinces—Zhejiang and Gansu.

4
cognitive information on individuals and families who are part of the study. CHARLS also
contains contemporaneous and historical information on the communities in which CHARLS
respondents live. Many of the attributes of these communities may be related to the cognitive
abilities of their older residents.
This paper is divided into five sections. The next section describes the baseline CHARLS
and the main cognition variables that will be used in our analysis. Section 3 outlines statistical
models estimated at understanding the underlying reasons for gender differences in cognition in
the Chinese context. Our main empirical findings relating individual and community level
attributes to the cognitive ability of male and female respondents are in Section 4. The final
section highlights our main conclusions.
2. Material and Methods
2.1. Data—CHARLS
The China Health and Longitudinal Study (CHARLS) is a nationally representative
longitudinal survey of the middle-aged and elderly population (45+) in China along with their
spouses, which includes an assessment of the social, economic, and health circumstances of
community-residents. 2 The ultimate purpose of CHARLS is to study the main health and
economic adjustments to rapid population aging in China. The national baseline survey of
CHARLS was conducted between June 2011 and March 2012 on 17,692 respondents. CHARLS
respondents will be followed every two years using a face-to-face CAPI interview. CHARLS has
been harmonized with leading international research studies in the Health and Retirement model
(HRS) to ensure adoption of best practice and international comparability of results.
2 For a detailed description of the CHARLS survey, see Zhao et al., 2012, “Cohort Profile: The China Health and Retirement Longitudinal Study,” International Journal of Epidemiology, forthcoming. Epublished ahead of print December 12, 2012: http://ije.oxfordjournals.org/content/early/2012/12/12/ije.dys203.long

5
CHARLS baseline data includes detailed information of respondents and their living
spouses. The CHARLS main questionnaire includes information on basic demographics, family,
health status, health care, employment, and household economy (income, consumption and
wealth). All data are collected by face-to-face, computer-aided personal interviews (CAPI).
The main adult outcome variables include key adult health and SES outcomes. Adult
health includes self-reported general health status, doctor diagnoses of chronic illnesses,
depression, word recall, lifestyle and health behaviors (physical activities, smoking, drinking),
subjective expectation of mortality, activities of daily living (ADLs), and instrumental activities
of daily living (IADLs). Some health variables, such as weight and height, are obtained from
health measurements conducted in the field.
Financial dimensions of SES in CHARLS are measured in terms of income, wealth, and
consumption expenditure. CHARLS separately measures income and assets at the individual
level as well as at the household level. CHARLS income components include wage income, self-
employment income, agricultural income, pension income and transfer income, where wage
income is collected for each of the household members, and transfer income separates
government transfers specific to individuals from those to households.
Asset measurements collected at household level include housing, fixed assets, durables
and land. Information on ownership status, value and characteristics of current residence, as well
as other housing owned by the household, are recorded. Deposits and other investments are
measured at the individual level, but debts are asked both for respondent and spouse, and for the
household.
Household expenditures are collected in CHARLS since the literature has shown that
expenditure can be a better welfare measure than income in developing countries (Strauss and

6
Thomas, 2008). Consumption items are collected at weekly, monthly, and yearly frequencies
respectively to minimize recall bias. Food expenditure is collected on weekly basis. It includes
expenditures on dining out, food bought from market, and values of home-produced food
consumed. Food expenditures induced by inviting guests for important events are collected to
better reflect household food expenditure per capita in a normal week. Monthly-based
expenditures are those usually spent each month, including fees for utilities, nannies,
communications, etc. Yearly-based items record expenditures occurred occasionally in a year,
including traveling, expenditures on durables, and education and training fees.
2.2. Measurement in CHARLS—cognition
Based on similar measures in HRS, there are two cognition measures used in this
research. The first is memory recall based on a respondent’s ability to immediately repeat in any
order ten Chinese nouns just read to them (immediate word recall) and to recall the same list of
words four minutes later (delayed recall). Following McArdle et al. (2007) and Lei et al. (2012),
we form an episodic memory measure as the average of immediate and delayed recall scores.
Episodic memory is a necessary component of reasoning in all dimensions. Our second cognitive
measure is based on some components of the mental status questions of the Telephone Interview
of Cognitive Status (TICS) battery established to capture intactness or mental status of
individuals. In CHARLS, mental status questions include the following items—serial 7
subtraction from 100 (up to five times) and whether the respondent needed any explanation or
used an aid such as paper and pencil, naming today’s date (month, day, year, and season), the
day of the week, and ability to redraw a picture shown to respondents. Answers to these
questions are aggregated into a single mental status score that ranges from 0 to 11.

7
Table 1 presents mean levels of our two measures of cognitive ability separately for
Chinese men and women stratified by age using samples of those providing their own
responses.3 Across all ages, Chinese men remember about two-tenths of a word more than their
female counterparts—a differential in favor of men that exists in all age groups in this table. The
male cognitive advantage is even larger for intact mental status where Chinese men achieve a
score more than a full point above that of Chinese women.
For both men and women, each cognitive measure declines sharply with age, a decline
likely a combination of cohort and aging effects. Prior research has suggested strong normative
age declines in most cognitive functions reflecting different aspects of adult cognitive profiles
(Levy, 1994;McArdle et al., 2002). In a country such as China which has experienced rapid
economic development during the last thirty years with impressive increases in schooling for
each new generation, one would also anticipate significant cohort effects in cognition. We come
back to this issue of cohort and aging effects below. There is a strong indication for both mental
intactness and episodic memory of smaller gender differences among younger cohorts in Table 1,
suggesting that there may be gender differential cohort or aging effects or both on cognition.
2.3. Education
An important dimension of socioeconomic status (SES) in any cognition analysis is
education, which is well known to be directly associated with increased cognitive ability in
several dimensions (McArdle and Woodcock, 1998). Education is obtained from the survey
3 Sample sizes in Table 1 and subsequent analysis tables are smaller than for the full CHARLS samples because respondents moved since their time and place of birth (2,350 observations), they were less than 45 years old (206 observations), or there were missing values on our two cognition variables (2075 observations). We re-estimated our models in Tables 4 and 5 below including those who moved since birth and those less than age 45 and obtained essentially found the same results as those presented in Tables 4 and 5. In addition, the third and sixth models in Table 4 lose about 1,800 observations since height was not measured for these respondents. Once again, this deletion does not appear to affect the results significantly.

8
question, “What is the highest level of school you have completed?” Twelve possible answers
were categorized into five mutually exclusive groups: 1) “Illiterate,” those who can neither read
nor write; 2) "Sishu/home school or below," including those who did not finish primary school
but were capable of reading or writing, or those who were reported to have been in “Sishu”4; 3)
“Finished elementary school,” those who have completed a primary school education; 4)
“Middle school,” those who have completed a middle school level education; and 5) “High and
above,” those who have completed a high school, vocational school, college, or graduate level
education.
Using these categories, Table 2 reports distributions of education by gender and age in
CHARLS baseline data. The educational level for older Chinese respondents is generally quite
low with very large gender disparities particularly among the oldest cohorts. Within the 45 years
and older Chinese population, there have also been impressive improvements over time in
education accomplishments especially for women. Eighty percent of women over age 74 are
illiterate compared to 40% of men in that age group. If we look instead at the youngest age group
in Table 2 (those 45-54 years old), one in every five women is illiterate compared to 5 percent of
the men. Education declines with age, but men have higher education levels than women in all
age groups. Although both men and women have become more educated over time, a significant
gender discrepancy still exists that is becoming smaller in the youngest cohorts compared to the
oldest cohorts in Table 2. Using the 2006 Chinese Census, Lei et al. (2012) show that these
education disparities have essentially disappeared among young Chinese adults, an indication of
the impressive narrowing of education disparities by gender in China over time.
4 Sishu is an old, private Chinese education style that before the 20th century taught young children reading, writing, and other fundamental skills.

9
2.4. Cognition and communities
Especially in rural China, communities are important social and economic entities that
have significant impacts on their residents. (Strauss et al., 2011 and Smith et al., 2012) find that
for many health outcomes unmeasured community effects are highly important, much more so
than one usually finds in other countries. Why communities are so central to understanding
China is a key question and answers may depend on the specific life outcome that is examined.
In terms of sex discrimination, where Chinese rural villages are close-knit communities where
residents inherit, preserve, and then pass on the same culture across generations, girls may not be
treated similarly relative to boys based on village attributes. These community traits may impact
cognitive ability of resident girls and boys and eventually those of women and men. To obtain an
initial look at economic attributes of communities, we divided all communities in the CHARLS
survey into ten groups based on the community average log PCE where mean community log
PCE was defined for each CHARLS respondent excluding the individual respondents’ own
family log PCE.
Table 3 documents for each of the ten community groups (1 indicates poorest and 10
richest) average mental intactness and episodic memory scores for women and men separately
alongside gender difference in scores. Statistical tests are provided to indicate statistical
significance of the gender difference. As the average community log PCE increases, cognitive
scores of its residents increase sharply for both men and women, but this increase is far more
dramatic for Chinese women compared to Chinese men. Chinese male cognitive ability also rises
as communities become better off economically but nowhere near as much as for women. In the
poorest set of Chinese communities, the female deficit in mental intactness is about 4 units and
in episodic memory it is 2 more remembered words. These female cognitive deficits decline as

10
we move into better off communities although there is actually a small female cognitive bonus to
Chinese women in the richest set of communities.
The last three set of columns in Table 3 show fractions of women and men in these ten
community groups who are illiterate with the final column tallying female-male difference in
illiteracy rates. In the poorest set of communities, over 60% of female residents over age 45 are
illiterate compared to 24% of men. While female rates of illiteracy exceed male rates in all ten
groups, gender difference become much smaller as we reach the richest group of communities.
The level of economic activity of the community in which you live should most likely be
thought of as a summary statistic for the underlying reasons why communities matter so much
for cognition. There are many other aspects of the community that may matter for cognition,
some of which are included in the CHARLS survey. In this research in addition to the level of
economic resources in the community, these will include community Social Activities, years of
electricity available, measures of the remoteness of the community, years of people’s commune,
the presence of common surnames in the community, and the amount of economic growth
experienced in the community.
2.4.1. Social activities
Social Activities in CHARLS include participating in one of the following activities:
1) volunteer or charity work; 2) caring for a sick or disabled adult who does not live with the
respondent and who does not pay for the help; 3) attending an educational or training course;
4) interacting with friends; 5) playing Mahjong, chess, or cards, or going to a community
club; 6) attending a sporting event or other kind of club; 7) taking part in a community related
organization;
Social activities play an important role in the daily life of most Chinese elderly. We

11
define a variable called “any social activity” to indicate if a respondent was involved in at
least one social activity. In aggregate, 44 percent of the sample participated in at least one of
the social activities. Social activity may benefit cognitive functioning of the elderly by
providing resistance to mental diseases, such as dementia and by reducing rates of cognitive
decline (Hu, 2012; Wang et al., 2002). If men and women participate in social activities with
different intensity or of different stimulating capability, the effect of social activity on
cognition may be different by gender.
2.4.2. Years of electricity available
The community questionnaire asks when electricity was first available in the village.
The variable—years of electricity available—is constructed using this information. Urban
areas in general had electricity available a long time ago so it is difficult for the current urban
residents to know exactly the timing of the community. Therefore, the survey only asks this
question in rural areas. In the paper, we use the value of the 95 percentile of rural villages for
urban communities. This is reasonable as the starting time of electricity in urban areas is in
general homogenous and long ago.
Electricity contributes to people’s acquisition of knowledge and improvement of
education quality. Women may be more sensitive to the benefit of electricity than men at least
for the following two reasons. Firstly, electricity facilitates study and reading and therefore
increases cognitive abilities. Given the level of education completed, the quality of study may
be better in areas with electricity. If women spend more time at home and are more likely to
study by themselves, electricity will contribute to smaller gender difference in cognition.
Second, in areas where electricity is available, people can obtain more information and
knowledge through TV, which may be cognitively stimulating. Availability of electricity may

12
benefit women more as watching TV is the main (if not the only) source for them to obtain
information and knowledge about the outside world, especially for those rural women whose
activities are mostly around the home. Unlike other sources of knowledge, electricity
generated information flows may be more akin to a public good in which it is more difficult to
exclude women.
2.4.3. Mountainous region
We use terrain as a proxy for geographical isolation. The community questionnaire
asks the main terrain/topography of the village /community with options being “plain,” “hill,”
“mountainous region,” and “others.” We create a dummy variable—mountainous region that
have a value of 1 if the answer is “mountainous region” and 0 if otherwise. We expect that
this variable may have a negative effect on cognition as geographical isolation may prevent
people from communicating with and obtaining information from outside the community.
Women may be more restricted by this isolation environment as it is physically more difficult
for them to overcome this obstacle.
2.4.4. Years of people’s commune
The people's commune or the namely “big pot” was the highest of the three
administrative levels (commune, production brigades and production teams) in rural China
during the period of 1954 to 1985 until they were replaced by townships. In the commune,
everything was shared, all resources were controlled and all farming activities were centrally
assigned. The commune has been blamed for failing to raise peasant income and to provide
incentives for peasants to work harder. This in turn has made it difficult for many communes
to accumulate funds to invest in diversification and sideline activities to further
modernization, or to provide welfare services (O'Leary and Watson, 1982), which may

13
adversely impact people’s health status as well as cognitive abilities. During the period of
commune, people largely live with hunger which may in turn undermine cognitive ability.
Therefore, the longer the existence of a commune, the more likely is the cognitive
disadvantage of people (Tamas and Karagianis, 2006)
The CHARLS questionnaire has information for each village on when the commune
was founded and when it was disintegrated, so we construct a variable on how long local
people’s commune lasted. Since the community data may be subject to recall error, we set
cutoffs to the starting and ending year of people’s commune. Communes were founded during
the period of 1954-1960, so 1954 was imputed if the reported founding time was before 1954
and 1960 was used if it was after 1960. Similarly, as the disintegrating year of people’s
commune should be between 1978 and 1985, these two cutoff points were used for the
outliers. Length of commune was then defined as the difference between ending year and
starting year. As commune was only a rural phenomenon, 0 was used for urban communities.
Intuitively, length of commune may be negatively correlated with cognition.
2.4.5. Big surname
Villages are asked whether it has big surnames and if they do, the three largest
surnames are asked in the questionnaire. We combine information on respondent’s surname
and the big surnames in the community to construct three dummies: (1) the village has big
surnames and the respondent’s surname belongs to the three biggest ones; (2) the village has
big surnames but the respondent’s surname does not belong to the three biggest ones; and (3)
the community doesn’t have big surnames. In addition, a female respondent whose husband
has a big surname in the village is also assigned to the first category because she shares the
social and family networks of her husband. Again, as big surname is only a rural
14
phenomenon, respondents in urban communities are grouped into the third category. In our
empirical analysis below, we use the second category as the reference group. Big surname
reflects extensive networks of personal contacts, and thus may provide more opportunity to
communicate with relatives and others or to play a bigger role in community leadership,
which may in turn promote cognitive functioning.
2.4.6. Economic development
We also exploit prefecture-level economic and environmental variables from the
Chinese yearbooks (1996 to 2007) to construct local status of economic development.
Economic development varies a great deal across regions and communities in China being
concentrating in the Eastern coastal areas. Since a higher growth rate might be accompanied
by a lower initial level, we use both growth rates and initial levels of development to depict a
fuller picture of the level of economic development and how it has been changing over time.
Four measures were constructed for this research: average annual growth rate of green
coverage ratio from 1997 to 2003, average annual growth rate of wage per capita from 1996
to 2007, green coverage ratio in 1996, and wage per capita (thousand) in 1995. Green
coverage ratio is defined as the ratio of the green areas to a certain ground, reflects local
willingness to protect the environment, improve welfare, and pursue sustainable development.
Green areas play a crucial role in producing oxygen and purifying the air, which may be
beneficial to people’s health and cognitive abilities. Wage per capita and its growth rate are
indicators of local economic development and the resources available for people to raise their
welfare that may lead to higher cognitive ability.

15
3. Statistical Models for Estimating Gender Differences in Cognition
We use three main specifications to analyze underlying reasons for gender difference in
cognition among elderly in China. Our main focus is whether personal attributes, community
characteristics and local status of economic and environmental development influence cognition
of older residents and whether these effects differ by gender.
Our baseline models take only personal attributes into consideration and examine the
factors that may impact gender difference:
𝐶𝑜𝑔𝑖 = 𝛽0 + 𝛽1𝐹𝑒𝑚𝑖 + 𝛽2𝑋𝑖 + 𝛼𝑝 + 𝜀𝑖
where 𝐶𝑜𝑔𝑖𝑝 is the measure of cognitive ability of person 𝑖—mental intactness or episodic
memory. 𝐹𝑒𝑚𝑖is the variable of interest, which takes a value of 1 if the respondent is a female
and 0 otherwise. 𝑋𝑖is a set of personal attributes variables including age minus 45 and its squared
term, urban dummy, log (Height) and socioeconomic status measured by education and log of
household per capita expenditure (log PCE). Province fixed effect is controlled by 𝛼𝑝in all the
baseline analyses. 𝜀𝑖 is the error term.
In our second specification shown below, community variables are included to
investigate whether the history and economic development of local community would
significantly influence the cognition of the elderly residents and whether the effects differ by
gender:
𝐶𝑜𝑔𝑖 = 𝛽0 + 𝛽1𝐹𝑒𝑚𝑖 + 𝛽2𝑋𝑖 + 𝛽3𝑍𝑐 + 𝛽4𝑍𝑐 ∗ 𝐹𝑒𝑚𝑖 + 𝛼𝑝𝑟 + 𝜀𝑖
Where 𝑍𝑐 refers to community variables. We first add the log PCE of the community
only, which was defined above in Section 2. We then investigate additional community variables
to depict the historical, geographical and cultural characteristics of the community such as years
of electricity available, years of people’s commune, mountainous region, and big surname.

16
Social activity variables are also included as these activities reflect interactions of the respondent
with other people, most likely those living in the same community. The introduction of these
community variables can be found in Section 2. The interaction terms of the community
variables and gender dummy, 𝑍𝑐 ∗ 𝐹𝑒𝑚𝑖, are included in this model to examine whether men and
women are impacted differently by community factors. Instead of province, we control for
prefecture fixed effects, 𝛼𝑝𝑟 , in the second specification, which belongs to an administrative
level between county and province.
Our third specification sheds light on how development of economy and environment can
affect cognition of people:
𝐶𝑜𝑔𝑖 = 𝛽0 + 𝛽1𝐹𝑒𝑚𝑖 + 𝛽2𝑋𝑖 + 𝛽3𝑍𝑐 + 𝛽4𝑍𝑐 ∗ 𝐹𝑒𝑚𝑖 + 𝛽5𝐸𝑝𝑟 + 𝛽6𝐸𝑝𝑟 ∗ 𝐹𝑒𝑚𝑖 + 𝛼𝑝 + 𝜀𝑖
As described in Section 2, four measures were constructed: average prefecture annual
growth rate of green coverage ratio from 1997 through 2003, average annual growth rate of wage
per capita from 1996 through 2007, green coverage ratio of 1996, and wage per capita (thousand)
of 1995. As these development measures are all at the prefecture level, we turn to province fixed
effects in this specification.
4. Empirical Findings
4.1. The Effects of Personal Attributes
Our baseline analysis for personal attributes related to both our measures of cognition—
mental intactness and episodic memory—are presented in Table 4. The first model for each
cognitive outcome in columns 1 and 4 include only a quadratic in age5, a dummy variable for
being a woman. Not surprisingly for both cohort and life cycle aging reasons, both cognitive
variables decrease with age at an increasing rate. The negative coefficient on female indicates
5 In these models age is defined as age -45 to ease interpretation of the trajectories implied by the age quadratic.

17
that on average women are at a cognitive disadvantage compared to men, an effect that increases
with age (or decreases among more recent cohorts). These female coefficients are quite similar in
magnitude to the unadjusted differences by sex in Table 1.
The second model for both cognitive outcomes is listed in columns 2 and 5 of Table 4. In
these models, we add dummy variables for the education categories used in Table 2. We also
include a full set of Province dummies in which the respondent lived—our first albeit very
aggregate measure of the community in which one lived. The effects of education on both
cognitive measures are quite dramatic as there is a continuous and large increase in cognitive
ability as schooling levels rise. Compared to those respondents who are illiterate, those who at
least finished high school increase their mental intactness by 3.3 units and remember 1.7 more
words on average. Including a measure of education, increases the R2 by three fold for our
measure of mental intactness and by more than double for episodic memory, a good indication of
the explanatory power of education for cognitive ability.
Including our measure of education significantly reduces the female disparity in mental
intactness from 1.17 to 0.34. Similarly, the female cognitive deficit for episodic memory of 0.25
is completely eliminated and we now find an advantage (statistically significant advantage of
0.127) for Chinese women compared to Chinese men once we compare people with the same
education. A significant part of the Chinese female disparity in cognition is therefore due to their
historically low levels of education compared to Chinese men. On a more positive note, the
rapidly improving cognitive ability of Chinese women compared to Chinese men over time is
again largely due to their improving levels of schooling compared to Chinese men.
The third column in Table 4 for each cognitive outcome (columns 3 and 6) adds three
measures to these models—urban residence, log height, and the log PCE of the household, our

18
best measure of the economic resources of the household in a developing country such as China.
Not surprisingly, those living in urban areas have statistically significantly higher cognitive
ability in both mental intactness and episodic memory. Taller people also have higher cognitive
levels which may be because that height is an indicator of better health resulting from better
nutrition in childhood. Higher levels of household log PCE also are associated with higher
cognitive ability in both our cognitive measures. Including these three additional personal
attributes further reduces the female deficit in mental intactness which also remains statistically
significant and further increases their cognitive advantage in episodic memory.
4.2. The effects of community resources
In this subsection, we investigate aspects of community that may matter for the cognitive
ability of their residents, both men and women. Our first community measure is the log PCE in
the community which is calculated for each respondent as the mean of the natural log household
PCE of all residents of the community with the exception of the particular respondent in
question. This allows us to separate out effects of the resources directly available to the
household (log household PCE) and the average resources of the community (log community
PCE). In all our community models presented in this section, we also include a set of Prefecture
dummies to control for any other unobserved geographic factors. Prefectures are administrative
units that govern a combination of counties in China. There are 127 prefectures in our CHARLS
data so that prefectures offer a more precise control for other unmeasured factors related to place
of residence than the more aggregated Province level dummy variable does.
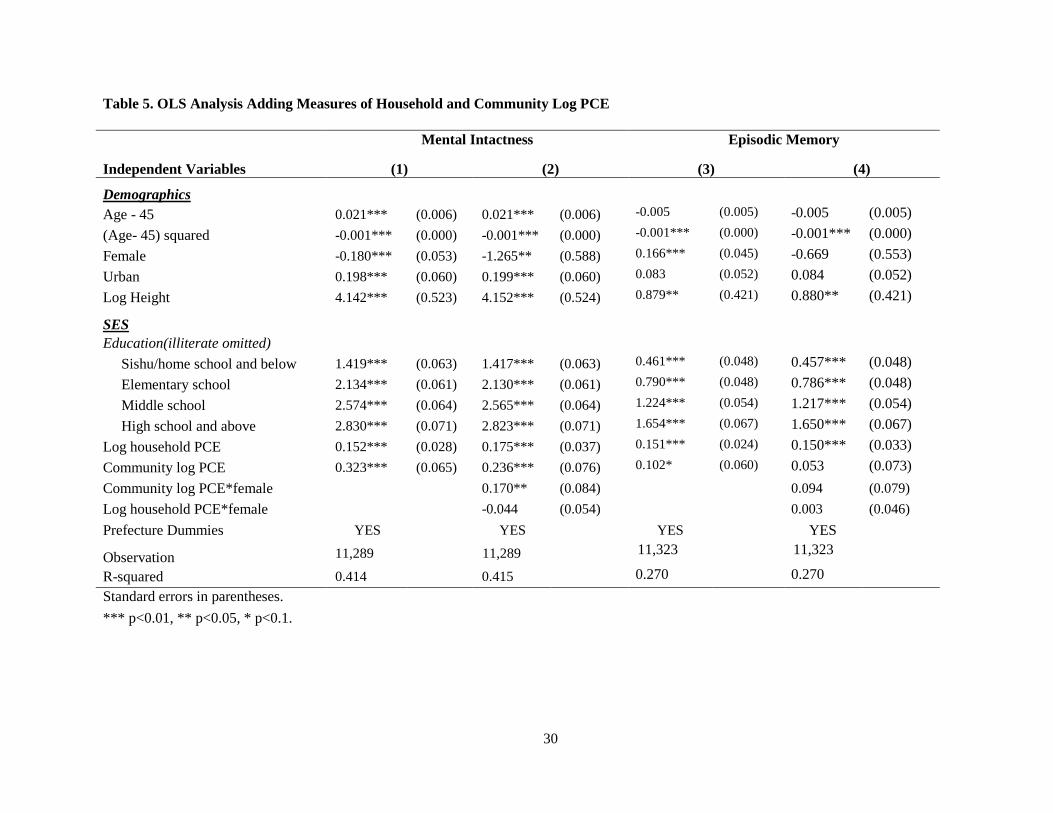
Our results are presented in Table 5 for our two cognition measures. For each measure,
we present two models. In addition to our demographic and SES education variables, the first
model contains measures of log PCE both at the household and community level as explained

19
above. The second model for each cognitive outcome then adds an interaction of being female
with both Log PCE (household and community) constructs in order to assess whether their
effects differ by sex.
For both cognitive outcomes, we find statistically significant effects for community and
household log PCE, but the estimated effects of the community variant is larger than it is for the
household variant at least for the Mental Intactness measure. When we next examine the female
interaction model, we find that the effects of higher level of community resources in improving
cognition are stronger for Chinese women than for Chinese men, although this improvement is
only significant for mental intactness.
4.3. The effects of community attributes on cognition
In order to understand other possible dimensions of community level effects, we next add
more community variables to the models. These results are contained in Table 6. The first model
reported under each outcome adds the main effects of these new community level attributes
while the second model also adds the interaction of these new community level attributes with
being female.
As described above, “any social activities,” “years of electricity available,” “mountainous
region,” “years of commune,” and dummy variables for big surname are included in Columns 1
and 3 of Table 6. As expected, participating in social activities positively associates with both
cognitive measures in all models. When we separated ‘social activities’ into their sub-component
parts, the two that were most positively associated with cognition were ‘playing Ma-jong, chess
or other card games’ and ‘other social activities’. As discussed extensively in Lei et al (2012)
using the Pilot data for CHARLS, this estimate reflects an association and it is not a causal
estimate. Individuals who engage in such social activities may do so since they are more

20
cognitively intact to begin with especially in the age range of the CHARLS sample. Finding
good instruments to deal with this problem is not straightforward.
As expected, years of electricity availability significantly correlates positively with
mental intactness, but not for episodic memory while existing length of time spent in a commune
is negatively associated with both our cognitive measures.
Living in a mountainous region negatively correlates with mental intactness, but as
somewhat of a puzzle positively does so for episodic memory. For big surname variables, the
reference group is that the community has common surnames but the individual respondent does
not have one of these surnames. Compared to that situation, the only significant effect is
advantage of mental intactness of people in a community without any surname. This may
indicate that those communities without any big surnames may be more diverse and more mobile
across people and therefore do not limit their activities along a family tie.
With the exception of ‘social activities’ which can and do vary between the genders, the
other community level variables in the models in Table 6 and Table 7 are common shared
experiences of those who live in these community. Therefore, for these variables to have
differential effects on the cognitive ability of women compared to Chinese men the impacts of
these community attributes on cognition must differ between men and women. With this in mind,
we next added the interactions of these community variables with a female dummy in the
regressions of Columns 2 and 4 in Table 6. The results show that electricity availability not only
promotes mental intactness, but also shrinks the gender disparity in mental intactness. Similarly,
it is a cognitive advantage for women without a common surname (either hers or her partner) to
live in community without these common surnames as opposed to living a community with
common surnames when she does not. The latter situation may lead to social isolation.

21
4.4. The effects of economic and environmental development
The last set of models we use includes the two community level measures of economic
growth and development—the growth rate of green coverage ratio 1997-2003 and the growth
rate of wage per capita 1996-2007 while simultaneously controlling for the two initial level of
each. At least in this version of the paper, we have not added models with both community
attributes as well as community growth rates.
As seen from Columns 1 and 3 of Table 7, the two growth rates both positively correlate
with mental intactness, but the associations of these two measures with episodic memory is
opposite, positive for growth rate of green overage ratio but negative for wage growth rate. The
two initial levels both positively correlate with the two cognitive measures. It seems that
economic and environmental status benefit cognitive ability, but the growth rate does not
necessarily do so. The growth of economy may hurt cognitive ability measured by episodic
memory, while improvement of environment is always beneficial.
Columns 2 and 4 present the results adding the interaction terms of these measures with
female dummy. Consistent with the evidence we presented above, we do not find strong
estimates of gender differences in these effects.
5. Conclusions
In this paper, we examined the size and determinants of gender differences in cognition
among those 45 and over in China. We rely on an important recent data source—China Health
and Retirement Longitudinal Study (CHARLS) 2011-12 baseline data—that is part of the
international network of Health and Retirement Surveys (HRS) around the world. We find large
cognitive differences to the detriment of women that are considerably larger within older cohorts

22
of our sample. These cognitive disparities are considerably mitigated but not fully explained by
large gender differences in education among these generations of Chinese people.
These gender differences in cognition are also concentrated within and related to the
poorer communities in China with the gender differences being more sensitive to community
level attributes than to family level attributes, with economic resources (measured by per capita
expenditures) being the primary illustration of that point. In traditional poor Chinese
communities, there are strong economic incentives to favor boys at the expense of girls not only
in their education outcomes, but in their nutrition and eventually their adult height. We also find
that these gender differences in cognitive ability have been steadily decreasing across birth
cohorts as the economy of China grew rapidly. Among younger cohorts of young adults in
China, there is no longer any gender disparity in cognitive ability perhaps suggesting that with
continued economic development China will move toward the American case where cognitive
skills of women are at least equal of those of men.
We also investigated the historical, geographical, and cultural characteristics of
communities as well as levels and growth rates of economic and environmental development to
understand how they impact cognition. Evidence is found that economic development and
environmental improvement such as having electricity, increase in wage per capita and green
coverage ratio generally contribute to higher cognition ability. Women benefit more from the
fruits of development –electricity and growth of green coverage ratio are conducive to lessening
female disadvantage in cognition. People living in communities with no big surnames have
higher cognitive abilities, which may be due to higher mobility of these communities. We find
that people’s commune is detrimental to both mental intactness and episodic memory and that
the effect of living in remote mountainous regions is negative.

23
Acknowledgements
This research was supported by grants from the National Institute on Aging and Natural
Science Foundation of China.

24
References
Becker, G.S., Hubbard, W.H.J., Murphy, K.M., 2010. Explaining the worldwide boom in higher education of women. J Hum Capital 4(3), 203-241.
Hu, Y., Lei, X., Smith, J.P., Zhao, Y., 2012. Effects of social activities on cognitive function:
Evidence from CHARLS, in: Smith, J.P., Majmundar, M. (Eds.), Aging in Asia: Findings from New and Emerging Data Initiatives. National Academy of Sciences Washington, DC, pp.279303
Lei, X., Hu, Y., Smith, J.P., Zhao, Y., 2012. Gender differences in cognition among older adults
in China. J Hum Resour. 47, 951-971. Levy, R., 1994. Aging-associated cognitive decline. Int Psychoger 6(1), 63-68. McArdle, J.J., Fisher, G.G., Kadlec, K.M., 2007. Latent variable analysis of age trends in tests of
cognitive ability in the Health and Retirement Survey, 1992-2004. Psychol Aging 22(3), 525-545.
McArdle, J.J., Ferrer-Caja, E., Hamagami, F., Woodcock, R.W., 2002. Comparative longitudinal
structural analyses of the growth and decline of multiple intellectual abilities over the life span. Dev Psychol. 38(1), 115-42.
McArdle, J.J., Woodcock, R.W. (eds.), 1998. Human Abilities in Theory and Practice. Lawrence
Erlbaum Associates, New Jersey. O'Leary, G., Watson, A., 1982. The production responsibility system and the future of collective
farming. Aust J Chinese Aff 8, 1-34. Parish, W., Willis, R.J., 1993. Daughters, education, and family budgets Taiwan experiences. J
Hum Resour. 28(4), 863-889. Smith, J.P, Shen, Y., Strauss, J, Zhe, Y, and Zhao, Y., 2012. The effects of childhood health on
adult health and SES in China. Econ Dev Cult Change 61(1), 127-156. Strauss, J., Lei, X., Park, A., Shen, Y., Smith, J. P., Zhe, Y., Zhao, Y., 2011. Health outcomes
and socio-economic status among the elderly in China: Evidence from the CHARLS Pilot. J Popul Ageing 3(3-4), 111-142.
Treuer, T., Karagianis, J., 2006. Is hunger a driver of the cognitive development?
Neuropsychopharmacology 31, 2326–2327. Wang, H.X., Karp, A., Winblad, B., Fratiglioni, L., 2002. Decreased risk of dementia: A
longitudinal study from the Kungsholmen Project. Am J Epidemiol. 155(12), 1081-1087.

25
Zhao, Y., Hu, Y., Smith, J.P., Strauss J, Yang, G., 2012. Cohort profile: The China Health and
Retirement Longitudinal Study. Forthcoming in Int J Epidemiol. Epublished ahead of print December 12, 2012: http://ije.oxfordjournals.org/content/early/2012/12/12/ije.dys203.full.pdf

26
Table 1. Gender Difference in Cognitive Function (weighted): by Age
Ages Mental Intactness Episodic Memory
Number Overall Female Male Difference Number Overall Female Male Difference 45-49 2,715 8.991 8.686 9.382 -0.697*** 2,740 3.953 3.929 3.987 -0.059 50-54 1,997 8.647 8.295 9.013 -0.718*** 2,011 3.548 3.530 3.567 -0.037 55-59 2,751 8.386 7.802 8.973 -1.171*** 2,756 3.355 3.213 3.497 -0.284*** 60-64 2,250 8.286 7.721 8.814 -1.092*** 2,267 3.223 3.091 3.349 -0.257*** 65-74 2,428 7.77 6.976 8.441 -1.466*** 2,427 2.83 2.64 2.993 -0.353*** 75 + 920 6.505 5.784 7.273 -1.489*** 930 1.795 1.58 2.039 -0.459***
All 13,061 8.283 7.782 8.795 -1.013*** 13,131 3.275 3.185 3.369 -0.184***
Source: CHARLS 2011 Baseline Data. Difference is Female – Male. Number is number of observations. Statistically significant at 1% (***) 5% (**) and 10% (*) level.

27
Table 2. Education: Fraction in each schooling group by Gender and Age Groups (weighted) All Female Male
Education Participation Rate All 45~55 55~65 65~75 75 and above All 45~55 55~65 65~75
75 and above
Illiterate 0.263 0.400 0.218 0.421 0.543 0.795 0.127 0.047 0.113 0.189 0.398
Sishu/home school and below 0.179 0.176 0.147 0.231 0.165 0.109 0.182 0.115 0.223 0.196 0.257
Elementary school 0.212 0.165 0.188 0.162 0.184 0.055 0.259 0.197 0.292 0.335 0.202
Middle school 0.213 0.161 0.264 0.124 0.083 0.014 0.265 0.381 0.247 0.162 0.08
High school and above 0.131 0.096 0.181 0.059 0.023 0.015 0.166 0.259 0.124 0.116 0.056
Observations 14033 6961 2660 2602 1145 553 7069 2460 2702 1382 524
Source: CHARLS 2011 Baseline Data.

28
Table 3. Cognition by Log PCE in Community (weighted)
Mental Intactness (0-10) Episodic Memory Fraction Illiterate
Mean Log PCE in
Community
Female Male Female-
Male
Female Male Female-
Male
Female Male Female-
Male N N N
7.898 1448 6.713 8.015 -1.302*** 1444 2.868 3.149 -0.281*** 1725 0.606 0.237 0.369*** 8.192 1384 6.985 8.416 -1.430*** 1398 2.668 3.186 -0.518*** 1625 0.512 0.158 0.354*** 8.333 1435 7.251 8.51 -1.259*** 1431 3.045 3.334 -0.289*** 1631 0.522 0.142 0.380*** 8.449 1405 7.456 8.667 -1.212*** 1423 2.996 3.247 -0.251** 1622 0.453 0.144 0.310*** 8.546 1385 7.254 8.453 -1.199*** 1389 2.798 3.143 -0.344*** 1574 0.45 0.154 0.297*** 8.668 1380 7.405 8.491 -1.086*** 1392 3.084 3.25 -0.166 1551 0.444 0.129 0.315*** 8.827 1219 7.859 8.751 -0.892*** 1239 3.016 3.104 -0.087 1419 0.43 0.13 0.300*** 9.015 1072 8.147 9.189 -1.042*** 1054 3.509 3.484 0.025 1225 0.422 0.125 0.297*** 9.236 911 8.601 9.469 -0.868*** 934 3.666 3.746 -0.080 1071 0.267 0.069 0.198*** 9.785 1101 9.438 9.908 -0.470*** 1106 3.96 4.009 -0.049 1271 0.162 0.043 0.119***
8.735 12740 7.788 8.809 -1.021*** 12810 3.202 3.381 -0.180*** 14714 0.414 0.131 0.283*** Communities are placed into ten groups from lowest to highest based on the mean Log PCE of all residents of those communities minus the respondent. Statistically significant at 1% (***) 5% (**) and 105 (*) level.

29
Table 4. Baseline OLS Analysis of Age, Gender and Education on Cognition Independent Variables Mental Intactness (0-11) Episodic Memory (0-10)
Demographics (1) (2) (3) (4) (5) (6) Age - 45 -0.042*** 0.020*** 0.023*** -0.035*** -0.001 -0.001
(0.006) (0.006) (0.006) (0.005) (0.005) (0.005) (Age- 45) squared -0.001*** -0.001*** -0.001*** -0.001*** -0.001*** -0.001***
(0.000) (0.000) (0.000) (0.000) (0.000) (0.000) Female -1.160*** -0.342*** -0.105* -0.245*** 0.127*** 0.172***
(0.040) (0.037) (0.056) (0.032) (0.033) (0.046) Log Height 4.779*** 0.963**
(0.560) (0.432) Urban 0.376*** 0.155*** (0.044) (0.039) SES Education (illiterates omitted)
Sishu/home school and below 1.492*** 1.419*** 0.422*** 0.408***
(0.061) (0.065) (0.046) (0.049) Elementary school 2.284*** 2.618*** 0.814*** 0.761***
(0.057) (0.064) (0.046) (0.050) Middle school 2.852*** 2.618*** 1.310*** 1.211***
(0.058) (0.064) (0.050) (0.055) High school and above 3.312*** 2.918*** 1.719*** 1.647***
(0.060) (0.070) (0.061) (0.068) Log PCE 0.216*** 0.162***
(0.026) (0.022) Province Dummies NO YES YES NO YES YES Observations 13,090 13,090 11,289 13,161 13,161 11,323 R-squared 0.124 0.362 0.372 0.086 0.187 0.202 Note: Standard errors in parentheses *** p<0.01, ** p<0.05, * p<0.1.
30
Table 5. OLS Analysis Adding Measures of Household and Community Log PCE Mental Intactness Episodic Memory
Independent Variables (1) (2) (3) (4) Demographics Age - 45 0.021*** (0.006) 0.021*** (0.006) -0.005 (0.005) -0.005 (0.005) (Age- 45) squared -0.001*** (0.000) -0.001*** (0.000) -0.001*** (0.000) -0.001*** (0.000) Female -0.180*** (0.053) -1.265** (0.588) 0.166*** (0.045) -0.669 (0.553) Urban 0.198*** (0.060) 0.199*** (0.060) 0.083 (0.052) 0.084 (0.052) Log Height 4.142*** (0.523) 4.152*** (0.524) 0.879** (0.421) 0.880** (0.421)
SES
Education(illiterate omitted)
Sishu/home school and below 1.419*** (0.063) 1.417*** (0.063) 0.461*** (0.048) 0.457*** (0.048) Elementary school 2.134*** (0.061) 2.130*** (0.061) 0.790*** (0.048) 0.786*** (0.048) Middle school 2.574*** (0.064) 2.565*** (0.064) 1.224*** (0.054) 1.217*** (0.054) High school and above 2.830*** (0.071) 2.823*** (0.071) 1.654*** (0.067) 1.650*** (0.067) Log household PCE 0.152*** (0.028) 0.175*** (0.037) 0.151*** (0.024) 0.150*** (0.033) Community log PCE 0.323*** (0.065) 0.236*** (0.076) 0.102* (0.060) 0.053 (0.073) Community log PCE*female 0.170** (0.084) 0.094 (0.079) Log household PCE*female -0.044 (0.054) 0.003 (0.046) Prefecture Dummies YES YES YES YES
Observation 11,289 11,289 11,323 11,323
R-squared 0.414 0.415 0.270 0.270 Standard errors in parentheses. *** p<0.01, ** p<0.05, * p<0.1.

31
Table 6. OLS Analysis Adding Measures of Community Mental Intactness Episodic Memory
Independent Variables (1) (2) (3) (4)
Demographics
Age - 45 0.024*** (0.006) 0.023*** (0.006) -0.004 (0.005) -0.004 (0.005) (Age- 45) squared -0.001*** (0.000) -0.001*** (0.000) -0.001*** (0.000) -0.001*** (0.000) Female -1.349** (0.591) -1.102 (0.738) -0.775 (0.555) -1.099 (0.669) Urban 0.181** (0.073) 0.182** (0.073) 0.107* (0.062) 0.107* (0.062) Log Height 3.963*** (0.528) 3.950*** (0.526) 0.670 (0.423) 0.672 (0.423)
SES Education(illiterate omitted) Sishu/home school and below 1.401*** (0.064) 1.390*** (0.064) 0.445*** (0.048) 0.450*** (0.049) Elementary school 2.118*** (0.062) 2.104*** (0.063) 0.787*** (0.049) 0.792*** (0.049) Middle school 2.562*** (0.065) 2.551*** (0.065) 1.216*** (0.054) 1.222*** (0.054) High school and above 2.801*** (0.072) 2.794*** (0.073) 1.629*** (0.068) 1.635*** (0.068) Log household PCE 0.155*** (0.038) 0.156*** (0.038) 0.139*** (0.034) 0.139*** (0.034) Community log PCE 0.187** (0.083) 0.224*** (0.087) 0.014 (0.077) -0.006 (0.080) Community log PCE*female 0.180** (0.085) 0.106 (0.098) 0.110 (0.079) 0.150* (0.089) Log household PCE*female -0.047 (0.055) -0.050 (0.055) -0.002 (0.046) -0.003 (0.047) Community Variables Any Social Activities 0.240*** (0.038) 0.238*** (0.050) 0.278*** (0.033) 0.257*** (0.045) Years of electricity available 0.008*** (0.003) 0.002 (0.004) -0.003 (0.003) -0.003 (0.003) Mountainous region -0.290*** (0.085) -0.298*** (0.097) 0.142** (0.072) 0.155* (0.081) Years of commune -0.020** (0.008) -0.017* (0.009) -0.015** (0.007) -0.015* (0.008) Big surname (reference: R no, Community Yes)
R yes, Community yes 0.048 (0.048) -0.002 (0.048) -0.019 (0.040) -0.063 (0.054) R no, Community no 0.181** (0.083) 0.068 (0.083) -0.017 (0.071) -0.035 (0.086)

32
Any social activities * female 0.003 (0.072) 0.042 (0.063) Yrs of electricity avail * female 0.013*** (0.004) -0.001 (0.004) Mountainous region * female 0.009 (0.096) -0.024 (0.081) Yrs of commune * female -0.006 (0.007) -0.001 (0.006) Big surname * female R yes, Community yes * female 0.100 (0.090) 0.086 (0.074) R no, Community no * female 0.231* (0.124) 0.037 (0.103) Prefecture Dummies YES YES YES YES Observation 10,946 10,946 10,975 10,975 R-squared 0.419 0.420 0.281 0.281 Standard errors in parentheses. *** p<0.01, ** p<0.05, * p<0.1.

33
Table 7. OLS Analysis Adding Economic and Environmental Development Mental Intactness Episodic Memory Independent Variables (1) (2) (3) (4)
Demographics Age - 45 0.021*** (0.006) 0.021*** (0.006) -0.001 (0.005) -0.001 (0.005) (Age – 45) squared -0.001*** (0.000) -0.001*** (0.000) -0.001*** (0.000) -0.001*** (0.000) Female -1.351** (0.601) -1.303** (0.615) -0.682 (0.571) -0.740 (0.580) Urban 0.208*** (0.050) 0.212*** (0.050) 0.131*** (0.044) 0.127*** (0.043) Log Height 4.533*** (0.554) 4.517*** (0.556) 0.932** (0.434) 0.958** (0.434) SES
Education(illiterate omitted) Sishu/home school and below 1.398*** (0.065) 1.394*** (0.065) 0.402*** (0.049) 0.400*** (0.049) Elementary school 2.118*** (0.061) 2.116*** (0.062) 0.754*** (0.050) 0.752*** (0.050) Middle school 2.571*** (0.064) 2.569*** (0.064) 1.204*** (0.055) 1.205*** (0.055) High school and above 2.843*** (0.071) 2.840*** (0.071) 1.649*** (0.068) 1.649*** (0.068) Log household PCE 0.170*** (0.037) 0.172*** (0.038) 0.151*** (0.034) 0.152*** (0.034) Community log PCE 0.169** (0.068) 0.192*** (0.069) -0.025 (0.065) -0.023 (0.066) Community log PCE*female 0.182** (0.086) 0.152* (0.089) 0.081 (0.081) 0.087 (0.084) Log household PCE*female -0.043 (0.055) -0.046 (0.055) 0.018 (0.047) 0.017 (0.047) Prefecture variables
Growth rate of Green coverage ratio 1997-2003
0.001*** (0.000) 0.001** (0.000) 0.001*** (0.000) 0.000 (0.000)
Growth rate of wage per capita 1996-2007
0.015*** (0.003) 0.015*** (0.003) -0.006** (0.003) -0.004 (0.003)
Green coverage ratio 1996 0.021*** (0.003) 0.022*** (0.004) 0.002 (0.003) 0.005 (0.003) Wage per capita 1995 (thousand) 1.159*** (0.281) 0.689** (0.305) 0.326 (0.250) 0.178 (0.286) Growth rate of
Green coverage ratio 1997-2003 * female
0.001 (0.001) 0.001* (0.000)
Growth rate of wage per capita -0.001 (0.004) -0.004 (0.003)

34
1996-2007 * female Green coverage ratio 1996 *
female 0.001 (0.005) -0.008* (0.004)
Wage per capita 1995 (thousand) * female
0.486 (0.330) 0.428 (0.314)
Province Dummies YES YES YES YES Observation 11,281 11,281 11,315 11,315 R-squared 0.381 0.380 0.205 0.205
Standard errors in parentheses *** p<0.01, ** p<0.05, * p<0.1.