raman spectroscopy of carbon nanotube–polymer hybrid...
TRANSCRIPT

CHAPTER 9
Raman Spectroscopy of CarbonNanotube–Polymer HybridMaterials
KONSTANTINOS PAPAGELIS*
Department of Materials Science, University of Patras, 26504 Rion Patras,
Greece, and FORTH/ICE-HT, Stadiou Str., 265 04 Rion Patras, Greece
*E-mail: [email protected]
9.1 Introduction
Carbon nanotubes (CNTs) have received much attention as a class of next-
generation nanomaterials due to their unique physical and chemical properties.
The potential utility of CNTs in a variety of technologically important
applications, such as polymer composites, supercapacitors, lithium recharge-
able batteries, sensors, photovoltaic and solar cells, high-resolution printable
conductors and so on, is now well established.1,2 However, due to their poor
solubility and strong aggregation, enhancing the processability of CNTs while
preserving their properties has been a main challenge before CNTs could be
integrated into functional hybrids for the fabrication of advanced devices.
The hybridization of various types of CNTs, such as single-walled CNTs
(SWCNTs), double-walled CNTs (DWCNTs) or multi-walled CNTs
(MWCNTs), with insulating or conducting polymers at the molecular level
is an efficient strategy to: (i) obtain the emerging properties through the
synergistic effects of the two components while overcoming the intrinsic
limitations of the individual materials, (ii) reinforce the macromolecular
RSC Nanoscience & Nanotechnology No. 27
Carbon Nanotube-Polymer Composites
Edited by Dimitrios Tasis
# The Royal Society of Chemistry 2013
Published by the Royal Society of Chemistry, www.rsc.org
253

compound and (iii) introduce novel electronic properties based on morpho-
logical modifications or interactions between the two constituents.3 Moreover,
from the materials engineering perspective, the characteristics of the CNT–
polymers interface should be rationally designed to make CNTs chemically
compatible for polymeric matrices with enhanced mechanical/electrical
properties for the final composite.4
In the past decade, the development of Raman spectroscopy (RS) in the field
of CNTs and, recently, of graphene is truly impressive. The level of
information and details that have become available has allowed the
development of nanotechnology from a more fundamental perspective. In
this process, Raman spectroscopy is one of the most useful and versatile tool to
characterize and investigate CNT samples. It is a fast and non-invasive
probing technique with high resolution giving the maximum structural,
vibrational and electronic information. Raman spectroscopy has been widely
used to investigate the structure, physical and chemical properties of CNTs.
The unique optical properties observed in SWCNTs are largely due to the one-
dimensional confinement of electronic and phonon states, resulting in the so-
called van Hove singularities (vHs) in the nanotube electronic density of states
(DOS) (see below in the text). In combination with the intriguing electronic
structure, the resonantly enhanced Raman scattering intensity allows one to
obtain detailed information about the vibrational properties of nanotubes,
even at the isolated individual SWCNT level.5
Raman scattering has been employed successfully to determine the diameter,
chirality and curvature of nanotubes, their structural integrity, the metallic vs.
semiconducting behaviour, physical adsorption and/or wrapping of polymers
to CNTs surface, defects and other crystal disorder, as well as strain or stress
that the nanotubes experience under external loads or environmental effects.
Also, it is extremely sensitive for detecting local changes in the hybridization
state of carbon atoms from sp2 to sp3 and/or modifications of the electronic
and phonon structure caused by the functionalization of the graphitic network.
Charge transfer effects between the CNTs and the polymer molecules and the
concomitant alterations of the electronic structure can be effectively traced
using Raman spectroscopy.
This Chapter provides an overview of micro-Raman spectroscopy of CNTs
and its application in studying CNT reinforced polymer composites. By
choosing and presenting various important and characteristic paradigms, we
intend to elucidate the usefulness of Raman scattering as a valuable tool to
characterize different types of composite materials and probe the interactions
between CNTs and polymer molecules. More detailed information is available
in topical reviews.6–8
9.2 Chemical Modification of CNTs with Polymers
As already mentioned, the usage of CNTs as a starting material in different
applications has been largely limited due to their poor processability,
254 Chapter 9

insolubility and infusibility. To bypass this disadvantage, an efficient key is the
functionalization of CNTs with polymers, leading to functional composite
materials. The modification strategies of CNTs by polymers can be divided
into two categories based on the type of bonds between CNTs and polymers,
namely non-covalent or covalent bonding.
Non-covalent CNT modification concerns the physical adsorption and/or
wrapping of polymers to the surface of the CNTs. The graphitic sidewalls of
CNTs provide the possibility for p-stacking interactions with conjugated
polymers, as well as organic polymers containing heteroatoms with free
electron pairs. An advantage of non-covalent functionalization is that it does
not destroy the conjugated system of the CNT sidewalls and therefore it does
not affect the final structural properties of the material.3
The second modification is covalent chemical bonding (grafting) of polymer
chains to CNTs, in which strong chemical bonds between CNTs and polymers
are created. There are two main methodologies for the grafting of CNTs
depending on the building of polymer chains. Firstly, the ‘‘grafting to’’
approach involves the synthesis of a polymer with a specific molecular weight
terminated with reactive groups or radical precursors. In a subsequent
reaction, this polymer chain is attached to the surface of nanotubes by addition
reactions.9 A disadvantage of this method is that the grafted polymer content
is limited because of the relatively low reactivity and high steric hindrance of
macromolecules. In comparison, the ‘‘grafting from’’ approach involves
growing polymers from CNT surfaces via in situ polymerization of monomers
initiated by chemical species immobilized on the CNT sidewalls and tips. The
advantage of this method is that the high reactivity of monomers makes
efficient, controllable and tailored grafting feasible.3
9.3 Background of Raman Spectroscopy of CNTs
9.3.1 Electronic Structure of CNTs
Owing to their one-dimensional nature, the p-derived electronic DOS of a
SWCNT (the prototype material of CNT family) forms sharp singularities, the
so-called van Hove singularities. The sharp vHs define narrow energy ranges
for which the electronic DOS intensity becomes quite large (Figure 9.1a–9.1c).
Therefore, a SWCNT exhibits a ‘‘molecular-like’’ behaviour, with well-defined
electronic energy levels at each singularity. The vHs closer to the Fermi level
originate from cutting lines closer to the K point in the 2D Brillouin zone.7 To
a first approximation, the vHs are energetically symmetrical with respect to the
Fermi level of the individual SWCNT. Dipole-allowed optical transitions
(designated as Eii) occur between the i-th valence band vHs and the i-th
conduction band vHs. Each individual (n, m) SWCNT exhibits a different set
of valence and conduction band vHs and a different set of optical transition
energies Eii. For this reason, optical experiments can be used for the structural
determination of a given (n, m) CNT.7
Raman Spectroscopy of Carbon Nanotube–Polymer Hybrid Materials 255

It is quite useful in CNT characterization by Raman spectroscopy to consider
the plots of Eii vs. dt (nanotube diameter). Figure 9.1(d) presents Eii(dt) values
for all the (n, m) SWCNTs with diameters between 0.5 and 3.0 nm, calculated
using the tight-binding approximation.10 As can be clearly seen, the electronictransition energies vary, exhibiting an almost 1/dt dependence. Each point in this
plot corresponds to one optically allowed Eii from a given (n, m) semiconducting
(Figure 9.1d, crosses) or metallic (Figure 9.1d, circles) SWCNT. The so-called
Kataura plot11 has been widely used to interpret the optical spectra from CNTs.
More specifically, an observable Raman signal from a CNT can be obtained
when the laser excitation energy (Elaser) is equal to the energy separation
between two vHs in the valence and conduction bands. Because Raman
scattering is a resonance process in CNTs, Raman spectra even at the singlenanotube level allow us to study the electronic and phonon structure of
SWCNTs in great detail. Since the observable Raman spectra come
predominantly from tubes in resonance with Elaser, a Kataura plot specifies
which nanotubes will be detected for a particular laser line. When Raman
spectra of SWCNT bundle samples are taken, only those SWCNTs with Eii in
resonance with the Elaser will contribute strongly to the detected Raman signal.
It should be stressed that the transition energies that apply to an individual
suspended SWCNT, e.g. wrapped by a surfactant, do not necessarily hold for
Figure 9.1 (a–c) Electronic DOS of different metallic (M) and semiconducting (S)CNTs, and (d) Kataura plot derived from a simple first neighbour tight-binding approximation. Adapted from Jorio et al.5
256 Chapter 9

SWCNT in a bundle where the transition energies for bundled SWCNTs are
downshifted and the resonance widths are found to be broadened.5,12
9.3.2 Raman Spectrum of CNTs
Figure 9.2 shows the main spectral features of the Raman spectrum of a
SWCNT, namely the radial breathing modes (RBMs) (150–300 cm21), the D
band at 1250–1450 cm21, the G-band at 1580 cm21 and the 2D band at 2500–
2750 cm21. Each feature corresponds to different vibration modes associated
with the structure of SWCNTs and will be discussed briefly below.
9.3.2.1 The Radial Breathing Modes
The RBM bands correspond to the coherent vibration of the carbon atoms
where all the tube atoms vibrate radially in phase. These features are unique in
CNTs and occur with frequencies between 120 and 350 cm21 for SWCNTs
with diameters in the range 0.7 nm , dt , 2 nm. The RBM frequency (vRBM)
varies as 1/dt through the relation: vRBM 5 A/dt + B, where the parameters A
and B are determined experimentally. Different values of the constants A and
B have been reported in the literature,7,10 whereas the variations in the A and B
parameters are often attributed to environmental effects, namely whether the
SWCNTs are present as isolated, supported or in the form of bundles.13
Therefore, from the vRBM measurement of an individual SWCNT, it is
possible to obtain its diameter value. Also, by recording Raman spectra using
Figure 9.2 Typical Raman spectrum of SWCNT excited at 514.5 nm; the moreintense Raman features are marked.
Raman Spectroscopy of Carbon Nanotube–Polymer Hybrid Materials 257

many laser lines, the nanotubes diameter distribution in a sample can be
extracted. In this line, the RBM spectrum of SWCNT bundles contains RBM
peaks corresponding to different SWCNTs in resonance with the Elaser.
The RBM is a highly resonant feature and very sensitive to electronic and
structural changes as well as environmental, e.g. polymer wrapping on to CNT
sidewalls. The Raman intensity is enhanced by some orders of magnitude if the
energy of the incident or scattered light matches the energy of an electronic
transition Eii. These resonance conditions are called incoming and outgoing
resonance, respectively. A resonance profile for a given RBM mode is rendered
by recording the Raman intensity as a function of excitation energy using
tunable laser systems. From the resonance profiles it is possible to obtain the
transition energies Eii and assign the chiral index (n, m).
The Raman resonance profile for a single resonance is a superposition of an
incoming and an outgoing resonance and can be described by eqn (1):14
I Elaserð Þ~ Mc
h�vRBM
� �21
Elaser{Eii{ic=2ð Þ{1
Elaser{h�vRBM{Eii{ic=2ð Þ
��������2
ð1Þ
where Elaser is the laser energy, Eii is the energy of the allowed optical transition
and c is the lifetime broadening of the intermediate electronic states. The M
contains all of the matrix elements and c summarizes the remaining factors. An
incoming resonance occurs when Elaser 5 Eii and an outgoing resonance when
E15Eii+hvRBM. If the incoming and outgoing resonances are not resolved in
the resonance profile, the recorded spectral profile exhibits a Lorentzian-like
shape with a resonance maximum at approximately Eii+0.5hvRBM. It should
be stressed that in practice the energy distance between the maxima of the
incoming and outgoing resonances is in the range of 20 to 40 meV, which is too
small to appear as two distinct maxima.
The above-mentioned RBM properties have been extensively employed to
characterize chemically modified CNTs. CNT–polymer interactions that are
sensitive to the diameter as well as the electronic structure (metallic or
semiconducting) of the SWCNTs can be easily followed. On the other hand,
recording resonance profiles in the case of functionalized material only makes
sense by comparing both reference and functionalized nanotubes, as the
absolute values of the optical transitions are often modified during preparation
procedures and due to environmental changes. Covalent modification disrupts
the electronic band structure, thus reducing the resonance enhancement of the
Raman process significantly affecting the resonant profiles. In many cases the
optical transitions are broadened due to functionalization which causes longer
lifetimes and thus larger values for the c parameter.
9.3.2.2 The D-band
The D-band is a disorder-induced feature arising from double resonance
Raman scattering process from a non-zero-centre phonon mode.15 It is also an
258 Chapter 9

energy dispersive feature, namely the peak frequency increases with
increasing laser excitation energy. It is well-documented that sidewall
functionalization breaks the translational symmetry along the tube axis
causing this mode to become Raman active. Therefore, an increase in the D-
band intensity comprises a fingerprint for successful sidewall functionaliza-
tion. In general, the ratio of intensities of the D- to the G-band (see below)
is widely used to evaluate the degree of CNTs graphitization and the
functionalization degree of chemically modified nanotubes. Alternatively,
Maultzsch et al.16 argue that the G-band itself can be defect-induced and
suggest that the intensity of the D-band should be normalized to the intensity
of the second order mode 2D (overtone of the D-mode) as a measure for the
defect concentration in SWCNTs. It should be mentioned that the presence
of amorphous or disordered carbon in a pristine material also contributes in
the recorded Raman intensity of the D-peak.
Finally, the D’ band, which is a weak shoulder of the G-band at y1615
cm21 (with 514.5 nm excitation), is also a double resonance energy dispersive
feature induced by disorder and defects and provides a complementary peak to
assess the degree of modification in carbon-based nanomaterials.
9.3.2.3 The G-band
The high energy region in the Raman spectrum of SWCNTs contains two
main first-order components, resulting from the in-plane C–C carbon
displacements parallel and perpendicular to the tube axis (tangential G-
band), usually labelled as G+ (1590 cm21) and G2 (1570 cm21).7 In metallic
CNTs, the G2 component exhibits a broad asymmetric Breit–Wigner–Fano
(BWF) line-shape, resulting from the phonon coupling to an electronic
continuum, which is assumed to be proportional to the DOS at the Fermi
level and quantified by the asymmetry parameter 1/q.17 This BWF coupling
results in the broadening and softening of the G2 peak, as well as in a more
pronounced inverse tube diameter (dt) frequency dependence than that in
semiconducting tubes.18
As pointed out by Dresselhaus et al.,7 G+ is sensitive to charge transfer
arising from dopant additions to SWCNTs. The G+ mode up-shifts for
acceptors and downshifts for donors as in graphite intercalation compounds.7
Additionally, charge transfer to SWCNTs can lead to an intensity increase or
decrease in the BWF feature. Also, the v(G+) is essentially independent of dt
or the chiral angle, whereas v(G2) is dependent on dt (not on chiral angle)
and whether the SWCNT is metallic or semiconducting.7 The G+ – G2
splitting is relatively small for large diameter MWCNTs and smeared out
because of the diameter distribution in a certain sample. As a result, in
MWCNTs the G feature predominantly exhibits a weakly asymmetric
characteristic line-shape, with a peak appearing at the graphite frequency
y1580 cm21.5
Raman Spectroscopy of Carbon Nanotube–Polymer Hybrid Materials 259
9.4 Raman Characterization of CNT–Polymer HybridMaterials
The transition from fundamental research to materials engineering andapplications involves good knowledge of the physico-chemical properties of
the investigated materials, and their electronic and vibrational features provide
primary information. In the following, via the presentation of some specific
cases, we demonstrate the ability of Raman scattering to characterize, in detail,
chemically modified CNT–polymers hybrid materials.
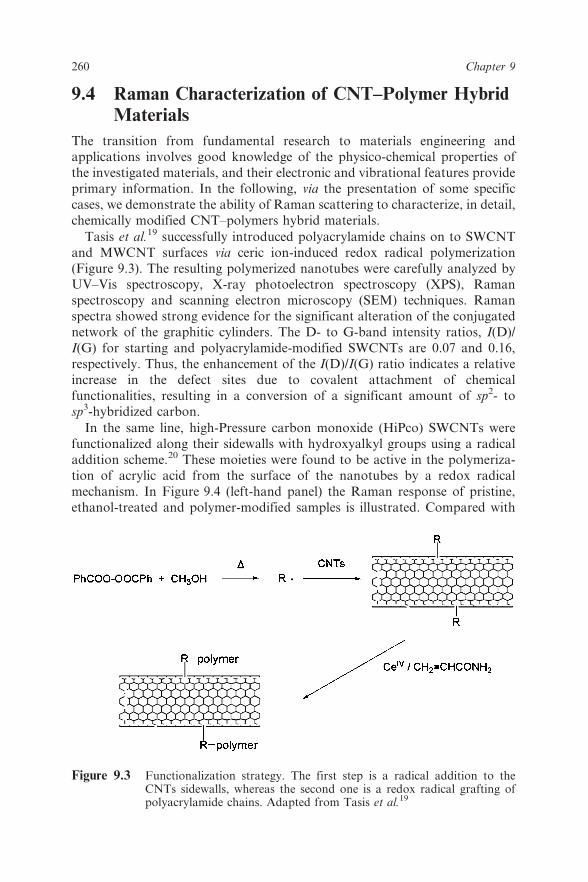
Tasis et al.19 successfully introduced polyacrylamide chains on to SWCNT
and MWCNT surfaces via ceric ion-induced redox radical polymerization
(Figure 9.3). The resulting polymerized nanotubes were carefully analyzed byUV–Vis spectroscopy, X-ray photoelectron spectroscopy (XPS), Raman
spectroscopy and scanning electron microscopy (SEM) techniques. Raman
spectra showed strong evidence for the significant alteration of the conjugated
network of the graphitic cylinders. The D- to G-band intensity ratios, I(D)/
I(G) for starting and polyacrylamide-modified SWCNTs are 0.07 and 0.16,
respectively. Thus, the enhancement of the I(D)/I(G) ratio indicates a relative
increase in the defect sites due to covalent attachment of chemical
functionalities, resulting in a conversion of a significant amount of sp2- tosp3-hybridized carbon.
In the same line, high-Pressure carbon monoxide (HiPco) SWCNTs were
functionalized along their sidewalls with hydroxyalkyl groups using a radical
addition scheme.20 These moieties were found to be active in the polymeriza-
tion of acrylic acid from the surface of the nanotubes by a redox radical
mechanism. In Figure 9.4 (left-hand panel) the Raman response of pristine,
ethanol-treated and polymer-modified samples is illustrated. Compared with
Figure 9.3 Functionalization strategy. The first step is a radical addition to theCNTs sidewalls, whereas the second one is a redox radical grafting ofpolyacrylamide chains. Adapted from Tasis et al.19
260 Chapter 9

the pristine, the modified materials exhibit drastic differences in the relative
intensity of the D-band with respect to the main G+ peak assigned to C–C
vibrations along the nanotube axis. Evaluation of the relative intensities I(G+)/
I(D) for the studied samples shows that the ratio is 5.4 for pristine, 1.62 for
SWCNT–ethanol and 0.76 for SWCNT–polymer, indicating a significant
alteration of the graphitic network. It is worth mentioning that Raman
scattering originated from the polymer chains themselves is expected to
contribute in the spectral intensity of polymer-modified CNTs. Also, the
absence of the strong peaks at 1450 cm21 and 1700 cm21 belonging to the
Raman spectrum of neat poly(acrylic acid)21 implies a minor contribution of
the polymer in the observed Raman scattering intensity. Therefore, it is
suggested that the polymer grafting not only takes place from the initiating
groups but from some polymer chains that are attached directly to the
sidewalls. The absorption spectroscopy of CNTs is a complementary
experimental technique which provides direct information for the vHs in the
visible region and their changes upon functionalization. In the absorption
spectrum of pristine and ethanol-treated tubes, the characteristic vHs are
clearly observed.20 On the contrary, the spectrum of the polymer-modified
material shows a complete loss of the van Hove transitions. This is clear
evidence of covalent attachment of chemical species on to the p-system.
Muller et al.22 presented a resonant Raman scattering study on SWCNTs
decorated with side chain dendritic terpyridine–Ru(II)–terpyridine [tpy–
Ru(II)–tpy] complexes in order to understand how the latter substances will
affect the processability and, most importantly, the electronic properties of
CNTs. The resonance profiles for the nanotube RBMs were recorded using a
tunable excitation laser (Ti:sapphire) and a dye laser. The scattering signal of
CaF2 was used to normalize the signal intensity at different excitation energies.
Following the procedure of Maultzsch et al.14 from the transition energies of
Figure 9.4 Raman spectra in the D- and G-band regions, ethanol-treated andpolymer-modified CNTs excited with the 514.5 nm laser line (left-handpanel); and SEM image of polymer-modified SWCNTs (right-handpanel). Adapted from K. Papagelis et al.20
Raman Spectroscopy of Carbon Nanotube–Polymer Hybrid Materials 261
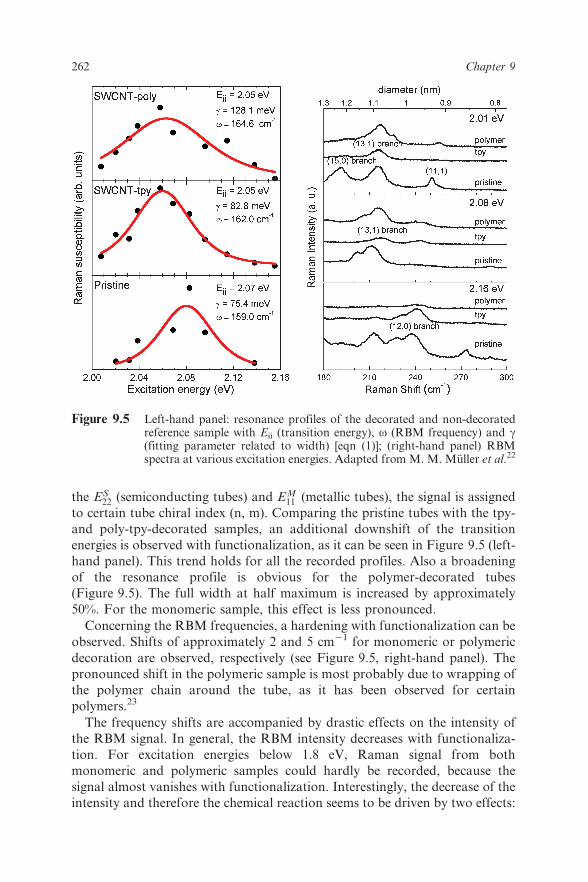
the ES22 (semiconducting tubes) and EM
11 (metallic tubes), the signal is assigned
to certain tube chiral index (n, m). Comparing the pristine tubes with the tpy-
and poly-tpy-decorated samples, an additional downshift of the transition
energies is observed with functionalization, as it can be seen in Figure 9.5 (left-
hand panel). This trend holds for all the recorded profiles. Also a broadening
of the resonance profile is obvious for the polymer-decorated tubes
(Figure 9.5). The full width at half maximum is increased by approximately
50%. For the monomeric sample, this effect is less pronounced.
Concerning the RBM frequencies, a hardening with functionalization can be
observed. Shifts of approximately 2 and 5 cm21 for monomeric or polymeric
decoration are observed, respectively (see Figure 9.5, right-hand panel). The
pronounced shift in the polymeric sample is most probably due to wrapping of
the polymer chain around the tube, as it has been observed for certain
polymers.23
The frequency shifts are accompanied by drastic effects on the intensity of
the RBM signal. In general, the RBM intensity decreases with functionaliza-
tion. For excitation energies below 1.8 eV, Raman signal from both
monomeric and polymeric samples could hardly be recorded, because the
signal almost vanishes with functionalization. Interestingly, the decrease of the
intensity and therefore the chemical reaction seems to be driven by two effects:
Figure 9.5 Left-hand panel: resonance profiles of the decorated and non-decoratedreference sample with Eii (transition energy), v (RBM frequency) and c(fitting parameter related to width) [eqn (1)]; (right-hand panel) RBMspectra at various excitation energies. Adapted from M. M. Muller et al.22
262 Chapter 9

small diameters are highly affected, as it can be observed, e.g., for the (11, 1)
tube, but also for tubes with relatively larger diameters like the entire (15, 0)
branch (Figure 9.5, right-hand panel). This effect holds for different tube
chiralities observed at different excitation energies (Figure 9.5). The preferred
reaction of small diameter tubes is expected due to higher strain relaxation and
has been reported for various moieties.24,25 Also, it may possibly be due to
defect functionalization, because, even if the defect density is the same in all
starting materials, larger tube diameters lead to a higher amount of defects in
absolute numbers. Steric effects may also come into play, with less curved
material offering more space for the reactants to attack the CNT sidewalls.
Further interesting works on CNTs functionalized with polymeric chains
and extensively characterized by means of Raman spectroscopy have been
published previously.26,27
In another study, Ma and co-workers28 prepared thermotropic liquid
crystalline polyester (TLCP) nanocomposites reinforced with a small quantity
of MWCNTs (up to 5 wt%) by an in situ polymerization method. The
MWCNTs were well dispersed in the host matrix due to aromatic
interactions. The interactions between the TLCP molecules and CNTs were
tuned through Raman spectroscopy using an excitation wavelength of 532
nm. RBMs are particularly sensitive probes to study interactions between
CNTs and ‘‘foreign’’ molecules absorbed on to the CNT surface, as they
correspond to vibrations of the carbon atoms perpendicular to the nanotube
axis. The authors detected a distinct Raman shift of the RBMs, suggesting
that CNTs interacted with the surrounding liquid crystal molecules, most
likely through aromatic interactions (p–p stacking). Also, in a blank
experiment in which nanotubes were embedded in a different liquid crystal
host, formed by molecules having a similar molecular structure but without
phenyl rings, no shift was observed in the RBM band.28 This further justifies
the observation that the RBM shift is directly associated with p–p stacking
interactions at the CNT surface, involving the aromatic core structure of the
TLCP molecules.
Hybrid materials consisting of SWCNTs and a conductive block copolymer,
perchlorate-doped poly(3,4-ethylenedioxythiophene)-block-poly(ethyleneox-
ide) (P-PEDOT-b-PEO), were successfully prepared.29 Using an excitation
wavelength of 532 nm, the authors observed several SWCNT RBM bands in
the range of 180–250 cm21 corresponding to a diameter range from 0.9 to 1.3
nm. According to the authors,29 the noticeable weakness of the RBM bands in
SWCNT/P-PEDOT-b-PEO relative to the bundled SWCNTs for frequencies
lower than 200 cm21 indicates that P-PEDOT-b-PEO effectively coated,
isolated and dispersed the small-diameter nanotubes because of the weak
intertube interactions of small SWCNTs.30 Also, the band broadening and
shift in the low-frequency range of 150–200 cm21 was attributed to effective
exfoliation of SWCNTs. The negligible changes in the I(D)/I(G) ratio of
SWCNTs indicate that the non-covalent functionalization by P-PEDOT-b-
PEO prevents the destruction of intrinsic electronic structures of SWCNTs.
Raman Spectroscopy of Carbon Nanotube–Polymer Hybrid Materials 263

Based on the observations that the UV2Vis and Fourier transform infrared
(FT-IR) spectra of P-PEDOT-b-PEO were changed after the hybridization
with SWCNTs, the authors assumed that charge transfer may occur in the
supramolecular assembly of hybrids. The G-band of SWCNTs is quite
sensitive to the charge transfer.31 As a result, the authors compared the G-
band of SWCNTs with the one of SWCNT/P-PEDOT-b-PEO nanohybrids to
verify the presence of electronic interactions. As a matter of fact, the G-band of
the pristine material (approximately 1578 cm21) was blue-shifted by 8 cm21 for
SWCNT/P-PEDOT-b-PEO hybrids. The up-shift of the G-band was attributed
to either p-doping (such as bromine as an electron acceptor) or oxidation
(similar to that by HNO3 or H2SO4).32 The carbon bonds are stiffened due to a
reduction in the delocalized electron density on the SWCNTs, resulting in hole
injection from P-PEDOT-b-PEO to SWCNT. Consequently, the spectroscopic
analysis of SWCNT/P-PEDOT-b-PEO materials indicates that the charge
transfer in the CNT–polymer nanohybrids was facilitated by the electronic
interactions between SWCNTs and P-PEDOT blocks.29
Conducting polythiophene (PTh)–SWCNTs composites were synthesized by
the in situ chemical oxidative polymerization method.33 Using an excitation
wavelength of 514 nm, the authors studied the pristine and the derived
materials. The Raman spectrum for the SWCNT–PTh composites is clearly an
addition of the corresponding spectra of PTh and SWCNTs, demonstrating
that SWCNTs served as templates in the formation of a co-axial nanostructure
for the composites.33
In the work of Yi et al.,34 the authors prepared a composite material by
grafting a carbonizable polymer, poly(furfuryl alcohol) (PFA), to arylsulfonic
acid (SA)-modified SWCNTs (Figure 9.6). The Raman spectrum of the PFA-
SWCNT has similar features to those of the SA–SWCNT. The intensity ratio
of the D-band to G-band was almost the same as that of the SA–SWCNT,
suggesting that the PFA wrapping did not alter the hybridization of the carbon
atoms within the SWCNT framework. They also observed that the RBMs of
the PFA–SWCNT composite became even weaker than that of the SA–
SWCNT. This would be expected if the attachment of the macromolecule
would restrict the radial breathing of SWCNTs more than the SA group alone.
On the other hand, the RBM peaks of the carbonized, at 600 uC, nano-
composite—yielding a nanoporous carbon–CNT hybrid (NPC/SWCNT)—
slightly shifted to higher wavelength numbers. As the RBMs of the NPC/
SWCNT hybrid material show intensities comparable with those of the
purified material, the authors concluded that there is no chemical bonding or
charge transfer between the SWCNT and NPC. They attribute these shifts to
molecular forces being exerted by the NPC on the SWCNT. It has been well
established that the Raman features exhibit a blue shift under the influence of
hydrostatic pressure.35 Therefore, it can be calculated that the molecular
pressure of the NPC on the SWCNT is hundreds of MPa based on RBM shifts.
Although there is an obvious frequency change in RBMs, tangential modes
remain at almost the same frequency. This experimental finding is attributed to
264 Chapter 9

the anisotropic behaviour of the NPC on the SWCNTs. When PFA was
pyrolyzed to form NPC, there is considerable volume shrinkage in all
dimensions, which may induce compressive stress on the SWCNT. The
compressive stress more strongly affects the radially modes than the
tangentially ones.
In another work, Nogueira et al.36 presented a covalent modification
approach with thiophene groups located at the edges and defects of SWCNTs
in order to modify the interaction with the polymer matrix with the aim of its
application in solar cells. Raman spectra of the pristine SWCNTs, purified
material (SWCNT-COOH) and the modified material (SWCNT-THIOP) were
obtained. For the non-purified SWCNT, at least four distinct tube radii were
observed in the Raman spectrum excited with a wavelength of 632.8 nm. The
main peak for the RBMs occurs at y162 cm21 (1.4 nm diameter), whereas
Figure 9.6 Preparation of purified SWCNTs (p-SWNT) functionalized witharylsulfonic acid (SA-SWNT). A nanocomposite carbon material(PFA-SWNT) was prepared by grafting PFA to a SWCNT. Pyrolysisof the PFA-SWCNT produced a nanoporous carbon nanocomposite(NPC/SWNT). Adapted from Yi et al.34
Raman Spectroscopy of Carbon Nanotube–Polymer Hybrid Materials 265

other less intense peaks appear at y144, 176 and 186 cm21. According to the
authors,36 the introduction of carboxylic and thiophene groups is expected to
change the force constant of the RBM mode, and as a consequence this band
was reduced in intensity and shifted to higher energy values. This upshift is
difficult to quantify, given the low frequency and the weak nature of the RBM
after the chemical treatment. Only two weak peaks were observed at y163 and
187 cm21 after both the purification (SWCNT-COOH) and functionalization
(SWCNT-THIOP) processes. The G-band profile for the pristine SWCNT
shows a higher-frequency component (approximately 1573 cm21) and a lower-
frequency component (approximately 1540 cm21) with a BWF line-shape.
These features are attributable to the presence of metallic SWCNT in the
sample used. Also, after purification significant upshifts by approximately 4,
10 and 21 cm21 for the D-, G- and 2D-bands were observed, respectively. As
mentioned above, the removal of electrons from SWCNTs (i.e., p-doping or
oxidizing conditions) results in an upshift of the G-peak,37 whereas the
concomitant upshifts of the D- and 2D-bands are another signal of charge
transfer. After the chemical modification with thiophene-containing groups,
G- and 2D-bands upshifted again by 4 and 3 cm21, respectively.
In a recent work, Imin et al.38 have successfully synthesized a new class of
highly soluble alternating copolymers of fluorene and dithieno[3,2-b:2’,3’-
d]pyrrole. Sample preparation for Raman measurements involved drop casting
dilute polymer–SWCNT solutions in tetrahydrofuran (THF) on to a glass
microscope slide and air-drying prior to measurement. The authors collected
Raman data using the 785 nm excitation wavelength because the RBM spectra
at this excitation wavelength can be used to evaluate the extent of aggregation
occurring in a sample.39,40 RBM spectra of the as-received HiPco sample,
sodium dodecylbenzenesulfonate (SDBS)-wrapped SWCNTs as well as the
soluble polymer–SWCNT hybrids were reported. All of the peaks of the
polymer–SWCNT complexes and SWCNT–SDBS show a characteristic red
shift of 3–6 cm21 relative to the same peaks in the spectrum of the starting
material. The signal at 284 cm21 is much more dominant in the spectra of
pristine bundled SWCNTs, and this feature nearly disappeared in the polymer-
functionalized samples as well as the SDBS (surfactant)-dispersed sample. This
result indicates that the nanotubes are individually dispersed by the polymeric
chains in solution, and there is no evidence of aggregation when they are drop-
casted on to the glass substrate. Interestingly, both polymer–SWCNT
complexes exhibit a strong signal at 247 cm21 (dt 5 0.96 nm), indicating
that both polymers selectively bring a specific nanotube species into resonance
when excited at 785 nm.
9.5 Conclusions
Modification of CNTs with polymers has been widely investigated with the
primary purpose to control their solubility and processibility, either through
covalent or non-covalent bonding. The non-covalent attachment does not alter
266 Chapter 9

the structure of the SWCNTs, As the interactions between the wrapping
polymeric chains and the nanotube are, in principle, weak. Besides, much
stronger interactions between SWCNTs and polymer molecules might beachieved by covalent modification using a variety of functionalization
strategies. Raman spectroscopy has been successfully utilized to determine
the influence of chemical functionalization on the vibrational and electronic
properties of CNTs. The dependence of the resonant Raman spectrum of
CNT–polymer hybrids on the laser excitation energy can be used to
understand the type of bonding between the two constituents and the effect
of individual polymer molecules on the structure and the overall symmetry of
the tubes. Following the resonance of particular tube chirality, the differentreactivity of nanotubes can be traced. Metallic or semiconducting nanotubes
exhibit different reactivity, quantified by the different DOS at the Fermi level,
and may be affected differently by polymer reactions. Also, the reactivity
depends on the steric demands of the functionalities. Moreover, the charge
transfer between the CNTs and the addends creates alterations in the electronic
structure of the tubes, causing red shifts in the optical transitions, accompanied
by a broadening of the resonance conditions. Finally, covalent sidewall
functionalization can be proven due to the intensity enhancement of the defect-induced D-mode in combination with attenuated RBMs.
Acknowledgements
The author would like to thank Costas Galiotis, Joannis Kallitsis, Matthias
Muller, Janina Maultzsch and Christian Thomsen for their contribution to
parts of the presented work.
References
1. D. P. Hashim, N. T. Narayanan, J. M. Romo-Herrera, D. A. Cullen,
M. G. Hahm, P. Lezzi, J. R. Suttle, D. Kelkhoff, E. Munoz-Sandoval, S.
Ganguli, A. K. Roy, D. J. Smith, R. Vajtai, B. G. Sumpter, V. Meunier, H.
Terrones, M. Terrones and P. M. Ajayan, Sci. Rep. (Nature), 2012, 2, 1–7.
2. V. Ahir and E. M. Terentjev, Nat. Mater., 2005, 4, 491–495.
3. Z. Spitalsky, D. Tasis, K. Papagelis and C. Galiotis, Prog. Polym. Sci.,
2010, 35, 357–401.
4. S. Lefrant, M. Baibarac and I. Baltog, J. Mater. Chem., 2009, 19, 5690–
5704.
5. A. Jorio, M. A. Pimenta, A. G. Souza Filho, R. Saito, G. Dresselhaus and
M. S. Dresselhaus, New J. Phys., 2003, 5, 139.1–139.17.
6. M. S. Dresselhaus, G. Dresselhaus, A. Jorio, A. G. Souza Filho and R.
Saito, Carbon, 2002, 40, 2043–2061.
7. M. S. Dresselhaus, G. Dresselhaus, R. Saito and A. Jorio, Phys. Rep.,
2005, 409, 47–99.
8. R. Graupner, J. Raman Spectrosc., 2007, 38, 673–683.
Raman Spectroscopy of Carbon Nanotube–Polymer Hybrid Materials 267

9. D. Tasis, N. Tagmatarchis, A. Bianco and M. Prato, Chem. Rev., 2006,
106, 1105–1136.
10. R. Saito, G. Dresselhaus and M. S. Dresselhaus, Physical Properties of
Carbon Nanotubes, Imperial College Press, London, 1998.
11. H. Kataura, Y. Kumazawa, Y. Maniwa, I. Uemezu, S. Suzuki, Y.
Ohtsuka and Y. Achiba, Synth. Met., 1999, 103, 2555-2558.
12. A. Jorio, M. S. Dresselhaus, R. Saito, G. Dresselhaus, Raman Spectroscopy
in Graphene Related Systems, Wiley-VCH, Berlin, 2011.
13. M. S. Dresselhaus, A. Jorio, M. Hofmann, G. Dresselhaus and R. Saito,
Nano Lett., 2010, 10, 751–758.
14. J. Maultzsch, H. Telg, S. Reich, and C. Thomsen, Phys. Rev. B, 2005, 72,
205438.1–205438.16.
15. C. Thomsen and S. Reich, Phys. Rev. Lett., 2000, 85, 5214–5217.
16. J. Maultzsch, S. Reich, C. Thomsen, S. Webster, R. Czerw, D. L. Carroll,
S. M. C. Vieira, P. R. Birkett, and C. A. Regoet, Appl. Phys. Lett., 2002,
81, 2647–2649.
17. S. D. M. Brown, A. Jorio, P. Corio, M. S. Dresselhaus, G. Dresselhaus, R.
Saito and K. Kneipp, Phys. Rev. B, 2001, 63, 1554143.1–1554143.8.
18. A. Jorio, A. G. Souza Filho, G. Dresselhaus, M. S. Dresselhaus, A. K.
Swan, M. S. Unlu, B. B. Goldberg, M. A. Pimenta, J. H. Hafner, C. M.
Lieber and R. Saito, Phys. Rev. B, 2002, 65, 155412.1–155412.9.
19. D. Tasis, K. Papagelis, M. Prato, I. Kallitsis and C. Galiotis, Macromol.
Rapid Commun., 2007, 28, 1553–1558.
20. K. Papagelis, M. Kalyva, D. Tasis, J. Parthenios, A. Siokou and C.
Galiotis, Phys. Status Solidi B, 2007, 244, 4046–4050.
21. S. Koda, H. Nomura and M. Nagasawa, Biophys. Chem., 1983, 18, 361–
367.
22. M. Muller, K. Papagelis, J. Maultzsch, A. A. Stefopoulos, E. K.
Pefkianakis, A. K. Andreopoulou, J. K. Kallitsis and C. Thomsen,
Phys. Status Solidi B, 2009, 246, 2721–2723.
23. Y. K. Kang, O.-S. Lee, P. Deria, S. H. Kim, T.-H. Park, D. A. Bonnell,
J. G. Saven and M. J. Therien, Nano Lett., 2009, 9, 1414–1418.
24. A. Hirsch and O. Vostrowsky, Top. Curr. Chem., 2005, 245, 193–237.
25. M. Muller, J. Maultzsch, D. Wunderlich, A. Hirsch and C. Thomsen,
Phys. Status Solidi B, 2008, 245, 1957–1960.
26. A. A. Stefopoulos, C. L. Chochos, M. Prato, G. Pistolis, K. Papagelis, F.
Petraki, S. Kennou and J. K. Kallitsis, Chem.–Eur. J., 2008, 14, 8715–
8724.
27. A. A. Stefopoulos, E. K. Pefkianakis, K. Papagelis, A. K. Andreopoulou
and J. K. Kallitsis, J. Polym. Sci. Part A: Polym. Chem., 2009, 47, 2551–
2559.
28. X. Wang, J. Wang, W. Zhao, L. Zhang, X. Zhong, R. Li and J. Ma, Appl.
Surf. Sci., 2010, 256, 1739–1743.
29. H. S. Park, B. G. Choi, W. H. Hong and S.-Y. Jang, J. Phys. Chem. C,
2012, 116, 796227967.
268 Chapter 9

30. Y. Liu, L. Gao and J. J. Sun, J. Phys. Chem. C, 2007, 111, 122321229.
31. C. Engtrakul, M. F. Davis, T. Gennett, A. C. Dillon, K. M. Jones and
M. J. Heben, J. Am. Chem. Soc., 2005, 127, 17548217555.
32. Q. H. Yang, P. X. Hou, M. Unno, S. Yamauchi, R. Saito and T. Kyotani,
Nano Lett., 2005, 5, 246522469.
33. M. R. Karim, C. J. Lee and M. S. Lee, J. Polym. Sci. Part A: Polym.
Chem., 2006, 44, 5283–5290.34. B. Yi, R. Rajagopalan, H. C. Foley, U. J. Kim, X. Liu and P. C. Eklund,
J. Am. Chem. Soc., 2006, 128, 11307–11313.
35. J. Arvanitidis, D. Christofilos, K. Papagelis, T. Takenobu, Y. Iwasa, H.
Kataura, S. Ves and G. A. Kourouklis, Phys. Rev. B, 2005, 72, 193411.1–
193411.4.
36. A. F. Nogueira, B. S. Lomba, M. A. Soto-Oviedo, C. R. D. Correia, P.
Corio, C. A. Furtado and I. A. Hummelgen, J. Phys. Chem. C, 2007, 111,
18431218438.37. A. M. Rao, P. C. Eklund, S. Bandow, A. Thess, R. E. Smalley, Nature,
1997, 388, 257–259.
38. P. Imin, M. Imit, and A. Adronov, Macromolecules, 2011, 44, 9138–9145.
39. M. J. O’Connell, S. Sivaram, S. K. Doorn, Phys. Rev. B, 2004, 69, 235411–
235415.
40. D. A. Heller, P. W. Barone, J. P. Swanson, R. M. Mayrhofer, M. S.
Strano, J. Phys. Chem. B, 2004, 108, 6905–6909.
Raman Spectroscopy of Carbon Nanotube–Polymer Hybrid Materials 269