raman scattering of rare earth sesquioxide ho2o3: a ...npl.csircentral.net/1489/1/330.pdf · raman...
TRANSCRIPT

Raman scattering of rare earth sesquioxide Ho2O3: A pressure and temperaturedependent studySugandha Dogra Pandey, K. Samanta, Jasveer Singh, Nita Dilawar Sharma, and A. K. Bandyopadhyay Citation: Journal of Applied Physics 116, 133504 (2014); doi: 10.1063/1.4896832 View online: http://dx.doi.org/10.1063/1.4896832 View Table of Contents: http://scitation.aip.org/content/aip/journal/jap/116/13?ver=pdfcov Published by the AIP Publishing Articles you may be interested in Structural phase transition of ternary dielectric SmGdO3: Evidence from angle dispersive x-ray diffraction andRaman spectroscopic studies J. Appl. Phys. 117, 094101 (2015); 10.1063/1.4913776 Raman spectra of R 2O3 (R—rare earth) sesquioxides with C-type bixbyite crystal structure: A comparative study J. Appl. Phys. 116, 103508 (2014); 10.1063/1.4894775 Mechanical behaviors and phase transition of Ho2O3 nanocrystals under high pressure J. Appl. Phys. 116, 033507 (2014); 10.1063/1.4890341 Pressure-induced phase transition in cubic Lu 2 O 3 J. Appl. Phys. 108, 083541 (2010); 10.1063/1.3499301 High-pressure Raman scattering study on zircon- to scheelite-type structural phase transitions of R CrO 4 J. Appl. Phys. 103, 093542 (2008); 10.1063/1.2909202
[This article is copyrighted as indicated in the article. Reuse of AIP content is subject to the terms at: http://scitation.aip.org/termsconditions. Downloaded to ] IP:
14.139.60.97 On: Tue, 28 Apr 2015 09:10:10

Raman scattering of rare earth sesquioxide Ho2O3: A pressureand temperature dependent study
Sugandha Dogra Pandey, K. Samanta, Jasveer Singh, Nita Dilawar Sharma,and A. K. BandyopadhyayPressure & Vacuum Standards, National Physical Laboratory, Dr. K.S. Krishnan Road,New Delhi 110012, India
(Received 23 June 2014; accepted 19 September 2014; published online 1 October 2014)
Pressure and temperature dependent Raman scattering studies on Ho2O3 have been carried out to
investigate the structural transition and the anharmonic behavior of the phonons. Ho2O3 undergoes
a transition from cubic to monoclinic phase above 15.5 GPa, which is partially reversible on
decompression. The anharmonic behavior of the phonon modes of Ho2O3 from 80 K to 440 K has
been investigated. We find an anomalous line-width change with temperature. The mode Gr€uneisen
parameter of bulk Ho2O3 was estimated from high pressure Raman investigation up to 29 GPa.
Furthermore, the anharmonic components were calculated from the temperature dependent Raman
scattering. VC 2014 AIP Publishing LLC. [http://dx.doi.org/10.1063/1.4896832]
I. INTRODUCTION
Rare earth oxides with unique electronic properties are
the potential candidates for applications such as catalysts,
high dielectric constant gate oxides, dopants for lasers, and
materials for magneto-optic memory.1 Among these, the
rare earth sesquioxide Ho2O3 is highly insoluble in water
and a thermally stable holmium source suitable for glass,
optic, and ceramic applications. It is used in producing
metal halide lamps, and is also used as an additive of vari-
ous garnets. Similar to most other oxides of rare-earth ele-
ments, holmium oxide is used as a speciality catalyst,
phosphor and a laser material. Holmium oxide occurs in
small quantities in the minerals monazite, gadolinite, and
in other rare-earth minerals.2 Ho2O3 occurs naturally as
C-type rare earth oxide, which crystallizes in the space
group Ia-3 (No. 206) with elementary cell containing 16
formula units RE2O3. The 32 cations are distributed among
two different sites: 24 in d sites with local symmetry C2 (2)
(non-centro-symmetric), and 8 in b sites with local symme-
try C3j (3 m, or S6) (centro-symmetric). The 48 oxygen
ions in the body-centered cell are on general positions 48e
with C1 site symmetry.3 The electronic configuration of the
Ho ion in Ho2O3 is [Xe] 4f11 5s2 5p6. The ten f-electrons
are localized in the 4f shell with one f-electron in the con-
duction band making Ho trivalent. However, Ho2O3 along
with other rare earth sesquioxides also occurs in other
structural/polymorphic modifications, which include
monoclinic with space group C2/m and hexagonal with
space group P3m1.
To address the issues of stability and structural transfor-
mations, metal-insulator transitions, enhancement or collapse
of magnetic ordering and amorphization, etc., high pressure
investigations play a pivotal role. Under such conditions, the
bonding patterns established for the systems near ambient
conditions change dramatically, causing profound effects on
numerous physical and chemical properties and leading to
the formation of new classes of materials. Although a num-
ber of rare earth sesquioxides have been investigated under
pressure,4–9 the structural stability of Ho2O3 has received
much less attention.6,9
Further, the Raman spectra of phonons have a very high
sensitivity, which permits finger-printing analysis of compo-
sition and state of a material. Hence Raman scattering is one
of the most powerful techniques to investigate the phonon
spectrum, electron phonon coupling, structural phase transi-
tions, and anharmonic behavior of the optical modes. The
high pressure Raman studies in conjunction with temperature
dependent behavior reveal the phonon-phonon couplings and
their effect on the structure and stability. To the best of our
knowledge, there are no reports of observance of a clear
phase transition in the Raman spectra of Ho2O3. Although
Lonappan et al.6 demonstrated a clear phase transition using
X-ray diffraction, their Raman data did not depict a clear
transition.
With change in temperature, most materials typically
show both the line centre and the line-width variation in their
Raman spectra. This temperature dependence can be attrib-
uted to the anharmonic terms in the vibrational potential
energy. Size effects in nanocrystals are also expected to
modify the anharmonicity and the phonon decay times as
compared to their bulk/polycrystalline counterparts. Again,
the anharmonic parameters for Ho2O3 have not been investi-
gated earlier, to the best of our knowledge. The estimation of
these anharmonic parameters requires the mode Gr€uneisen
parameter, which is obtained from the pressure dependent
frequency variation of the phonon modes. Hence in this
report, we also present the estimation of anharmonic parame-
ters using data from our own high pressure experiment.
II. EXPERIMENTAL
Commercially available Ho2O3 powder from Johnson
Matthey Inc, UK, was used for the present study and no pre-
treatment was done. The X-ray diffractogram of the powder
was recorded using Bruker D-8 Advance powder X-Ray dif-
fractometer using Cu ka (k¼ 1.5404 A) radiation. The high-
pressure Raman scattering studies were carried out with a
0021-8979/2014/116(13)/133504/7/$30.00 VC 2014 AIP Publishing LLC116, 133504-1
JOURNAL OF APPLIED PHYSICS 116, 133504 (2014)
[This article is copyrighted as indicated in the article. Reuse of AIP content is subject to the terms at: http://scitation.aip.org/termsconditions. Downloaded to ] IP:
14.139.60.97 On: Tue, 28 Apr 2015 09:10:10
single stage Jobin-Yvon Spex monochromator using an Arþ
(k¼ 514.5 nm) ion laser. The Raman signal was detected by
a liquid nitrogen cooled charge couple device (CCD). A
Mao-Bell type diamond anvil cell (DAC) with octagonal flats
having about 400 lm diameter culets was used to generate
high pressure up to 28 GPa. The sample was loaded in the
drilled gasket hole along with a few small ruby chips
(5–10 lm) for monitoring the pressure in Raman experiments.
The pressure transmitting medium used was methanol: ethanol
in the ratio of 4:1. The temperature dependent Raman meas-
urements were performed in the backscattering geometry using
the Jobin-Yvon T64000 Triple-mate instrument coupled with
the Arþ 514.5 nm laser line. A charge-coupled device system
with an accuracy of (0.75 cm�1) was used to collect the scat-
tered data. The sample temperature was varied from 80–440 K
by using a continuous flow liquid nitrogen optical cryostat in
which the sample compartment was maintained at a pressure
of �10�6 torr using a turbo-molecular pump.
III. CHARACTERIZATION AT AMBIENT
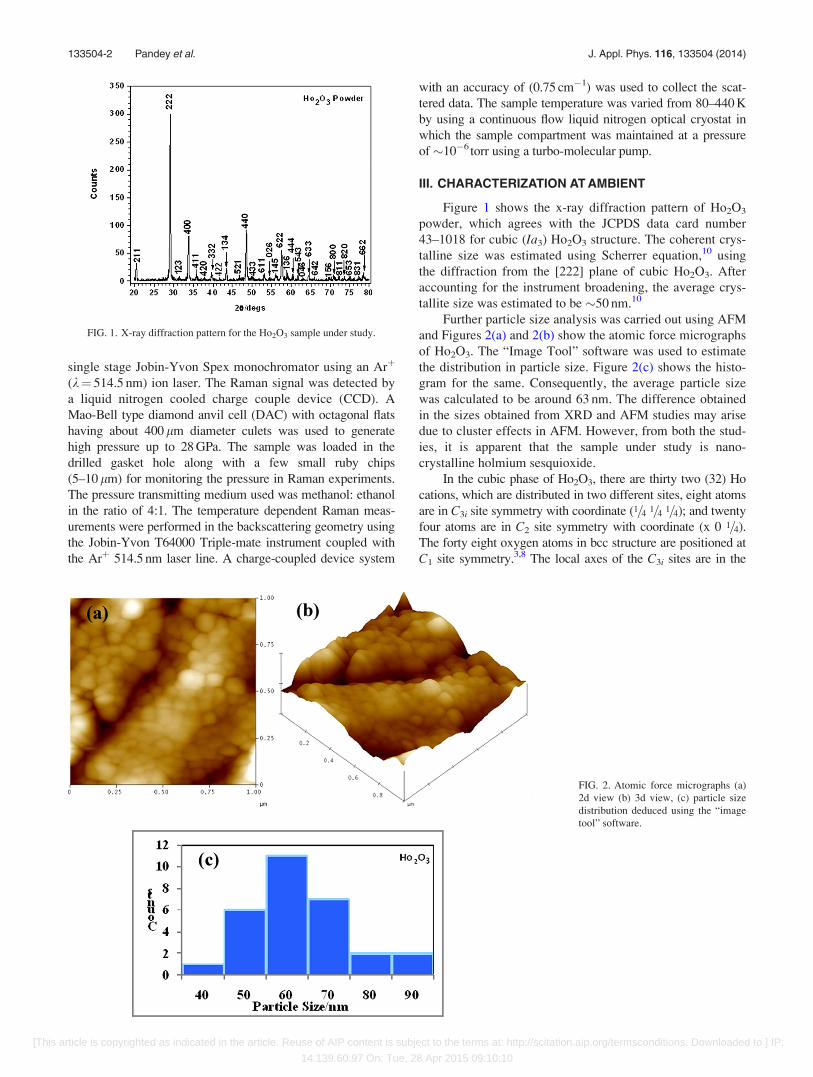
Figure 1 shows the x-ray diffraction pattern of Ho2O3
powder, which agrees with the JCPDS data card number
43–1018 for cubic (Ia3) Ho2O3 structure. The coherent crys-
talline size was estimated using Scherrer equation,10 using
the diffraction from the [222] plane of cubic Ho2O3. After
accounting for the instrument broadening, the average crys-
tallite size was estimated to be �50 nm.10
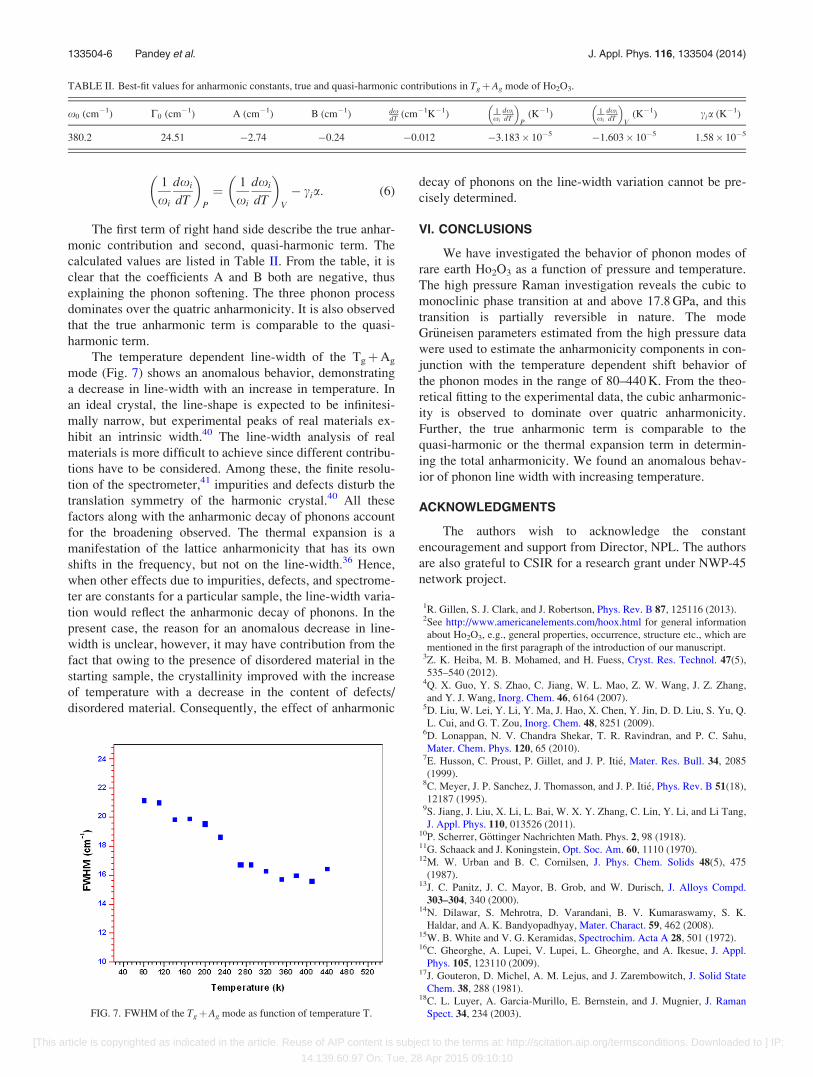
Further particle size analysis was carried out using AFM
and Figures 2(a) and 2(b) show the atomic force micrographs
of Ho2O3. The “Image Tool” software was used to estimate
the distribution in particle size. Figure 2(c) shows the histo-
gram for the same. Consequently, the average particle size
was calculated to be around 63 nm. The difference obtained
in the sizes obtained from XRD and AFM studies may arise
due to cluster effects in AFM. However, from both the stud-
ies, it is apparent that the sample under study is nano-
crystalline holmium sesquioxide.
In the cubic phase of Ho2O3, there are thirty two (32) Ho
cations, which are distributed in two different sites, eight atoms
are in C3i site symmetry with coordinate (1=4 1=4 1=4); and twenty
four atoms are in C2 site symmetry with coordinate (x 0 1=4).The forty eight oxygen atoms in bcc structure are positioned at
C1 site symmetry.3,8 The local axes of the C3i sites are in the
FIG. 1. X-ray diffraction pattern for the Ho2O3 sample under study.
FIG. 2. Atomic force micrographs (a)
2d view (b) 3d view, (c) particle size
distribution deduced using the “image
tool” software.
133504-2 Pandey et al. J. Appl. Phys. 116, 133504 (2014)
[This article is copyrighted as indicated in the article. Reuse of AIP content is subject to the terms at: http://scitation.aip.org/termsconditions. Downloaded to ] IP:
14.139.60.97 On: Tue, 28 Apr 2015 09:10:10

[111], [�111], [1�11], and [11�1] directions; whereas the C2 axes
are parallel to [100], [010], or [001] directions. According to
group theory, the irreducible representations of vibrations of
atoms occupying the sites give 22 Raman active optical modes
of cubic Ho2O3, which include 4Ag; 4Eg; and 14Tg modes.
However, smaller numbers of modes are observed in practice
in the Raman spectra; this may be due to the fact that some of
the observed modes are actually superposition of closely
spaced different type of modes, which are un-separated owing
to a weak factor-group interaction.11
The Raman spectra of Ho2O3 powder at 80 and 300 K
are shown in Fig. 3. The peaks obtained under ambient con-
ditions agree very well with the results published by Urban
and Cornilson.12 We have observed seven distinct peaks
(I1–I7) at 80 K; the peaks at 317.3, 332, 361.5, 379.4, 439.2,
473.6, and 595.3 cm�1 are assigned as the TgþEg, Eg, Uel
(C3i), TgþAg, and 3Tg modes, respectively.11–15 The peak at
379.4 cm�1, corresponding to the TgþAg mode, is the most
intense and would primarily be tracked for pressure as well
as temperature dependent variations.
We have observed the electronic contribution Uel at
361.5 cm�1. In C-type Ho2O3, the Ho3þ ions in C3i sites have
electronic configuration [(Xe) 4f10)], the crystal-field and spin-
orbit interaction splits the unfilled f-orbital into the multi-
plates. The observed 361.5 cm�1 peak in the Raman spectrum
is the electronic transition originated from stark energy level5I8 of Ho3þ in Ho2O3.
16 The electronic contribution reduced
significantly at 300 K, as shown in the inset of Fig. 3. In addi-
tion, it may be suspected that a slight amount of disordered
material may also be present owing to the broad backgrounds
in the Raman spectra. Further, the significantly increased back-
ground in the Raman spectrum at 80 K is expected to originate
from the intra-band radiative recombination of electron in
Ho2O3, whose intensity decreases with increasing temperature.
IV. HIGH PRESSURE BEHAVIOR
The pressure dependent Raman spectra of this nano-
crystalline Ho2O3 powder are shown in Fig. 4(a). It is clear
that the intensity of the modes related to cubic phase at ambi-
ent decrease significantly and the mode frequencies shift
towards higher energy side with increasing pressure. At a
pressure of about 1.3 GPa, new peaks are seen to be emerg-
ing between 600 and 700 cm�1 and their intensity increases
with the progression in applied pressure; while the peaks
related to the cubic phase gradually broaden with an intensity
decrease. At a pressure of about 17.8 GPa, the predominant
cubic phase peak completely disappears. However, the peaks
observed between 600–700 cm�1 are seen to gain intensity
from pressures as low as 5.5 GPa. In fact at the highest stud-
ied pressure of about 28.8 GPa, most other peaks disappear
and the peaks which remain are centered at 697, 751, 822,
and 947 cm�1, with another weaker band at 1084 cm�1.
Hence the cubic phase is seen to completely transform to a
new structural phase above 15.5 GPa and the transition is
completed at 17.8 GPa. These new peaks, and the phase,
have been identified as occurring due to the development of
the monoclinic phase and compare well with the reported
peaks for monoclinic Ho2O3.3 Also, in analogy with the
monoclinic spectra of other rare earth sesquioxides,17–21 the
developed phase has been confirmed as the monoclinic
phase. Heiba et al.3 have also reported similar development
of monoclinic phase related Raman peaks of Ho2O3 in their
Dy2-xHoxO3 samples for x� 0.4. Similar behavior of
Raman peaks in Lu2O3 under pressure has been reported by
FIG. 3. Phonon spectra of Ho2O3 sample at 80 and 300 K. Inset shows the
de-convoluted peaks for better visualization.
FIG. 4. (a) Raman spectra for Ho2O3 as a function of increasing pressures;
(b) Raman frequency shifts of Ho2O3 phonon modes as function of pressure.
133504-3 Pandey et al. J. Appl. Phys. 116, 133504 (2014)
[This article is copyrighted as indicated in the article. Reuse of AIP content is subject to the terms at: http://scitation.aip.org/termsconditions. Downloaded to ] IP:
14.139.60.97 On: Tue, 28 Apr 2015 09:10:10

Jiang et al.9 The peak at 1084 cm�1 at 28.8 GPa may be the
result of crystal field excitation.9 Hence, we may surmise
that in case of Ho2O3, the phase transition to monoclinic
structure completes at 17.8 GPa with complete disappearance
of the predominating cubic phase peak. Figure 4(b) shows
the pressure dependent frequency shifts.
The monoclinic B-type structure of lanthanide sesquiox-
ides belongs to the centro-symmetric space group C2/mðC3
2hÞ, which contains six molecules in each unit cell, and
also shows a sevenfold coordination of the cation. The crys-
tal lattice has three different cation sites and five different
anion sites which bond to four, five, or six metal ions.20,22 In
B-type structure, Ho atoms are located in three different 4ipositions. The 18 oxygen atoms of the unit cell occupy five
different crystallographic sites: four in 4i (m or Cs
symmetry)¼O (1), O (2), O (3), O (4), i.e., 16 O in 4i; one
in 2b (2/m or C2h symmetry)¼O (5), i.e., 2 O in 2b.16,20,22
Hence, the irreducible representation according to group
theory gives 21 Raman active modes which include 14Ag
and 7Bg modes. Gouteron et al.17 also predicted 21 Raman
active modes, i.e., 14Agþ 7Bg, from the factor group analy-
sis for B-type crystals, although fewer modes are observed in
practice. We have calculated the mode Gr€uneisen Parameter
(c), which provides a dimensionless representation of the
response to compression from the pressure dependent fre-
quency shifts dx=dP (Fig. 4(b)), i.e.,
x ¼ x0 þ ðdx=dPÞP: (1)
The mode Gr€uneisen parameters are obtained from the
equation:23
ci ¼ ðB0=x0Þðdx=dPÞ; (2)
where B0 is the isothermal bulk modulus of Ho2O3 of the
cubic phase, x0 is the mode frequency at ambient. The iso-
thermal bulk modulus values of Ho2O3 were taken as 206
and 200 GPa for the cubic and monoclinic phase, respec-
tively.9 The obtained c values are tabulated in Table I. These
values for Ho2O3 have not been reported so far to the best of
our knowledge. The monoclinic modes obtained after extrap-
olation of the high pressure peaks to the atmospheric pres-
sure are also presented in Table I.
Figure 5 shows the behavior of the sample on decom-
pression. The peaks occurring due to monoclinic phase shift
to lower wave numbers with decompression. However, the
sample shows partial reversible behavior although the high
pressure phase is observed down to the ambient. Broad peaks
around 415 and 460 cm�1 are seen to be developing as
decompression progresses, which qualitatively depict the
partial reversibility of the observed transition.
A. Discussion
In the present study, it is interesting to note that contrary
to the cubic to hexagonal phase transitions observed in our
previous reports of Dy2O3 and Yb2O3,24,25 Ho2O3 shows a
different response to the applied pressure and converts to the
monoclinic phase. However, this behavior has been found to
be similar to our previous studies on Sm2O3 and Eu2O3.24,26
It is noteworthy that there exist several ways of transforma-
tion between the various phases, depending on temperature
and pressure conditions.27,28 Additional reaction components
can also help to transform the sesquioxides during the tem-
perature treatment. For example, Foex et al. achieved a
transformation from the C-type to the B-type structure by
adding some lime,29 or by offering support with oxides like
CaO and SrO.30 In the previous similar observations in the
case of Eu2O3 and Sm2O3, the starting material was found to
contain traces of non-stoichiometric phase and monoclinic
phase, respectively.24,26 In the present case also at ambient
and at a low pressure of 1.32 GPa, a broad hump is seen
around 600–700 cm�1, which increases with applied pres-
sure. Although our XRD studies did not indicate the presence
of another phase, it may be possible that some amount of dis-
ordered state is present in the sample, which facilitates the
growth of monoclinic phase at the expense of cubic phase.
In context of the reported work, it has been observed
that the structural stability of Ho2O3 under high pressure has
received much less attention as compared to other rare earth
sesquioxides. Based on the density functional theory calcula-
tions, Wu et al.31 predicted a B!A phase transition in
Ho2O3 at around 17.0 GPa. The C-type Ho2O3 has also been
reported to transform to the monoclinic phase at 1.5 GPa and
1000 �C by Hoekstra.32 Lonappan et al. carried out the study
on cubic Ho2O3 up to 17.0 GPa by using rotating anode x-
ray generator and reported that a phase transformation of
TABLE I. The mode frequencies, pressure coefficients, and Gr€uneisen pa-
rameters ðciÞ for phonon modes in cubic Ho2O3.
Phase/structure xðcm�1Þ dx=dpðcm�1=GPaÞ ci
Cubic 330.2 3.19 1.99
375.2 3.89 2.14
468 3.05 1.34
Monoclinic 608 3.24 1.07
652.3 3.84 1.18
682.7 5.74 1.68
760 7.9 2.08
FIG. 5. Raman spectra of Ho2O3 observed during the releasing pressure
cycle.
133504-4 Pandey et al. J. Appl. Phys. 116, 133504 (2014)
[This article is copyrighted as indicated in the article. Reuse of AIP content is subject to the terms at: http://scitation.aip.org/termsconditions. Downloaded to ] IP:
14.139.60.97 On: Tue, 28 Apr 2015 09:10:10

C!B appeared between 9.5 and 16.0 GPa,6 but the B!A
phase transition was not observed. Recently, Jiang et al.,9
using x-ray diffraction, also observed the structural
transformation from a cubic to a monoclinic structure
starting at 8.9 GPa, which completed at 16.3 GPa with a
8.1% volume collapse. A hexagonal phase appeared at
14.8 GPa and becomes dominant at 26.4 GPa. After release
of pressure, the hexagonal phase transformed to a monoclinic
structure. However, the observance of a clear phase
transition in Raman spectra of Ho2O3 is not reported so far.
Hence qualitatively, our results also agree somewhat with
the pressures reported for the completion of phase
transformation.
The structural characterization of monoclinic (B)
Ho2O3, synthesized by Hoekstra, has been reported by a few
workers.32,33 It was figured out that the phase transforma-
tions of the cubic rare-earth sesquioxides into the monoclinic
compounds (C–B transformation) are reversible under cer-
tain high-pressure/high-temperature conditions between 2.5
and 4 GPa at 900–1000 �C.32 Sawyer et al. succeeded in
transforming parts (�20%) of the cubic phase starting mate-
rial C-Ho2O3 by high-pressure impact methods.34 Hoekstra33
and Sawyer34 showed that the monoclinic phase B-Ho2O3
disappears under temperature treatment and is transformed
into the cubic phase C-Ho2O3, which supported the predic-
tion of a metastable high-pressure phase.33
V. TEMPERATURE DEPENDENT BEHAVIOR
The anharmonic behavior of the phonon modes has been
investigated by the temperature dependent Raman scattering
in the range of 80–440 K. The temperature dependent Raman
spectra of Ho2O3 are shown in Fig. 6(a). The most intense
TgþAg mode is seen to be shifting towards lower frequency
side with increasing temperature; however, other modes do
not change significantly. The variation/shift in frequency of
TgþAg mode is plotted in Fig. 6(b). This shift of frequency
with temperature has contribution from the thermal expan-
sion of the lattice and anharmonic phonon-phonon interac-
tion. The phonon frequency shift as a function of
temperature can be expressed as,34,35
xðTÞ ¼ x0 þ ðDxÞlatt þ ðDxÞanh; (3)
where x0 is harmonic frequency, which was obtained by
extrapolating the experimental data down to 0 K; the quasi
harmonic term ðDxÞlatt arises from the thermal expansion
while ðDxÞanh represents the anharmonic coupling of the
phonons.
The quasi-harmonic or thermal expansion contribution
can be written as36
ðDxÞlatt ¼ x0
�exp ½�ci
ðT
0
3aðTÞdT� � 1
�; (4)
where x0 is the harmonic frequency of TgþAg mode. The
Gr€uneisen parameter of the corresponding mode ci ¼ 2:14 is
estimated from our high pressure Raman scattering data. The
linear thermal expansion coefficient, a¼ 7.4 � 10�6/K for
Ho2O3.37
The anharmonic contribution ðDxÞanh which arises from
the phonon-phonon interaction due to the cubic and quartic
terms in the inter-atomic potential, can be written as:36
Dxð Þanh ¼ A 1þ 2
exp �hx0=2kTð Þ � 1
� �
þ B
�1þ 3
exp �hx0=3kTð Þ � 1
þ 3
exp �hx0=3kTð Þ � 1ð Þ2�: (5)
The first term estimates the coupling of an optical phonon
to two low-energy phonons (three phonon process); the sec-
ond term is due to the coupling to three phonons (four-phonon
process), while A and B are the fitting parameters. Equations
(4) and (5) substituted into Eq. (3) give us the fitting expres-
sion. The experimental data are in good agreement with the
fitting by Eq. (3), and fitting parameters are listed in Table II.
We have also calculated the total anharmonicity of
TgþAg mode as a function of temperature using the follow-
ing equation:38,39
FIG. 6. (a) Temperature dependent Raman spectra of Ho2O3 sample in the
temperature range 80–440 K. (b) Shift of TgþAg mode as a function of tem-
perature, the solid line represents the fitting of the experimental data points
using Eq. (3).
133504-5 Pandey et al. J. Appl. Phys. 116, 133504 (2014)
[This article is copyrighted as indicated in the article. Reuse of AIP content is subject to the terms at: http://scitation.aip.org/termsconditions. Downloaded to ] IP:
14.139.60.97 On: Tue, 28 Apr 2015 09:10:10
1
xi
dxi
dT
� �P
¼ 1
xi
dxi
dT
� �V
� cia: (6)
The first term of right hand side describe the true anhar-
monic contribution and second, quasi-harmonic term. The
calculated values are listed in Table II. From the table, it is
clear that the coefficients A and B both are negative, thus
explaining the phonon softening. The three phonon process
dominates over the quatric anharmonicity. It is also observed
that the true anharmonic term is comparable to the quasi-
harmonic term.
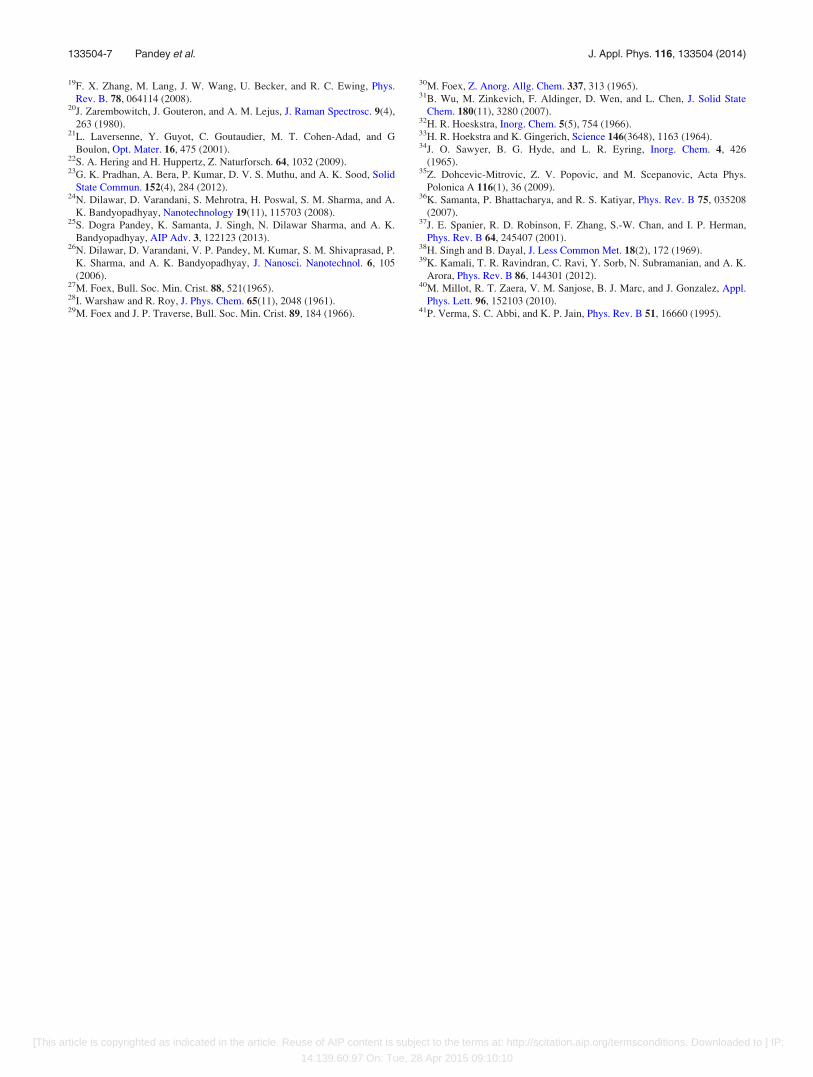
The temperature dependent line-width of the TgþAg
mode (Fig. 7) shows an anomalous behavior, demonstrating
a decrease in line-width with an increase in temperature. In
an ideal crystal, the line-shape is expected to be infinitesi-
mally narrow, but experimental peaks of real materials ex-
hibit an intrinsic width.40 The line-width analysis of real
materials is more difficult to achieve since different contribu-
tions have to be considered. Among these, the finite resolu-
tion of the spectrometer,41 impurities and defects disturb the
translation symmetry of the harmonic crystal.40 All these
factors along with the anharmonic decay of phonons account
for the broadening observed. The thermal expansion is a
manifestation of the lattice anharmonicity that has its own
shifts in the frequency, but not on the line-width.36 Hence,
when other effects due to impurities, defects, and spectrome-
ter are constants for a particular sample, the line-width varia-
tion would reflect the anharmonic decay of phonons. In the
present case, the reason for an anomalous decrease in line-
width is unclear, however, it may have contribution from the
fact that owing to the presence of disordered material in the
starting sample, the crystallinity improved with the increase
of temperature with a decrease in the content of defects/
disordered material. Consequently, the effect of anharmonic
decay of phonons on the line-width variation cannot be pre-
cisely determined.
VI. CONCLUSIONS
We have investigated the behavior of phonon modes of
rare earth Ho2O3 as a function of pressure and temperature.
The high pressure Raman investigation reveals the cubic to
monoclinic phase transition at and above 17.8 GPa, and this
transition is partially reversible in nature. The mode
Gr€uneisen parameters estimated from the high pressure data
were used to estimate the anharmonicity components in con-
junction with the temperature dependent shift behavior of
the phonon modes in the range of 80–440 K. From the theo-
retical fitting to the experimental data, the cubic anharmonic-
ity is observed to dominate over quatric anharmonicity.
Further, the true anharmonic term is comparable to the
quasi-harmonic or the thermal expansion term in determin-
ing the total anharmonicity. We found an anomalous behav-
ior of phonon line width with increasing temperature.
ACKNOWLEDGMENTS
The authors wish to acknowledge the constant
encouragement and support from Director, NPL. The authors
are also grateful to CSIR for a research grant under NWP-45
network project.
1R. Gillen, S. J. Clark, and J. Robertson, Phys. Rev. B 87, 125116 (2013).2See http://www.americanelements.com/hoox.html for general information
about Ho2O3, e.g., general properties, occurrence, structure etc., which are
mentioned in the first paragraph of the introduction of our manuscript.3Z. K. Heiba, M. B. Mohamed, and H. Fuess, Cryst. Res. Technol. 47(5),
535–540 (2012).4Q. X. Guo, Y. S. Zhao, C. Jiang, W. L. Mao, Z. W. Wang, J. Z. Zhang,
and Y. J. Wang, Inorg. Chem. 46, 6164 (2007).5D. Liu, W. Lei, Y. Li, Y. Ma, J. Hao, X. Chen, Y. Jin, D. D. Liu, S. Yu, Q.
L. Cui, and G. T. Zou, Inorg. Chem. 48, 8251 (2009).6D. Lonappan, N. V. Chandra Shekar, T. R. Ravindran, and P. C. Sahu,
Mater. Chem. Phys. 120, 65 (2010).7E. Husson, C. Proust, P. Gillet, and J. P. Iti�e, Mater. Res. Bull. 34, 2085
(1999).8C. Meyer, J. P. Sanchez, J. Thomasson, and J. P. Iti�e, Phys. Rev. B 51(18),
12187 (1995).9S. Jiang, J. Liu, X. Li, L. Bai, W. X. Y. Zhang, C. Lin, Y. Li, and Li Tang,
J. Appl. Phys. 110, 013526 (2011).10P. Scherrer, G€ottinger Nachrichten Math. Phys. 2, 98 (1918).11G. Schaack and J. Koningstein, Opt. Soc. Am. 60, 1110 (1970).12M. W. Urban and B. C. Cornilsen, J. Phys. Chem. Solids 48(5), 475
(1987).13J. C. Panitz, J. C. Mayor, B. Grob, and W. Durisch, J. Alloys Compd.
303–304, 340 (2000).14N. Dilawar, S. Mehrotra, D. Varandani, B. V. Kumaraswamy, S. K.
Haldar, and A. K. Bandyopadhyay, Mater. Charact. 59, 462 (2008).15W. B. White and V. G. Keramidas, Spectrochim. Acta A 28, 501 (1972).16C. Gheorghe, A. Lupei, V. Lupei, L. Gheorghe, and A. Ikesue, J. Appl.
Phys. 105, 123110 (2009).17J. Gouteron, D. Michel, A. M. Lejus, and J. Zarembowitch, J. Solid State
Chem. 38, 288 (1981).18C. L. Luyer, A. Garcia-Murillo, E. Bernstein, and J. Mugnier, J. Raman
Spect. 34, 234 (2003).
TABLE II. Best-fit values for anharmonic constants, true and quasi-harmonic contributions in TgþAg mode of Ho2O3.
x0 (cm�1) C0 (cm�1) A (cm�1) B (cm�1) dxdT (cm�1K�1) 1
xi
dxi
dT
� P
(K�1) 1xi
dxi
dT
� V
(K�1) cia (K�1)
380.2 24.51 �2.74 �0.24 �0.012 �3.183� 10�5 �1.603� 10�5 1.58� 10�5
FIG. 7. FWHM of the TgþAg mode as function of temperature T.
133504-6 Pandey et al. J. Appl. Phys. 116, 133504 (2014)
[This article is copyrighted as indicated in the article. Reuse of AIP content is subject to the terms at: http://scitation.aip.org/termsconditions. Downloaded to ] IP:
14.139.60.97 On: Tue, 28 Apr 2015 09:10:10
19F. X. Zhang, M. Lang, J. W. Wang, U. Becker, and R. C. Ewing, Phys.
Rev. B. 78, 064114 (2008).20J. Zarembowitch, J. Gouteron, and A. M. Lejus, J. Raman Spectrosc. 9(4),
263 (1980).21L. Laversenne, Y. Guyot, C. Goutaudier, M. T. Cohen-Adad, and G
Boulon, Opt. Mater. 16, 475 (2001).22S. A. Hering and H. Huppertz, Z. Naturforsch. 64, 1032 (2009).23G. K. Pradhan, A. Bera, P. Kumar, D. V. S. Muthu, and A. K. Sood, Solid
State Commun. 152(4), 284 (2012).24N. Dilawar, D. Varandani, S. Mehrotra, H. Poswal, S. M. Sharma, and A.
K. Bandyopadhyay, Nanotechnology 19(11), 115703 (2008).25S. Dogra Pandey, K. Samanta, J. Singh, N. Dilawar Sharma, and A. K.
Bandyopadhyay, AIP Adv. 3, 122123 (2013).26N. Dilawar, D. Varandani, V. P. Pandey, M. Kumar, S. M. Shivaprasad, P.
K. Sharma, and A. K. Bandyopadhyay, J. Nanosci. Nanotechnol. 6, 105
(2006).27M. Foex, Bull. Soc. Min. Crist. 88, 521(1965).28I. Warshaw and R. Roy, J. Phys. Chem. 65(11), 2048 (1961).29M. Foex and J. P. Traverse, Bull. Soc. Min. Crist. 89, 184 (1966).
30M. Foex, Z. Anorg. Allg. Chem. 337, 313 (1965).31B. Wu, M. Zinkevich, F. Aldinger, D. Wen, and L. Chen, J. Solid State
Chem. 180(11), 3280 (2007).32H. R. Hoeskstra, Inorg. Chem. 5(5), 754 (1966).33H. R. Hoekstra and K. Gingerich, Science 146(3648), 1163 (1964).34J. O. Sawyer, B. G. Hyde, and L. R. Eyring, Inorg. Chem. 4, 426
(1965).35Z. Dohcevic-Mitrovic, Z. V. Popovic, and M. Scepanovic, Acta Phys.
Polonica A 116(1), 36 (2009).36K. Samanta, P. Bhattacharya, and R. S. Katiyar, Phys. Rev. B 75, 035208
(2007).37J. E. Spanier, R. D. Robinson, F. Zhang, S.-W. Chan, and I. P. Herman,
Phys. Rev. B 64, 245407 (2001).38H. Singh and B. Dayal, J. Less Common Met. 18(2), 172 (1969).39K. Kamali, T. R. Ravindran, C. Ravi, Y. Sorb, N. Subramanian, and A. K.
Arora, Phys. Rev. B 86, 144301 (2012).40M. Millot, R. T. Zaera, V. M. Sanjose, B. J. Marc, and J. Gonzalez, Appl.
Phys. Lett. 96, 152103 (2010).41P. Verma, S. C. Abbi, and K. P. Jain, Phys. Rev. B 51, 16660 (1995).
133504-7 Pandey et al. J. Appl. Phys. 116, 133504 (2014)
[This article is copyrighted as indicated in the article. Reuse of AIP content is subject to the terms at: http://scitation.aip.org/termsconditions. Downloaded to ] IP:
14.139.60.97 On: Tue, 28 Apr 2015 09:10:10