raising the bar - metropolitan transportation … · 6 steps 4 case studies tackling climate...
TRANSCRIPT

6STEPS
4 CASE STUDIES
Tackling climate change, sea level rise, and hazard response through integrated, multi-benefit, regional resilience planning
RAISING THE BAR on Regional Resilience
Bay Area Regional Collaborative
DRAFT November 2017

This report was produced by the
Bay Area Regional Collaborative.
BARC coordinates the planning efforts
of the Association of Bay Area Govern-
ments (ABAG), the Bay Area Air Quality
Management District (BAAQMD), the
San Francisco Bay Conservation and
Development Commission (BCDC),
and the Metropolitan Transportation
Commission (MTC).
Allison Brooks
Executive Director

6STEPS
4 CASE STUDIES
Tackling climate change, sea level rise, and hazard response through integrated, multi-benefit, regional resilience planning
Bay Area Regional Collaborative
DRAFT November 2017
RAISING THE BAR on Regional Resilience

i i R A I S I N G R E G I O N A L R E S I L I E N C E
Whatever formula you consult, the economic costs of rising sea levels and increased flooding due to extreme events promise to be significant. Flooded communities, broken homes, transportation and roads underwater, lost lives, pets and property are all things seen in the news of hurricanes Harvey, Katrina and Sandy (the kind of storms that usually only occur once every 100–500 years). Across the region, the costs of replacing the structures and contents of homes and businesses flooded as a result of one meter of sea level rise, plus the 100-year storm, is estimated at around $70 billion dollars (~42,000 homes and businesses). Even with 0.5 meters of sea level rise, replacement cost tops $45 billion. And with 1.5 meters the value approaches $100 billion (Our Coast Our Future, FEMA Hazuz model, courtesy Baykeeper).
For comparison, the economic risk associated with coastal and riverine flooding during a 150-year storm, without sea level rise, has been estimated at around $10 Billion, which includes depreciation ofstructures and contents (Surviving the Storm 2015). And the California Department of Water Resources estimates the replace-ment cost of all Bay Area structures within the 100-year floodplain to be $46 billion. In the coming years, regional agencies will be refining estimates of household expo-sure to sea level rise, an analysis which will incorporate socioeconomic characteristics (BCDC ART). Photo, King tide in the low-lying Mission Bay neighborhood of San Francisco, where new construction continues to boom. Photo: BCDC.

i i iE X E C U T i V E S U M M A R Y
Executive Summary
As a metropolitan area with low-lying shorelines susceptible to flooding, rising sea levels, active earthquake faults, and social inequities compounded by an affordable housing crisis, resilience planning is fast becoming a priority for the San Francisco Bay Area. Resilience is commonly defined as the ability to recover from setbacks, adapt well to change, and keep going in the face of adversity (Harvard Business Review). A resilient Bay Area is a region that is well positioned to manage and respond to the uncertainties and physical hazards associ-ated with the Bay Area’s geographic setting and changing climate while protecting vulnera-ble people and communities, critical infrastructure, and the natural environment.
With the July 2017 adoption of Plan Bay Area 2040 — including new commitments to resilience-building actions — the region is at an important crossroads where various research, planning, design, and management activities focused on resilience are coming together both in policy and on the ground. The adoption is one of several milestones reached in 2017 that demonstrate both how far the region has come and the opportunities ahead to raise the bar on regional resilience.
The first 2017 milestone is the assembly of a critical mass of research and analysis on vulnerability to sea level rise and flooding all around the Bay by local and regional partners through the Bay Area Regional Collaborative (BARC) and other efforts. Some of this work — led by the San Francisco Bay Conservation and Development Commission’s Adapting to Rising Tides program (BCDC ART) and the Association of Bay Area Government’s (ABAG) Resilience Program — identified four specific areas of vulnerability to sea level rise and flooding in need of more than just local attention. These regional level vulnerabilities include transportation infrastructure, fragile housing, disadvantaged communities, and natural areas and parklands close to shore (see Part 2 of this report, Case Studies in Multi-Hazard Resilience Planning, p. 33).
A second 2017 milestone is the use of all this information to identify six actions in Plan Bay Area 2040 (the region’s state-mandated Sustainable Communities Strategy) that would help the region address these vulnerabilities in an integrated fashion. These six actions address regional governance, resilient housing, funding, equity, mitigation, and other issues arising from climate adaptation planning on a regional level (see p. 7). The substance of these actions reflects coordinated work on the part of BARC, BCDC, ABAG, and the Metropolitan Transportation Commission (MTC), as well as the California State Coastal Conservancy and the San Francisco Estuary Partnership.
A third 2017 milestone is the launch of the Resilient by Design | Bay Area Challenge, which is now engaging 10 multi-disciplinary design teams in addressing resilience challenges at 10 project locations around the Bay. The results, to be completed in summer 2018, will add to the region’s toolbox of options for forging more resilient shorelines, cities, and communities.

i V R A I S I N G R E G I O N A L R E S I L I E N C E
This Raising the Bar report provides background on the region’s progress in resilience planning to date. The report:
n Defines resilience
n Outlines best available data on the consequences of multiple current and future hazards for the region’s housing, jobs, transportation, open space, and other critical infrastructure
n Details efforts underway related to resiliency and what they will accomplish
n Shares strategies and responses designed to address local and regional vulnerabilities to flooding and sea level rise, and to optimize synergies with earthquake preparedness
n Lays the groundwork for integrating local and regional studies into future versions of the state-mandated Regional Transportation Plan and Sustainable Communities Strategy (RTP/SCS), and into municipal and community planning processes
n Advocates that equity principles must be incorporated in all actions, which also means that community members must have a place in the process, from the framing of prob-lems to the development and implementation of solutions
n Outlines steps needed to develop a Regional Resilience Plan that fully integrates multi-hazard planning with climate change mitigation and adaptation measures.
As highlighted above, one important component of integrating resilience planning across the region will be informing the development of the next RTP/SCS, a process scheduled to take place between now and 2021. While Plan Bay Area 2040 is the current version of the state-mandated RTP/SCS, the next version may take a different form. Over the next two
years, regional partners will be laying the groundwork for enhancing this regional planning process so that it more strongly supports multi-hazard, multi-benefit initiatives and strategies that increase the Bay Area’s resilience.
Raising the bar on regional resilience through this existing planning process is particularly important since the resulting plans commit the region to focusing growth and development in specific places within the metropolitan Bay Area: Priority Development Areas and Priority Conservation Areas (see p. 13). The RTP/SCS also prioritizes transportation invest-ments over the next 20–30 years. When considered together, and in light of new information about their vulnerability to flooding, sea level rise and other hazards,
Bay Trail in West Contra Costa County along the local wastewater treatment plant’s solar installation. Photo: the Bay Trail.

vE X E C U T i V E S U M M A R Y
choices made around these priority areas and investments will be central the Bay Area’s overall resilience.
In addition, Plan Bay Area 2040’s strong focus on the housing affordability crisis highlights the particular vulnerability of people already living within the economic margins of our costly region to the hazards ahead. Both the affordability and safety of regional housing options are critical components of resilience. This became even more evident in October 2017, when the region lost 3,000 homes within one week in Sonoma, Napa and Solano counties to devastating wildfires, leaving thousands homeless and many unable to find affordable replacement or temporary housing.
Addressing climate change in the context of regional resilience is a complex challenge for those charged with integrating planning across nine counties, more than a hundred cities, and myriad local jurisdictions and special districts. Clearly, the region must continue to accelerate mitigation of climate impacts by reducing greenhouse gas emissions and improving air quality, activities which the Bay Area Quality Management District, MTC and ABAG have led for many years. To optimize resilience, mitigation must also be integrated with adaptation to the changing climate, however. Clearly, the region must increase its capacity to manage flooding and sea level rise impacts, and integrate this effort with existing hazard response and mitigation programs.
Strengthening our urban and natural infrastructure, ensuring public safety, and growing our regional resilience equitably will require a partnership across regional agencies, local jurisdictions, and non-governmental organizations, and with community residents, businesses, designers, builders, academics, health professionals, among others. There is also a need for explicit regional acknowledgement of the role that race and inequity play in making some communities more vulnerable than others.
BARC, MTC, ABAG, and BCDC consider this report a call to action. These agencies, working cooperatively with BAAQMD, are committed to developing and implementing an integrat-ed Regional Resilience Plan that comprehensively prepares the Bay Area for the challenges before us. It’s time to raise the bar on regional resilience.
Tree planting in the Kavanaugh neighborhood of East Palo Alto. Photo by Canopy.

V i R A I S I N G R E G I O N A L R E S I L I E N C E
RAISING THE BAR REPORT CONTRIBUTORS
Project Staff
Dana Brechwald, Association of Bay Area Governments (ABAG)
Allison Brooks, Bay Area Regional Collaborative (BARC)
Vijaylaxsmi Kesavan, Bay Area Regional Collaborative (BARC)
Lindy Lowe, San Francisco Bay Conservation and Development Commission (BCDC)
Regional Review Committee
Matthew Gerhart, Bay Conservancy, State Coastal Conservancy
Matt Maloney, Metropolitan Transportation Commission (MTC)
Heidi Nutters, San Francisco Estuary Partnership
Kelly Malinowski, Bay Conservancy, State Coastal Conservancy
Caitlin Sweeney, San Francisco Estuary Partnership
Editor
Ariel Rubissow Okamoto

1T A B L E O F C O N T E N T S
TABLE OF CONTENTS
EXECUTIVE SUMMARY . . . . . . . . . . . . . . . . . . . . . . . . . . . . . . . . . . . . . . . . . . . iii
PART 1 – STEPS TO RESILIENCE
Preface . . . . . . . . . . . . . . . . . . . . . . . . . . . . . . . . . . . . . . . . . . . . . . . . . . . . . 4
Finding Resilience in Plan Bay Area 2040 . . . . . . . . . . . . . . . . . . . . . . . . . . . . . . . . 6
A Metropolitan Region at Risk . . . . . . . . . . . . . . . . . . . . . . . . . . . . . . . . . . . . . . . 9
Flooding and Sea Level Rise . . . . . . . . . . . . . . . . . . . . . . . . . . . . . . . . . . . . . 11
Priority Areas for Development and Conservation . . . . . . . . . . . . . . . . . . . . . . . 13
Accelerating Resilience: Regional Agency Actions to Date . . . . . . . . . . . . . . . . . . . . 17
Current Collaborative Projects . . . . . . . . . . . . . . . . . . . . . . . . . . . . . . . . . . . 19
Steps to a Regional Resilience Plan . . . . . . . . . . . . . . . . . . . . . . . . . . . . . . . . 23
Current Planning, Regulatory and Legislative Context for Regional Resilience . . . . . . . . 28
Reaching Resilience Requires Coordinated Action . . . . . . . . . . . . . . . . . . . . . . . . . 31
PART 2 – CASE STUDIES IN MULTI-HAZARD RESILIENCE PLANNING
Regional Vulnerability: Transportation Infrastructure . . . . . . . . . . . . . . . . . . . . . . . 37
Local Example: Oakland Coliseum Area and Bay Farm Island, Alameda County . . . . 42
Regional Vulnerability: Fragile Housing . . . . . . . . . . . . . . . . . . . . . . . . . . . . . . . . 47
Local Example: Central San Rafael and Canal District, Marin County . . . . . . . . . . . 53
Regional Vulnerability: Disadvantaged and Vulnerable Communities . . . . . . . . . . . . . 59
Local Example: East Palo Alto, San Mateo County . . . . . . . . . . . . . . . . . . . . . . . 65
Regional Vulnerability: Natural Areas along Shorelines . . . . . . . . . . . . . . . . . . . . . . 73
Local Example: Hayward Shoreline, Alameda County . . . . . . . . . . . . . . . . . . . . . 79

2 R A I S I N G R E G I O N A L R E S I L I E N C E
REGIONAL AND CASE STUDY MAPS
Bay Area Sea Level Rise Risk to Priority Development Areas . . . . . . . . . . . . . . . . . . . 10
Bay Area Liquefaction Risk to to Priority Development Areas . . . . . . . . . . . . . . . . . . 14
Bay Area Transportation Infrastructure and Sea Level Rise . . . . . . . . . . . . . . . . . . . . 36
Flood Risk to Fragile Housing in San Rafael . . . . . . . . . . . . . . . . . . . . . . . . . . . . . 52
Fragile Housing Risk Zones in San Rafael . . . . . . . . . . . . . . . . . . . . . . . . . . . . . . . 54
Bay Area Communities at Risk . . . . . . . . . . . . . . . . . . . . . . . . . . . . . . . . . . . . . . 60
Community Indicators in East Palo Alto . . . . . . . . . . . . . . . . . . . . . . . . . . . . . . . . 64
Baylands and Sea Level Rise in East Palo Alto . . . . . . . . . . . . . . . . . . . . . . . . . . . . 66
Natural Areas and Sea Level Rise in San Francisco Bay . . . . . . . . . . . . . . . . . . . . . . 71
Hayward Shoreline Natural Areas and Infrastructure Risk . . . . . . . . . . . . . . . . . . . . 78

3P A R T 1 : S T E P S T O R E S i L i E N C E
PART
1
Steps to Resilience
4 R A I S I N G R E G I O N A L R E S I L I E N C E
PREFACE
Resilience is commonly defined as the ability to recover from setbacks, adapt well to change, and keep going in the face of adversity (Harvard Business Review), or as the capacity of a system or community to maintain an intact core identity in the face of change (Movement Generation). Other relevant definitions can be found on p. 28.
Assessing the resilience of any place or community requires understanding its vulnerabilities and strengths, developing strategies to fill gaps and strengthen weaknesses, and investing in more flexible structures and systems. Achieving resilience requires community decision-making that includes broad participation and considers not only economic and regulatory impacts, but also social equity and environmental quality. For the San Francisco Bay Area, some of our most criti-cal resilience concerns involve issues discussed in the region’s primary land use and transportation vision: Plan Bay Area 2040. These include a lack of affordable housing, aging infrastructure, a bursting-at-the-seams transportation network, and stresses and demands on our natural ecosystems.
Threats to the Bay Area’s urban and social resilience include the uncertainty and physical hazards associated with the Bay Area’s geographic setting and changing climate. As a metropolitan area with low-lying shorelines and major active earthquake faults, the region must also find a way to be resilient to earthquakes, flooding, sea level rise, drought, heat, changes in precipitation, and fire.
Fortunately, regional planners, local agencies, and community leaders have been working hard for many years to understand and assess our vulnerabili-ties and determine appropriate strategies and interventions that will make us more resilient. The region already has a long history of response to, and preparation for, major earthquakes. As a result, the Bay Area has strong seismic safety policies and programs in place addressing everything from building and bridge retrofits to emergency shelters, and including education and outreach to the populace at risk. The region now needs to build equiva-lent policies, programs and capacity to address the impacts of increased flooding and sea level rise, but we don’t have to start from scratch. Many current flood protection and shoreline restoration activities could easily be augmented, especially with public support for this invaluable work via the regional parcel tax administered by San Francisco Bay Restoration Authority. Additional capacity can be found in efforts to replace pavements and parking lots with more water absorbent green infrastructure, to restore urban creeks and flood control channels to more natural conditions, and to reduce current flooding in low spots along highways. All these factors, and the region’s established track record in hazard preparation, offer the Bay Area a strong foundation for becoming much more resilient in the face of the challenges ahead.
“True resilience calls on us to rethink the urban systems that supply our energy, transportation, food, water, and housing. It calls on us to live within planetary limits, to avoid further destabilizing natural systems. And it calls on us to eradicate the inequities that magnify vulnerability to disaster, and to distribute opportunities more fairly — so that all people have a chance to adapt and thrive in a fast-changing world.” i S L A N D P R E S S U R B A N R E S i L i E N C E P R O J E C T 2013

P A R T 1 : S T E P S T O R E S I L I E N C E 5
Unfortunately, much of our region was not designed to be safe from unanticipated future flooding or hazards exacerbated by earthquakes. Many of the region’s existing sea walls, levees, and flood control structures are inadequate, seismically unsafe, or in need of mainte-nance and upgrades, while other areas have little or no flood protec-tion at all. Major investments in both strengthening existing protec-tions and building new and more natural infrastructure and systems are an urgent priority to protect the people who live and work in the Bay Area, as well as the services, amenities and urban infrastructure that support our economy. Likewise, we need to understand the vulnerabilities of locations where we are further concentrating housing, jobs, transportation and other critical infrastructure: many current communities are not only in the path of a rising Bay, but also built on loose soils subject to liquefaction in an earthquake.
To build more resilience in the Bay Area, regional leaders are calling for increased coordination among public and private interests, and local and regional entities, so that our valuable urban infrastructure can be adapted to future conditions in the most efficient, transparent, ecological, and equitable way possible. Any capital investments in big infrastructure projects along the shoreline or in our watersheds today should consider not only seismic safety but also more frequent, more intense, and higher levels of flood risk, while also understanding how different interventions made around the Bay may positively or adversely impact neighboring communities.
In the decades ahead, as rising sea levels bring water further inland, onto our shores, and into our airports, downtowns, and shoreline communities, the region will very quickly discover what can’t and shouldn’t get wet. It might be an electrical control box for BART or a freeway underpass leading to the West Coast’s largest container shipping port or the basement of a hospital or home for the elderly. Increased flooding is sure to keep us from doing things we all take for granted every day, whether it’s crossing the Bay Bridge, getting a package that’s come by plane through Oakland or SFO, or taking the dog for a walk along the waterfront. Add an earthquake, especially in areas built on Bay fill where solid ground may turn liquid and roll, and the problems will multiply. Photo courtesy of Bay Trail.
Every substantive infrastructure improvement, whether it’s moving a sewage outfall, strengthening an airport levee, widening a flood plain, elevating a bridge on-ramp, restoring a wetland, or protecting at-risk communities should be developed and designed in a way that meets multiple local and regional objectives while protecting the assets the region relies on. A L L i S O N B R O O K S , 2017

6 R A I S I N G R E G I O N A L R E S I L I E N C E
Finding Resilience in Plan Bay Area 2040
As a state-mandated regional planning effort, the Bay Area’s Regional Transportation Plan and Sustainable Communities Strategy (RTP/SCS) provides an important foundation for addressing the impact of the changing climate on our communities, transportation system, and other critical infrastructure. Specifically, this recurring regional planning process has a role to play in addressing the hazards of flooding, sea level rise, and seismic events, as well as in helping local jurisdictions and regional partners work together to better ensure that the infrastructure and public services the people in our region depend upon can withstand the impacts. This is particularly important since the region has com-mitted — through the current RTP/SCS called Plan Bay Area 2040 — to focusing future growth and development of housing, jobs and transportation infrastructure in existing urbanized areas through the designation of Priority Development Areas (PDAs) and Priority Conservation Areas (PCAs). When considered together, and in light of new information about their vulnerability to multiple hazards, choices made around these and future priority areas will be important to securing the Bay Area’s overall resilience (see p. 13).
Plan Bay Area 2040’s strong current focus on the Bay Area’s housing affordability crisis highlights the particular vulnerability of people already living within the economic mar-gins of our costly region. Many of the region’s most underserved, disadvantaged communi-ties are also located in areas most vulnerable to multiple hazards. In addition, these communities may be the least able to prepare themselves for, or recover from, disasters, especially if they have to be evacuated or relocated for any length of time. Both affordabili-ty and safety in regional housing options, not to mention access to transportation alterna-tives for travel between home and work, are critical components of resilience.
Plan Bay Area 2040’s “Action Plan” highlights not only important ongoing targets for housing and economic development, but also the role of the regional agencies and local partners in fostering a more resilient Bay Area. The Plan recommends the following six areas of activity to strengthen regional resilience (see also Steps to an integrated Regional Resilience Plan p. 24):
What is Plan Bay Area?
Plan Bay Area is a long-range blueprint to guide transportation investments and land-use decisions through 2040, while meeting the requirements of California’s 2008 Senate Bill 375. This landmark legislation calls on each of the state’s 18 metropolitan areas to develop a Sustainable Communities Strategy to accommodate future population growth and reduce greenhouse gas emissions from cars and light trucks. State law gives joint responsibility for Plan Bay Area to the Association of Bay Area Governments (ABAG) and to the Metro-politan Transportation Commission (MTC). These two agencies (whose staff are now consolidated) work with the Bay Area Air Quality Management District (BAAQMD) and the Bay Conservation and Development Commission (BCDC). They also partner with local communities, agencies and a wide range of stakeholders to ensure broad public input into Plan Bay Area’s preparation. Plan Bay Area is a work in progress, with updates every four years to reflect new priorities. The first regional housing and transportation plan was adopted in 2013; the second in 2017: Plan Bay Area 2040.

P A R T 1 : S T E P S T O R E S I L I E N C E 7
1. Develop a regional governance strategy for climate adaptation projects: Develop an institution-al strategy for managing, coordi-nating, and implementing regional and local projects related to climate change adaptation.
2. Provide stronger policy leader-ship on resilient housing and infrastructure: Expand guidance on resilient housing policies for earthquake, flooding, and fire, working in coordination with state and federal agencies and focusing on communities with high social vulnerability and exposure to natural hazards. Strengthen infrastructure lifelines to ensure that utilities can provide services under a variety of conditions and future scenarios.
3. Create new funding sources for adaptation and resilience: Pursue new funding opportunities, including innovative financing, for retrofits and buildings, retrofits of existing infrastructure, and infrastructure solutions to protect against flooding, earthquakes and exposure to environmental health risks.
4. Establish and provide a resilience technical services team: Broadly share best practices and grant opportunities for climate adaptation and natural hazard mitigation. Continue to assess vulnerabilities and identify workable solutions through public and private avenues. Integrate resilience into Priority Development Area (PDA) planning.
5. Expand the region’s network of natural infrastructure: Coordinate regional pro-grams to preserve and expand natural features that reduce flood risk, strengthen biodiversity, enhance air quality, and improve access to urban and rural public space. Leverage existing initiatives — including Priority Conservation Areas (PCAs), the Resilient by Design Challenge, the San Francisco Estuary Partnership’s Estuary Blueprint, and the Bay Restoration Authority — and partner with special districts and cities.
6. Establish the Regional Advance Mitigation Program (RAMP): Advance mitigation for infrastructure projects to strengthen regional biological conservation priorities. Work to secure off-site compensatory mitigation lands for multiple infrastructure projects in advance of environmental reviews to improve both project delivery and conservation outcomes.
Flooding in the wet winter of 2016–2017 led to the evacuation of this Rock Springs neighborhood in San Jose. Photo courtesy Santa Clara Valley Water District.

8 R A I S I N G R E G I O N A L R E S I L I E N C E
The six actions listed above reflect coordinated work by regional partners through the Bay Area Regional Collaborative (BARC) to establish a clear framework for tackling resilience planning at the local and regional scales, and to place this within the context of Plan Bay Area 2040, as well as in future versions of the RTP/SCS.
Plan Bay Area 2040 provides details on how this might be accomplished in its action plan, and carries resilience analysis into the Plan’s Environmental Impact Report, which examines the relationship of the Plan’s land use footprint and transportation improvements to sea level rise inundation zones, liquefaction zones, and other constraints.
While these efforts represent significant progress, there is more to do to fully embrace the concept and necessity of regional resilience. This Raising the Bar report explores what addressing this broader challenge may involve, and what we know already that can help. It delves more deeply into how, where, and why communities, assets, and infrastructure are vulnerable to flooding, sea level rise and earthquakes, and what we are doing to expand upon this body of information, and most importantly, do something about it.
One approach to integrating resiliency more fully into regional planning is to inform the state-mandated RTP/SCS through its performance targets, growth scenarios, regional transportation plan, environmental impact report, equity analysis, and opportuni-ties for public comment. Another approach is to engage regional stakeholders in a broader dialogue to develop a more integrated Regional Resilience Plan. Both these approaches should enable the region to not only become more proactive about managing flood-ing and sea level rise, but also to be as robust in planning for climate adaptation as we now are for mitigation.
This report underscores the priority BARC places on increasing our capacity to respond to flooding and sea level rise so that it is as developed as our capacity to address fire and earthquake hazards. Only through truly integrated multi-hazard, multi-benefit regional planning can the Bay Area achieve the level of resilience necessary to continue to thrive in the future.
BACKGROUND
Plan Bay Area 2040 Action Plan http://2040.planbayarea.org/action-plan Plan Bay Area all reports http://2040.planbayarea.org/reports
FINAL
Adopted
July 26, 2017
METROPOLITAN
TRANSPORTATION
COMMISSION
ASSOCIATION OF
BAY AREA
GOVERNMENTS

P A R T 1 : S T E P S T O R E S I L I E N C E 9
A Metropolitan Region at Risk The Bay Area, as a diverse and thriving metropolitan region, is incredibly resilient in some ways and vulnerable in others. These vulnerabilities include economic and societal issues such as inequities related to race and income, high housing and transportation costs, and aging infrastructure. They also include current and future hazards such as flooding, sea level rise, earthquakes, changes in rainfall patterns, shifting habitats and vegetation, higher heat, and more intense storms and wildfires. The focus of this Raising the Bar report is flooding and sea level rise, the current and future hazards that are likely to have significant and widespread consequences on the region’s existing and planned infrastruc-ture and communities. Of particular concern are locations along the shoreline or on Bay fill, where the risk and impacts of both current and future flooding may be exacerbated by earthquake-induced ground liquefaction and long term subsidence of loose soils (see key terms p.16).
Past evaluations in the region have demonstrated that there is value in assessing and planning for flood and seismic risks together. They often require the same partners and information and the solutions are better designed with an understanding of both hazards. For example, elevating structures without considering seismic risk can protect us from flooding but increase our risk from earthquake events. Designing buildings and infrastruc-ture in ways that address both hazards can improve resilience.
This section provides a brief overview of the data and information currently available regarding the region’s vulnerability to flooding and rising sea levels. Details can be found in the “Background” links throughout this report.
Key assets such as ATT ball park lie in the path of rising sea levels along San Francisco’s bayshore. Photo [email protected]

1 0 R A I S I N G R E G I O N A L R E S I L I E N C E
Sea Level Rise and Priority Development Areas

P A R T 1 : S T E P S T O R E S I L I E N C E 1 1
Flooding and Sea Level Rise
The Bay Area faces a variety of flooding hazards. Winter storms, like the storms experienced over the winters of 2014 and 2016/2017, bring extreme high tides and heavy precipitation in short periods of time, flooding not only low-lying areas along the Bay shoreline, but also the lower portions of urbanized watersheds. In these areas, creeks overflow banks and drainage systems back up. In terms of coastal flooding, more than 8,000 acres of devel-oped land along the Bay edge is at risk from today’s 100-year coastal storm (BCDC).
Sea level rise will exacerbate current flooding problems. The National Research Council’s 2012 projections for San Francisco Bay suggest that by 2050, the Bay is likely to be 12 inches higher, or even as much as 24 inches higher. Beyond 2050, the rate of sea level rise is predicted to accelerate with current Bay levels increasing by 36–66 inches. The Working Group of the California Ocean Protection Council (OPC) Science Advisory Team pro-duced an updated synthesis of the state of the science on sea level rise in 2017. The accompa-nying policy guidance docu-ment to this sea level rise
science update is scheduled for adoption in January 2018. New scientific evidence identify-ing atmospheric warming as the dominant driver of ice loss in the West Antarctic Ice Sheet suggests that the magnitude and rate of sea level rise has grown, with particular conse-quences for coastal California due to global circulation patterns (DeConto & Pollard 2016, OPC 2017). Rising sea levels mean that areas at risk of flooding now are likely to flood more frequently, and with more intensity, in the coming decades; and that areas that don’t flood now will begin to in the future.
One reason the region is so vulnerable is that early settlers found the shoreline both a desirable and relatively easy and flat place to build. In many areas, they placed fill in the shallows, on top of already loose Bay mud, to expand land surfaces out from the shoreline . Most of these areas are vulnerable to liquefaction during a seismic event and remain at very low elevation with little or no flood protection for the urban and industrial water-fronts that grew up on top of them (see maps, pp. 10 & 14). USGS estimates there is a 72 percent probability of at least one earthquake of magnitude 6.7 or greater striking some-where in the San Francisco Bay region before 2043, resulting in extreme ground shaking and liquefaction throughout the region.
Flooding in San Jose in early 2017. Photo courtesy Santa Clara Valley Water District.

1 2 R A I S I N G R E G I O N A L R E S I L I E N C E
fpo

P A R T 1 : S T E P S T O R E S I L I E N C E 1 3
Today, critical assets concentrated along the Bay shoreline include residential communi-ties, job centers, airports, seaports, parks, natural areas and transportation infrastructure. Indeed, a large proportion of the region’s highest density development and transportation network is located where liquefaction and current and future flood risk is highest: at the edge of San Francisco Bay.
Priority Areas for Development & Conservation
Regional agencies are working with local jurisdictions, transit agencies, and other critical stakeholders across the Bay Area to arrive at a more comprehensive understanding of vulnerabilities, opportunities for adaptation, and steps to resilience as described in the next section “Accelerating Resilience: Regional Agency Actions to Date.” An important outcome of these past efforts for RTS/SCS regional planning process in the years ahead is a prelimi-nary review of the vulnerability of current Priority Development Areas (PDAs) and Priority Conservation Areas (PCAs) by BCDC and ABAG (see “Background” links). Their analysis suggests that 38–71 percent of PDAs may not be on dry ground in the long term, and 97 percent of PDAs are on unstable ground.
Early BCDC/ABAG analysis suggested that 180 of the 188 PDAs described in the current Plan Bay Area are at least partially vulnerable to significant ground shaking or liquefaction; likewise, 134 PDAs are also vulnerable to existing or projected flooding due to rising sea levels. More recent BCDC ART Bay Area analysis concludes that 49 of 188 PDAs, and 53 of the
165 PCAs, are potentially vulnerable to permanent flooding from 66 inches of sea level rise projected for later this century (see map p. 10). These 49 PDAs cover about 46,000 acres and 53 PCAs about 784,000 acres. Analysis also indicates a significant risk to the roads, pipelines, bridge approaches, tunnels, transit lines, and other infrastructure along our shores and in some priority development areas.
Local and regional efforts to create and expand PCAs along our shorelines, if managed strategically and more comprehensively, could ensure a foundation of open spaces and wetlands that could more effectively buffer and protect developed areas from flooding and sea level rise, and other potential hazards (Baylands Goals Science Update 2015).
As the region accelerates efforts to make our commu-nities, infrastructure and metropolitan assets stronger and more resilient to changing climate conditions, it’s critical to expand analysis of where and how PDAs and PCAs are vulnerable. Efforts already underway, and
Plan Bay Area Definitions
PDAs are locations within existing Bay Area communities that present infill development opportunities, and are easily accessible to transit, jobs, shop-ping, and services. Local jurisdictions identify these locations voluntarily and they are adopted by ABAG. PDAs are structured to encompass mixed-use development with a housing emphasis.
PCAs are regionally significant open spaces and working lands in the Bay Area for which there exists a broad consensus for long- term protection, and for which public funds may be invested to promote their protection. Local jurisdictions and open space agencies identify these locations voluntarily, and they are adopted.

1 4 R A I S I N G R E G I O N A L R E S I L I E N C E
Liquefaction Risk to to Priority Development Areas

P A R T 1 : S T E P S T O R E S I L I E N C E 1 5
identified in the Plan Bay Area 2040 Action Plan, begin to address priorities and concerns.
Part 2 of this draft Raising the Bar report describes more specific strategies for addressing some of the region’s major vulnerabili-ties and details challenges that have arisen in the resil-ience-building process at four locations through case studies. These case studies introduce a broad array of ideas for support-ing resilience at the local and regional scales, and weaving it into practice. The following pages of Part 1, meanwhile, de-scribe what regional agencies have been doing, and plan to do, to build regional resilience.
BACKGROUNDABAG Priority Development Areas abag.ca.gov/priority/development/
ABAG Priority Conservation Areas abag.ca.gov/priority/conservation/
BCDC Sea Level Rise Adaptation Policy Recommendations 2016 www.adaptingtorisingtides.org/commission-ap-
proves-sea-level-rise-recommendations
National Research Council, Sea Level Rise for Coasts of California, Oregon and Washington, 2012 www.nap.edu/catalog/13389/sea-level-rise-for-
the-coasts-of-california-oregon-and-washington
Ocean Science Trust, Rising Seas in California 2017www.oceansciencetrust.org/wp-content/
uploads/2017/04/OST-Sea-Level-Rising-Report-Fi-
nal_Amended.pdf
Our Coast Our Future toolkit.climate.gov/tool/our-coast-our-future
Plan Bay Area 2040 2040.planbayarea.org/reports
Update to Sea Level Rise Policy Guidance Draft www.opc.ca.gov/climate-change/updating-
californias-sea-level-rise-guidance
Porous pavers in Los Gatos soften hardscapes so runoff from rain and storms can percolate into the ground, rather than pooling in surrounding residential areas. Photo courtesy Bay Area Stormwater Management Agencies.

1 6 R A I S I N G R E G I O N A L R E S I L I E N C E
Key Flood and Quake
Hazard Terms
What is Bay Fill? Historically, fill placed in the Bay to create land often consisted of whatever dirt, refuse, wood, or construction materials were available at the time. Material was placed on top of Bay mud. The creation of BCDC in the 1960s halted rampant filling of the Bay.
What is Liquefaction?Soil liquefaction describes a phenomenon whereby loose, saturated, or partially saturated soil substantially loses strength and stiffness in response to earthquake shaking, causing the ground to behave like a liquid. The shoreline of the Bay, particularly in areas that were filled, has some of the greatest liquefaction risk in the region, along with old river and streambeds. Liquefaction only occurs when susceptible soils are shaken long and hard enough by an earthquake; even then, not all potentially liquefiable soils liquefy when shaken.
How strong is a big quake? Most people understand that an earthquake over 6.0 on the “moment magnitude” scale is pretty strong. The 1989 Loma Prieta quake that snapped the upper deck of the Bay Bridge was 6.9; San Francisco’s infamous 1906 quake was an estimated 7.8. Moment magnitude mea-sures the total release of energy in an earthquake but shaking severity will vary around the region.
What is a 100-Year Flood or a 100-Year Storm? Flood risk is usually expressed in terms of the annual risk of flooding, or the average chance a water level will recur within 100 or 500 years. According to the United States Geological Survey, the term “100-year flood” is used to simplify the definition of a flood that statistically has a one-percent chance of occurring in any given year. Likewise, the term “100-year storm” is used to define a rainfall event that statistically has this same one-percent chance of occurring. Global warming and extreme weather events now make such kinds of predictions based on past averages more uncertain. Storms are
becoming more extreme and less predictable, in terms of the percent chance of occurrence. For example, August 2017’s Hurricane Harvey engulfed Houston in the third “100-year storm” in 50 years (Economist 9/2017). Planners are now using a combination of Federal Emergency Management Agency flood risk maps (including FEMA identified Special Flood Hazard Areas), local data, and downscaled sea level rise planning tools to make flood protection planning decisions (BCDC).
Types of FloodingFlooding occurs when streams, rivers, lakes, reservoirs, or coastal water bodies are abnormally high and overflow into adjacent low-lying areas. In the past, coastal flooding has been generally associated with Pacific Ocean storms from November through February when high tides coincide with strong winds both on the outer coast and within the Bay. Riverine flooding can occur if there is excessive rainfall especially in conjunc-tion with high tides and strong winds. Localized, or nuisance, flooding can occur in areas that typically do not flood when it rains hard, especially if ground water levels are high or storm-water storage or conveyance facilities are inadequate. Localized flooding tends to occur in flat, urbanized areas that are highly imperme-
able and can result in inunda-tion of basements, low lying roads, and parking lots from street drainage. Rising sea levels will exacerbate all these types of flooding.
Green and Blue InfrastructureGrey infrastructure built out of hard impermeable concrete or asphalt is the norm in many urban zones. A resilient or sustainable approach seeks to soften and green these surfaces with plants and more absorbent
surfaces, and to work with natural watershed processes to achieve both flood control and habitat protection goals. In shoreline areas, the newer term blue infrastruc-ture refers to creating natural infrastructure, habitats, and flood buffers within the water or tidal reach. These projects may include engineered marshes, oyster reefs or carbon- sequestering wetlands that reduce subsid-ence. A new term, living levee, refers to levees that may include habitats and vegetation, and that are designed to adapt or evolve with changing conditions.
Oakland Airport runways are built on bay fill. Photo: MTC archives

1 7P A R T 1 : S T E P S T O R E S i L i E N C E
Accelerating Resilience: Regional Agency Progress to Date
Over the last five years, Bay Area agencies with a regional scope, specifically BCDC, MTC, ABAG and the State Coastal Conservancy, have come together to coordinate assessments of the region’s vulnerability to increased flooding and sea level rise. The agencies have made major progress in understanding emerging risks to our transportation network, housing, communities, natural systems, and critical infrastructure. They have also consid-ered how these risks may be exacerbated by earthquakes and liquefaction, and begun developing new frameworks and tools for multi-hazard planning. Additionally, the Bay Area Air Quality Management District (BAAQMD) has released a blueprint for clean air and climate protection in the Bay Area.
In the context of all this progress, regional agencies are now recognizing more than ever that effective, pro-active, multi-hazard planning to address climate change requires a deeper level of integration in planning and governance (with a small “g”) across all agen-cies and local jurisdictions. At the center of this effort, in terms of pressing for urgent planning and action on climate change, is the Bay Area Regional Collaborative.
BARC is a consortium of MTC, ABAG, BCDC and BAAQMD. BARC works with the regional agencies to advance and coordinate their actions on both climate change mitigation and resilience. BARC has also begun work to centralize the best available data for planning and investment decision-making and to coordinate actions that increase resilience at both local and regional scales. BARC’s most recent efforts have focused on forging a regional resilience plan based on the results of the following programs of its member agencies.
BCDC’s Adapting to Rising Tides (ART) Program is building local and regional capacity to plan for and address current and future flood risk as seas continue to rise. BCDC has led a number of adaptation planning processes at local, regional, and sector scales and has provided support for many more. Through the ART Program, BCDC provides data, tools,
Rescue teams in flooded South Bay neighborhoods in early 2017. Photo courtesy Santa Clara Valley Water District.

1 8 R A i S i N G R E G i O N A L R E S i L i E N C E
findings and information regarding current and future flood risk in the region. It also provides recommendations for increasing the resilience of a broad range of assets, includ-ing transportation, housing, energy, wastewater, and natural areas, and for addressing issues like equity, governance, and planning at different scales.
Through its Resilience Program as well as collaboration with BCDC on the Stronger Hous-ing, Safer Communities project, ABAG has led the region in assessing and improving seismic safety in the Bay Area for over 30 years. ABAG has supported local jurisdictions with changes to building codes, policies, planning, and community education in order to increase the strength of our housing stock to seismic risks, and more recently with explor-ing where seismic and flood risks intersect in multi-hazard planning. ABAG has also provided support to local jurisdictions in the development of Local Hazard Mitigation Plans. This program is now part of the staff consolidation of MTC/ABAG in July 2017.
MTC has a variety of programs that contribute to regional resilience, including partnering with BCDC’s Adapting to Rising Tides Program on multiple projects to assess and develop sea level rise adaptation strategies for the transportation network. This partnership includes sea level rise mapping and shoreline analysis for all nine Bay counties — these integrated maps will support consistent sea level rise assessment and adaptation in the region. MTC is also leading the Climate Initiatives Program to reduce emissions from the region’s transpor-tation sector through clean vehicles, car sharing, smart driving, and commuter benefits programs (among many other strategies) while simultaneously expanding the transporta-tion network to meet the needs of our growing and diverse population.
While BCDC, MTC and ABAG are providing guidance and support to the region in terms of adapting to flood and seismic risk, BAAQMD is leading the Bay Area in terms of climate change mitigation and cleaning the air. BAAQMD’s 2017 Clean Air Plan identifies rules, programs, and strategies the Air District can apply toward its goal of reducing greenhouse gas emissions to 80 percent below 1990 levels by 2050.
Two other important regional partners in these efforts are the California State Coastal Conservancy and the San Francisco Estuary Partnership. Both in collaboration, and sepa-rately, these two public stewards of local natural landscapes, waters, and urban ecosystems have helped sustain the natural resilience of the Bay Area.
The Conservancy undertakes and supports diverse environmental enhancement, conserva-tion and public access projects in the nine-county Bay Area. The Conservancy’s Bay Program has also headed up many of the region’s key natural areas conservation planning efforts, including the Baylands Ecosystem Habitat Goals and Science Update, the Subtidal Habitat Goals, and the Conservation Lands Network. The Conservancy’s Climate Ready program has provided a focus on green infrastructure and adaptation, helping implement adaptation planning and projects that take action to address climate challenges.
The Estuary Partnership operates under the USEPA’s National Estuary Program and is housed within ABAG. Since the early 1990s, the Partnership has brought diverse state, federal, and local agencies and special interests together around a series of regional plans to protect the health of the Bay and San Francisco Estuary. Several actions in the Partner-

1 9P A R T 1 : S T E P S T O R E S i L i E N C E
ship’s latest plan, the 2016 Estuary Blueprint, commit diverse partners to addressing regional challenges to the development of more natural infrastructure and multi-benefit climate adapta-tion projects.
In addition, various other regional agencies and collaborations are working to accelerate resilience. In terms of water supply, water quality, and flood risk, these include the San Francisco Bay Regional Water Quality Control Board’s work to encourage green infrastructure and integrated water and land use manage-ment, preventing flooding and pollution of Bay Area waterways; the Bay Area Regional Reliabili-ty effort of the largest water districts to enhance the resilience of our water supply and infra-structure, and prepare for droughts and climate change; and the South Bay Shoreline Project’s multi-agency collaboration around flood control.
In terms of communities, new guiding principles and recommendations for advancing equitable climate change adaptation in California were recently published by the Climate Justice Working Group (with support from the Greenlining Institute and Resources Legacy Fund). Likewise the Environmental Justice Coalition for Water is engaging Bay Area communities in green infrastructure projects via Integrated Regional Water Management Program Proposition 1 grants.
There are dozens of other efforts on many fronts to promote resiliency and climate justice; those mentioned above are just a sampling of some of the more recent collaborative efforts with a regional scope.
Current Collaborative Projects
Over the coming years the following efforts will be scaled up and further coordinated to make a significant contribution to the next RTP/SCS and other efforts to develop an integrated Regional Resilience Plan. These projects and their relationship to the six actions identified in the 2040 Plan Bay Area Action Plan are outlined below and in the table that follows.
Adapting to Rising Tides Bay Area, BCDC (ART Bay Area)
MTC partnered with BCDC’s ART program and BARC to write a proposal for a Caltrans Sustainable Transportation Planning Grant. The partners were awarded $800,000 to develop a regional adaptation planning process aimed at increasing the resilience of the region’s transportation and community assets. The Bay Area Toll Authority is contributing $400,000 in matching funds, resulting in a $1.2 million grant for a project now called A
East Palo Alto residents protest increasing divide in opportunities for jobs and affordable housing in Silicon Valley. Photo by Tameeka Bennett.

2 0 R A I S I N G R E G I O N A L R E S I L I E N C E
Resilient Transportation System for Safe and Sustainable Communities, which will be conducted between spring 2017 and winter 2019. The project team is comprised of staff from Caltrans, MTC, BCDC and BARC.
A primary objective of this new initiative is for the project team to make significant head-way in completing a comprehensive region-wide sea level rise vulnerability assessment that informs the development of a regularly updated regional adaptation plan. As envi-sioned, one outcome will be a more formalized methodology for determining and imple-menting appropriate strategies for climate adaptation at the local and regional level. This will include establishing a clear and transparent method for developing an ongoing and updated list of priority projects and investments as part of regional sea level rise adapta-tion planning. These projects would be identified based on their efficacy, value, and contribution to local and regional adaptive capacity. Assets included in the ART Bay Area study include: interstates and highways, passenger and cargo rail, BART, Bay Trail, and transit services; Priority Development Areas and Priority Conservation Areas; and commu-nities with characteristics that may make them more vulnerable to flooding. ART Bay Area will help us accelerate progress in Actions 1, 2 and 3 of the Plan Bay Area 2040 Action Plan.
Resilient by Design | Bay Area Challenge
This year-long design challenge partners residents and local leaders with experts from the design community (architects, engineers, designers, environmental scientists, and planners) in an effort to develop innovative solutions that build the resilience of the region’s shoreline communities to threats like sea level rise, severe storms, flooding, and earthquakes, as well as to challenges such as lack of affordable housing and social inequities. This challenge will create multi-benefit plans for ten implementable projects with deep community support. Every county in the Bay Area will benefit, with the potential for multi-jurisdictional projects to emerge. Resilient by Design is modeled after the successful Rebuild by Design, which followed Hurricane Sandy. This time, the Bay Area isn’t waiting for disaster to hit. Through the development of solutions, the Challenge will illuminate the governance and financing challenges localities and the region face in becoming more resilient and the types of innova-tions and multi-disciplinary approaches necessary to get there. To that end, the Challenge

P A R T 1 : S T E P S T O R E S I L I E N C E 2 1
will help meet the goals outlined in actions 1,2, 3 and 5 of the Plan Bay Area 2040 Action Plan. Staff from BARC, ABAG, MTC and SFEP are actively participating in Bay Area Challenge to help ensure its connection to regional efforts.
Regional Advanced Mitigation Planning (RAMP)
RAMP aims to integrate conservation into infrastructure agency plans and projects at the regional scale. To accomplish this, RAMP will use a framework that assesses the potential impacts of transportation projects on the Bay Area’s natural environment. This framework increases the effectiveness of infrastructure design and mitigation projects, and helps direct mitigation dollars to the protection of important ecological functions that are at risk. MTC/ABAG, Congestion Management Agencies, regulatory agencies, and the Coastal Conservancy are working together to implement RAMP in the Bay Area. This will help align Bay Area conservation and transportation goals with infrastructure planning and provide a model for other regions in California and beyond. Establishing RAMP is Action 6 in the Plan Bay Area 2040 Action Plan.
San Francisco Bay Restoration Authority
The San Francisco Bay Restoration Authority is charged with raising and allocating local resources for the restoration, enhancement, protection, and enjoyment of wetlands and wildlife habitat in San Francisco Bay and along its shoreline, and associated flood manage-ment and public access infrastructure. The Restoration Authority was created by the California Legislature in 2008 to develop new sources of local funding. Its enabling legisla-tion gives the Authority the unique capacity to raise funds from local sources throughout the Bay Area and the oversight capacity to ensure transparency and prevent waste. Its purpose is restoration, not regulation. Through Measure AA, regional voters endorsed a parcel tax to fund the authority in 2016. The authority is an important foundation for future innovations in funding for nature-based infrastructure and other climate adaptation projects that would make Bay Area shorelines more resilient. As such this project supports resilience actions 3 and 5 in Plan Bay Area 2040.
Suisun Marsh, one of the Bay Area’s richest and largest wetland and estuarine habitats. Photo Amber Manfree.

2 2 R A I S I N G R E G I O N A L R E S I L I E N C E
Design teams tour shoreline sites that may drown under rising sea levels on a smoky day during the October 2017 North Bay wildfires. As part of the year-long Resilient by Design | Bay Area Challenge, these teams of landscape architects, engineers, designers and other experts are working alongside community members and local government on exciting new approaches to shoreline resilience. Photo by Karl Nielson.

P A R T 1 : S T E P S T O R E S I L I E N C E 2 3
Steps to an Integrated Regional Resilience PlanBuilding resilience is not a standalone tactic, but rather a coordinated strategy that needs to be integrated with current and future land use policies, transportation networks, and environmental planning, among other policies. The accompanying table builds from the action items outlined in Plan Bay Area 2040 and highlights the work the BARC member agencies and partners are conducting to accomplish four critical goals over the coming years:
1. Accelerate local and regional progress in resilience planning and implementation.
2. Clearly identify which agency or agencies are responsible for conducting resil-ience planning and ensuring planning processes are integrated.
3. Determine if further authority and resources are necessary for effective integration of regional planning initiatives.
4. Clearly identify which agency or agencies regulate actions at the local and region-al scales to support regional resilience planning, and determine an appropriate approach to increasing regulatory authority as needed.
Of near term importance is the need to establish a clear Bay Area-wide plan through which resilience can be built at local, sub-regional and regional levels. This plan should be integrated with established processes for reducing greenhouse gases, improving air quality, planning for land use and transportation, and mitigating hazards. The BARC Governing Board and its member agency leadership should outline a process and timeline through which the decision-making structure and roles and responsibilities for conducting regional resilience planning and implementation can be decided upon. The coordination and commitments required to clarify how the Bay Area can most effectively integrate governance (with a small “g”) across the region to move forward climate-related actions should be a high priority for all member agencies. Over the next year, some key questions that need to be answered include:
What is a regional resilience plan? How often does it need to be updated?
Which agency or agencies are responsible for developing and implementing such a regularly updated regional resilience plan?
How will this regional resilience plan be integrated with existing regional planning processes?
To what extent are additional authorities and/or resources needed for the agencies to accomplish their tasks?
Rowing workout on the Bay near Redwood City. Photo by Francis Parchaso, USGS

2 4 R A I S I N G R E G I O N A L R E S I L I E N C E
ACTION 1 Develop a regional governance strategy for climate adaptation projects.Description Develop an institutional strategy for managing, coordinating, and implementing
regional and local projects related to sea level rise.
BARC Partners BCDC, MTC, ABAG, BAAQMD, BARC, SCC, Caltrans, local jurisdictions
Timeline 2–4 years
Current Projects ART Bay Area, RTS/SCS
Desired Outcomes • Vision for regional resilience principles and objectives developed in partnership with federal, state, regional, and local public and non-governmental organizations and entities.
• Clarity on who oversees, and is accountable for, adaptation and resilience planning and implementation. Roles and responsibilities assigned.
• Action plan for identifying and prioritizing adaptation and resilience strategies and projects in relation to climate mitigation strategies and projects.
• Enhanced ability to mobilize resources for implementation.
• Coordinated permitting to streamline process and approvals by relevant agencies so that projects can move faster to meet climate change demands.
ACTION 2 Provide stronger policy leadership on resilient housing and infrastructure.Description Expand guidance on resilient housing policies for earthquake, flooding, and fire,
working in coordination with state and federal agencies and focusing on communities with high social vulnerability and exposure to natural hazards. Strengthen infrastruc-ture lifelines to ensure that utilities can provide services under a variety of conditions and future scenarios.
BARC Partners MTC, ABAG, BCDC, BAAQMD, local jurisdictions, non-profit organizations
Timeline 1–4 years
Current Projects Regional Housing Mitigation Policy Advancement, Safe, Smart Home, RTP/SCS, ART Bay Area, Resilient by Design | Bay Area Challenge
Desired Outcomes • Integrated regional approach to making homes stronger, healthier, and more affordable.
• Multi-hazard, multi-benefit synergies and efficiencies in projects and programs.
• Resources and tools available to jurisdictions to strengthen housing stock.
• Reduced housing loss due to natural disasters.
• Established priorities for protecting key infrastructure, including vulnerable trans-portation infrastructure.
• Interdisciplinary design of buildings, infrastructure, and the urban environment that provides tangible approaches to improving resiliency at a variety of scales.
• Policy development addressing impacts of temporary and permanent displacement from affordable housing.
STEPS TO AN INTEGRATED REGIONAL RESILIENCE PLAN

P A R T 1 : S T E P S T O R E S I L I E N C E 2 5
ACTION 3 Create new funding sources for adaptation and resilience.Description Pursue new funding opportunities, including innovative financing, for retrofits of build-
ings, retrofits of existing infrastructure, and adaptation solutions to protect against flooding, earthquakes, and exposure to environmental health risks. Reorient and repur-pose existing funding to optimize achievement of multi-benefit projects.
BARC Partners MTC, ABAG, BCDC, BAAQMD, SFEP, SCC, local jurisdictions
Timeline 1–4 years
Current Projects RTP/SCS, BCDC Financing the Future Working Group; Resilient by Design | Bay Area Challenge
Desired Outcomes • Sufficient budgets developed for adaptation and resilience projects.
• Optimization of new and existing funding mechanisms to achieve multiple benefits and leverage resources effectively.
• Improved project development through better understanding of financing mecha-nisms suitable to certain projects.
• Expanded local and regional capacity to implement adaptation and resilience projects.
ACTION 4 Establish and provide a resilience technical services team.Description Develop a system and technical assistance program by which best practices, data and
information, mapping, staff and finance resources, public participation processes, and policy actions are shared broadly across jurisdictions, non-profit organizations, academic institutions and across the regional agencies focused on advancing and accelerating progress in meeting climate mitigation, climate adaptation and hazard mitigation goals.
BARC Partners MTC, ABAG, SFEP, BAAQMD, BCDC, BARC, SCC, SFEI, local jurisdictions
Timeline 1–4 years
Current Projects Adapting to Rising Tides Portfolio and Help Desk, New BARC website and technical assistance pilot projects, Regional Resilience Indicators
Desired Outcomes • Regional network of local leaders, planners, practitioners and implementers advances state of practice in adaptation and resilience project implementation.
• Development of local resilience indicators across the region monitors needs and identifies gaps to focus resources where they are most needed.
• Regional technical framework for adaptation planning and project identification supports multi-scale, multi-hazard, multi-benefit outcomes at the local and regional level.
• Regional body of shared science and goals emerges that streamlines decision making process and prioritizes how resources are deployed.

2 6 R A I S I N G R E G I O N A L R E S I L I E N C E
ACTION 5 Expand the region’s network of natural infrastructure. Description Coordinate regional programs to preserve and expand natural features that reduce flood
risk, strengthen biodiversity, enhance air quality, and improve access to urban and rural public space. Leverage existing initiatives—including Priority Conservation Areas (PCAs), the San Francisco Bay Area Conservancy, the Resilient by Design | Bay Area Challenge, the San Francisco Estuary Partnership’s Estuary Blueprint, and San Francisco Bay Restoration Authority — and partner with special districts and cities.
BARC Partners MTC, ABAG, SFEP, BCDC, SCC, local jurisdictions
Timeline 1–4 Years
Current Projects PCA funding program, San Francisco Bay Restoration Authority/Measure AA Grant Pro-gram, SCC Grant Programs, Regional Advanced Mitigation Program (RAMP), Resilient by Design | Bay Area Challenge, ART Bay Area Project (Natural Capital Project Collaboration)
Desired Outcomes • Increased community access and connection to outdoor recreational opportunities, green space, the bay shoreline and natural areas.
• Implementation of natural infrastructure strategies to support flood protection, habitat conservation, water quality, urban ecosystems, and carbon sequestration.
• Increased resilience and ability to withstand hazards in the natural, built, and human environments.
• Streamlined regulatory approvals for experimental natural infrastructure that can help accelerate response to climate impacts.
ACTION 6 Establish the Regional Advance Mitigation Program (RAMP). Description Advance mitigation for transportation infrastructure projects to strengthen regional
biological conservation priorities. Work to secure off-site compensatory mitigation lands for multiple transportation infrastructure projects in advance of environmental reviews to improve both project delivery and conservation outcomes.
BARC Partners MTC, ABAG, SCC, RAMP Coalition, BCDC
Timeline 1–4 years
Current Projects RAMP Program Development (MTC/SCC); RAMP Pilots in Santa Clara and Alameda/Contra Costa Counties
Desired Outcomes • Progress toward aligning climate mitigation opportunities with conservation priorities.
• A more comprehensive approach to ensuring that ecological resources and functions are preserved and enhanced at the appropriate scale and locations.
• Reduced mitigation costs.
• Increased partnership and communication between regulatory, public works, and conservation interests around infrastructure upgrades.
STEPS TO AN INTEGRATED REGIONAL RESILIENCE PLAN - continued

P A R T 1 : S T E P S T O R E S I L I E N C E 2 7
Background Region Resilience Activities
ABAG Resilience Programresilience.abag.ca.gov/
BAAQMD Climate Protection Program and 2017 Clean Air Plan www.baaqmd.gov/plans-and-climate/climate-protection
Bay Area Regional Collaborative bayarearegionalcollaborative.org/
Bay Area Regional Reliability (8 water districts) www.bayareareliability.com/
Baylands Ecosystem Habitat Goals www.baylandgoals.org
BCDC Adapting to Rising Tides Program www.adaptingtorisingtides.org
BCDC Sea Level Rise Adaptation Policy Recommendations 2016 www.adaptingtorisingtides.org/commission-approves- sea- level-rise-recommendations/
MTC Climate Initiatives Program mtc.ca.gov/our-work/plans-projects/climate- change-clean-ve-hicles/climate-initiatives-program
MTC Climate Change + Clean Vehicles mtc.ca.gov/our-work/plans-projects/
climate-change-clean-vehicles
San Francisco Bay Area Conservancy scc.ca.gov/projects/san-francisco-bay
San Francisco Estuary Blueprint www.sfestuary.org/ccmp
South San Francisco Bay Shoreline Study www.southbayshoreline.org
State Coastal Conservancy Climate Ready Program scc.ca.gov/climate-change/climate-ready-program
State
Guidelines for Equitable Climate Adaptation coastalresilience.org/climate-justice-working-group-releas-
es-guiding-principles-and-recommendations-for-california
Current Collaborative Projects
ART Bay Area www.adaptingtorisingtides.org/project/art-bay-area
Bay Area Restoration Authority sfbayrestore.org
Resilient by Design www.resilientbayarea.org
Other Models
Southeast Florida Climate Compact and Regional Climate Action Planwww.southeastfloridaclimatecompact.org
Students from Kennedy High School, Richmond watch a massive ship head out to sea on the Richmond harborfont with other event attendees at the September 2017 kick off for the Resilient by Design | Bay Area Challenge. Students from this ITA/Y-Plan/UC Berkeley program will interact with design teams working on the challenge. Photo Ariel Rubissow Okamoto.

2 8 R A i S i N G R E G i O N A L R E S i L i E N C E
Current Planning, Regulatory and Legislative Context for Regional Resilience The Bay Area’s nine counties, 101 cities, numerous government agencies, and wide variety of special interest and non-profit organizations currently have an array tools at their disposal for integrating resilience into land use planning and project and program implementation.
Tools include general plans, specific plans, implementation and operations plans, building codes, capital improvement plans, grants, facilities standards, guidelines and other documents. Approaches for integrating hazard risk and resilience into planning, decision-making and implementation can be voluntary, required by law, or incentivized through grants or guidance.
At the federal level, climate action and guidance faltered in 2017 with President Trump’s withdrawal of the United States from the Paris Climate Accord, and his rescinding of President Obama’s 2013 Executive Order 13653 aimed at preparing the country for climate change impacts. As of fall 2017, federal policy, guidance, and support for climate change adaptation and mitigation is considered uncertain at best.
At the state level, a number of powerful legislative actions over the past decade have placed California strongly at the forefront of climate change mitigation and adaptation worldwide (see table). In terms of multi-hazard planning, California law also directs local jurisdictions, under a law called Safeguarding California Plan for Reducing Climate Risk and
Defining Resilience
■ The capacity of individuals, communities, and systems to survive, adapt and grow in the face of shocks. [Estuary Blueprint 2017]
■ The capacity of a system to absorb disturbances and still retain its basic functions and structure. [Walker & Salt, 2006 from Weins]
■ The capacity of a community to anticipate, plan for, and mitigate the risks — and seize the opportunities — associated with environmental and social change. Resilience has transfor-mative power as a concept. [Island Press Urban Resilience Project 2013]
■ The capacity of a system (whether a community or an economy) to maintain an intact core identity in the face of change (Movement Generation).
■ The ability to recover from setbacks, adapt well to change, and keep going in the face of adversity. [Harvard Business Review]
■ Urban Resilience is the capacity of individuals, communities, institutions, businesses, and systems within a city to survive, adapt, and grow no matter what kinds of chronic stresses and acute shocks they experience (100 Resilient Cities) www.100resilientcities.org/
■ The ability to reduce the magnitude and/or duration of disruptive events. The effective-ness of a resilient regional infrastructure depends upon the ability to anticipate, avoid, absorb, adapt to, rapidly recover from, work together, and learn from a potentially disrup-tive event. (NIAC Critical Infrastructure Resilience 2009, and A Framework for Establishing Critical Infrastructure Resilience Goals 2010)

P A R T 1 : S T E P S T O R E S I L I E N C E 2 9
California Senate Bill 379 (Jackson), to review and update as necessary the safety elements of general plans to include climate change risks and impacts.
Beyond these broader guidelines, several types of local plans are designed to focus more exclusively on hazards. These plans include Local Hazard Mitigation Plans (LHMP) and Climate Adaptation Plans. Traditionally, LHMPs have focused on past and current hazards, primarily seismic, wildfire, and current flooding risks, while Climate Adaptation Plans assess a jurisdiction’s risks from climate change to hazards such as rising sea levels or increased storm events (to date, most examples of the latter are more focused on communication and outreach than action; one of the strongest examples statewide comes from Chula Vista in Southern California). While these two kinds of assessments have traditionally been done separately, ABAG and BCDC have developed guidance for a single risk assessment process that combines hazard mitigation and climate adaptation. This makes the process of risk assessment more effective and efficient for jurisdictions and agencies, and more accessible to the public and stakeholders.
Federal & State Executive Orders
Targets for 2020 and 2050 (EO S-03–05)
Climate Adaptation (EO S-13–08)
Integrated approach to climate (EO B-30–15)
Preparing the United States for the Impacts of Climate Change (EO 13653) (Revoked 2017)
State Legislation Signed in 2015–2017
New greenhouse gas emissions targets (SB350)
Scoping plan extension to meet targets above (SB32)
Safeguarding California and related (AB1482)
Local governments and climate risk (SB379 )
OPR, ICARP and Clearinghouse (SB246)
Climate Change Infrastructure Planning (AB 2800)
Cap and Trade Extension (AB398)
Planning for Sea Level Rise Database (AB2516)
Environmental Justice Addressed in County & City General Plan (SB100)
Coastal Laws and Guidance
California Coastal Commission Sea Level Rise Policy Guidance
Ocean Protection Council Sea Guidance for California
California Fourth Climate Assessment (final ~ 2018)
Bay Conservancy and Development Commission Climate Change Policies
Bay Conservation and Development Commission’s Adapting to Rising Tides Program
Coastal Act General Plan Guidelines Implementation Chapter (2017 Update)
Adaptation Clearinghouse, Office of Planning and Research (in-progress)
Incentives and Grant Programs
Federal Highway Administration Vulnerability Adaptation Planning Grants
Coastal Conservancy Climate Ready Grants
Ocean Protection Council Grants
Federal Emergency Management Agency’s Hazard Mitigation Grant Program, Flood Mitigation Grants, and Pre-Disaster Mitigation Grants
Federal Emergency Management Agency’s Community Rating System
Climate Change & Resilience Planning Guidance, Incentives, Laws and Grants

3 0 R A I S I N G R E G I O N A L R E S I L I E N C E
One model of how risk assessment and adaptation planning can be woven into this fabric of government processes already exists in Alameda County. As a result of a four year collaboration between BCDC ART and local partners to address specific vulnerabilities, resilience strategies have being integrated into an update to the City of Hayward’s General Plan, revisions to the Hayward Area Shoreline Planning Agency’s Joint Powers Authority, City of Oakland specific plans and Local Hazard Mitigation Plan Update, implementation and operational changes at the East Bay Regional Park District, and new facilities standards and an adaptation strategy developed by Bay Area Rapid Transit (see case study p. 73).
As a region, the Bay Area is working towards establishing a functioning system by which activities at the local, regional, state and federal levels advance greater resiliency at a variety of scales.
Assembly Bill 398, the cap-and-trade extension recently signed by Governor Brown, designates “climate adaptation and resiliency” as a priority for expenditure of cap-and-trade revenue. The Climate Justice Working Group is recommending that California should identify and invest at least $1 billion by 2020 and $10 billion by 2025 to advance climate resilience for its most vulnerable communities. Photo of king tide at Tesoro refinery in Contra Costa County by Ariel Rubissow Okamoto.
P A R T 1 : S T E P S T O R E S I L I E N C E 3 1
Reaching Resilience Requires Coordinated ActionAs stated before, the challenges faced by a Bay Area so vulnerable to flooding, rising sea levels, and earthquakes are pervasive. Achieving meaningful resilience will require better integration between local and regional transportation, land use, environmental, and climate change adaptation and mitigation plans in the future. It will also require an approach that extends beyond the risks to specific properties, assets, and jurisdictions and creates a comprehensive, integrated Regional Resilience Plan for the Bay Area.
Local jurisdictions cannot be expected to, nor are they able to, shoulder the burden of addressing significant regional-scale vulnerabilities on their own; nor can they be expected to make strategic decisions about shoreline interventions without taking into account potential impacts to surrounding jurisdic-tions and neighbors.
The six actions described in Plan Bay Area 2040 reflect the region’s commitment to building resilience, and the action plan and EIR provide some detail on how this might be accomplished and the associated environmental concerns. While these efforts repre-sent significant progress, there is more to do to fully embrace regional resilience.
Many of the public comments on Plan Bay Area 2040 suggested that regional resilience planning — whether via the next RTP/SCS or other regional governance vehicles — must go beyond transporta-tion housing, and air quality. Additional critical components of resilience may include, but are not limited to, expanded consideration of community concerns (such as equity, cohesion, and environmen-tal health) as well as natural resource management concerns (such as water supply, water quality, and ecosystem services).
Resilience planning offers a timely opportunity to weave these new components and considerations into regional planning for hazard and drought mitigation, response and recovery, as well as into the
“This summer has brought an unprecedented
number of catastrophic climate events upon many
vulnerable people and places in the United States
and around the world. From the devastation
wrought by Hurricane Harvey and Hurricane Irma to
the extreme storms and flooding in South Asia to
the shaking of an 8.2 magnitude earthquake in
Southwestern Mexico, human civilization is at an
urgent inflection point where we must begin to
prepare ourselves for changing climatic conditions
and their very real impacts on our communities and
ways of life.
“Over the last several years, the Bay Area and
surrounding regions experienced our own extreme
climactic events moving from a severe five-year
drought to unprecedented flooding in San Jose and
intensifying “nuisance” flooding impeding our
critical transportation infrastructure and cutting off
major access points for vulnerable communities.
Taken together, these events and recent North Bay
wildfires do not merely serve to reinforce what the
climate scientists report, they bring a sense of
urgency to our actions to make our communities,
infrastructure and environment more resilient.
A L L i S O N B R O O K S
E X E C U T i V E D i R E C TO R
B AY A R E A R E G i O N A L CO L L A B O R AT i V E

3 2 R A I S I N G R E G I O N A L R E S I L I E N C E
development and approvals process for multi-benefit infrastructure. It also offers a unique opportunity to firmly anchor regional planning to local communities, and to the people, wildlife, and natural resources without a consistent voice in the process. Ultimately human resilience can’t be separated from the resilience of the natural systems we all rely on for food, water, waste disposal, recreation, and quality of life.
BARC, MTC, ABAG, and BCDC consider this report a call to action. These agencies are committed to establishing a comprehensive planning process and an integrated Regional Resilience Plan that prepares the Bay Area for the challenges ahead. In particular, the region needs to increase its capacity to manage flooding and sea level rise so that it is as proactive in the face of these new threats as it already is in managing earthquake hazards, reducing green house gas emissions, and improving air quality.
The region must also continue to strengthen partnerships across regional agencies, local jurisdictions, and non-governmental organiza-tions, and with community residents, businesses, designers, builders, academics, health professionals, and others. These partnerships will be a cornerstone of efforts to shore up the metropolitan infrastructure, ensure public safety, and grow our regional resilience equitably with an explicit regional acknowledgement of the role that race and inequity plays in making some communities more vulnerable than others.
It’s time to work together as a region to raise the bar on resilience.
Point Isabel in El Cerrito Photo courtesy Bay Trail

P A R T 1 : S T E P S T O R E S I L I E N C E 3 3P A R T 2 : C A S E S T U D i E S
PART
2
Case Studies in
Multi-Hazard Planning
Four Regional Vulnerabilities
Four Local Examples
Raising the Bar on Regional Resilience
Report
Bay Area Regional Collaborative
November 2017

3 4 R A I S I N G R E G I O N A L R E S I L I E N C E
Four Key Areas of Regional Vulnerability:
Transportation, Housing, Communities, Natural Areas
Many of the amenities and services we rely on in the Bay Area everyday — whether it’s a light rail station, a gas line, a hospital, or a local park where our children play — can be vulnerable to flooding, rising sea levels, earthquakes, and wildfire. In some cases, these assets have been designed and are maintained (when funding available) to provide baseline safety from disasters. Local emergency responders are trained to respond quickly to save lives and restore some basic functions. However, these protections may not provide the level of performance, safety, or quality of life that the public expects, particularly in an era of reduced funding for public safety and welfare.
This section, Part 2 of the Raising the Bar on Regional Resilience Report (BARC 2017), details four regional vulnerabilities, mostly on the bayshore or along fault lines, that affect transportation, housing, disadvantaged communities and natural areas. All four vulnerabil-ities have regional implications relevant to implementation of Plan Bay Area 2040 and development of an integrated Regional Resilience Plan. For these case studies, four specific locations are also examined to detail how addressing vulnerabilities plays out on the ground. Two of these locations are in Alameda County because this was the pilot munici-pality for BCDC ART’s first vulnerability assessment, hence the findings are much more detailed.
For the purposes of this report each case study focuses on a particular vulnerability. Clearly, however, comprehensive resilience planning would require all four vulnerabilities, as well as localized impacts specific to each unique place and population, to be addressed in each location.

P A R T 2 : C A S E S T U D I E S 3 5
Case Study 1:
Regional Vulnerability: transportation infrastructure, including shoreline corridors and the vast majority of locations prioritized for future development around transportation hubs
Local Example: Oakland Coliseum Area and Bay Farm Island, Alameda County
Case Study 2:
Regional Vulnerability: housing and homes, especially older and multi-family homes in need of seismic retrofits and more flood protection
Local Example: Central San Rafael and Canal District, Marin County
Case Study 3:
Regional Vulnerability: disadvantaged and vulnerable communities that might lack the resources or information to prepare for, survive or recover from a disaster
Local Example: East Palo Alto, San Mateo County
Case Study 4:
Regional Vulnerability: natural areas along shorelines (including parks, trails, and wildlife habitats) at the frontline of risk from rising seas
Local Example: Hayward Shoreline, Alameda County
These case studies are intended to inform implementation of the six resilience steps in Plan Bay Area 2040. Addressing all four vulnerabilities in an integrated fashion — with regional leadership, funding commitments, a priority on equity, and technical support for all — will reduce multi-hazard risk and strengthen regional resilience.

3 6 R A I S I N G R E G I O N A L R E S I L I E N C E
Transportation Infrastructure and Sea Level Rise

P A R T 2 : C A S E S T U D I E S 3 7
Overview
The region’s transportation infrastructure, the backbone of Bay Area life and commerce, is highly vulnerable to flooding, rising sea levels and earthquakes. Networked infrastructure in particular, the kind of roads, rails, trails, and utility lines laid out in continuous corridors, is only as resilient as its weakest links.
Bay Area transportation arteries cross or parallel dozens of fault lines and low spots, and often follow the shore of San Francisco Bay. Preliminary vulnerability assessments estimate that regionwide approximately 150 miles of major highways, 200 miles of heavy rail lines, 300 miles of existing or proposed Bay Trail segments, and six BART stations could be temporarily or permanently flooded with a projected 66 inches of sea level rise over the coming decades (BCDC ART 2017). In addition, four airports are at risk of both current and future flooding. It is likely that these estimates will change as more accurate inundation and overtopping maps are developed and used to assess areas at risk.
Assets Most At Risk
Long and linear road, rail, and ground transportation lines are particularly susceptible to hazards and disruptions that cause a temporary or longer-term break in the network. Assets below sea level, like tunnels and underpasses, may be most at risk from flooding. Both repeated flooding and earthquakes affect elevated tracks, overpasses and ramps, requiring additional maintenance and possibly emergency repairs. Transportation lines that cross faults are also vulnerable to movement from fault creep, even if a major earth-
RESILIENCE CASE STUDY 1
Critical Transportation Infrastructure
Local Example: Oakland Coliseum Area, Alameda County
Bay Bridge maze. Photo by Spartina Project
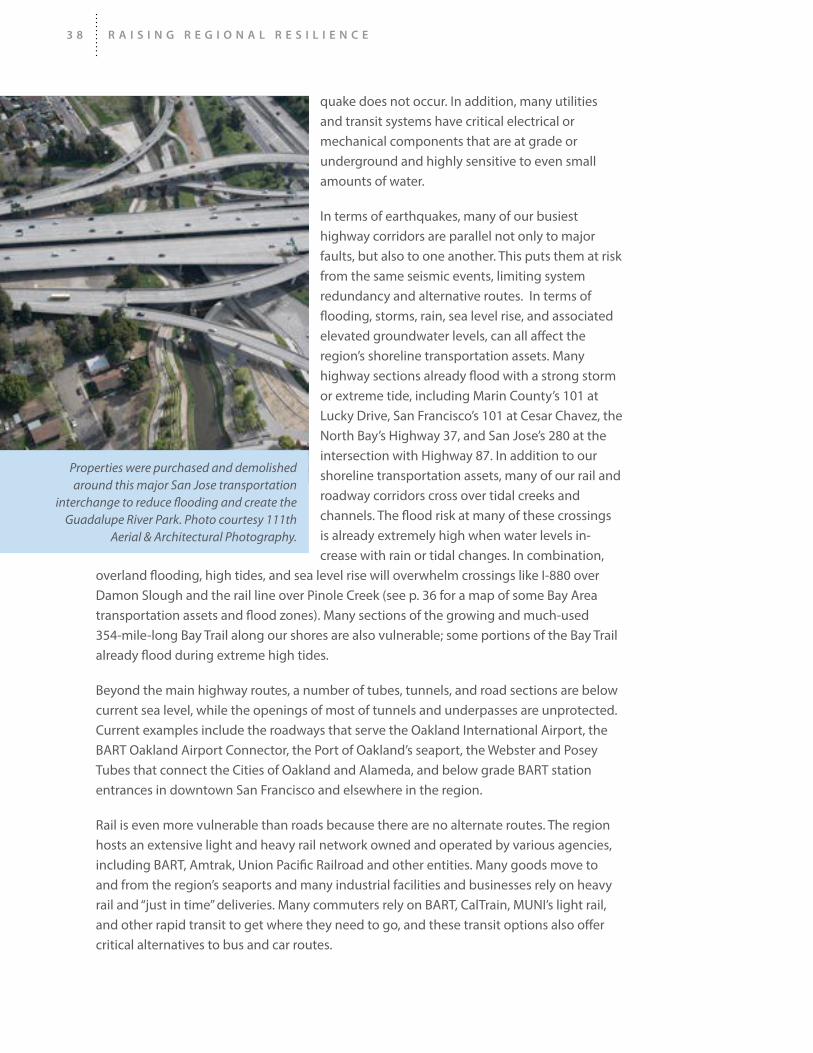
3 8 R A I S I N G R E G I O N A L R E S I L I E N C E
Properties were purchased and demolished around this major San Jose transportation
interchange to reduce flooding and create the Guadalupe River Park. Photo courtesy 111th
Aerial & Architectural Photography.
quake does not occur. In addition, many utilities and transit systems have critical electrical or mechanical components that are at grade or underground and highly sensitive to even small amounts of water.
In terms of earthquakes, many of our busiest highway corridors are parallel not only to major faults, but also to one another. This puts them at risk from the same seismic events, limiting system redundancy and alternative routes. In terms of flooding, storms, rain, sea level rise, and associated elevated groundwater levels, can all affect the region’s shoreline transportation assets. Many highway sections already flood with a strong storm or extreme tide, including Marin County’s 101 at Lucky Drive, San Francisco’s 101 at Cesar Chavez, the North Bay’s Highway 37, and San Jose’s 280 at the intersection with Highway 87. In addition to our shoreline transportation assets, many of our rail and roadway corridors cross over tidal creeks and channels. The flood risk at many of these crossings is already extremely high when water levels in-crease with rain or tidal changes. In combination,
overland flooding, high tides, and sea level rise will overwhelm crossings like I-880 over Damon Slough and the rail line over Pinole Creek (see p. 36 for a map of some Bay Area transportation assets and flood zones). Many sections of the growing and much-used 354-mile-long Bay Trail along our shores are also vulnerable; some portions of the Bay Trail already flood during extreme high tides.
Beyond the main highway routes, a number of tubes, tunnels, and road sections are below current sea level, while the openings of most of tunnels and underpasses are unprotected. Current examples include the roadways that serve the Oakland International Airport, the BART Oakland Airport Connector, the Port of Oakland’s seaport, the Webster and Posey Tubes that connect the Cities of Oakland and Alameda, and below grade BART station entrances in downtown San Francisco and elsewhere in the region.
Rail is even more vulnerable than roads because there are no alternate routes. The region hosts an extensive light and heavy rail network owned and operated by various agencies, including BART, Amtrak, Union Pacific Railroad and other entities. Many goods move to and from the region’s seaports and many industrial facilities and businesses rely on heavy rail and “just in time” deliveries. Many commuters rely on BART, CalTrain, MUNI’s light rail, and other rapid transit to get where they need to go, and these transit options also offer critical alternatives to bus and car routes.

P A R T 2 : C A S E S T U D I E S 3 9
East Bay FedEx runways near the Bay. Photo courtesy FedEx
Port of Oakland. Photo by Kurt Schwabe
In general, rail is highly sensitive to even small amounts of water on the tracks and can be damaged and moved out of alignment in an earthquake. The closure of one damaged portion of track often results in the closure of many miles of connected track. Relocating or adding new rail infrastructure, meanwhile, is difficult and costly. There is little room in the urbanized Bay Area for this type of solution.
Vulnerabilities do not stop with linear roads and rail susceptible to breaks in the line. Other critical transportation services lack redundancies and additional capacity too. Disruptions at one of the region’s three seaports, for example, would be hard to address by moving cargo to another. Each seaport has its own specialized equipment and facilities to handle its own particular type of cargo — whether containers in Oakland, break bulk in San
Francisco or liquid fuels and associated refineries in Richmond and Martinez. The region’s international airports also lack the redundancy and capacity to replace disrupted services or operations.
A final vulnerability has to do with the lack of options for rerouting goods moving to and from the San Francisco and Oakland International Airports, or the Port of Oakland seaport. Rerouting truck traffic to and from the Oakland seaport can be especially challenging due to road use restrictions on alternate routes such as I-580, I-980 and local streets and roads.
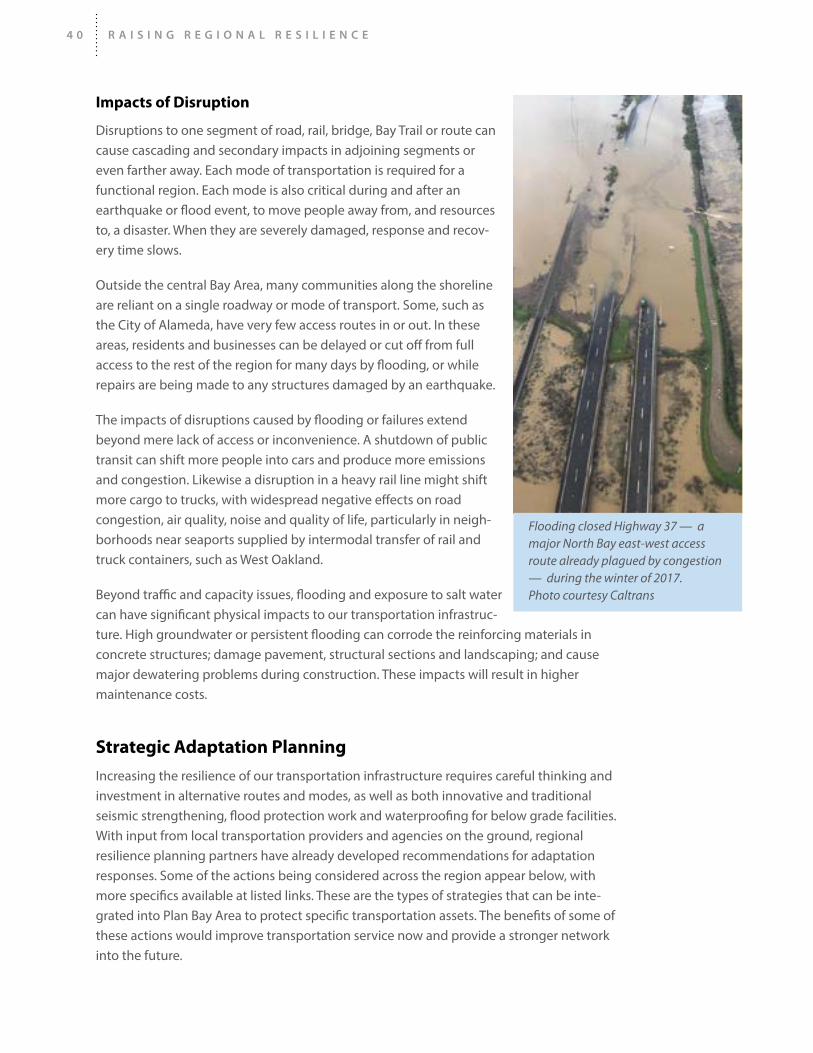
4 0 R A I S I N G R E G I O N A L R E S I L I E N C E
Impacts of Disruption
Disruptions to one segment of road, rail, bridge, Bay Trail or route can cause cascading and secondary impacts in adjoining segments or even farther away. Each mode of transportation is required for a functional region. Each mode is also critical during and after an earthquake or flood event, to move people away from, and resources to, a disaster. When they are severely damaged, response and recov-ery time slows.
Outside the central Bay Area, many communities along the shoreline are reliant on a single roadway or mode of transport. Some, such as the City of Alameda, have very few access routes in or out. In these areas, residents and businesses can be delayed or cut off from full access to the rest of the region for many days by flooding, or while repairs are being made to any structures damaged by an earthquake.
The impacts of disruptions caused by flooding or failures extend beyond mere lack of access or inconvenience. A shutdown of public transit can shift more people into cars and produce more emissions and congestion. Likewise a disruption in a heavy rail line might shift more cargo to trucks, with widespread negative effects on road congestion, air quality, noise and quality of life, particularly in neigh-borhoods near seaports supplied by intermodal transfer of rail and truck containers, such as West Oakland.
Beyond traffic and capacity issues, flooding and exposure to salt water can have significant physical impacts to our transportation infrastruc-ture. High groundwater or persistent flooding can corrode the reinforcing materials in concrete structures; damage pavement, structural sections and landscaping; and cause major dewatering problems during construction. These impacts will result in higher maintenance costs.
Strategic Adaptation Planning
Increasing the resilience of our transportation infrastructure requires careful thinking and investment in alternative routes and modes, as well as both innovative and traditional seismic strengthening, flood protection work and waterproofing for below grade facilities. With input from local transportation providers and agencies on the ground, regional resilience planning partners have already developed recommendations for adaptation responses. Some of the actions being considered across the region appear below, with more specifics available at listed links. These are the types of strategies that can be inte-grated into Plan Bay Area to protect specific transportation assets. The benefits of some of these actions would improve transportation service now and provide a stronger network into the future.
Flooding closed Highway 37 — a major North Bay east-west access route already plagued by congestion — during the winter of 2017. Photo courtesy Caltrans

P A R T 2 : C A S E S T U D I E S 4 1
Regional Planning Strategies
n Require an evaluation of sea level rise and storm events in planning capital improvements and infrastructure investments including alternative designs to reduce risks and lifecycle costs.
n Conduct “hot spot” analyses to identify key routes and nodes critical to traffic flow, assess their vulnerability, and develop actions to improve resilience.
n Increase the capacity of alternative routes and build new routes not at risk from rising seas or storm events.
n Invest in effective alternate routes, including multi-modal and non-motorized transporta-tion corridors (bike and pedestrian trails).
n Develop currently under-used, unused or new pedestrian rights-of-way as emergency evacuation alternatives.
n Form public-private partnerships to help those who own and manage transportation assets to work with surrounding land, road, or transit systems to increase resilience through new easements, access agreements, or joint flood protection investments.
n Facilitate cost sharing and multi-agency partnerships to make transportation improve-ments more resilient, optimize investments, and achieve multiple rather than single objectives.
n Bring lifeline providers together to better understand interdependencies and jointly plan for strategic mitigation and adaptation actions
Local and On-the-Ground Strategies
n For rail systems, raise the elevation of, or construct permanent structures to protect, at or below grade station entrances, tunnels, and maintenance facilities, and other critical components.
n Relocate critical components of the system that cannot be protected.
n Prioritize maintenance, repair, and retrofit of vulnerable bridges and levees.
n Increase the capacity of tidal creeks and channels that are crossed by our transportation network.
n Incorporate flood- and stormwater-absorbent green infrastructure into transportation adaptations wherever applicable.
n Identify locations in the watershed to increase water storage and water permeable surfaces and install green infrastructure solutions in these locations.
n Provide setbacks from roadways, railways, and waterways that incorporate greenways and innovative drainage and storage solutions.
n Identify opportunities for system redundancies or alternate routes and incorporate these into capital plans.

4 2 R A I S I N G R E G I O N A L R E S I L I E N C E
L O C A L E X A M P L E
Oakland Coliseum and Bay Farm Island, Alameda County
Most locals have been to a ball game at the Oakland Coliseum, seen the cranes and containers of the Port of Oakland from BART, driven I-880 and Hegenberger Road to the airport for a flight, even boarded the Coast Starlight or a Capital Corridor train in Oakland. Indeed the area of Oakland around the coliseum is so full of transportation infrastructure it offers an excellent case study of the vulnerability of the region’s system for moving people and goods to flooding, sea level rise, and liquefaction.
The vulnerable area encompasses the Oakland Coliseum and surrounding neighborhoods, Bay Farm Island, and parts of the city of Alameda and the Port of Oakland, which owns the land under the Oakland International Airport. In this area there is a dense concentration of networked and co-located infrastructure with rail lines paralleling highways and utilities par-alleling transportation routes. These include not only Interstate highway 880, but also BART, the Union Pacific Railroad, ACT transit bus lines, the airport and its BART connector, an Amtrak station, and critical local connecting roads. This transportation serves hundreds of thousands of Bay Area resi-dents both within Oakland and across the entire region. This area is both a primary link to the Oakland International Airport and a critical inter-modal international shipping link through the Port of Oakland.
All this critical transportation infrastructure stands on top of a predominantly low-lying landscape close to Bay shorelines, much of it also within one mile of the Hayward fault. The area contains many pockets of loose soil and Bay fill, and is at risk from both current and future coastal and riverine flooding, as well as ground shaking and liquefaction during an earthquake. Transportation assets here are particularly vulnerable to flooding from both storm runoff and high tides because several aging flood control channels draining Oakland creeks into the Bay transect the area.
Finally, neither the public transit system, the airport runways, the access bridges to the island, nor the rail lines have much redundancy or adaptive capacity in this area. Without available alternatives, there are likely to be major disruptions in travel, trade, and commute patterns after an extreme event. The transportation system in the Oakland Coliseum area is part of the region’s backbone. If hazardous events damage or disrupt assets or services in this area, the effects on commuter congestion, goods movement, and air quality would reach far beyond the City of Oakland, Alameda County, and the East Bay.
Since 2011, a variety of research, assessment, and collaborative efforts among multiple state, local, regional, and federal partners has explored the area’s vulnerabilities and resilience, and suggested some adaptation responses. Their most recent product is the 2016 Oakland/
Bay Farm Isle pump station, one of hundreds of aging facilities around the region used to keep our communities and shorelines dry. Many are under-sized, at capacity, and at the end of their service lives. To cope with SLR and storms, they need upgrades, mainte-nance, and back up power. Photo from archives.

P A R T 2 : C A S E S T U D I E S 4 3
Alameda Resilience Study led by the BCDC ART Program. The study draws on earlier collabo-rative work with MTC, City and Port of Oakland, Alameda County, East Bay Regional Park District, ABAG Caltrans and BART, among other transportation and land use interests. A diverse, multi-sector, cross-jurisdictional Working Group continues to expand on the plan-ning process today. The group recognizes that the interdependencies of the infrastructure in this area call for collaborative, multi-objective flood protection and seismic upgrade projects that can protect diverse assets in a cost-effective manner.
Some of their specific findings are described below:
n Flood control channels and storm drains are already at or beyond capacity in the Oakland Coliseum area. Rising bay levels will further reduce their capacity, especially during storms and high water events. Local surface streets, the BART station, and Interstate I-880 approaches and highway lanes already flood and conditions will worsen. Flooding will also impact the coliseum, which sits below ground level, and may reach far inland. Options being examined by the Working Group to increase the capacity of the channels include dredging, widening, and installing living levees that provide both flood protec-tion and natural habitat. Linking these steps to improvements of the associated storm drain systems will require new institutional relationships between the City of Oakland and the Alameda County Flood Control District.
Coliseum Area Flooding with Sea Level Rise

4 4 R A I S I N G R E G I O N A L R E S I L I E N C E
n Damon Slough adjacent to the Oakland Coliseum
has a very high risk of flooding due to the potential interaction of both riverine and coastal waters at this location (see map p. 43). Four flood control channels, including the slough, traverse the area. Current flood risk derives from watershed drain-age from the Oakland hills, suggesting the need for upper watershed adaptive measures to protect lower watershed transportation infrastructure near the slough. Options discussed by the Work-ing Group include increasing water storage in the channel, building storage in the upper watershed, encouraging lower impact development in the hills, creating floodable development at the Coliseum site, and even retreating in a managed fashion from the area. “All of the above” over time may be necessary.
n Interstate 880 crosses several creeks via narrow bridges in the area that could be over-whelmed by riverine or coastal flooding, or buckle or fail in an earthquake. Caltrans may not be able to address these physical and functional vulnerabilities without improving the governance structure around flood control channels in the area. Permits and approv-als for multi-objective improvements currently require navigating a complex jurisdic-tional landscape. In the meantime, the Working Group is exploring various options for addressing the vulnerability of the 880 crossing of Damon Slough ranging from elevating the ground level sections to rerouting the highway to a more protected location or transferring traffic to other modes or other roadways.
n Two BART lines pass through the Coliseum Station, and there are no options other than establishing a bus bridge to reroute commuters around this section if it floods. This option will only be feasible is buses can access local roadways near the station, and if there are feasible, undamaged routes to adjacent BART stations. The BART station itself is subject to flooding. The Working Group and BART may explore adaptive and protection steps such as installing remotely controlled temporary barriers or waterproof enclosures to protect ground level or underground station entrances, tunnels, maintenance facilities, and storage areas. Permanent protection structures might be a next step.
n Amtrak’s Coliseum Station in the area is also vulnerable and may need protection.
n The Oakland-Airport Connector was not designed with rising sea levels and future storms in mind and includes low-lying and underground sections. Sensitive electrical and mechanical equipment necessary to its operation aren’t well-protected from future hazards.
n The 98th Avenue underpass could experience very deep flooding because it is already below sea level. This is a “weak link” because the avenue is co-located with utilities, sewers, the BART Airport Connector, and it crosses San Leandro Creek. Adaptation options being explored by the Working Group include installing temporary barriers or waterproof closures.
Damon Slough flood channel near Coliseum parking lot. Archival photo

P A R T 2 : C A S E S T U D I E S 4 5
n Union Pacific rail lines in the area convey both goods and commuters for the railroad, as well as for the Capital Corridor service to Sacramento and Amtrak service across the USA. These lines parallel highway routes. There are no alternative rail tracks if the main track is damaged or flooded. As such, freight and passenger rail service could be impacted significantly both within and beyond the region.
n Oakland International Airport is protected from flooding by the Port of Oakland’s perime-ter dike on one side but vulnerable to flooding on another due to low spots along Doolittle Drive. Though the Port is upgrading the dike, it has little control over weak links in the other shoreline and Doolittle Drive, which are managed by the City of Alameda, Caltrans, and the East Bay Regional Park District. The airport also exerts unusual con-straints on the heights of roads, bridges and other structures under the FAA; as a result airport access is confined to various low-lying roads and underpasses (rather than overpasses) that can more easily become lakes in any flood event. Assets at risk include not just runways but also terminals, the air traffic control tower, fuel supply tanks, and a fire station. Improving the dike, and waterproofing or raising the elevation of critical electrical equipment above projected Bay levels, are two important adaptive steps. However, the complexity of any more comprehensive adaptation response calls for shared investments that will benefit transportation, recreation, and the airport.
n Bay Farm Island’s geography limits access on and off the island, or to the airport on the island, if routes are compromised by a flood or seismic event. There are two main trans-portation corridors to the island, one from the north via the Bay Farm Island Bridge, Doolittle Drive and the island parkway; and one from the east and I-880 via Hegenberger Road, 98th Avenue, and the Oakland-Airport Connector. Doolittle Drive offers some shoreline protection but overtops at very high tide (MHHW+36”). Adaptation responses discussed by the Working Group include improving culverts under the drive in the short term and raising or reinforcing low points in the drive in the long term and as bay levels rise. A major obstacle is the presence of multiple landowners with different jurisdictions and mandates. The eastern approach is less vulnerable to overtopping but low roads and underpasses could get very wet. In the meantime, any extreme event would have serious public health and safety consequences if people living or working on Bay Farm Island cannot be evacuated or cared for in place.
n Oakland’s 2015 Specific Area
Plan for the Coliseum area calls for thousands of new housing units, as well as new commercial development and stadiums, but it does not include provisions for
Oakland Coliseum and Damon Slough outlet to Oakland Estuary. Photo by Julia Robertson

4 6 R A I S I N G R E G I O N A L R E S I L I E N C E
commensurate flood protections. Public and private partners will need to coordinate to achieve multiple benefits and protect the safety of their investment from inundation.
n Martin Luther King Jr. Regional Shoreline’s 700-acre
urban waterfront park is highly vulnerable to flooding and rising sea levels. Endangered California clapper rail and salt marsh harvest mouse habitats such as Arrowhead Marsh will likely drown in the near future. There is also little space for habitats to migrate inland or upland. The 3.7 miles of Bay Trail through the Shoreline, an important alternate route for cyclists and pedestrians in the event of road and transit closures, are also vulnerable. An effort to coordinate trail and Doolittle Drive upgrades and construction could make both more resilient in the short term. Measures could include elevating certain sections, adding riprap or sea walls, or building a living levee. In the long term it will be difficult to protect the regional shoreline from rising sea levels. [design note: Bay Trail photo]
n The Bay Bridge touchdown north of the Oakland Coliseum is a particularly vulnerable regional trans-portation asset. Working collaboratively with the help of a Federal Highway Administration grant BCDC, MTC, BART and Caltrans identified climate change and extreme weather adaptation options to protect the touchdown including a living levee and a shore break.
Take-Homes
Regional and local decisions about transportation and transit investments, increasing safe and resilient housing, and addressing flood control deficits are all important in the Oakland Coliseum Area and beyond if the region is to build resilience while achieving sustainability, prosperity, and quality of life goals. Transportation is the backbone of the region that keeps local communities and regional mobility strong and the economy prosperous. In the past, planning for transportation focused on maximizing access, and providing affordable transportation options for all Bay Area residents and businesses to connect neighborhoods to job sites, hospitals, schools, airports, grocery stores and other critical facilities. Today, Bay Area transportation planning needs to incorporate many other considerations including resilience and flexibility in the face of changing and unstable conditions.
BACKGROUND
Regional
Ground Transportation Findings, BCDC ART www.adaptingtorisingtides.org/portfolio/ground-transportation/
Regional Adaptation Responses for Transportation –BCDC ART www.adaptingtorisingtides.org/wp-content/up-loads/2014/12/Adaptation_Responses_In-tro-Over-Transport.pdf
Risk to Airports – BCDC ART www.adaptingtorisingtides.org/portfolio/airport/
Cascading Failures: Earthquake Threats to Trans-portation and Utilities – ABAG http://resilience.abag.ca.gov/projects/transporta-tion_utilities_2014/
Local
Oakland/Alameda Resilience Study www.adaptingtorisingtides.org/project/oakland-ala-meda-resilience-study/

P A R T 2 : C A S E S T U D I E S 4 7
RESILIENCE CASE STUDY 2
Regional Vulnerability: Fragile Housing
Local Example: San Rafael Canal District, Marin County
Overview
Vulnerability assessments of Bay Area housing types and structures suggest that hundreds of thousands of residents and homes may be at risk from current or future flooding and/or earthquakes. Under-standing where the most fragile housing types are located, especial-ly those that house the most vulnerable people (see also Communi-ties at Risk section, p. 59), is a crucial first step in implementing the strategies needed at the local and regional levels to improve the Bay Area’s resilience.
Analysis produced by the Stronger Housing, Safer Communities project undertaken by ABAG and BCDC identified areas where 30 percent or more of the units are located in areas susceptible to major ground-shaking, liquefaction or flooding hazard and at higher risk from these hazards. Results suggest that as many as 150,000 housing units in the Bay Area may be vulnerable to collapse from ground shaking or liquefaction (ABAG Expected Housing Losses).
Assets Most at Risk
Housing risk is particularly difficult to address because its safety is the responsibility of individual homeowners and landlords who may not be aware of the extent of their vulnera-bility or be able to do anything about it. An alarming number of the region’s housing units are located in low-lying areas on the shoreline where combined seismic and flood risks are high. Much of this housing is built to older building codes that may not adequately per-form during seismic and flood events. Indeed, current building codes are geared towards life safety in an earthquake rather than continued occupancy of a building. This can mean that even when a home performs to the required safety level in an earthquake residents could still be displaced for days, weeks or even months.

4 8 R A I S I N G R E G I O N A L R E S I L I E N C E
New homes along the Oakland Estuary. Photo courtesy Bay Trail
Though earthquakes can have significant consequences in both established and new neighborhoods, there is a particular challenge for those with older single- and multi-family homes of certain types including:
n Multi-family or single family buildings with a garage or retail on the ground floor (i.e., weak story or open front).
n Multi-family, high-rise concrete buildings that have not been properly reinforced.
n Single family or small multi-unit buildings with short unreinforced walls that raise the first floor 1–5 feet above ground level (i.e., cripple walls), or homes that are not bolted to their foundations.
Additionally, even if they sustain little damage from ground shaking, most existing or new single-and multi-family homes under 10 stories are unlikely to have foundations stable enough to withstand liquefaction. Homes located where soils are susceptible to liquefaction, (e.g., along the Bay shoreline or on fill) may experience significant enough foundation damage during an earthquake to become uninhabitable.
Beyond being located on shifting ground, many Bay Area homes are susceptible to sea level rise, storm events, and flooding from overburdened creeks and stormwater systems. Current flood protection and
storm drain systems, meanwhile, are in many cases inadequate to keep these residential areas dry and safe.
As sea level rises, existing and future housing of all types within Special Flood Hazard Areas (SFHAs) identified by the Federal Emergency Management Administration (FEMA) will be at greater risk of flooding, and housing in low-lying areas not currently at risk will likely begin to experience flooding. The threat is especially great to existing and new housing that has habitable living space or critical building structures underground or “be-low-grade.” Bay Area housing that already experiences street or basement flooding during current rainfall events or when groundwater levels are high will be at even greater risk as the Bay rises. Such flooding occurs in neighborhoods all around the region including those in Oakland, San Francisco, Alameda, Richmond, Marin County, San Jose and elsewhere.
Impacts of Disruption
Recent analysis estimates that nearly 200,000 households could be displaced in a major San Andreas earthquake (Hazus). Many families will choose to shelter in place or shelter with friends or family, but nearly 52,000 residents are expected to seek temporary shelter. Due to the Bay Area’s extremely high cost of living, increasing population and lack of available affordable housing, housing stock damaged by flooding, earthquakes, or wildfire to the degree that it is unsuitable for occupancy would be a major loss. This is especially

P A R T 2 : C A S E S T U D I E S 4 9
true for housing occupied by residents who do not have the means to find new housing within the region. Even if residents are motivated to find replacement temporary or permanent housing in the region, the availability of affordable housing options will be low. Additionally, any displacement of residents results in significant disruption of communities and make it hard for the region’s economy to recover as workers, shoppers, teachers, patients, and others are dis-placed from their homes.
While newer Bay Area homes may be built to withstand collapse and protect those inside during an earthquake, damage may still easily render them uninhabitable or too costly to repair. Many Bay Area homes are not, however, protected from the impacts of flooding. Current design and construction standards for the Bay Area do not consider potential exposure to either water or salt. Steel used to reinforce concrete can rust; wood that isn’t treated to be water resistant can rot. Even temporary exposure to water can result in significant damage that requires people to leave their homes while they are repaired and made safe.
The safety of multi-family units is of particular concern because so many residents could be displaced in one event, and residents are more likely to be renters. Yet multi-family housing does not always receive an equitable share of state or federal financial and technical assis-tance needed for safety or recovery efforts.
Every effort must be made to retain current housing and limit catastrophic housing damage so that residents may stay in their homes. Likewise, plans and programs need to be put in place to shelter and relocate those that are permanently displaced if the worst happens. Current housing availability shortages and the region’s affordability crisis will make this challenging.
Strategic Adaptation Planning
New construction in vulnerable parts of the Bay Area should incorporate building code upgrades that go beyond life safety to include the use of water resistant materials, the water proofing of foundations and first floors, and the clustering of development out of current and near term flood prone areas. The owners of the most seismically vulnerable buildings, like those with older soft story design or cripple walls, should consider retrofits. Potential damage from seismic and flooding events should be given equal consideration, and also be evaluated in terms of a multi-hazard approach, in susceptible areas along waterways and shorelines.
Liquefaction impacts in the Marina District from the 1986 Loma Prieta quake. Photo USGS

5 0 R A I S I N G R E G I O N A L R E S I L I E N C E
A sampling of the types of actions the region may wish to consider appears below, with more specifics to be found through the listed web links and the Stronger Housing, Safer Communities Report.
State and Regional Planning Strategies
n Maintain and update inventory of fragile housing throughout the region and coordinate input from of all jurisdictions.
n Develop a statewide retrofitting license for contractors to ensure retrofit quality.
n Upgrade in statewide planning frameworks such as the state building code to support more resilient local general plan and code amendments.
n Decrease reliance on grid-supplied power and promote buildings that can maintain livable conditions in the event of extended loss of power or heating fuel.
n Create pre-disaster rebuild and recovery plans for where, when, how rebuilding will occur, and who will oversee it.
n Reduce flood risk through integrated watershed management.
n Provide incentives to landlords and developers to make seismic and flood safety up-grades to existing and planned housing units (see also California Coastal Commission draft guidelines for resilient residential development-link TBD).
Local and On-the-Ground Strategies
n Develop soft story and cripple wall retrofit programs.
n Ensure major upgrades and repairs of existing buildings address both seismic and flood related hazards.
n Increase building standards for new construction in seismic hazard zones through targeted amendments to local building codes, among other strategies.
n Encourage local governments to participate in FEMA’s Community Rating System.
n Increase standards for local floodplain management ordinances.
n Require flood proof construction materials and techniques within and adjacent to special flood hazard zones.
n Revise minimum building elevation and maximum building height limits to require habitable space and sensitive components to be elevated about current and future flood levels.
n Develop setback requirements in areas of special flood or seismic risk.
n Provide Bay Area specific guidelines for the evaluation of flood and seismic risk at the time of home inspections for property sales.

P A R T 2 : C A S E S T U D I E S 5 1
1. Hillside home – vulnerable to landslide
from earthquake, rain, or erosion
2. House over garage – vulnerable to collapse
due to earthquake ground shaking
3. Cripple wall – vulnerable to collapse due to
earthquake ground shaking
4. Weak story or open front – vulnerable to
collapse due to earthquake ground shaking
5. Waterfront non-ductile concrete
- vulnerable to storm surge and rising sea
levels, collapse due to earthquake ground
shaking
1
2
3
5
4
1
2
3
5
4
Art by Mikki Okamoto
Fragile Housing Types
Safe homes that are able to withstand multiple hazards are a good investment both for residents and for cities. Good resilient design should incorporate seismic strengthening, such as bolting homes to foundation, reinforcing cripple walls, or bracing weak or open front buildings, as well as best practices for flood resistance, such as elevating structures, moving sensitive equipment from the ground floor, and waterproofing materials when possible. However, flood and seismic retrofit may be expensive and few good options for financing exist, which may leave the most vulnerable residents, like low-income renters, in the most fragile housing. Pictured below are five typical San Rafael homes and residential buildings.

5 2 R A I S I N G R E G I O N A L R E S I L I E N C E
Flood Risk to Fragile Housing in San Rafael

P A R T 2 : C A S E S T U D I E S 5 3
L O C A L E X A M P L E San Rafael Canal District, Marin County
Visitors to Marin, or local residents, know the city of San Rafael as the heart of the county. Here in this graceful city with a small-town feel and Spanish-era mission Highways 101 and 580 connect Marin with Sonoma, San Francisco and the East Bay. West of 101 lie the shops and services of downtown and some of the county’s most urbanized neighborhoods, while east of the highway the 2.5-mile-long San Rafael canal winds through apartment buildings, marine and boat businesses, docks, houseboats, and out to the Bay. San Rafael also hosts an active boating sector, a university, and the county’s largest employers.
San Rafael’s hillsides and forested canyons host myriad single-family homes while the area immediately around downtown contains some of Marin County’s highest density and lowest income housing. Neighborhoods immediately adjacent to downtown include Gerstle Park, Montecito/Happy Valley and Canal. Proximity to the Bay, the San Rafael canal, floodplains, and two major fault-lines makes a significant amount of the housing in this central and east San Rafael area susceptible to earthquakes and flooding. Home density here ranges from 2–32 units per acre. Types include single- and multi-family homes of a variety of ages, ranging from Victorians and post-World War II bungalows to modern homes and apartment buildings.
According to an ABAG-BCDC Stronger Housing, Safer Communities assessment of hazards and housing types in this 2,168-acre area of San Rafael, many homes are of the type considered fragile (single family cripple wall, single family house over garage, multistory weak story or open front, and multistory non-ductile concrete). The entire area lies in a zone subject to shaking strong enough to damage or destroy these types of homes by collapsing walls and chimneys, moving buildings off their foundations (MMI XII), or trigger-ing liquefaction of loose or wet soils (see maps pp. 52 and 54). In addition, at least half of area in the ABAG-BCDC assessment is located within a FEMA special flood hazard area and the current 100-year floodplain. The same area is susceptible to a 24-inch rise in sea level. The area also includes three drainages –San Rafael Creek, South Pond and East San Rafael — where storm runoff could exacerbate flood risk.
In June 2017, Marin County’s BayWAVE project completed an in-depth sea level rise vulnera-bility assessment for all the assets and exposed communities along the entire bay shoreline, including a community profile specific to San Rafael (see Background for links). According to the assessment, a scenario involving a ten-inch rise in sea level could impact 5,000 acres, 1,300 parcels, and 700 buildings on the Marin bayshore. Add a 100-year storm surge, and the acreage increases to 8,000. Even this least severe of six future scenarios could impact 200,000+ residents and commuting employees, and threaten 4,500 homes, businesses, and institutions on the Marin shore in the near future.

5 4 R A I S I N G R E G I O N A L R E S I L I E N C E
For San Rafael, the same near-term scenario of (10 inches SLR + 100-year storm surge) could expose 449–1,360 acres of the city to flooding, according to the county’s community profile. The city’s most immediately vulnerable areas are the Canal neighborhood and the Kerner Business district, as well as shorelines and boating facilities off Point San Pedro Road. In time, as sea level increases, impacts move into downtown San Rafael, Peacock Gap, and the Marin Lagoon. Eventually, more than 2,000 residential parcels in San Rafael may be at risk of flood-ing from sea level rise, storm surge, and more intense runoff events; 78–134 parcels increas-ingly at risk of flooding by the end of the century host low –income, multi-family housing.
Fragile Housing in San Rafael

P A R T 2 : C A S E S T U D I E S 5 5
In San Rafael, some communi-ties will be especially vulnerable to housing loss from earthquake and flood hazards. The Stronger Housing, Safer Communities assessment suggests that many residents in the most vulnerable areas are low-income renters (30 percent overall) and/or non-white families with non-English speaking members. In the context of these factors, as well as the Bay Area’s current com-petitive housing market, such residents are less likely to be able to find affordable replace-ment housing nearby and more likely to leave the region permanently if their homes are damaged beyond immediate or near-term repair.
Closer examination revealed a number of specific vulnerabilities:
n San Rafael’s height restrictions mean that much of the housing is less than 10 stories tall (30–36 feet on average). As such, most of the housing units across almost the entire area are assumed to have foundations insufficient to withstand liquefaction (typically only required by code for buildings 10 stories or more). Adapting building codes to incorpo-rate design guidelines for foundations that better withstand liquefaction may be one important adaptation response.
n Many older-homes aren’t elevated. Across much of the area, 30 percent or more of the housing units are also vulnerable to flooding from both seasonal storms and rising sea levels. Many of the older units are not in compliance with City of San Rafael requirements that buildings be elevated one foot above FEMA base flood elevations identified on Flood Insurance Rate Maps. Possible adaptation responses include raising or flood-proofing older homes and ensuring building codes for new construction create more resilience to these conditions.
n The Canal neighborhood may be the most vulnerable of all for a variety of reasons. It is nearest to the rising waters of the canal and bay, and built on top of unstable bay fill subject to liquefaction. It contains more multi-unit buildings, many of which are weak story or open front, with more residents per unit than other neighborhoods, not to mention many small mom and pop businesses such as auto shops. More than 75 percent of the units in this neighborhood are rented. In addition, more than 70 percent of the households are Hispanic; in some of these households English is a second language, and high school graduation rates are lower than the local average. These families may have more limited ability to influence landlords or local officials to improve building safety, and expensive retrofits may force them out of their homes. They may also lack basic informa-
Multi-Unit housing along the San Rafael Canal. Photo by Nate Seltenrich

5 6 R A I S I N G R E G I O N A L R E S I L I E N C E
Multi-Unit housing along the San Rafael Canal. Photo by Michael Hunter Adamson
tion about how to prepare for, or the resources to recover from, any emergency. Access to emergency services after any hazard event is also of concern here, as the neighborhood is physically isolated from services, shopping, and transportation by the two freeways, and many residents don’t own cars. Adapta-tion responses may include building retrofit requirements that include cost protection for renters, and investment in infrastructure such as new sea
walls, horizontal levees, or other appropriate interventions to ensure the community is more resilient.
n The low-lying downtown area is especially susceptible to flooding from sea level rise and liquefaction. Home density is higher here; the area also contains a concentration of critical emergency services such as hospitals, grocery stories, and transportation hubs such as the Marin Transit Center. Adaptation responses are still being developed but may require a combination of flood protection, accommodation, and retreat in the long term.
n Gerstle Park, a neighborhood on the southwest end of downtown San Rafael, occupies slightly higher ground but remains vulnerable to liquefaction and to flooding from Mahon Creek, sea level rise, and storm surge. The neighborhood includes a variety of older single family, duplex and multi-unit homes, some of which were first developed in the 1800s before seismic standards and flood protection requirements. Many of these homes are cripple wall or weak story/open front. Renters occupy about 57 percent of the homes in Gerstle Park; renters have little control over building safety.
n The Montecito/Happy Valley neighborhood spans two valleys north of the canal and east of 101 and hosts a mix of low-density single-family historic homes (many of which are cripple wall homes) and higher-density apartment buildings (which may be weak story/open front). The primary vulnerability here is from flooding and earthquake impacts on older homes and community serving businesses along Irwin, 2nd and 3rd Streets. These streets host gas stations, grocery stores, small offices, as well as San Rafael High School.
n The Highway 101–580 intersection is a critical regional transportation asset. While most sections in the San Rafael area are elevated, and some have undergone seismic retrofits, many ramps and feeder roads could flood or buckle due to earthquake-induced liquefac-tion and prevent travel in and out of the city and county.
n Local marshes around the mouth of the San Rafael Canal, and surrounding Baypoint Village, may offer some buffers from storm surge and rising sea levels. Adaptation responses could include some enhancements of these natural flood protection assets.

P A R T 2 : C A S E S T U D I E S 5 7
n Marin County’s 2017 community profile of San Rafael expands on the sea level rise and flooding vulnerabilities outlined above in more detail, examining six scenarios in the near-, mid-, and long-term. Now that the assessment is complete, the county and the city will involve impacted San Rafael communities and neighbors in identifying appropriate sea level rise adaptation responses specific to their location, assets, resources, building types, and needs. Current county tools for outreach include the Game of Floods — a board game developed especially to engage residents and communities in confronting trade offs and making choices in the face of flood hazards. Over the last few years, the County has brought the game into living rooms and workshops throughout Marin to begin adaptation dialogues among people at risk.
n A Local Hazard Mitigation Plan is now being developed by the City of San Rafael that will help identify the full range of potential hazards and mitigation strategies that could be implemented to reduce losses during a variety of disaster scenarios.
n Engagement in the Canal community has already begun, as many young Hispanic families will be first in the path of rising seas and flooding. Programs like Shore Up Marin and YESS are conducting multi-racial, multi-lingual education programs focused on equitable inclusion in the decision-making and planning processes. Likewise, county programs like CERT (Community Emergency Response Team) help engage local volunteers in preparing for quake, flooding, fire and other disasters
Marin residents play “Game of Floods” as part of county outreach to prepare communities for around rising sea levels. Photo courtesy Marin County.

5 8 R A I S I N G R E G I O N A L R E S I L I E N C E
Take-Homes
Many of the most affordable housing areas in central and eastern San Rafael are vulnerable to multiple hazards, so any efforts to make this housing more resilient must account for both seismic hazards as well as current and future flooding. Resilience planning should also consider the potential loss of some of Marin County’s diversity, as low income residents are displaced by retrofit and high replacement costs after a disaster. Non-English speaking residents may find it more difficult to navigate the bureaucratic processes of applying for housing assistance and simply leave.
The Bay Area is a highly desirable place to live, with a wide range of housing types and ages, access to vistas and natural areas, and a strong economy boasting well-paying jobs. But in order to keep our population safe, local building codes, development zoning, and local and regional policies all need to be updated to reflect areas of increasing threat from flooding and ongoing threats from earthquakes. Such updates will need to be ongoing, to adapt to changing climate and sea level conditions over many planning cycles and tie in to regional and local investment strategies to address vulnerabilities. Keeping people in their homes will keep neighbor-hoods intact and increase the likelihood that the region’s economy will be able to with-stand an extreme event, flood or earthquake.
BACKGROUND
Regional
Stronger Housing, Safer Communities, ABAG & BCDC resilience.abag.ca.gov/projects/stronger_housing_saf-er_communities_2015
California Coastal Commission Draft Guidelines for Climate-Adapted Residential Development coastalresilience.org/ccc-releases-draft-residential-ad-aptation-policy-guidance/
Local
Stronger Housing, Safer Communities: Community Profile, San Rafael resilience.abag.ca.gov/wp-content/documents/housing/San%20Rafael%20Community%20Profile_fi-nal_v2.pdfMarin Shoreline
Marin County Sea Level Rise www.MarinSLR.org
Vulnerability Assessment & San Rafael Community Profile, County of Marin www.marincounty.org/main/baywave/vulnerability-as-sessment
City of San Rafael Hazard Mitigation Plan www.cityofsanrafael.org/hazard-mitigation-plan/
Kids from Bahia Vista School in San Rafael plant native species that double as shoreline buffers at Pickleweed Park on the canal. Photo by Emily Koller

P A R T 2 : C A S E S T U D I E S 5 9
RESILIENCE CASE STUDY 3
Regional Vulnerability: Disadvantaged Communities at the Water’s Edge
Local Example: East Palo Alto, San Mateo County
Overview
Some communities at the water’s edge are more vulnerable than others, simply because they lack the resources or capacity to bounce back after a disaster. Vulnerability assessments suggest that many of the Bay Area neighborhoods and communities at risk from flooding, rising sea levels and liquefaction are socially, physically or economi-cally disadvantaged in some way, worsening the impacts of any disaster. Over half of the region’s Block Groups exhibit a significant number — 3 or more out of 10 — of social characteristics which reduce ability to prepare for, respond to, and recover from a hazard event (Block Groups typically contain population between 600 — 3,000 people). BCDC analysis identified vulnerable communities potentially exposed to 12, 36, and 66 inches of sea level rise. Many cities contain Block Groups exposed at only 12 inches of elevated water, which is within the range of a 1-year storm event, and many communities are already experiencing flooding (see table below).
Cities with Block Groups Vulnerable to Sea-Level Rise
Alameda Hayward North Fair Oaks Richmond San Mateo
Albany Marin City North Richmond Rodeo San Rafael
Bay Point Menlo Park Oakland San Francisco Suisun City
East Palo Alto Milpitas Pittsburg San Leandro Union City
Fairfield Napa Redwood City San Lorenzo Vallejo
Block Group
Vulnerability to
Water Levels:
■ 12” ■ 36” ■ 66”Source: BCDC ART

6 0 R A I S I N G R E G I O N A L R E S I L I E N C E
Communities at Risk

P A R T 2 : C A S E S T U D I E S 6 1
Communities Most at Risk
Building on the region’s previous work on environmental justice around the Bay, the Stronger Housing, Safer Communities project undertaken by ABAG and BCDC identified communities that are particularly vulnerable and developed locally relevant strategies to increase their resilience. The project identified ten factors that contribute to vulnerability and mapped concentrations of these indicators throughout the region (see table p. 62). These factors include age, language, ethnicity, economic status, housing tenure or depen-dence on transit. In other words, many people in these at-risk communities lack the financial means, physical capacity, necessary information, or access to services to ade-quately prepare for, respond to, or recover from current and future hazards.
Many households in the Bay Area’s most vulnerable shoreline communities are burdened by the high housing and transportation costs prevalent in our region. Such households are less able to invest money in their homes to prepare for natural disasters. If displaced from damaged homes, they are also likely to struggle to find alternative housing that is afford-able and near to the jobs, schools, medical facilities, and other services on which they rely.
Impacts of Disruption
The consequences of past disasters include injury, loss of life, loss or damage to residences and personal items, and temporary or permanent relocation, which result in the loss of neighborhood services and community cohesion. People may not just lose housing, but also access to jobs, daily goods, and services; many may be forced to move away from their communities entirely, given the high cost of living throughout the Bay Area. Loss of housing stock in an already impacted region will further increase costs of remaining housing.
Many people in vulnerable communities have inadequate access to information about the hazards they face, let alone how to purchase flood insurance, build an earthquake kit, or access assistance and resources after a disaster. Most hazard insurance may be out of reach for homeowners already burdened by low wages and the high cost of living in the region.
Additionally, while access to timely, accurate, and meaningful information can be challeng-ing in all communities, it can be particularly challenging in communities where English is not the primary language. In these communities, both language and cultural differences can be a barrier to accessing information that results in action and increased resilience.
In the Bay Area, many of these communities are also populated by renters who have less control over the quality of their housing and fewer assets. Additionally, households with elderly or disabled residents and children can face evacuation challenges. These groups may need specialized equipment or supervision during and after evacuation, and shelter facilities where concerned family members can find them and where they can reconnect with their support communities
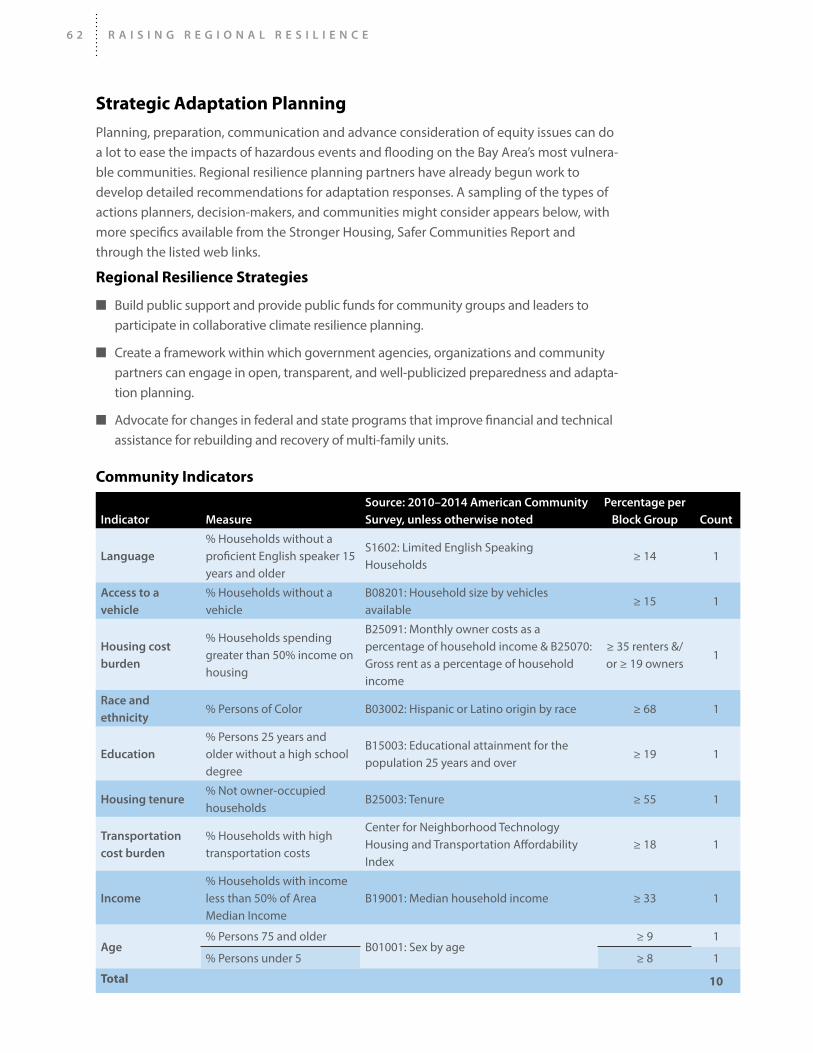
6 2 R A I S I N G R E G I O N A L R E S I L I E N C E
Strategic Adaptation Planning
Planning, preparation, communication and advance consideration of equity issues can do a lot to ease the impacts of hazardous events and flooding on the Bay Area’s most vulnera-ble communities. Regional resilience planning partners have already begun work to develop detailed recommendations for adaptation responses. A sampling of the types of actions planners, decision-makers, and communities might consider appears below, with more specifics available from the Stronger Housing, Safer Communities Report and through the listed web links.
Regional Resilience Strategies
n Build public support and provide public funds for community groups and leaders to participate in collaborative climate resilience planning.
n Create a framework within which government agencies, organizations and community partners can engage in open, transparent, and well-publicized preparedness and adapta-tion planning.
n Advocate for changes in federal and state programs that improve financial and technical assistance for rebuilding and recovery of multi-family units.
Community Indicators
indicator MeasureSource: 2010–2014 American Community Survey, unless otherwise noted
Percentage per Block Group Count
Language% Households without a proficient English speaker 15 years and older
S1602: Limited English Speaking Households
≥ 14 1
Access to a vehicle
% Households without a vehicle
B08201: Household size by vehicles available
≥ 15 1
Housing cost burden
% Households spending greater than 50% income on housing
B25091: Monthly owner costs as a percentage of household income & B25070: Gross rent as a percentage of household income
≥ 35 renters &/or ≥ 19 owners
1
Race and ethnicity
% Persons of Color B03002: Hispanic or Latino origin by race ≥ 68 1
Education% Persons 25 years and older without a high school degree
B15003: Educational attainment for the population 25 years and over
≥ 19 1
Housing tenure % Not owner-occupied households
B25003: Tenure ≥ 55 1
Transportation cost burden
% Households with high transportation costs
Center for Neighborhood Technology Housing and Transportation Affordability Index
≥ 18 1
income% Households with income less than 50% of Area Median Income
B19001: Median household income ≥ 33 1
Age% Persons 75 and older
B01001: Sex by age≥ 9 1
% Persons under 5 ≥ 8 1
Total 10

P A R T 2 : C A S E S T U D I E S 6 3
n Establish a cooperative shoreline management program to balance issues of equity, economy and the environment.
n Increase access to and education about both state and private hazard insurance pro-grams.
n Improve the resilience of rental units and ensure they are rebuilt after loss or damage.
n Protect affordable housing during recovery, and adopt policies to support replacement of affordable housing units damaged or demolished rather than conversion to owner occupied properties.
n Increase protection of critical facilities and lifelines in high hazard areas, and revise local plans and development codes to permit interim and temporary land uses to support these facilities after a disaster.
Neighborhood and Local Strategies
n Develop plans and programs to assist the most vulnerable communities and individuals both during a disaster (with shelter facilities and evacuation options), as well as post-di-saster (with finding interim, affordable housing to avoid permanent displacement).
n Coordinate with local non-profit and community organizations to enhance their capacity to prepare for and respond to disaster and flooding in their communities.
Treasure Island was built on bayfill over a rocky reef to host an international exposition in 1939. Today plans are to redevelop the windy island — including housing, hotels, art sculptures, schools, and other services for 20-25,000 people. Some of the earliest sea level rise adaptation efforts in the Bay Area are reflected in some of the plans for shorelines and levees. Photo [email protected]

6 4 R A I S I N G R E G I O N A L R E S I L I E N C E
Communities at Risk in East Palo Alto

P A R T 2 : C A S E S T U D I E S 6 5
L O C A L E X A M P L E
East Palo Alto, San Mateo County
East Palo Alto is a historic low-income community bordered by Highway 101 and San Francisco Bay in San Mateo County. It has been home to Native Americans, Japanese farming families and, since World War II, African-American Pacific Islander, and Mexican American communities. Current community organizing revolves around environmental racism, affordable housing, tenant rights, immigrant rights, potable water, and juvenile justice issues. Preserving communities like East Palo Alto has become ever more important as there are fewer and fewer affordable places to live in the Bay Area.
To the west, Stanford University sprawls up into the hills; to the north and south, Silicon Valley’s rapid gentrification and housing shortage are putting increasing pressure on these last affordable neighborhoods. To the east, hundreds of acres of federal refuges and adjacent wetlands and parks provide a buffer for this extremely low-lying bayfront city against future flooding from rising sea levels. Current and past flooding problems derive from San Francis-quito Creek, which bisects East Palo Alto via a flood control channel, in combination with the high water table at the edge of the Bay. Altogether, residents and businesses in East Palo Alto are at risk not only from multiple natural hazards, ranging from flooding to liquefaction of the ground in an earthquake, but also from development pressures and social changes on the Peninsula.
According to the San Mateo County draft Sea Level Rise Vulnerability Assessment (April 2017), more than 7,090 acres of wetlands and 22,063 acres of developed land countywide are vulnerable to a mid-level scenario combining 3.3 feet of sea level rise with a 1 percent annual chance flood. The assessment also found that in many cases there might be more than one point of exposure to sea level rise impacts, and/or cascading impacts from breaks in net-worked infrastructure (such as transportation and wastewater treatments facilities) and threats to public health from these disruptions, not to mention injuries and the spread of disease. At risk estimates include 30,604 residential parcels, 2,235 commercial parcels, 34 schools, 22 health care facilities, two airports, 12 electric substations, five wastewater treat-ment plants, and about 21 miles of levees, among other assets. The assessed value of parcels at risk countywide is $34 billion in the mid-level scenario.
The County’s vulnerability assessment also examines the City of East Palo Alto in more detail, and finds 335–992 acres — as well as critical energy and stormwater infrastructure --are at risk from sea level rise. About 60 percent of the population and 34 percent of the roads are vulnerable to the mid-level scenario, as well as all the city’s wetlands. East Palo Alto’s bayshore protections aren’t up to the task (mostly berms and non-engineered structures).
Beyond these physical hazards and possible disruptions, East Palo Alto is also one of the most vulnerable communities on San Mateo County’s bayshore for other reasons. As such, it offers a strong case study of an area where the impacts from earthquake and climate change hazards on local communities will be more pronounced because of various barriers and burdens.

6 6 R A I S I N G R E G I O N A L R E S I L I E N C E
Sea Level Rise in East Palo Alto

P A R T 2 : C A S E S T U D I E S 6 7
In the ABAG-BCDC Stronger Housing, Safer Communities assessment, researchers identified 10 factors than contribute to vulnerability and mapped the concentrations of those factors throughout the East Palo Alto area (see table p. 62 and map p. 60). These factors derive from age, language, ethnicity, economic status, housing tenure, and dependence on transit, among other indicators of risk. According to the assessment, most of East Palo Alto has at least five risk factors. Residents lack access to the support services and strong networks needed to prepare for, respond to, and recover from disasters. In East Palo Alto, as in other shoreline towns at risk, building resil-ience will require regional agencies to work with local agencies and community groups to develop strong support systems and affordable housing alternatives.
Closer examination of the East Palo Alto assessment profile revealed a
number of specific vulnerabilities:
n The Ravenswood Priority Development Area designated by regional and local planning agencies in 2013 within East Palo Alto contains large areas susceptible to multiple current and future hazards. As these areas are being considered for future growth, there will need to be commensurate investment in flood control measures and other appropriate adaptations.
n Low-lying elevations make East Palo Alto communities highly vulnerable to rising sea levels, according to a recent assessment by the San Mateo County Office of Sustainability. In addition, approximately one-quarter of East Palo Alto lies within FEMA’s special flood hazard area. Many areas are also susceptible to current flooding from local watersheds during storm events, as well as to extreme high tides.
n Aging or inadequate flood protection infrastructure predominates. Many water moving facilities and levees within the city have a low adaptive capacity in terms of helping the community survive or recover from hazardous events and flooding. The O’Connor Pump station, for example, cannot accommodate additional floodwater.
n San Francisquito Creek is the focus of long-term efforts to address persistent flooding in the lower watershed and surrounding communities including East Palo Alto. Multiple projects over many years led by the San Francisquito Creek Joint Powers Authority have sought to reduce runoff and flooding from the upper watershed, reconfigure and im-prove the capacity of the creek’s lower flood control channel, nurture riparian and fish habitats, and coordinate with wetland restoration projects at the Bay’s edge. Outcomes could help or hinder East Palo Alto’s current and future exposure to flood and liquefaction hazards. A recent planning focus (SAFER BAY project) is to make the coastal levee system more resilient to near-term sea level rise (now in EIR phase).
Volunteers plant trees at East Palo Alto Charter School. Photo courtesy Canopy.

6 8 R A I S I N G R E G I O N A L R E S I L I E N C E
n Groundshaking and liquefaction due to an earthquake is a major vulnerability. The entire city is likely to experience significant building damage from project-ed ground shaking (MMI VIII or greater). The city also straddles a moderate to very high liquefaction susceptibility zone.
n Fragile housing types with foundations unable to withstand liquefaction occur throughout East Palo Alto (including multi-family weak story, open front or non-ductile concrete; single-family housing has slab-on-grade foundations).
n Community risk factors are high in East Palo Alto. At least 50 percent of block groups within the city have a high percentage of non-English speaking households, and 25 percent of the community does not speak English at home. Over a third of residents do not have U.S. citizenship and may be reluctant to seek help from government institutions or have difficulty access-ing community resources and emergency services.
n Renters make up roughly 50 percent of the nearly 7,000 households in East Palo Alto. Renters have a limited ability to update their homes to make them more resilient. Seven percent of rentals are mobile homes. Overcrowding has made the conversion of garages to housing a common occurrence — resulting in more people living in structures not built for habitation in terms of seismic or flood safety.
n Housing costs are a burden for most East Palo Alto families. More than 30 percent of East Palo Alto households make less than 50 percent of the area median income; 15 percent of households spend 50 percent or more of their income on housing. Additionally, more than 15 percent of all households spend five percent or more of their income on transportation, and 9 percent of households do not own a car, and are disproportionately affected by flooding of trans-portation infrastructure.
n A number of residents are
disabled or medically under-served. Citywide, seven percent of residents have identified as disabled, which can create unique housing needs and mobility challenges. Disaster events put those with limited mobility disproportionately in danger of injury or death.
BACKGROUND
Regional
Stronger Housing, Safer Communities, ABAG & BCDC resilience.abag.ca.gov/projects/stronger_housing_safer_communities_2015
Local
Stronger Housing, Safer Communities, Com-munity Profile, East Palo Alto resilience.abag.ca.gov/community-profiles/
San Mateo County Sea Level Rise Vulnera-bility Assessment, Due out Spring 2017 seachangesmc.com/current-efforts/vulnera-bility-assessment/
South Bay Salt Pond Restoration Project, Ravenswood Ponds www.southbayrestoration.org/visit-the-ponds/complex-ravenswood.html
Kids enjoy new tree plantings around the playground of East Palo Alto Charter School. Photo courtesy Canopy.

P A R T 2 : C A S E S T U D I E S 6 9
n Evacuation of East Palo Alto in any extreme event will be challenging due to language, mobility, and economic barriers for residents trying to move temporarily or permanently out of harms way. Those without anywhere to go upon evacuation may end up in shel-ters, creating additional barriers for those commuting to jobs elsewhere or trying to sustain extended households, among other challenges.
n The city lacks adequate access to local health care and is defined as a Medically Under-served Area. The nearest hospital is in Menlo Park. Having to travel farther for emergency care for injuries caused by hazards only makes the community more vulnerable. In recent years, however, Silicon Valley business interests have begun working with the community on equity and access issues.
n Limited freeway and transit access makes East Palo Alto vulnerable to being cut off in an extreme event. Highway 84 already floods. Accessible public transit options are bus only, with little redundancy. In addition, many city streets lack storm drains; parts of the city have been stranded by surface flooding during past storms.
n Community and County resilience, hazard management, sustainability, and sea level rise
adaptation initiatives focused on East Palo Alto are ongoing. San Mateo County is nearing completion of a countywide sea level rise vulnerability assessment. One group, Youth United for Community Action, received a HUD sustainability grant to work on sea level rise issues in recent years. Another group is working actively on housing displacement issues due to gentrification.
n Wetland areas adjacent to East Palo Alto are slowly being enhanced to improve tidal functions and create transition zones to accommodate sea level rise where possible; efforts to reconnect local creeks to wetlands are also being considered. The Ravenswood unit of the South Bay Salt Pond Restoration Project connects with other public wildlife refuge wetlands and the Cooley Landing Park on either side of the Dumbarton Bridge, and together they may provide a natural buffer between the Bay and the city.
Take-Homes
East Palo Alto is just one of many communities in the region that could suffer significantly from flooding and ground shaking in their homes, businesses, and neighborhoods. Regional and local planners interested in building resilience will benefit from focusing efforts and resources in these communities now to minimize significant impacts and challenges in the future.
Vulnerable communities need more than brochures about how to make an earthquake kit or visits from a hazard insurance broker. To improve and protect the diversity and affordability of the Bay Area, as well as to protect neighborhood services, community cohesion, and the regional economy’s need for both employees and customers, regional resilience planners must take equity considerations into account in planning and preparation for the hazards ahead.

7 0 R A I S I N G R E G I O N A L R E S I L I E N C E
All photos this page courtesy Santa Clara Valley Water District.
MANAGED RETREAT
Removing Housing to Open Up Floodplain
Protecting people from floods often requires moving people out of harm’s way, a task that is nothing new to Bay Area water districts but may become increasingly relevant in adapting to rising sea levels. Since 1999, the Santa Clara Valley Water District, for example, has purchased or partnered to acquire approximate-ly 2,000 acres of floodplain, which it maintains as open space. In recent years, the District has also looked to open landscapes such as parks and sports fields to double as flood detention basins. For example, Lake Cunningham Regional Park in the Coyote Creek Watershed doubles as a flood basin when Lower Silver Creek overflows its banks. Many flood protection projects include purchasing properties near creeks, which not only removes at-risk homes from floodplains, but also allows for a wider, more natural creek system. Since the mid-1990s, the District has purchased a total of 90 developed properties in the City of San Jose alone, in support of flood protection on the Guadalupe River and Coyote Creek. The District is currently in the process of purchasing dozens more properties near Morgan Hill to incorporate into a flood protection and restoration project. Photo above shows house purchased and demolished in San Jose to create more floodplain along the Guadalupe River, as well as Guadalupe River Park in its lower reaches (below).
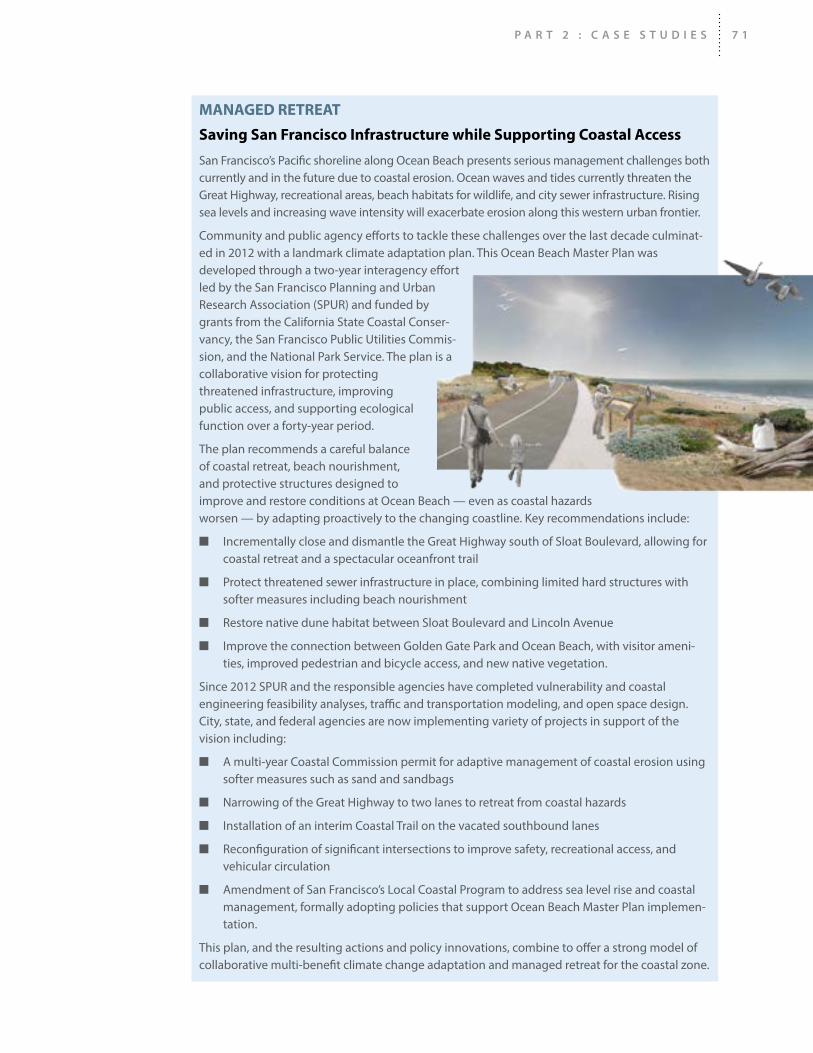
P A R T 2 : C A S E S T U D I E S 7 1
MANAGED RETREAT
Saving San Francisco Infrastructure while Supporting Coastal Access
San Francisco’s Pacific shoreline along Ocean Beach presents serious management challenges both currently and in the future due to coastal erosion. Ocean waves and tides currently threaten the Great Highway, recreational areas, beach habitats for wildlife, and city sewer infrastructure. Rising sea levels and increasing wave intensity will exacerbate erosion along this western urban frontier.
Community and public agency efforts to tackle these challenges over the last decade culminat-ed in 2012 with a landmark climate adaptation plan. This Ocean Beach Master Plan was developed through a two-year interagency effort led by the San Francisco Planning and Urban Research Association (SPUR) and funded by grants from the California State Coastal Conser-vancy, the San Francisco Public Utilities Commis-sion, and the National Park Service. The plan is a collaborative vision for protecting threatened infrastructure, improving public access, and supporting ecological function over a forty-year period.
The plan recommends a careful balance of coastal retreat, beach nourishment, and protective structures designed to improve and restore conditions at Ocean Beach — even as coastal hazards worsen — by adapting proactively to the changing coastline. Key recommendations include:
■ Incrementally close and dismantle the Great Highway south of Sloat Boulevard, allowing for coastal retreat and a spectacular oceanfront trail
■ Protect threatened sewer infrastructure in place, combining limited hard structures with softer measures including beach nourishment
■ Restore native dune habitat between Sloat Boulevard and Lincoln Avenue
■ Improve the connection between Golden Gate Park and Ocean Beach, with visitor ameni-ties, improved pedestrian and bicycle access, and new native vegetation.
Since 2012 SPUR and the responsible agencies have completed vulnerability and coastal engineering feasibility analyses, traffic and transportation modeling, and open space design. City, state, and federal agencies are now implementing variety of projects in support of the vision including:
■ A multi-year Coastal Commission permit for adaptive management of coastal erosion using softer measures such as sand and sandbags
■ Narrowing of the Great Highway to two lanes to retreat from coastal hazards
■ Installation of an interim Coastal Trail on the vacated southbound lanes
■ Reconfiguration of significant intersections to improve safety, recreational access, and vehicular circulation
■ Amendment of San Francisco’s Local Coastal Program to address sea level rise and coastal management, formally adopting policies that support Ocean Beach Master Plan implemen-tation.
This plan, and the resulting actions and policy innovations, combine to offer a strong model of collaborative multi-benefit climate change adaptation and managed retreat for the coastal zone.

7 2 R A I S I N G R E G I O N A L R E S I L I E N C E
Natural Areas and Sea Level Rise in San Francisco Bay

P A R T 2 : C A S E S T U D I E S 7 3
RESILIENCE CASE STUDY 4
Regional Vulnerability: Natural Shorelines, Habitats, and Recreational Spaces
Local Example: Hayward Shoreline, Alameda County
Overview
Natural habitats, wildlife, forests, parklands, open spaces and farms are not only intrinsically valuable for the nature they sustain, but also provide essential ecosystem services to Bay Area residents. Address-ing their vulnerability to changing conditions is as important as protecting other regional assets. The longer droughts, higher heat, changing seasons, more intense fires, and more frequent floods projected for the future are sure to challenge the resilience of these natural systems and the species that live in them, as well as their capacity to survive and thrive in a metropolitan region. In fact, many of these wildlands, open spaces, and natural shorelines increase the region’s resilience by helping to reduce the impacts of hazard events on the built environment right next to them, where so many people live and work. Without these natural assets, the quality of our air, water, environment and lifestyle could easily erode.
Vulnerability assessments suggest that without intervention large areas of our current shoreline wetlands will be flooded by rising sea levels by 2060–2080 (USGS, Point Blue, Baylands Goals Science Update). In and around these wetlands are wildlife refuges, park-lands, beaches, and trails that are also highly valued by Bay Area residents and businesses. BCDC analysis identifies 53 of the 165 Priority Conservation Areas (PCAs) as potentially vulnerable to permanent flooding from 66 inches of sea level rise (BCDC ART Bay Area Project, ongoing). These 53 PCAs encompass a total of 784,000 acres. Along the outer coast, assessments point to the most vulnerable habitats being rocky intertidal, beach and dune, and estuaries (GFNMS 2016). The coast south of San Francisco is already the most rapidly eroding shore in the state (USGS). These are just some examples of types of natural and recreational resources at risk on the bay and ocean coasts of the region.

7 4 R A I S I N G R E G I O N A L R E S I L I E N C E
Organizations currently playing an active role in regional level thinking on resilience and climate change adaptation for our natural resources, habitats, parks and trails include BCDC, the California Coastal Conservancy, the San Francisco Estuary Partnership, and the San Francisco Estuary Institute, all of whom collaborate with state and federal fish and wildlife agencies, as well as local NGOs such as Save the Bay, land trusts, and park districts to accomplish these goals. The Bay Area benefits from these and many other organizations working on resilience at local and sub-regional scales.
Assets Most at Risk
Building on the region’s previous work on environmental justice around the Bay, the Stronger Housing, Safer Communities project undertaken by ABAG and BCDC identified communities that are particularly vulnerable and developed locally relevant strategies to increase their resilience. The project identified ten factors that contribute to vulnerability
On the outer coast along the Pacific Ocean, the region’s vulnerable landscapes include bluffs, rocky shorelines, beaches, bays, estuaries and creek mouths. These coastal shore-lines provide a wide range of ecological services, from unique plant communities and diverse habitats to areas vital to wildlife for resting, roosting, raising young or foraging for food. The region’s shorelines, beaches and coastal forests also draw visitors from around the world and offer local residents rewarding recreational opportunities.
On the inner coast along San Francisco Bay, vulnerable landscapes include tidal wetlands, sand beaches, and eelgrass and oysters beds that require shallow water to grow. Bayland habitats support plants, invertebrates, fish, shorebirds, waterfowl, and mammal species, some of which are listed as threatened or endangered under state and federal law. Migrat-
Endangered Ridgway rails living in the bay salt marshes. Photo by Rick Lewis.
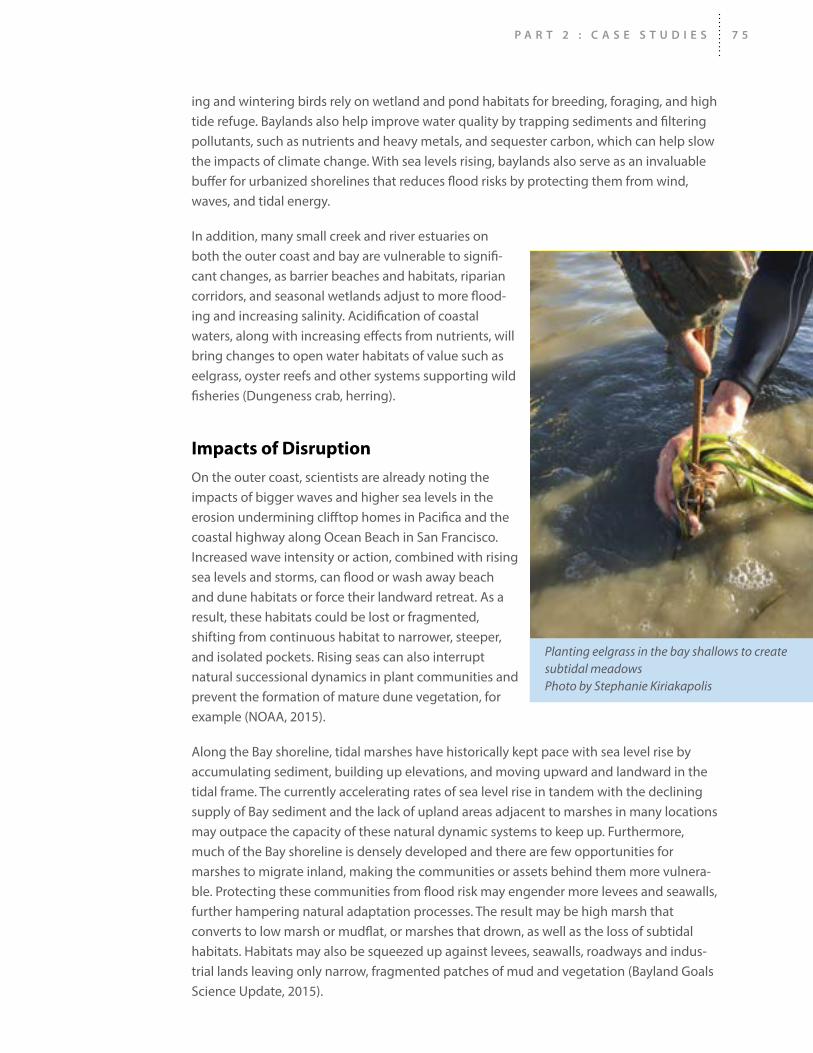
P A R T 2 : C A S E S T U D I E S 7 5
ing and wintering birds rely on wetland and pond habitats for breeding, foraging, and high tide refuge. Baylands also help improve water quality by trapping sediments and filtering pollutants, such as nutrients and heavy metals, and sequester carbon, which can help slow the impacts of climate change. With sea levels rising, baylands also serve as an invaluable buffer for urbanized shorelines that reduces flood risks by protecting them from wind, waves, and tidal energy.
In addition, many small creek and river estuaries on both the outer coast and bay are vulnerable to signifi-cant changes, as barrier beaches and habitats, riparian corridors, and seasonal wetlands adjust to more flood-ing and increasing salinity. Acidification of coastal waters, along with increasing effects from nutrients, will bring changes to open water habitats of value such as eelgrass, oyster reefs and other systems supporting wild fisheries (Dungeness crab, herring).
Impacts of Disruption
On the outer coast, scientists are already noting the impacts of bigger waves and higher sea levels in the erosion undermining clifftop homes in Pacifica and the coastal highway along Ocean Beach in San Francisco. Increased wave intensity or action, combined with rising sea levels and storms, can flood or wash away beach and dune habitats or force their landward retreat. As a result, these habitats could be lost or fragmented, shifting from continuous habitat to narrower, steeper, and isolated pockets. Rising seas can also interrupt natural successional dynamics in plant communities and prevent the formation of mature dune vegetation, for example (NOAA, 2015).
Along the Bay shoreline, tidal marshes have historically kept pace with sea level rise by accumulating sediment, building up elevations, and moving upward and landward in the tidal frame. The currently accelerating rates of sea level rise in tandem with the declining supply of Bay sediment and the lack of upland areas adjacent to marshes in many locations may outpace the capacity of these natural dynamic systems to keep up. Furthermore, much of the Bay shoreline is densely developed and there are few opportunities for marshes to migrate inland, making the communities or assets behind them more vulnera-ble. Protecting these communities from flood risk may engender more levees and seawalls, further hampering natural adaptation processes. The result may be high marsh that converts to low marsh or mudflat, or marshes that drown, as well as the loss of subtidal habitats. Habitats may also be squeezed up against levees, seawalls, roadways and indus-trial lands leaving only narrow, fragmented patches of mud and vegetation (Bayland Goals Science Update, 2015).
Planting eelgrass in the bay shallows to create subtidal meadows Photo by Stephanie Kiriakapolis

7 6 R A I S I N G R E G I O N A L R E S I L I E N C E
Strategic Adaptation Planning
The good news is that the region has already increased its resiliency by investing in the restoration and enhancement of thousands of acres of marshes, ponds, creek mouths, beaches and other shoreline habitats, and in improvements to the health of the estuarine ecosystem and native species. However, these and other natural systems are unlikely to persist without support and human interventions such as importing sediment to habitats in need or allowing for inland migration. Efforts to increase the natural resilience of these remaining ecosystems and habitats should also take into account principles such as connec-tivity, diversity, complexity, and redundancy, as well as setting, size, scale and the presence of functional natural processes and people as stewards (SFEI Landscape Resilience Frame-work, 2015).
Fortunately, the region already has a strong foundation of support for the implementation of natural habitat and wetland restoration projects. Two examples include the recent passage of Measure AA ($500 million in parcel tax resources over the next 20 years) and the California Coastal Conservancy’s grant programs for restoring natural areas and Plan Bay Area’s Priority Conservation Areas. The region also has a foundation and framework for optimizing such investments in the form of the 2015 Bayland Ecosystem Habitat Goals Sceince Update, which provides detailed local recommendations and baselines.
Resilience planning partners have already begun to develop recommendations for adapta-tion responses for natural shorelines. A sampling of the types of actions planners should consider appears below, and more detailed information can be found through the Back-ground web links.
Regional Resilience Strategies
n Increase the pace and scale of bayland restoration efforts.
n Research and test restoration and management actions that improve baylands resilience.
n Develop and implement a regional sediment management plan for the Bay.
n Develop a strategic plan to acquire and conserve upland areas appropriate for the landward migration of marshes, and establish rolling easements to prevent shoreline armoring that would preclude landward migration.
n Develop a marsh monitoring program that identifies when areas reach key thresholds of risk.
n Protect and promote setbacks, buffers, and high tide refugia for sensitive species in marshes, as well as corridors that facilitate bird and wildlife movement into adjacent habitats and watersheds.
n Develop regional recommendations for how to plan, design, and implement projects that meet multiple objectives, and achieve both flood protection for adjacent communities as well as improved ecosystem function.
n Establish agreements and partnerships among shoreline managers and park landowners

P A R T 2 : C A S E S T U D I E S 7 7
to share responsibility for sea level rise adaptation response, and to prioritize levee maintenance to protect vulnerable assets such as endangered species habitats and the Bay Trail.
n Update permitting processes and regional policies to facilitate multi-jurisdictional, multi-benefit, green and blue infrastructure projects in the Bay and along the shoreline.
n Integrate natural resource protection into state and local government hazard mitigation, response and recovery planning.
Local and On-the-Ground Strategies
n Improve, enhance, and maintain water control structures along the shoreline including tide gates, berms, and levees.
n Design new tidal marsh restoration projects with rising sea levels and landward or upward migra-tion in mind.
n Redesign aging flood control infrastructure to add flood capacity while moving more sediment through the system and into the bay, making more sediment available to replenish shoreline marshes.
n Replenish and trap sand on Bay beaches, and establish setbacks and buffers to allow them to migrate landward.
n Enhance near offshore resources in strategic locations, in alignment with goals for San Francisco Bay sub-tidal habitats.
n Develop projects that meet multiple objectives so that adjacent parks, habitats, trails, and species can all be made more resilient.
n Improve drainage through shoreline parks and golf courses in low-lying areas by install-ing flexible drains and valves, and by repurposing low-lying areas so they can be tempo-rarily flooded.
n Protect, replace, or increase the resilience of recreational access to the Bay via sandy beaches and shoreline trails.
n Stockpile materials for temporary bridges, ramps or pathways at recreational sites to maintain access for those with limited mobility during high water events.
n Plant salinity resistant grass species or install artificial turf or sports fields in areas exposed to flooding and salt-water intrusion.
Vulnerable San Mateo Bridge landing. Photo [email protected]

7 8 R A I S I N G R E G I O N A L R E S I L I E N C E
Hayward Shoreline Natural Areas and Infrastructure Risk

P A R T 2 : C A S E S T U D I E S 7 9
L O C A L E X A M P L E
Hayward Shoreline, Alameda County
Hayward’s shoreline encompasses 1,800 acres of managed ponds and tidal marshes, rich habitats for endangered birds and mice, and a visitor center on stilts that educates thousands of adults and children each year about the natural riches of the Bay. Visitors come here to view wildlife, bike and walk on the Bay Trail, learn about Bay resources or participate in restoration activities. Children and adults leave with a better understanding of the Bay and a stronger commitment to protecting it.
Like many other stretches of bayshore, the area also hosts significant infrastructure including pipelines, landfills, and wastewater treatment plants and ponds, as well as the approach to the Hayward–San Mateo Bridge. As such, the shoreline makes a good case study of how hazards may impact natural, urban and recreational infrastructure. The area is also an experi-menting ground for emerging ideas of how to protect the shoreline from flooding and rising sea levels with a combination of marshes, levees irrigated with wastewater, and other flood protection innovations.
BCDC ART chose the Hayward shoreline as an early demonstration project for collaborative adaptation planning because it is so uniformly low-lying and has a mix of regionally import-ant assets (see map p. 78). King tides and storm waves already flood trails, cutting visitors off from return routes to higher ground. Utility lines, the bridge toll plaza, and other urban infrastructure could be next. Moving one piece out of the way of the water could affect others, and have both regional and local impacts. Though there is little high ground to retreat to, there are also more open spaces and wetlands along this shore than in many parts of the region, offering some additional opportunities for adaptation.
The project took local partners, including the 11 landowners, through a step-by-step process to assess risks and vulnerabilities and select a response. At the table were the City of Hay-ward, East Bay Regional Park District, Hayward Area Recreation and Park District, East Bay Dischargers Authority, Union Sanitary District, California Coastal Conservancy, Alameda County Flood Control Water Conservation District, Caltrans and Bay Trail staff members, among others. Working together, the group agreed that natural resilience and recreation were just as important as the economic value of the industrial zone at the water’s edge. Assessments suggested, however, that their existing levees and flood control protections could not protect these assets in the future. Both inboard and outboard levees overtop when the water levels are equivalent to projected sea level rise or storm surge events or three feet of additional water. As most of the shoreline is already in need of extensive and expensive levee repair, the opportunity to plan protections and investments with multiple objectives in mind proved timely.

Closer examination revealed a number of more specific vulnerabilities:
n Outboard levees making up the “structural shorelines” that protect both tidal and man-aged marshes (connected to the Bay by tide gates) in the Hayward Regional Shoreline park date back to the 1850s and are poorly built. Upgrades by the East Bay Regional Park District over the years now provide better protection for the Cogswell, Triangle, and HARD marshes, but the Hayward Marsh (which includes wastewater treatment wetlands) remains very vulnerable. One adaptation response has been for the East Bay Regional Park District to set up an extended programmatic, rather than five-year project-by-proj-ect, regulatory permit for levee upgrades and mitigation. This will allow the district to more comprehensively and effectively assess levee condition, identify weak spots, factor in short and long-term sea level rise and storm impacts, and collaborate with neighbors and partners on strengthening shoreline protections.
n Adjacent levees at Eden Landing are still sub-standard but a little taller and managed under a broader South Bay Salt Pond Restoration Project permit. Adaptation lessons can be learned from the South Bay project’s efforts to restore a diverse mosaic of habitats along with a flexible water and flood management infrastructure. In the meantime, neighbors may look to Eden Landing’s managed ponds to store flood waters during extreme events, protecting inland industry and homes from inundation.
n A 27-acre preserve for the endangered salt marsh harvest mouse has some options for adapting related to its flexible tide gates, drainage system, and adjacent property for inland migration, but these tools will only take it so far before this critical habitat drowns. Adaptation responses being explored involve partnering with neighboring marsh managers to create higher refuge islands. But this is another example where the problem can’t be solved within one jurisdiction. To this end, habitat managers are beginning to work with local cities, utilities, and dischargers to investigate long-term, coordinated, multi-benefit shoreline protection approaches that could not only bolster non-existent levee maintenance budgets but also create or protect marsh habitat.
n Trails here already flood, and the Bay Trail is no exception. This section sits on earthen levees on top of bay mud that can’t be strengthened without sinking. This part of the regional trail also serves visitors with limited mobility, which is important to address given the limited availability of accessible trails in the region. Adaptation responses envisioned for the future include resurfacing with more wave and water resistant materials than gravel. For a project still aimed at completing its 500-mile ring around the Bay, shifting gears to plan a more resilient future for the trail remains a stretch.
Photo by Cris Benton

P A R T 2 : C A S E S T U D I E S 8 1
n The Bay Outfall and Diffuser
pipeline for the East Bay Dischargers Authority (EBDA), which conveys the wastewater of 900,000 East Bay residents and treatment plants seven miles out into the Bay, is already a bottle-neck in high water or wet weather events. Rising seas will progressively reduce the capacity of this aging outfall, and the nearshore pipeline that feeds into it, and exacerbate back ups. In planning for capital invest-ment in replacement infrastructure, EBDA has been collaborating with habitat and flood protection engineers on ways to use this source of wastewater to irrigate a new kind of broadly sloping inboard levee (see below). So instead of being discharged to the Bay, some treated wastewater could be redirected to irrigate levee slopes so they can grow vegetation, create wildlife habitat and high water refugia, and provide flood protection. (Early support for planning for this multi-objective project came from the State Coastal Conservancy).
n The Oro Loma Horizontal Levee project north of the Hayward shoreline, a project led by the Oro Loma Sanitary District and the San Francisco Estuary Partnership, offers an experi-mental approach to multi-objective water quality improvement and climate change adaptation infrastructure. The project is designed to showcase methods for passing municipal effluent through planted vegetation on a levee slope, trapping and processing pollutants, providing edge habitat, and buffering against rising sea levels (see diagram above and photo p. 82).
n The Hayward–San Mateo Bridge approach, toll plaza, and other portions Highway 92 all sit at or below sea level. Flooding could sever a major East to West Bay transportation connection and commute route between Livermore Valley homes and Silicon Valley jobs
Multi-Benefit Horizontal Levee

8 2 R A I S I N G R E G I O N A L R E S I L I E N C E
that carries 81,000 vehicles daily. Adaptation responses being explored for the long term range from relocating the toll plaza to elevating the 92 causeway, widening the right-of-way, and walling off roadways from the Bay. Shorter-term actions may include improving drainage, stockpiling emergency barriers and materials, and pre-positioning debris removal equipment and pumps.
n Other assets vulnerable to, or inadequate in the face of, flooding and
rising sea levels are the West Winton Landfill, the Hayward Water Pollution Control Facility, and two major flood control channels operated by the Alameda County Flood Control Water Conserva-tion District.
Take-Homes
With so much at stake, asset managers along the Hayward shoreline are endeavoring to embrace a long-term landscape level vision of adaptation to sea level rise and extreme tides rather than spending time and money on short-term patchwork solutions. Based on some of the vulnerabilities and potential responses outlined above, the Hayward group developed a resilience study for the area that exam-ined three different visions of how green and grey infrastructure could be balanced to either hold the line against flooding or move out of the way of the rising Bay. The group is now building a stronger shared decision-making structure so that it can optimize upgrades and changes to the Hayward shoreline for mutual benefit.
Ultimately our own human resilience can’t be separated from the resilience of the natural systems we rely on for food, water, waste disposal, recreation, and quality of life. Special attention and consider-ation is needed when planning for resilient regional growth that balances natural resource and infrastructure protection with human safety (Risk Landscapes, draft 2016).
BACKGROUND
Regional
Baylands Goals http://baylandsgoals.org
Baylands Goals Science Update 2016 https://baylandsgoals.org/science-update-2016/
Subtidal Goals www.sfbaysubtidal.org/report.html
Natural Shorelines, BCDC ART www.adaptingtorisingtides.org/portfolio/natural-areas/
PRBO Decision Support Tool http://data.prbo.org/apps/sfbslr/
ABAG Risk Landscapes 2016 http://resilience.abag.ca.gov/wp-content/documents/mitigation_adaptation/RiskLand-scapes_Draft%207.24.15.docx
ABAG PCA program http://abag.ca.gov/priority/conservation/
Local
Hayward Shoreline Assessments, Analysis & Recommendations www.adaptingtorisingtides.org/project/hay-ward-shoreline/
Oro Loma Project https://oroloma.org/horizontal-levee-project/
Articles
Coastal Wetlands Reduce Property Losses During Extreme Events www.nature.com/articles/s41598-017–09269-z
Mainstreaming Resilience, Estuary Magazine www.sfestuary.org/mainstreaming-resilience/
Experimental planting palettes growing at the Oro Loma Sanitary District’s horizontal levee project. Plantings by Save-the-Bay volunteers. Photo courtesy OLSD.

P A R T 2 : C A S E S T U D I E S 8 3
PRODUCTiON CREDiTS
Cover DesignDarren Campeau
Report Design & Production Darren Campeau and Peter Beeler
MapsElizabeth Felter, Heather Dennis, Todd Hallenbeck & Eliza Berry, BCDC
Print Date: November 2017
Cover Photos:Planting project in East Palo Alto courtesy Canopy. Oakland Coliseum by [email protected] San Rafael Canal by Michael Hunter Adamson. Hayward Shoreline Center by Warren Holcomb
Additional Photo CreditsPart 1Page 3 Ferry building farmer’s market in San Francisco by Ariel Rubissow Okamoto Page 25 Native rose by Amber ManfreePage 26 Least tern chick by Rick Lewis
Part 2Page 37 Highways by MTC ArchivesPage 42 Coliseum by [email protected] 47 Foster City by Ariel Rubissow OkamotoPage 53 San Rafael Canal by Nate SeltenrichPage 59 Bike event by MTC archivesPage 65 Cooley Landing Center by Fog ArtsPage 73 Bay Trail courtesy Bay TrailPage 79 10K on the Bay 2016 by Adrienne de Ponte
