rainwater harvesting: as a runoff reduction practice · total 780,192 0 building sq footage (ft2)...
TRANSCRIPT

Rainwater Harvesting: As a Runoff Reduction Practice
Date: September 2011Presented by: Greg Kowalsky

UrbanGreen Rain Water Harvesting
Agenda
– RWH – why now?
– System Components
– Calculating Benefits
22

Divided Water Management
Drinking
WasteStorm
3

VA Water Management: Drinking, Waste, Storm
Wastewater
Evap: 840kBlowdown: 160kCondensate: 750K
2M gal
Commercial Development• 43,000 ft2 roof• 43,000 ft2 parking• 43,000 ft2 landscape• 172,000 ft2 office• 45” per year
1M gal
Potable100k gal
Toilets
Cooling1M gal
1M gal
Irrigation
Municipal Water
3.1 M gal
Stormwater
45” Annual rainfallRooftop: 1M galSurface: 1M gal
2M gal
4
Commercial Office Building
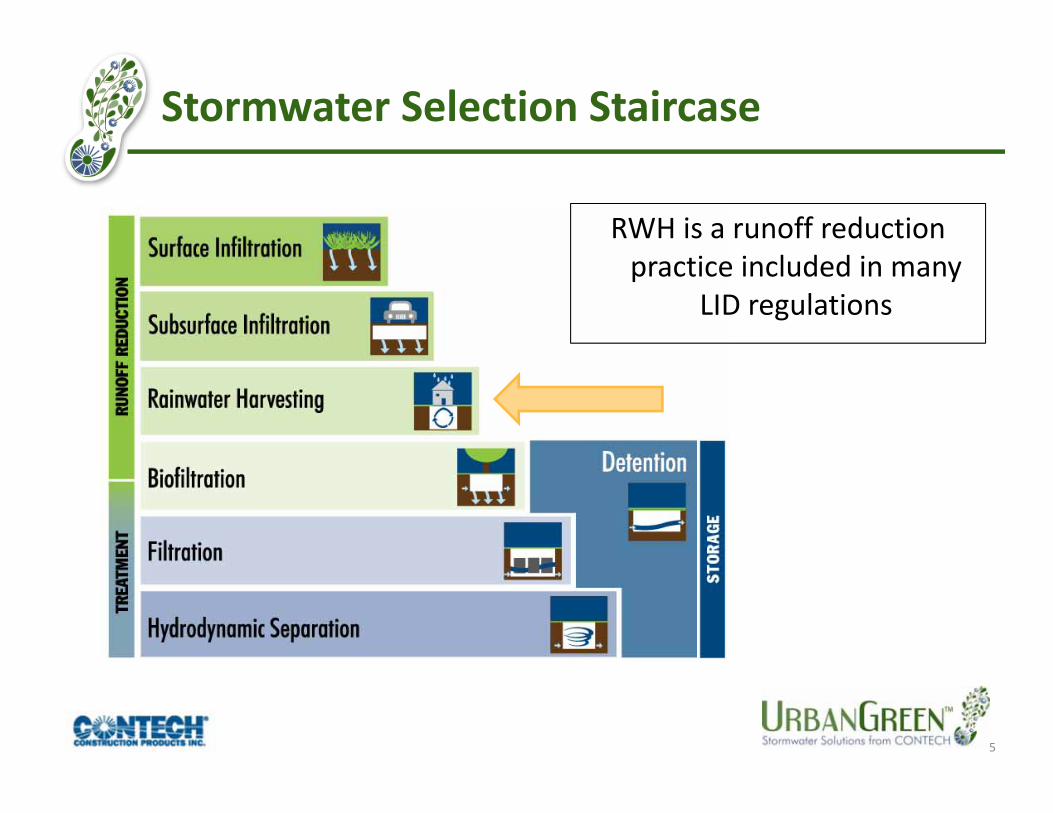
Stormwater Selection Staircase
RWH is a runoff reduction practice included in many
LID regulations
5

RWH and LEED
Sustainable Sites• 6.1 Stormwater Quantity
– Pre‐development peak and quantity – 1 Point• 6.2 Stormwater Quality
– Reduce annual TSS by 80% – 1 PointWater Efficiency• 1.0 Water Efficient Landscaping
– Reduce by 50% ‐ 2 Points– No Potable Use – 4 Points
• 2.0 Innovative Wastewater Technologies– Reduce potable water used for sewage – 2 points– OR– 50% onsite treatment – 2 points
• 3.0 Water Use Reduction– 30% reduction from Baseline – 2 points– 35% reduction from baseline – 3 points– 40% reduction from baseline – 4 points
LEED 12• SS 6.1 (Quality) 1• SS 6.2 (Quantity) 1• WE 1 (Irrigation) 4• WE2 (Wastewater) 2• WE 3 (Indoor water) 4
6

Typical System Components
7

System Components
8
Pre‐treatmentPre‐treatment
Storage Storage
CatchmentCatchment
MechanicalsMechanicals
8
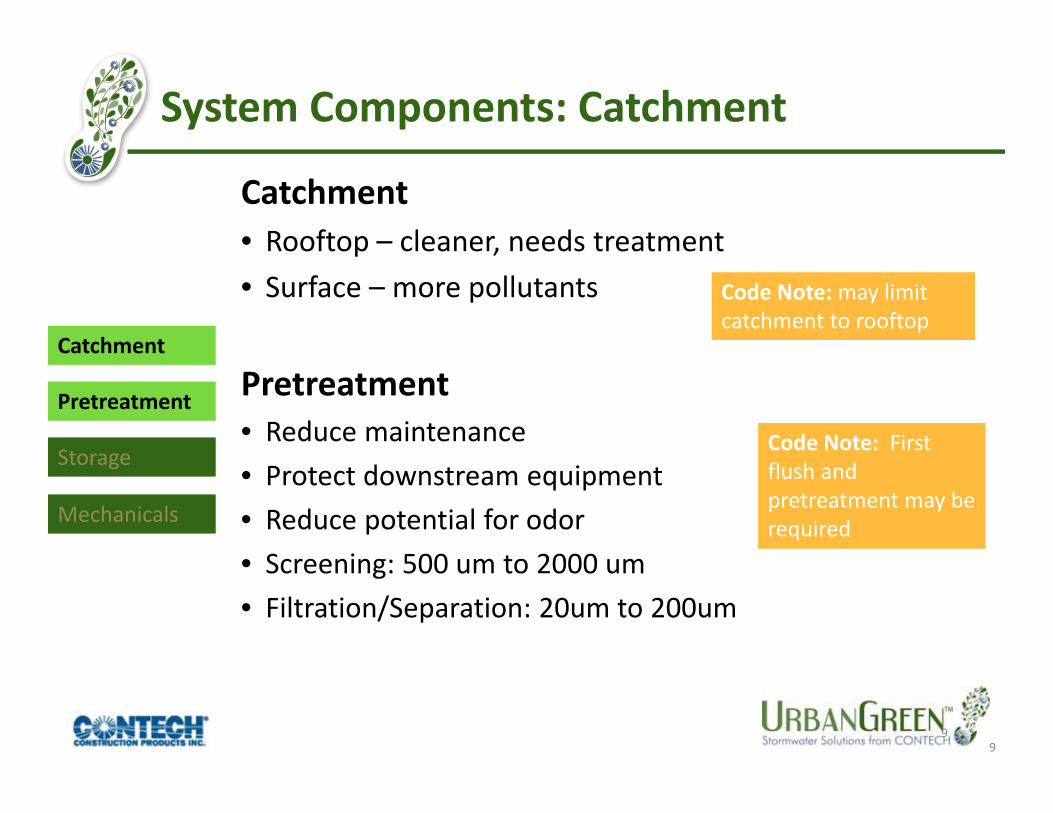
System Components: Catchment
Catchment• Rooftop – cleaner, needs treatment• Surface – more pollutants
Pretreatment • Reduce maintenance• Protect downstream equipment• Reduce potential for odor• Screening: 500 um to 2000 um • Filtration/Separation: 20um to 200um
9
Storage Storage
CatchmentCatchment
MechanicalsMechanicals
Code Note: may limit catchment to rooftop
PretreatmentPretreatment
Code Note: First flush and pretreatment may be required
9
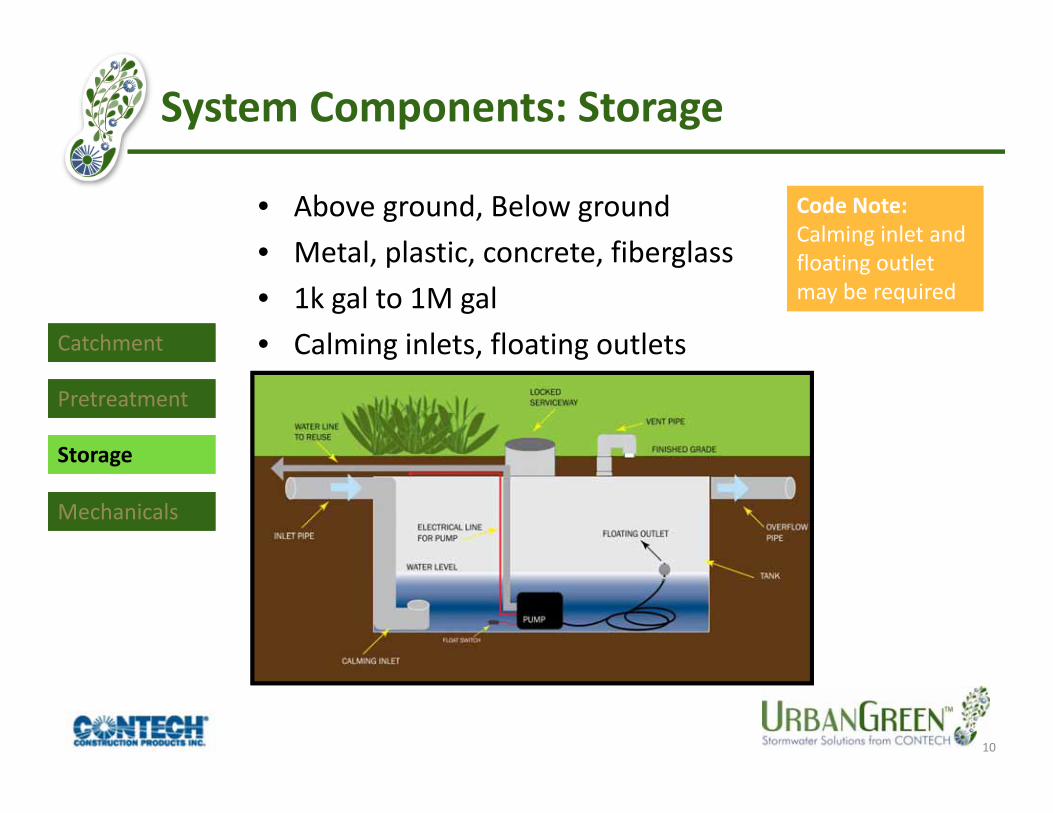
System Components: Storage
• Above ground, Below ground • Metal, plastic, concrete, fiberglass • 1k gal to 1M gal• Calming inlets, floating outlets
10
PretreatmentPretreatment
Storage Storage
CatchmentCatchment
MechanicalsMechanicals
Code Note: Calming inlet and floating outlet may be required

UrbanGreen SRPE Cistern – Decatur, GA

UrbanGreen SRPE Cistern – Seattle, WA

Integrated Mechanical Systems
13
PretreatmentPretreatment
Storage Storage
CatchmentCatchment
MechanicalsMechanicals
Code Note: disinfection may be required – even for irrigation
Code Note: air gap may be required, separate reuse lines required

Mechanical System – Install Location
IndoorSkid Mounted
Outdoor Enclosure
UndergroundVault
14

Calculating Benefits
15
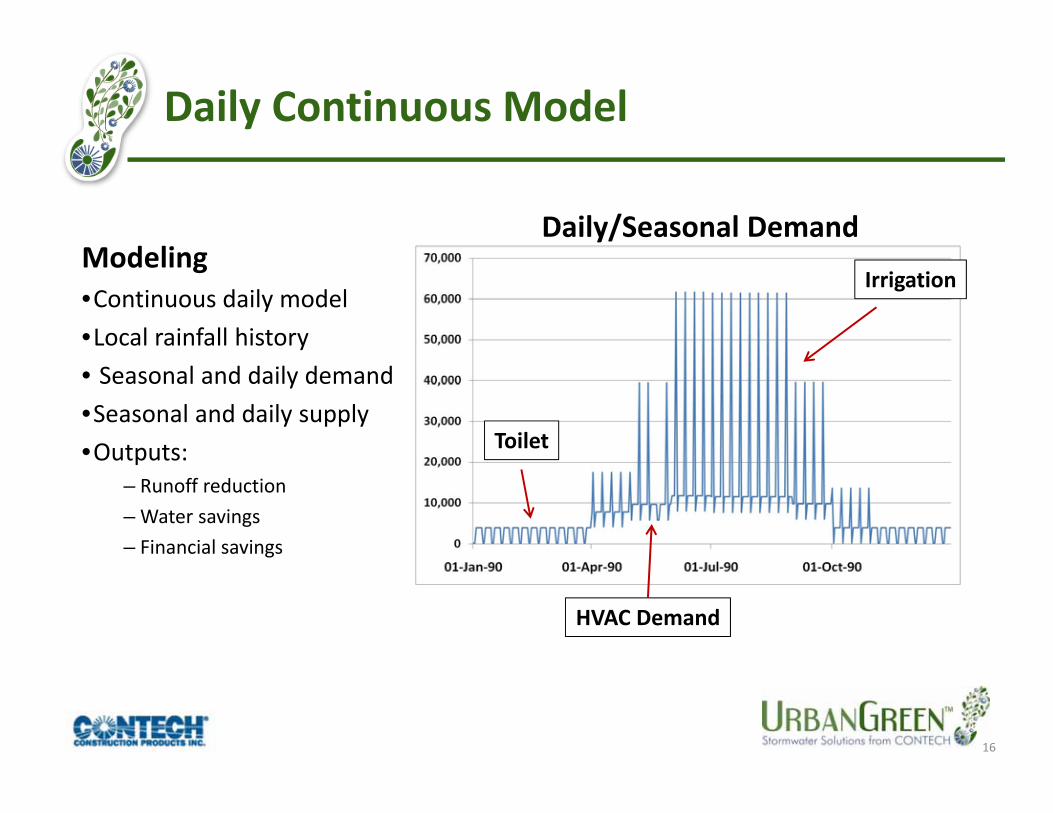
Daily Continuous Model
Modeling•Continuous daily model•Local rainfall history• Seasonal and daily demand •Seasonal and daily supply•Outputs:
– Runoff reduction– Water savings – Financial savings
Daily/Seasonal Demand
HVAC Demand
Toilet
Irrigation
16

Basic Design Information
Info for Feasibility• Project location• Site areas (roof, hardscape, landscape)• Type of development (commercial,
institutional, residential…)
Info for final Design• Application• Instant demand and pressure• Cistern Preference• Mechanical location – inside/outside• Power/Voltage
17
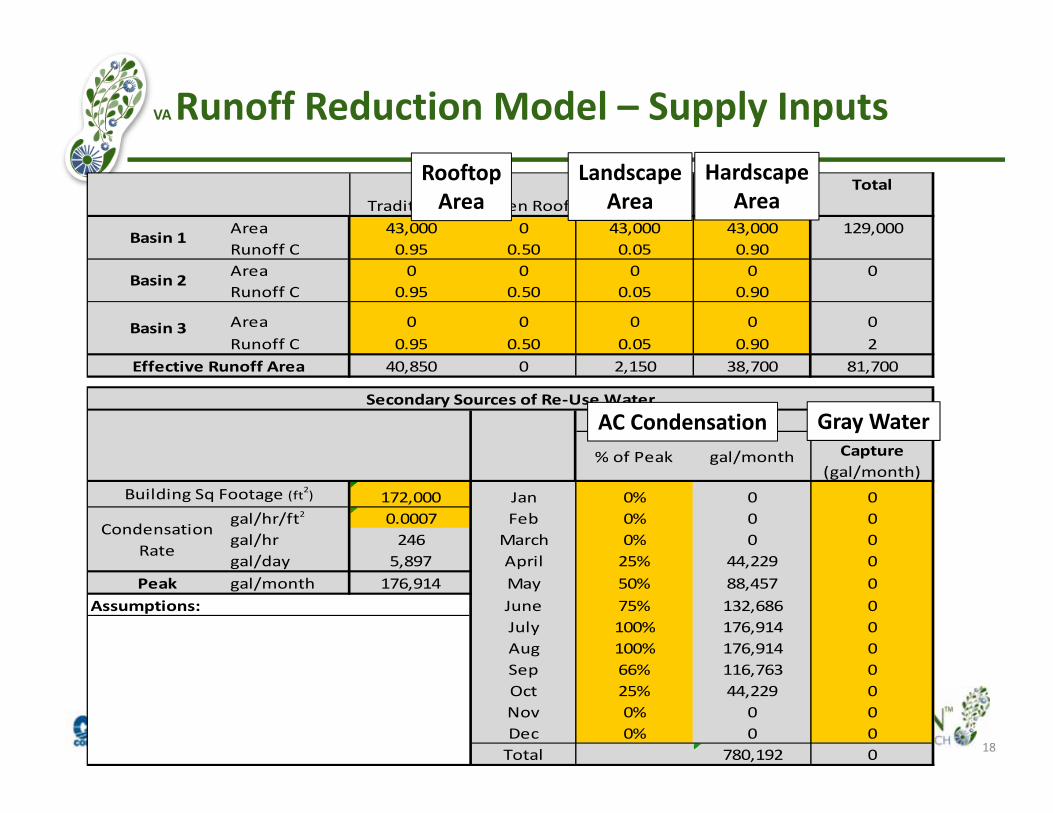
VA Runoff Reduction Model – Supply Inputs
Landscape Hardscape TotalTraditional Green Roof
Area 43,000 0 43,000 43,000 129,000Runoff C 0.95 0.50 0.05 0.90Area 0 0 0 0 0Runoff C 0.95 0.50 0.05 0.90
Area 0 0 0 0 0Runoff C 0.95 0.50 0.05 0.90 2
40,850 0 2,150 38,700 81,700
% of Peak gal/month
172,000 Jan 0% 0 0gal/hr/ft2 0.0007 Feb 0% 0 0gal/hr 246 March 0% 0 0gal/day 5,897 April 25% 44,229 0
Peak gal/month 176,914 May 50% 88,457 0Assumptions: June 75% 132,686 0
July 100% 176,914 0Aug 100% 176,914 0Sep 66% 116,763 0Oct 25% 44,229 0Nov 0% 0 0Dec 0% 0 0Total 780,192 0
Building Sq Footage (ft2)
Condensation Rate
Secondary Sources of Re‐Use Water
Rooftop
Basin 1
Basin 2
Basin 3
AC Condensation Gray Water Capture
(gal/month)
Effective Runoff Area
RooftopArea
LandscapeArea
HardscapeArea
AC Condensation Gray Water
18

Units People/Unit Occupancy GPD/Person Cooling Makeup0 0 100% 8
Weekday Weekend Weekday Weekend3,058 153 1.28 3,914 196
Jan 0.0 0 0Weekday Weekend Weekday Weekend Feb 0.0 0 0
0 0 1.28 0 0 Mar 0.0 0 0 Apr 0.3 6,701 3,939
Weekday Weekend Weekday Weekend May 1.0 26,803 5,718 0 0 1.28 1 0 0 Jun 2.0 53,607 7,878
3,914 196 July 2.0 53,607 7,623 Daily Average Aug 2.0 53,607 7,623 Annual Total Sep 1.0 26,803 5,908
Oct 0.3 6,701 0Loads/Day Gallons/Load Cold Fraction Daily Total Nov 0.0 0 0
Residential 0 40 70% 0 Dec 0.0 0 0Non‐Res 0 0 50% 0 951,518 1,181,640Daily Total 0
Annual Total 0 Area (ft2) Occupancy172,000
0 764Residential 0 0 0Non‐Res 0 0Daily Total 0Annual Total 0
Total Building Space
RetailSchool
Gallons of blow down makeup required per
day
Annual Demand
Inches per weekInput Units
IrrigationArea (ft2)43,000
2,8441,038,177
Total
Toilet
Laundry
OtherVolume( gal per
Daily Demand
Wash Water
Daily Average
Residential
Office/Com
Demand (gal)0
Flushes per day Volume(gal per flush)
Daily Demand
Flushes per day Volume(gal per flush)
Daily Demand
Visitor Flushes (per Visitor)
Office/Com
Retail
VA Runoff Reduction Model – Demand Inputs
ToiletFlushing
Laundry
WashWater
Irrigation CoolingMakeup
19

Include? Area/Volume Include? Annual Volumeyes 40,850 no 0
7 no 0 no 00.00 40,850 no 02.00 no 0 yes 1,065,433
no 0 no 00 1,065,433
WA DC Dulles
Cistern Size (gallons) 50,000
Rooftop ( effective ft2)Surface (effective ft2)
Total (ft2)Irrigation
LaundryWash water
Location
First Flush Bypass (in)Design Storm (in)
ToiletStormwater
ScondaryAC Condensate (ga l lons)Gray Water (ga l lons )
Total (ga l )
ApplicationSource
Cooling MakeupTotal
DemandSupply
Years Modeled
VA Runoff Reduction Model – Scenario 1
User Variables• Dulles Rain Data 1990‐1996 (avg 45in, max 58in)
• Supply Sources: Rooftop ~1.1M gal/yr• Demand Sources Irrigation ~ 1M gal/yr• Cistern Size 50,000 gal• First Flush Bypass No• Design Storm 2”• Water Rates $0.003 water, $0.009 sewer
20

VA Runoff Reduction Model – Scenario 1
Runoff Reduction52%570,000 gal/year
Water Savings53%560,000 gal/year
Financial Savings$6,800/yr
Include? Area/Volume Include? Annual Volumeyes 40,850 no 0
7 no 0 no 00.00 40,850 no 02.00 no 0 yes 1,065,433
no 0 no 00 1,065,433
Total Targeted Targeted Peak Targeted Total Water Rate $0.0030Average 44.7 43.3 1,102,410 36,594 1,102,410 1,139,004 1,065,433 569,011 Sewer Rate $0.009Max 58.1 56.1 1,429,502 64,931 1,429,502 1,478,391 1,065,433 731,307Total 313.1 303.1 7,716,867 256,159 7,716,867 7,973,027 7,458,028 3,983,074
Diameter Length4 5326 236
Average 569,011 52% 561,868 53% 569,011 50% $6,828 8 133Max 731,307 56% 731,307 69% 731,307 55% $8,776 10 85Total 3,983,074 52% 3,933,074 53% 3,983,074 50% $47,797 12 59
WA DC Dulles
Cistern Size (gallons) 50,000
Water Savings
Rooftop ( effective ft2)Surface (effective ft2)
Total (ft2)Irrigation
LaundryWash water
Demand Captured
Runoff Retained (Targeted Rainfall)
Water Savings Total Retained(Targetd, Peak, Secondary)
Savings
Stormwater Total: SW + SecondaryRainfall
Cistern Dimensions
Location
First Flush Bypass (in)Design Storm (in)
ToiletStormwater
ScondaryAC Condensate (ga l lons)Gray Water (ga l lons )
Total (ga l )
ApplicationSource
Cooling MakeupTotal
DemandSupply
Years Modeled
21

VA Runoff Reduction Model – Scenario 1
Scenario 1 – Rooftop Runoff and Irrigation Only
Overflow: Cistern is full in winter, when there is no irrigation demand.
Option: increase cistern (runoff reduction increases from 52% to 60% for 100k gal)
Suggestion: find more demand in winter
Overflow
22

Include? Area/Volume Include? Annual Volumeyes 40,850 yes 1,038,177
7 no 0 no 00.00 40,850 no 02.00 no 0 yes 1,065,433
no 0 no 00 2,103,609
Total Targeted Targeted Peak Targeted Total Water Rate $0.0030Average 44.7 43.3 1,102,410 36,594 1,102,410 1,139,004 2,103,581 999,859 Sewer Rate $0.009Max 58.1 56.1 1,429,502 64,931 1,429,502 1,478,391 2,103,609 1,314,189Total 313.1 303.1 7,716,867 256,159 7,716,867 7,973,027 14,725,069 6,999,011
Diameter Length4 5326 236
Average 999,859 91% 997,755 47% 999,859 88% $11,998 8 133Max 1,314,189 95% 1,301,613 62% 1,314,189 94% $15,770 10 85Total 6,999,011 91% 6,984,284 47% 6,999,011 88% $83,988 12 59
WA DC Dulles
Cistern Size (gallons) 50,000
Water Savings
Rooftop ( effective ft2)Surface (effective ft2)
Total (ft2)Irrigation
LaundryWash water
Demand Captured
Runoff Retained (Targeted Rainfall)
Water Savings Total Retained(Targetd, Peak, Secondary)
Savings
Stormwater Total: SW + SecondaryRainfall
Cistern Dimensions
Location
First Flush Bypass (in)Design Storm (in)
ToiletStormwater
ScondaryAC Condensate (ga l lons)Gray Water (ga l lons)
Total (ga l )
ApplicationSource
Cooling MakeupTotal
DemandSupply
Years Modeled
VA Runoff Reduction Model – Scenario 2
Rooftop Runoff Reduction91%999,000 gal/yr
Water Savings47% Irrigation & Toilet997,000 gal/yr
Potential Savings$12,000/yr
23
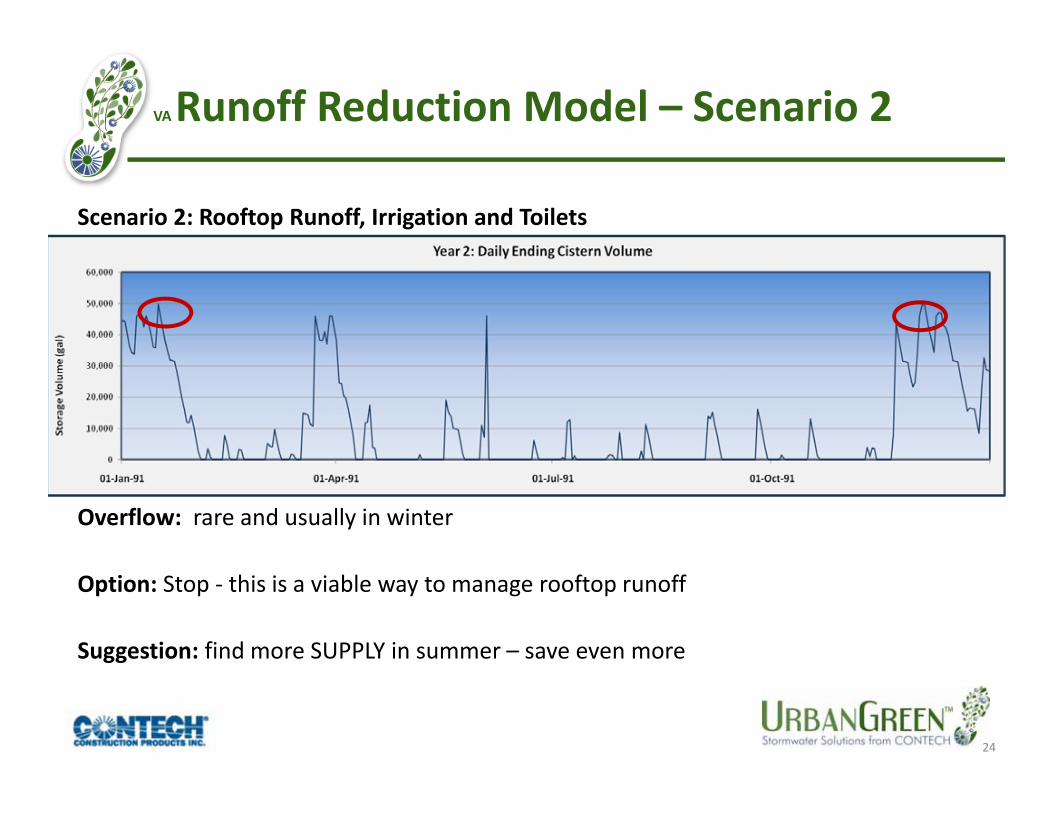
VA Runoff Reduction Model – Scenario 2
Scenario 2: Rooftop Runoff, Irrigation and Toilets
Overflow: rare and usually in winter
Option: Stop ‐ this is a viable way to manage rooftop runoff
Suggestion: find more SUPPLY in summer – save even more
24
Summary
25

VA Water Management: Drinking, Waste, Storm
Wastewater
Evap: 840kBlowdown: 160kCondensate: 750K
2M gal
Commercial Development• 43,000 ft2 roof• 43,000 ft2 parking• 43,000 ft2 landscape• 172,000 ft2 office• 45”/yr
1M gal
Potable100k gal
Toilets
Cooling1M gal
1M gal
Irrigation
Municipal Water
3.1 M gal
Stormwater
45” Annual rainfallRooftop: 1M galSurface: 1M
2M gal
26
Commercial Office Building

VA Water Management: Drinking, Waste, Storm
1.1M gal
Potable100k gal
Toilets
Cooling
1M galIrrigation
1M gal
1M gal
45” Annual rainfallRooftop: 1M galSurface: 1M
27
Commercial Office Building
Re‐Use
SW 500k
1.5M gal
900k
800kMunicipal Water
100k
Evap: 840kBlowdown: 160kCondensate: 750K
900k gal
Wastewater
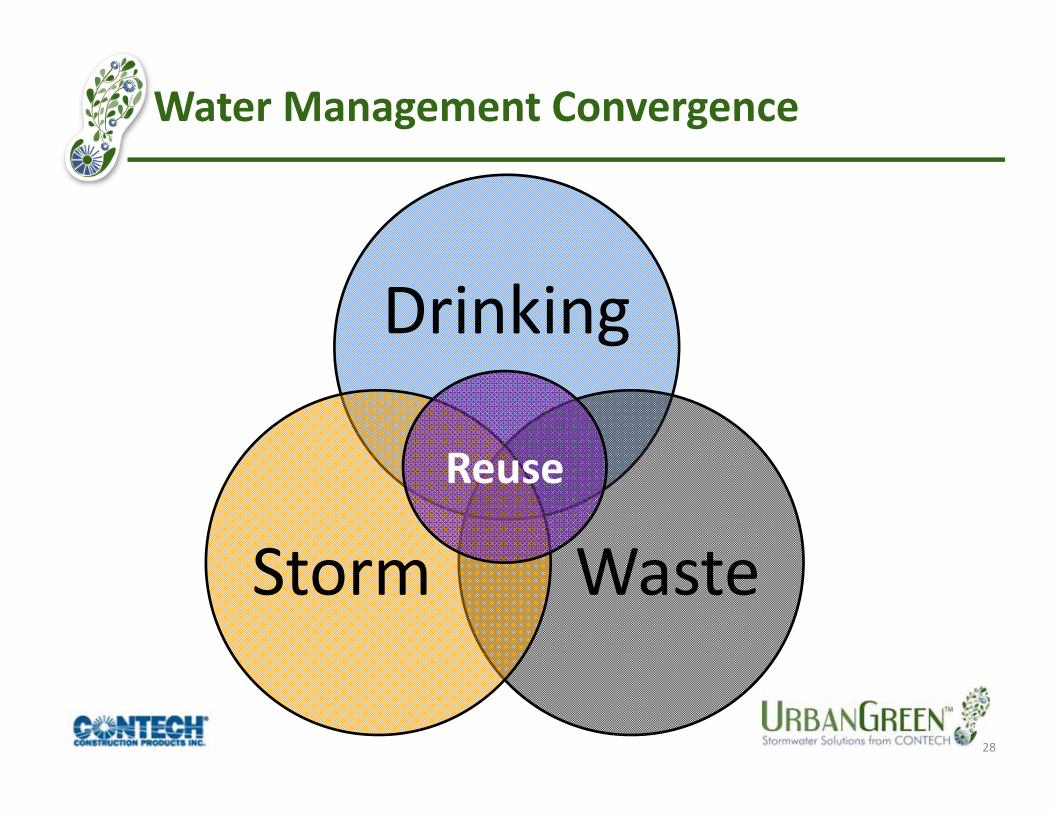
Water Management Convergence
Drinking
WasteStormReuse
28

QUESTIONS?
29