rainfall and potential evapotranspiration patterns and
TRANSCRIPT

RUHUNA JOURNAL OF SCIENCE Vol 9(2): 92-116, December 2018
eISSN: 2536-8400 Faculty of Science
DOI: http://doi.org/10.4038/rjs.v9i2.45 University of Ruhuna
Faculty of Science, University of Ruhuna 92
Rainfall and potential evapotranspiration patterns and
their effects on climatic water balance in the Western
Lithoral Hydrological Zone of Nigeria
E.D. Ashaolu* and K.A. Iroye
Department of Geography and Environmental Management, Faculty of Social Sciences,
University of Ilorin, PMB 1515, Ilorin, Nigeria
*Correspondence: [email protected], ORCID: 0000-0001-5317-2576
Received: 2nd January 2018, Revised: 4th October 2018, Accepted: 7th November 2018
Abstract. This study examined the climatic water balance and aridity in the
Western Lithoral hydrological zone of Nigeria. Monthly climatic data from
1976-2015 collected from six Nigeria Metrological Agency (NIMET)
stations located in Ikeja, Ibadan, Akure, Abeokuta, Osogbo and Ilorin were
used. The climatic variables are rainfall amount, temperature, sunshine
hour, relative humidity and wind speed. The FAO Penman-Monteith
method was adopted in estimating the potential evapotranspiration (PET).
Water balance was determined from PET and rainfall amount. The spatial
and temporal pattern of rainfall amount and PET were evaluated using
universal kriging interpolation method, Mann-Kendall and regression trend
analysis. The results of the Mann-Kendall and regression trend analysis
revealed a statistically significant (Z= 2.74, P= 0.005) upward trend in
rainfall amount between 1976 and 2015. Similarly, a statistically significant
(Z= 4.40, p= 0.001) increasing trend was observed in PET during the same
period. Six months of water surplus (May-October) and six months of water
deficit (November-April) were identified. Overall, 27 years of water deficit
was discovered over the 40 years period. Water balance pattern revealed the
highest annual mean water surplus (324.51 mm) in the hinterland of Idanre,
Akure, and Owo rather than the coastal city of Ikeja which can be attributed
to orographic effect in the hinterland. The study area with a mean Aridity
index (AI) of 0.94 can still be regarded as humid environment, although the
spatial variability of AI indicates that the northern part is tending towards a
dry sub-humid condition (AI= 0.76). This study recommends conservation
of water surplus in the wet months for the augmentation of deficit in the dry
months; this will not only boost agricultural production, but also alleviate
water supply problem in the study area.
Keywords. Aridity index, potential evapotranspiration, water balance.
1 Introduction
Rainfall and evapotranspiration are among the most significant variables that
can be used to determine the cause of climate change and show the level of
https://orcid.org/0000-0001-5317-2576

E.D. Ashaolu and K.A. Iroye Rainfall and evapotranspiration in Nigeria
Ruhuna Journal of Science
Vol 9(2): 92-116, December 2018 93
environmental response to climate change on a basin or regional scale (Yao et
al. 2005, Cannarozzo et al. 2006, Liu et al. 2008). Precipitation and
evapotranspiration represent the volumes of incoming and outgoing water in
the hydrological budget which is believed to be the same in the long run
(Christopherson 1995). This can be seen in term of water balance which
demonstrates the condition of water surplus or deficit at a particular place and
time. Spatial and temporal variability in rainfall amount and
evapotranspiration as a result of global climate change is posing serious
danger to water resources management, rain-fed agriculture, food security and
poverty reduction especially in the developing countries. In fact, by the year
2020, crop yield from countries practicing majorly rain-fed agriculture could
reduce by about 50%, while access to food in sub-Saharan Africa is projected
to be seriously compromised (IPCC 2007).
Evapotranspiration which refers to the combined processes of evaporation
and plant transpiration is a key element in the hydrological budget; it does not
only control the moisture transfer to the atmosphere, but also influence the
principal properties of terrestrial ecosystems such as runoff, soil moisture and
plant growth (Fisher et al. 2011). Evapotranspiration is used in the assessment
of water surplus and deficit among many other components of water balance.
However, in many scenarios, direct field measurement of evapotranspiration
is typically not attainable because it is costly and time-consuming, and often
the required instrumentation may not be available (Ejieji 2011), hence the
adoption of potential or reference evapotranspiration. In a situation, where the
soil is at field capacity, actual evapotranspiration will equal potential
evapotranspiration (PET) and moisture input will exceed potential
evaporation. In such circumstance, the excess rainfall over evapotranspiration
is known as water surplus, while water deficit is represented by the condition
of excess evapotranspiration over rainfall (Egwuonwu et al. 2012). Based on
this premise, this present study assumed that potential evapotranspiration is
equal to actual evapotranspiration and it is used interchangeably.
Penman (1956) defined PET as the amount of water transpired in unit time
by a short green crop, completely covering the ground, of uniform height and
never short of water. However, the deficiency in Penman (1956) definition
resulted to the introduction of reference evapotranspiration (Allen et al. 1998),
which is defined as ‘the rate of evapotranspiration from a hypothetical
reference crop with an assumed crop height of 0.12 m, a fixed surface
resistance of 70 sm-1 and an albedo of 0.23, closely resembling the
evapotranspiration from an extensive surface of green grass of uniform height,
actively growing, well-watered, and completely shading the ground’. PET is
influenced by several factors amongst which include the net solar radiation,
size of surface water bodies, wind speed, type and size of vegetative cover,
availability of soil moisture, reflective land surface, and change in land use/
land cover. For example, land surface characteristics has been altered in most
parts of the world, especially in Africa where larger percentage of the

E.D. Ashaolu and K.A. Iroye Rainfall and evapotranspiration in Nigeria
Ruhuna Journal of Science 94
Vol 9(2): 92-116, December 2018
inhabitants depend solely on primary activities for their survival. It is
important to note that the alteration of land cover by anthropogenic activities
changes the land surface characteristics and influence evapotranspiration
process on regional scale, thus altering the regional hydrological cycle.
Africa is one of the continents most vulnerable to the climate change
phenomenon, and within Africa, Nigeria is one of the countries expected to be
worst affected (Cubasch et al. 2001, ERM 2009 cited in Salami et al. 2010).
The hydrological cycle is anticipated to be amplified in a warming climatic
scenario (IPCC 2007) with increasing surface temperature, changes in
precipitation patterns, and evapotranspiration rate (Ingol-Blanco 2008). For
instance, an increase in temperature and decrease in rainfall amount of about
1.1°C and 81 mm respectively were reported in Nigeria between 1901 and
2005. In fact, the changes in temperature and rainfall in Nigeria differ
significantly since the 1970, with rainfall becoming unpredictable (Bello et al.
2012). These evidences of decreasing rainfall and increasing temperature
suggested the incidence of climate change in Nigeria. Based on the Clausius–
Clapeyron equation, a warmer atmosphere will hold more water and in turn
results to higher evaporation (Fan and Thomas 2012). Therefore, with the
increasing temperature, Nigeria is expected to witness an upward trend in
PET. In addition, any changes in PET will affect precipitation and the
hydrological regimes. This will also have a direct influence on crop
production through changes in the agroecological water balance (Thomas
2000) and availability of soil moisture to meet crop water requirement
(Ayoade 2008).
The change in PET and its direct effects on crop production is responsible
for the changing ecological zones in Nigeria and the advancement of
desertification southwards towards the Western Lithoral hydrological zone
(WLHZ) of the country (Medugu et al. 2009, Olagunju 2015). The change in
the ecological zone of Nigeria can also be attributed to the variability in
climatic condition as a result of the increasing global warming (Olagunju
2015), which has consequently increased the level of aridity that has resulted
to recurring crop failure (Abdulkadir et al. 2015) and water shortages across
Nigeria. The above scenario has also induced a southward migration of
people, particularly herdsmen and their livestock towards WLHZ of Nigeria
(Abdulkadir et al. 2013), and this perhaps might be the reason for the recent
recurring herdsmen and farmers clashes in Nigeria. Thus, the changes in
climatic conditions, coupled with the changes in the ecological zone might
slowly results to the expansion of the aridity zones in Nigeria, which will
significantly impact water availability for competing users.
Aridity is the interplay between rainfall and evapotranspiration which is
usually used to define drought and delineate arid area (Ayoade 2003, Maliva
and Missimer 2012). This relationship is often evaluated using the aridity
index (AI) and it often used to assess the trends of aridity or humidity in an
environment. In a situation where AI is larger than normal in a region, the

E.D. Ashaolu and K.A. Iroye Rainfall and evapotranspiration in Nigeria
Ruhuna Journal of Science
Vol 9(2): 92-116, December 2018 95
climate tends to suffer from drought and water resource shortages (Li et al.
2017). The AI helps to identify, locate or delimit regions that suffer from
water deficit, a situation that can extremely impact the efficient use of land for
agriculture or livestock-farming (Paparrizos et al. 2016). Although the WLHZ
of Nigeria is a humid environment, estimating AI of the area will enhance the
understanding of how fast the study area is changing.
The study area is experiencing rapid population growth and the natural
tropical rainforest has been depleted and replaced with farm lands, built up
areas, paved surfaces, etc. through anthropogenic activities. All the changes
experiencing in the study area will no doubt alter the surface characteristics of
the area which will influence the rainfall and PET pattern, and affect the
climatic water balance of the region. The change in the climatic water balance
will also affect the rain-fed agriculture practices in the study area. Thus,
understanding the spatio-temporal distribution of rainfall and potential
evapotranspiration in a dynamic environment like this will enhance the
understanding of the climatic water balance and aridity level for the purpose
of water resources management, particularly in the area of agricultural
planning.
2 Material and Methods
2.1 The study area
The study area in this investigation, the Western Lithoral hydrological zone
(Figure 1) is one of the eight contiguous hydrological catchments known as
hydrological zones which are the building blocks of all hydrological
evaluations in Nigeria. They serve as units for scientific assessments and
management of water resources in the country (Federal Ministry of Water
Resources [FMWR] 2014). The area comprises of Lagos, Ogun, Oyo, Osun,
Ondo, Edo and Ekiti States lies between longitudes 3°-7°E and between
latitudes 4°-8°N. The population of the study area is about 31 million people
(National Bureau of Statistics 2012). The climate of the area is influenced by
three major wind currents of maritime tropical (mT) air mass, continental
tropical (cT) air mass and equatorial easterlies. This geographic zone has an
annual rainfall of over 1500mm and exhibit double maxima rainfall pattern,
with a dry period of four months in some parts of the region. The annual
rainfall in the area varies from 1,600 mm/year in the southeastern part to
1,000 mm/year in the northern part. About 16% of the total rainfall received
in the region results in runoff, while the remaining is lost through
evapotranspiration (Federal Ministry of Water Resources [FMWR] 2014).
The mean annual temperature of 27°C is fairly constant in the zone and
annual mean relative humidity is about 70%.
E.D. Ashaolu and K.A. Iroye Rainfall and evapotranspiration in Nigeria
Ruhuna Journal of Science 96
Vol 9(2): 92-116, December 2018
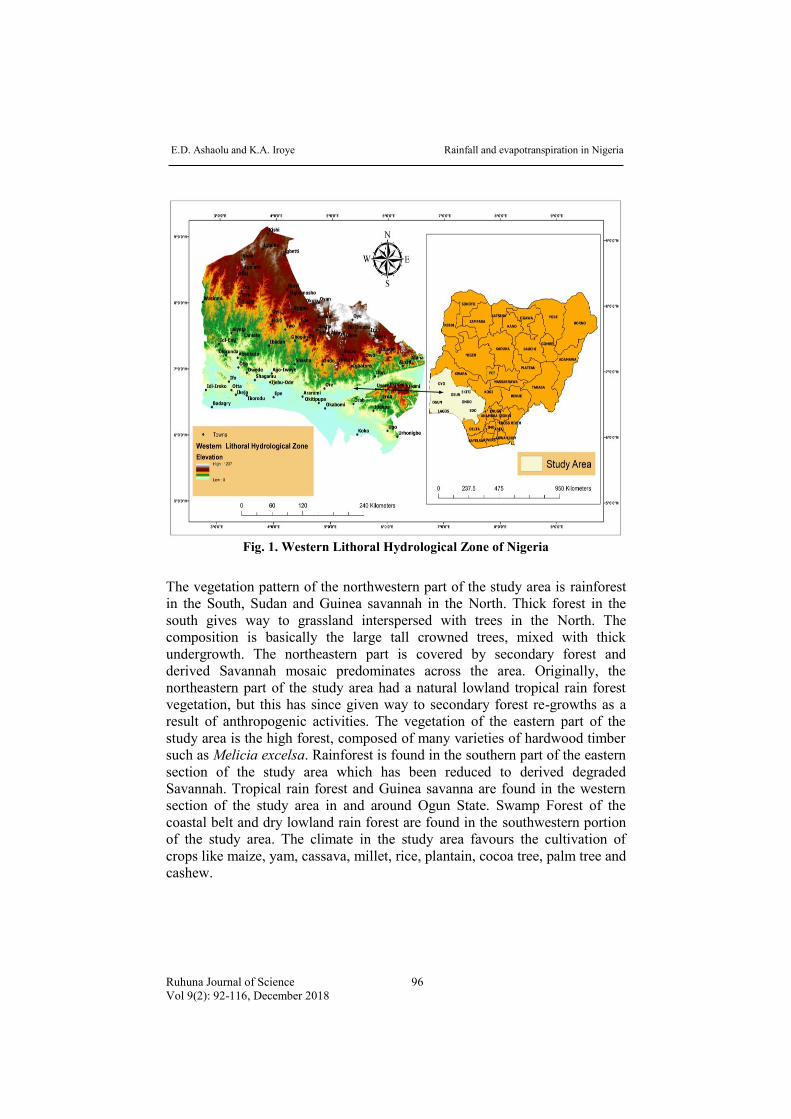
Fig. 1. Western Lithoral Hydrological Zone of Nigeria
The vegetation pattern of the northwestern part of the study area is rainforest
in the South, Sudan and Guinea savannah in the North. Thick forest in the
south gives way to grassland interspersed with trees in the North. The
composition is basically the large tall crowned trees, mixed with thick
undergrowth. The northeastern part is covered by secondary forest and
derived Savannah mosaic predominates across the area. Originally, the
northeastern part of the study area had a natural lowland tropical rain forest
vegetation, but this has since given way to secondary forest re-growths as a
result of anthropogenic activities. The vegetation of the eastern part of the
study area is the high forest, composed of many varieties of hardwood timber
such as Melicia excelsa. Rainforest is found in the southern part of the eastern
section of the study area which has been reduced to derived degraded
Savannah. Tropical rain forest and Guinea savanna are found in the western
section of the study area in and around Ogun State. Swamp Forest of the
coastal belt and dry lowland rain forest are found in the southwestern portion
of the study area. The climate in the study area favours the cultivation of
crops like maize, yam, cassava, millet, rice, plantain, cocoa tree, palm tree and
cashew.

E.D. Ashaolu and K.A. Iroye Rainfall and evapotranspiration in Nigeria
Ruhuna Journal of Science
Vol 9(2): 92-116, December 2018 97
The relief in the northern part of the study area is relatively high with
elevation range between 400-500 m, while the elevation in the remaining part
undulates around 200 m. Two main relief regions may be identified in the
northwestern part of the study area, the first is the inselberg land scape which
is part of the Yoruba highlands, while the second is the coastal plain. The
region of inselberg landscape covers more than half of this part of the study
area. The northeastern part is characterized by numerous domed hills and
occasional flat-topped ridges, and the more prominent hills in this region are
found at llesa, lgbajo, Okemesi, Elu and Oba. The eastern part composed of
lowlands and rugged hills with granitic outcrops in several areas. Undulating
lowlands that belong to the coastal sedimentary rocks of western Nigeria is
found in the western section of the study area.
Soils in the northwestern part of the study area are fertile loamy derived
mainly from the Pre-Cambrian hornblende biotite gneiss. In the forest zone of
the southern parts of the study area, clay, laterite and thick rich dark loamy
and humus soils are found. The soils are frequently water-logged in many
parts during the wet season. Northward, the soils are lighter and become a
mixture of laterite and fine grained loamy and humus materials. The soils of
the northeastern part of the study area belong to the highly ferruginous
tropical red soils associated with basement complex rocks. Older sand ridge
complexes develop brown and orange sandy soils, and light grey sandy soils
are found in the eastern part around the coastal area.
2.2 Methods
Monthly climatic data for 40 years spanning 1976 to 2015 from six NIMET
(Nigeria Metrological Agency) stations located in Ikeja, Ibadan, Akure,
Abeokuta, Osogbo and Ilorin were used in the study. The climatic variables
include rainfall amount, minimum and maximum temperature, sunshine hour,
relative humidity and wind speed. Due to the difficulties in estimating actual
evapotranspiration, the potential evapotranspiration was assumed to be equal
to actual evapotranspiration in the study area. Thus, this study viewed
evapotranspiration from the point of field capacity where potential
evapotranspiration always equates actual evapotranspiration. The FAO
Penman-Monteith method as used by Allen et al. (1998) was adopted in
estimating the potential evapotranspiration (PET). The method was selected
because it is physically based and clearly incorporates both physiological and
aerodynamic parameters. It is regarded as the most reliable predictor of PET
rates under all climatic conditions (Jensen et al. 1990). Thus, the ETo
calculator version 3.2 of FAO was used to compute PET in this study. The
details of the ETo calculator may be found in the reference manual by Raes
(2012) and is computed from the equation (1),

E.D. Ashaolu and K.A. Iroye Rainfall and evapotranspiration in Nigeria
Ruhuna Journal of Science 98
Vol 9(2): 92-116, December 2018
2
2
9000.408 ( ) (e e )
273(1 0.34u )
n s a
o
R G uTET
where, ETo= reference evapotranspiration (mm day-1), Rn= net radiation at the
crop surface (MJ m-2day-1), G= soil heat flux density (MJ m-2day-1), T= mean
daily air temperature at 2m height (℃), u2= wind speed at 2 m height (ms-1),
es= saturation vapour pressure (kPa), ea= actual vapour pressure (kPa), ∆=
slope vapour pressure curve (kPa ℃-1), and γ= psychrometric constant
(kPa℃-1).
The rainfall amount and PET for the period 1976 to 2015 in each of the six
weather stations were aggregated to find the mean annual rainfall and PET for
the study area, while the estimated mean annual and monthly PET were
subtracted from mean annual and monthly rainfall data to estimate the annual
and monthly mean water balance for the study period. The study assumed
there had been no moisture carry-over from previous months, for example,
from October to November (Owoade 1989). Hence, water balance for each
month were estimated by subtracting the mean PET from mean rainfall
amount in each month. The estimated water balance was interpolated using
universal kriging method in ArcGIS 10.4 to determine their spatial pattern in
the study area. The kriging interpolation method was adopted because studies
such as Chong-yu et al. (2006), Zhifeng et al. (2011) and Tesfamichael et al.
(2013) have shown that the technique yields better results than other
interpolation methods such as Inverse Distance Weighted (IDW) and Thiessen
polygon among many others. Three spatial pattern maps were generated
which include the mean annual water balance, the mean monthly water deficit
(November-April) and the mean monthly water surplus map (May-October).
The trend in rainfall amount, PET estimated water balance, AI were
determined from the non-parametric Mann-Kendall trend test statistics and
regression statistics; this enables the comparison of results from the two
methods. The null hypothesis in the Mann-Kendall test is that the data are
independent and randomly ordered. This test does not require the assumption
of normality, and only shows the direction but not the magnitude of
significant trends (McBean and Motiee 2008, Olofintoye and Sule 2010). The
Mann-Kendall test statistic S is calculated using the formula in equations (2)
and (3),
1
1 1
n n
j kk j k
S Sgn x x
where xj and xk are the annual values in years j and k, j>k, respectively and
(1)
(2)

E.D. Ashaolu and K.A. Iroye Rainfall and evapotranspiration in Nigeria
Ruhuna Journal of Science
Vol 9(2): 92-116, December 2018 99
(7) CV =
1 0
0 0
1 0
j k
j k j k
j k
if x x
Sgn x x if x x
if x x
A very high positive value of S is an indicator of an increasing trend, while a
very low negative value indicates a decreasing trend. However, it is necessary
to compute the probability associated with S and the sample size n, to
statistically quantify the significance of the trend (Khambhammettu 2005,
Olofintoye and Sule 2010); the computation of variance of S is from equation
(4).
1
1( ) 1 2 5 1 2 5
18
q
p p pp
VAR s n n n t t t
Here q is the number of tied groups and tp is the number of data values in the
pth group. The values of S and VAR(S) are used to compute the test statistic Z
as shown in equation (5).
10
(S)
0 0
10
(S)
Sif S
VAR
Z if S
Sif S
VAR
Z follows a normal distribution. The Z value is tested at 95% level of
significance (Z0.025=1.96). The trend is said to be decreasing if Z is negative
and the absolute value is greater than the level of significance, while it is
increasing if Z is positive and greater than the level of significance. If the
absolute value of Z is less than the level of significance, there is no trend
(Khambhammettu 2005, Olofintoye and Sule 2010). In addition, the
regression statistics model for determining trend was computed from equation
(6),
tXY a b
where Y is the trend value, a is the intercept, b is the slope of trend and Xt is
the time point coded. Also, the descriptive statistics such as mean and
standard deviation were used to describe the data set. The coefficient of
variation (CV) was adopted to show the percentage of variability in the PET
and rainfall amount. The CV is calculated using the formula in equation (7).
100SD
X
The Aridity index (AI) for the study area was computed using the rainfall and
PET data from the six stations used in this study. The AI for each of the
(3)
(4)
(5)
(6)

E.D. Ashaolu and K.A. Iroye Rainfall and evapotranspiration in Nigeria
Ruhuna Journal of Science 100
Vol 9(2): 92-116, December 2018
(8)
weather station were aggregated to find the annual aridity for the study area
between 1976-2015, and the same data was used to estimate the spatial
distribution of aridity in the study area using universal krigging interpolation
method in ArcGIS 10.4. The AI in the study area is estimated using equation
(8),
ARAI
APET
where AR is the mean annual rainfall amount, and APET is the annual
potential evapotranspiration. The aridity classification for various level of
aridity is displayed in Table 1.
Table 1. Aridity Classification.
Classification Aridity Index (AI)
Hyper-arid AI ≤ 0.05
Arid 0.05 ≤ AI < 0.20
Semi-arid 0.20 ≤ AI < 0.50
Dry sub-humid 0.50 ≤ AI < 0.65
Sub-humid 0.65 ≤ AI < 0.80
Humid 0.80 ≤ AI < 1.5
Very humid 1.5 ≤ AI
Source: FAO, 1993
3 Results and Discussion
3.1 Rainfall amount and potential evapotranspiration in the study area
The highest mean monthly rainfall amount (228.09 mm) was recorded in
June, then followed by month of September (219.10 mm), while the lowest
(9.23 mm) was in January (Table 2). The results of the coefficient of variation
shows that the mean monthly rainfall amount in the study area were
homogeneous, except in February (34.10%) and March (20.14%) that are
slightly varied. These results can be attributed to the fact that February and
March falls within the peak period of dry season in the study area. The
variation in monthly pattern of rainfall amount in the study area may not be
unconnected with the movement and location of the Intertropical Convergent
Zone (ITCZ) that governs rainfall occurrence in Nigeria (Ashaolu 2018). The
highest mean rainfall amount in June can be attributed to the position of ITCZ
over the Tropic of Cancer in June. The months of June and September
recording the highest mean rainfall amount is as a result of the ITCZ passing
over the study area two times in the year. The movement north of the ITCZ
first towards the Tropic of Cancer as well as its return southward towards the
Tropic of Capricorn, explains why rainfall amount in the area varies over
E.D. Ashaolu and K.A. Iroye Rainfall and evapotranspiration in Nigeria
Ruhuna Journal of Science
Vol 9(2): 92-116, December 2018 101
space and time. However, this observed variation might be affected by local
conditions such as vegetation, presence of highlands in the northeastern part
of the study area which might influence the microclimate of such areas. The
lowest mean rainfall amount observed in January may not be unconnected
with the movement south of ITCZ to the Tropic of Capricorn, which is
responsible for the study area experiencing little or no rainfall at this period of
the year. This agrees with the NIMET (Nigeria Metrological Agency) findings
(2013, 2012) on the rainfall pattern in Nigeria.
Table 2. Monthly pattern of rainfall and potential evapotranspiration (PET) in the
study area (1976-2015).
Mean (mm) SD (mm) CV (%)
Rainfall PET Rainfall PET Rainfall PET
January 9.23 143.45 0.96 18.87 10.40 13.15
February 33.28 147.69 11.35 16.21 34.10 10.98
March 75.09 156.84 15.12 17.9 20.14 11.41
April 127.88 145.80 15.20 11.19 11.89 7.67
May 172.14 129.99 3.24 8.93 1.88 6.87
June 228.09 109.82 29.01 7.28 12.72 6.63
July 203.18 94.95 18.76 4.51 9.23 4.75
August 149.68 92.74 18.04 4.59 12.05 4.95
September 219.10 101.37 19.41 2.52 8.86 2.49
October 167.65 115.22 11.75 4.47 7.01 3.88
November 44.18 128.20 8.98 7.82 20.33 6.10
December 10.67 132.16 1.84 13.88 17.24 10.50
SD= Standard Variation, CV= Coefficient of Variation
The highest mean monthly PET (156 mm) was recorded in March, while the
lowest mean PET (92.74 mm) was recorded in August (Table 2). The highest
mean PET in March can be attributed to the dominance of the tropical air
mass at this period of the year which is also the dry season in most part of the
study area. The high PET in this period may not be unconnected with the
dusty air mass that carries no moisture. Iroye (2013) has earlier reported high
evapotranspiration rate in the dry period in Ilorin, a location which bounded
the study area in the north. The results of the coefficient of variation shows
that monthly PET is homogeneous, except in January (13.15%) and March
(11.41%) which are slightly higher than the other months during the study
period.
Trend in rainfall amount (1976-2015)
Table 3 reveals the nature of rainfall trends in Abeokuta, Ibadan, Ikeja and
Osogbo which shows positive values. The Z values obtained for these stations
which shows greater values than the level of significance (1.96) indicates that
the increasing trend in rainfall amount observed in those locations are

E.D. Ashaolu and K.A. Iroye Rainfall and evapotranspiration in Nigeria
Ruhuna Journal of Science 102
Vol 9(2): 92-116, December 2018
statistically significant. This implies that the positive trends demonstrated at
these stations have an underlying causative factor(s). It can therefore be
ascertained, based on the evidence at hand (1976-2015) that the rainfall
amount in Abeokuta, Ibadan, Ikeja and Osogbo would increase into the future.
On the other hand, the increasing trend in rainfall amount in Akure and the
decreasing trend in Ilorin are not statistically significant. The results signify
that the positive and negative trends observed in Akure and Ilorin,
respectively occurred by chance and cannot be associated to a particular
factor. Thus, the near future direction of rainfall amount in these two locations
cannot be predicted based on the records used in this study.
Table 3. Trends in rainfall amount in the Western Lithoral hydrological zone of
Nigeria (1976-2015).
Methods SN Stations S Z Q
Trend
Significance
Nature of
Trend
Ma
nn
-Ken
da
ll
1 Abeokuta* 221.00 3.12 13.76 Significant Positive
2 Akure 138.00 1.60 5.52 NS Positive
3 Ibadan 182.00 2.11 10.12 Significant Positive
4 Ikeja 265.00 3.08 13.80 Significant Positive
5 Ilorin -34.00 -0.38 -1.11 NS Negative
6 Osogbo 170.00 1.97 6.05 Significant Positive
Study Area 236.00 2.74 7.34 Significant Positive
Lin
ear
Reg
ress
ion
SN Weather
Variables
P-
value
Regression
equation
Sample
correlation
Trend
Significance
R2
(%)
1 Abeokuta* .002 Y=1018.21+12.81X .496 Significant 2
2 Akure .613 Y=1618.10+1.84X .082 NS 0.7
3 Ibadan .048 Y=1166.60+8.07X .315 Significant 9
4 Ikeja .001 Y=1276.40+13.89X .522 Significant 27
5 Ilorin .987 Y=1166.80-0.05X -.003 NS 0.001
6 Osogbo .050 Y=1254.90+5.21X .312 Significant 9
Study Area .005 Y=1273.90+5.91X .434 Significant 19
*Abeokuta record covers only 1981-2015; Z= normalized test statistic; Q= Sen Slope estimate; NS= Not
significant
The result of the linear regression presented in Table 3 further strengthen the
results of the Mann-kendall trend analysis. The result of the regression shows
that there is a statistically significant positive relationship between rainfall
amount and year at 95 % confidence level in Abeokuta (p = 0.002), Ibadan
(p= 0.048), Ikeja (p= 0.001) and Osogbo (p= 0.50). Non-significant increasing
trend was however observed in Akure (p= 0.613), while a non-significant
decreasing trend was observed in Ilorin (p=0.987). The regression equation,
E.D. Ashaolu and K.A. Iroye Rainfall and evapotranspiration in Nigeria
Ruhuna Journal of Science
Vol 9(2): 92-116, December 2018 103
revealed that rainfall amount increased at a rate of 12.81 mm/year in
Abeokuta during the period 1981 to 2015. Rainfall amount also increased at a
rate of 1.84 mm/year in Akure; 8.07 mm/year in Ibadan; 13.88 mm/year in
Ikeja and 5.42 mm/year in Osogbo between 1976 and 2015. However, rainfall
amount decreased at the rate of 0.05 mm/year in Ilorin during the same
period.
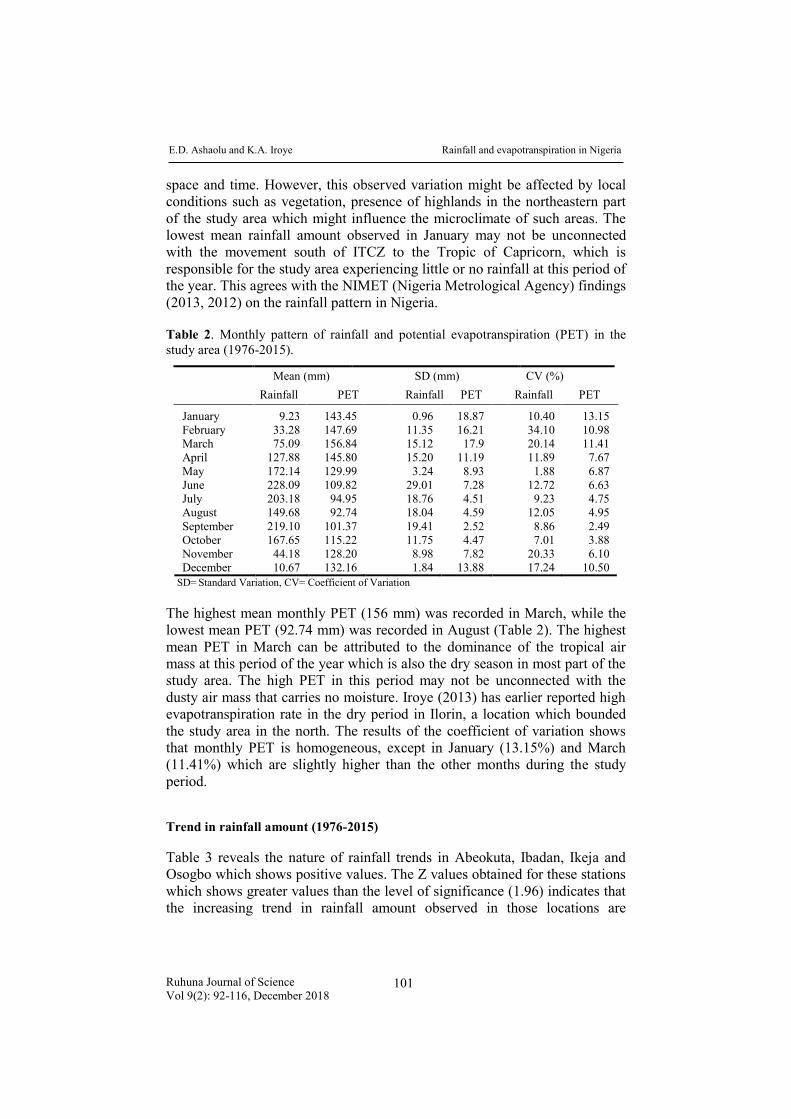
The aggregated rainfall amount for the Western Lithoral hydrological zone
(WLHZ) exhibits an increasing trend over the study period with Z value of
1.97 which is greater than the 1.96 level of significance. This indicates a
statistically significant increasing trend in rainfall amount in the study area
(Table 3). The linear regression analysis also confirmed the statistically
significant (p = 0.005) positive relationship between rainfall amount and year
at 95% confidence level in the area. The trend line equation revealed that
rainfall amount increased at the rate of 5.91 mm/year in the study area
between 1976 and 2015 (Figure 2). This result is at variant with the study of
Oriola et al. (2017) who observed a downward trend of about 6.99 mm/year in
rainfall amount of Niamey in Niger Republic. This is anticipated as Niamey is
located in Sahel environment.
Fig. 2. Trends in rainfall amount and potential evapotranspiration (PET) in the
Western Lithoral Hydrological Zone of Nigeria, 1976-2015.

E.D. Ashaolu and K.A. Iroye Rainfall and evapotranspiration in Nigeria
Ruhuna Journal of Science 104
Vol 9(2): 92-116, December 2018
Trend in potential evapotranspiration
Positive PET trends were observed in Abeokuta, Akure, Ikeja and Ilorin,
which is an indication of an increasing PET (Table 4). The Z-values obtained
in these stations suggested a statistically significant increasing trend that can
be attributed to causative factor(s). Such factors may not be unconnected to
the duration of sunshine hour, wind speed and relative humidity which have
significant impact on PET than the air temperature (Gao et al. 2006). Based
on the evidence at hand (1976-2015), it can be ascertained that PET in
Abeokuta, Akure, Ikeja and Ilorin would continue to increase in the future. On
the other hand, the positive PET in Ibadan with Z-value of 1.20 indicated an
increasing trend that is not statistically significant, while in Osogbo, the
downward trend in PET is not statistically significant. Thus, the evidence at
hand (1976-2015) is not enough to ascertain the future trend in PET in Ibadan
and Osogbo.
Table 4: Trend in potential evapotranspiration in the Western Lithoral hydrological
zone of Nigeria (1976-2015).
Methods SN Stations S Z Q
Trend significance
Nature of trend
Man
--K
end
all 1 Abeokuta* 316.00 4.47 5.13 Significant Positive
2 Akure 357.00 4.15 1.77 Significant Positive 3 Ibadan 104.00 1.20 1.51 NS Positive 4 Ikeja 331.00 3.85 4.26 Significant Positive 5 Ilorin 289.00 3.36 4.49 Significant Positive 6 Osogbo -39.00 -0.44 -0.32 NS Negative
Study Area 380.00 4.42 2.77 Significant Positive
Lin
ear
Reg
ress
ion SN
Weather Variables
P-value Regression equation
Sample correlation
Trend Significance
R2 (%)
1 Abeokuta* .001 Y=1322.20+5.36X .716 Significant 51.30 2 Akure .001 Y=1244.90+3.74X .631 Significant 39.8 3 Ibadan .275 Y=1502.70+1.46X .177 NS 3.12 4 Ikeja .001 Y=13989 + 4.32X .608 Significant 36.99 5 Ilorin .002 Y=1757.90+3.89X .482 Significant 23.24 6 Osogbo .604 Y=1427.70-0.05X -.084 NS 0.71
Study Area .001 Y=1448.80+2.77X .633 Significant 40
*Abeokuta record covers only 1981-2015; Z= normalized test statistic; Q= Sen Slope estimate; NS= Not
significant
The results obtained from the regression trend (Table 4) further reinforced the
observed trend in PET in the six locations estimated with the Mann-Kendall
trend statistics. The results of the non-significant trend in Osogbo is an
indication of uncertainty in the future direction of PET in the area, hence, an

E.D. Ashaolu and K.A. Iroye Rainfall and evapotranspiration in Nigeria
Ruhuna Journal of Science
Vol 9(2): 92-116, December 2018 105
upward trend might occur in Osogbo in the future. However, the decreasing
PET rates as observed in Osogbo will not only increase availability of soil
water but will also encourage the growth of natural vegetation. If the trend
observed in rainfall and PET remain unchanged, agricultural activities,
particularly in Akure and Ilorin may be adversely affected by shortage of
water in the growing season. Also, the increasing trend in rainfall and PET in
Ikeja and Abeokuta will have both positive and negative effect in those two
locations depending on the amount of rainfall in relation to PET. The
regression equation shows that PET increased at the rate of 5.36 mm/year in
Abeokuta during the period 1981 to 2015. PET is also increasing at the rate of
3.74 mm/year in Akure; 1.46 mm/year in Ibadan; 4.32 mm/year in Ikeja; and
3.89 mm/year in Ilorin between 1976 and 2015, while it decreased at the rate
of 0.51 mm/year in Osogbo during the same period (Table 4).
The aggregated PET for the WLHZ exhibits an increasing trend over the
period of study. The Z-value was 4.42 which indicated a statistically
significant upward trend in PET amount in the study area (Table 5). The linear
regression analysis also suggested a statistically significant (p<0.001) positive
relationship between PET and year at 95 % confidence level in the study area.
The regression equation revealed that PET increased at the rate of 2.77
mm/year in the study area between 1976 and 2015 (Figure 2).
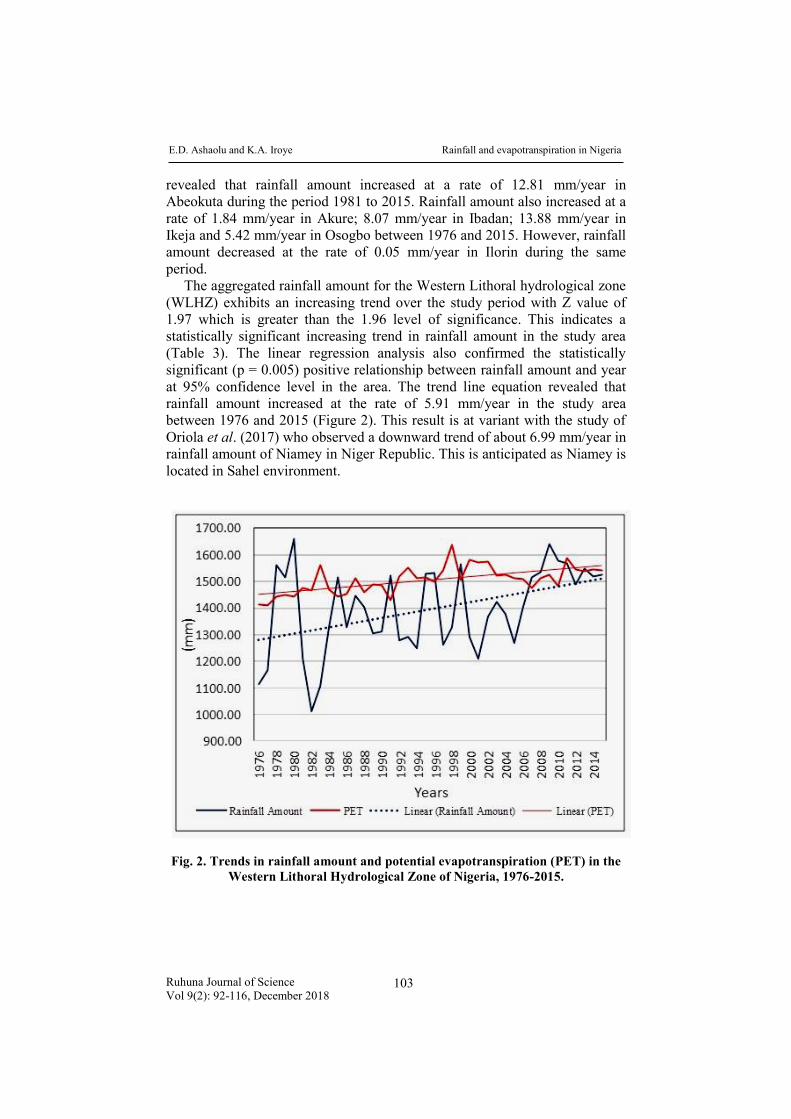
3.2 Climatic water balance in the study area (1976-2015)
Figure 3 shows the water balance graph for the study area between 1976 and
2015. The figure revealed that the mean monthly rainfall is higher than the
mean monthly PET in the study area from May to October (six months), while
the mean monthly PET is higher than the mean monthly rainfall from
November to April (six months). The implication of this is that water
availability is at surplus for six months and at deficit for the same period of
time. The six months of water surplus is also the cultivation season in the
study area. A similar pattern was observed by Iroye (2013) on water budget
situation in Ilorin, Nigeria. The six months with high PET coincide with dry
season in the study area when insolation is high and relative humidity is low
compared to the rainy season when insolation is low and relative humidity is
high (Ayoade 2003). The water scenario in the study area is like a two-sided
coin with positive and negative implications, while the six months of water
surplus may positively influence agricultural practices and increase the
income of local famers in most of the rural settlements on the one hand, the
surplus moistures condition may also negatively influence hydrological
processes in the area through flood generation with all its attendant problems.
Also, the six months of water deficit will not only affect peasant farmer
operations but also affect groundwater resources of the study area. For
example, reduced soil moisture may lead to crop failure, while reduced
E.D. Ashaolu and K.A. Iroye Rainfall and evapotranspiration in Nigeria
Ruhuna Journal of Science 106
Vol 9(2): 92-116, December 2018
recharge will lead to a significant drop in groundwater level which is the
source of domestic water consumption for most of the rural dwellers and a
large percentage of the urban residents in the study area. The relationship
between mean monthly rainfall and PET in the Western Lithoral hydrological
zone between 1976 and 2015 is as depicted in Figure 3.
Fig. 3. Relationship between monthly rainfall and potential evapotranspiration
in the Western Lithoral Hydrological Zone of Nigeria (1976-2015).
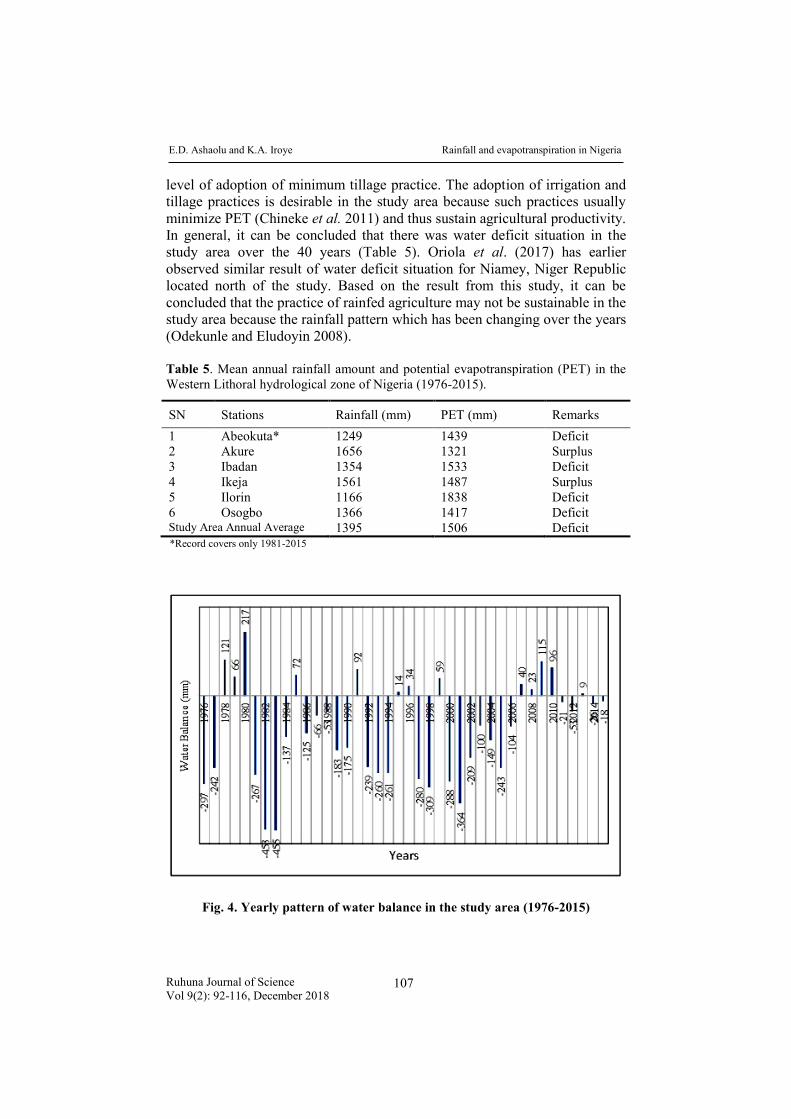
The aggregated mean annual rainfall amount for the study area from the six
weather stations is 1395 mm, while the mean annual PET is 1505mm between
1976 and 2015 (Table 5). Four out of the six stations used in this study
(Abeokuta, Ibadan, Ilorin, and Osogbo) had water deficit, while two stations
(Akure and Ikeja) had water surplus. The highest water surplus (217 mm) was
observed in 1980, while the lowest (8 mm) was in 2013. The year 1983
witnessed the highest water deficit situation (-455 mm), while the lowest (-18
mm) was in 2015 (Figure 4). Between 1976 and 1985, 4 periods (1978, 1979,
1980 and 1985) of water surplus were observed, while only two period (1991
and 1995) of water surplus were observed between 1986 and 1995. In like
manner, two period (1996 and 1991) of water surplus were observed between
1996 and 2002, while 5 periods (2007, 2008, 2009, 2010 and 2013) of water
surplus were observed in the last 10 years covered by this investigation.
Overall, 13 years of water surplus were discovered, while the remaining 27
years were period of water deficit. This result shows water deficit of about
68% of the total period of investigation. The long period of water deficit
situation can be aggravated by the farmers’ in the region because of their low
E.D. Ashaolu and K.A. Iroye Rainfall and evapotranspiration in Nigeria
Ruhuna Journal of Science
Vol 9(2): 92-116, December 2018 107
level of adoption of minimum tillage practice. The adoption of irrigation and
tillage practices is desirable in the study area because such practices usually
minimize PET (Chineke et al. 2011) and thus sustain agricultural productivity.
In general, it can be concluded that there was water deficit situation in the
study area over the 40 years (Table 5). Oriola et al. (2017) has earlier
observed similar result of water deficit situation for Niamey, Niger Republic
located north of the study. Based on the result from this study, it can be
concluded that the practice of rainfed agriculture may not be sustainable in the
study area because the rainfall pattern which has been changing over the years
(Odekunle and Eludoyin 2008).
Table 5. Mean annual rainfall amount and potential evapotranspiration (PET) in the
Western Lithoral hydrological zone of Nigeria (1976-2015).
SN Stations Rainfall (mm) PET (mm) Remarks
1 Abeokuta* 1249 1439 Deficit
2 Akure 1656 1321 Surplus
3 Ibadan 1354 1533 Deficit
4 Ikeja 1561 1487 Surplus
5 Ilorin 1166 1838 Deficit
6 Osogbo 1366 1417 Deficit Study Area Annual Average 1395 1506 Deficit *Record covers only 1981-2015
Fig. 4. Yearly pattern of water balance in the study area (1976-2015)

E.D. Ashaolu and K.A. Iroye Rainfall and evapotranspiration in Nigeria
Ruhuna Journal of Science 108
Vol 9(2): 92-116, December 2018
Fig. 5. Mean monthly pattern of water deficit in the study area (November -
April)
Pattern of mean monthly water deficit (November-April)
Figure 5 shows the spatial variation in mean monthly water deficit across the
study area. The highest deficit (-92 mm) was observed in November in
settlements such as Kishi, Ogboro, Shaki and Ofiki located in the northwest,
while the lowest deficit (-39 mm) were observed in southeastern settlements
that include Urhonigbe, Ewonimi and Uromi. The highest deficit (-143 mm)
in December was in the northwestern part of the study area in settlements like
Ago Are, Shaki and Agbonle, while the lowest deficit (-92 mm) was at the
fringe of the southeastern part in settlements such as Oben, Urhonigbe and
Ugo, etc. The highest deficit (-162 mm) in January was in the northwestern
part in settlements such as Agbonle, Kishi and Ogbooro, etc., while the lowest
deficit (-100 mm) was recorded at the fringe of the southeastern part in

E.D. Ashaolu and K.A. Iroye Rainfall and evapotranspiration in Nigeria
Ruhuna Journal of Science
Vol 9(2): 92-116, December 2018 109
settlements such as Ewonimi, Ubiaju, Uromi and Ekpon. The deficit recorded
in February and March follow similar pattern to the other months with water
deficit, although with varying spatial coverage (Figure 5).
Although, there are water deficit (-55 mm) in the extreme northwestern part
in April, larger portion of the study area recorded a very low water surplus.
Some parts experiencing surplus in April is because this month marks the
beginning of rainy season in most parts of the study area, although rainfall
during this period is sporadic and unpredictable. For example, a surplus of 19
mm was recorded at the southeastern part of the study area in settlements that
include Urhonigbe, Ewonimi and Ubiaju. This indicates that more rainfall was
recorded in these settlements in April compared to other settlements during
the period of investigation.
The highest water deficit in northwestern part of the study area may not be
unconnected with the duration of sunshine hour, and low rainfall amount. This
condition is also being aggravated by the nature of land use/land cover in the
area. The water deficit in the six months period is no doubt posing serious
implications on socioeconomic activities of residents of the rural communities
within the hydrological zone. These are people whose livelihood are majorly
based on subsistence arable agriculture and livestock rearing. Also, the
changes in rainfall amount which is lower than the observed PET in the six
months of deficits will pose serious hydrological implications in the region
depending on other prevailing environmental conditions. According to Chen
et al. (2006), generally, any changes in PET rates influences the terrestrial
ecosystem, particularly the crop production. Other effects that can be
manifested by water deficit situation in the study area include hunger,
malnutrition, and deterioration of soil moisture and water resources.
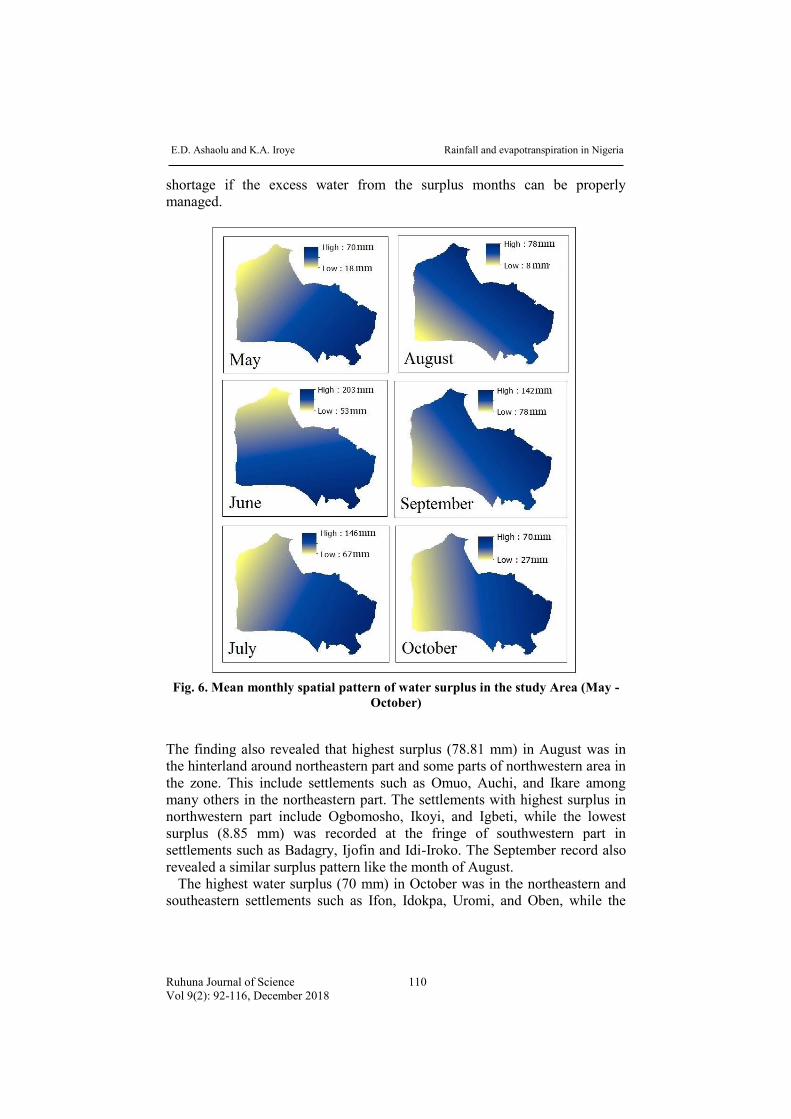
Pattern of mean monthly water surplus (May-October)
Figure 6 reveals the spatial pattern of monthly water surplus in the study area.
For the month of May, the highest surplus (70 mm) was in the southeastern
settlements such as Uromi, Ugbenu, and Auchi, while the lowest surplus (18
mm) was in the northwestern settlements such as Agbonle, Ogbooro and
Shaki. Also, the highest surplus (203 mm) in June was in southeastern
settlements such as Owena, Ikare, Idokpa and Auchi, while the lowest surplus
(53mm) was in northwestern part fringe in settlements such as Kishi, Agbonle
and Ogboro. The highest surplus (146 mm) in July was in southeastern
settlements such as Ugbenu, Urhonigbe and Ekpon, while lowest surplus (67
mm) was at the fringe of northwestern part of the study area around
settlements such as Wasinmi, Awoye and Ago Are, etc. The water surplus
pattern from May through July indicated that the southwestern part which
exhibits the lowest water deficit is also the axis with the highest surplus. The
southwestern part of the study area is likely not to surfer severe water
E.D. Ashaolu and K.A. Iroye Rainfall and evapotranspiration in Nigeria
Ruhuna Journal of Science 110
Vol 9(2): 92-116, December 2018
shortage if the excess water from the surplus months can be properly
managed.
Fig. 6. Mean monthly spatial pattern of water surplus in the study Area (May -
October)
The finding also revealed that highest surplus (78.81 mm) in August was in
the hinterland around northeastern part and some parts of northwestern area in
the zone. This include settlements such as Omuo, Auchi, and Ikare among
many others in the northeastern part. The settlements with highest surplus in
northwestern part include Ogbomosho, Ikoyi, and Igbeti, while the lowest
surplus (8.85 mm) was recorded at the fringe of southwestern part in
settlements such as Badagry, Ijofin and Idi-Iroko. The September record also
revealed a similar surplus pattern like the month of August.
The highest water surplus (70 mm) in October was in the northeastern and
southeastern settlements such as Ifon, Idokpa, Uromi, and Oben, while the

E.D. Ashaolu and K.A. Iroye Rainfall and evapotranspiration in Nigeria
Ruhuna Journal of Science
Vol 9(2): 92-116, December 2018 111
lowest surplus (27.73 mm) was at the fringes of southwestern and
northeastern settlements such as Ijofin, Idi-Iroko, Idi Emi and Awoye. The
change in the spatial pattern of water surplus from August through October
may not be unconnected with local conditions such as the presence of
highlands, vegetation, level of urbanization, etc. that may influence the
microclimate of various locations in the study area.
Pattern of mean annual water balance
The highest mean annual water surplus (324 mm) was recorded in the
southeastern and northeastern parts of the study area (Figure 7). This region
comprises hinterland settlements such as Idanre, Akure, Owo, Uromi, and
Auchi. The lowest annual water deficit (-424 mm) was in the northwestern
and southwestern parts. The northwestern and southwestern parts comprise
settlements such as Agbonle, Kishi, Shaki, Awoye, Idi Emi, Aworo and
Wasinmi. The mean annual pattern of water balance (Figure 7) revealed that
settlements in the northeastern and southwestern parts have the highest annual
water surplus. These are places with highest mean rainfall amount and very
low mean annual PET. This suggests that water surplus experienced in those
locations, will increase the soil water storage that will enhance crop
production, industrial development and domestic water consumption. In
addition, increase in groundwater recharge is expected. This will sustain the
domestic water usage, and subsequently maintain the river channels during
period of low flow; and sustain the ecosystem of the study area.
Fig. 7. Mean annual pattern of water balance in the study area (1976-2015).

E.D. Ashaolu and K.A. Iroye Rainfall and evapotranspiration in Nigeria
Ruhuna Journal of Science 112
Vol 9(2): 92-116, December 2018
The northwestern part has the highest water deficit. This result is expected
because these are locations with lowest annual rainfall amount and highest
PET in the study area. This result follows the general pattern of decrease and
increase in rainfall amount and evaporation, respectively in Nigeria. This
observation agrees with Ayoade (2003) findings on pan-measured evaporation
in Nigeria which revealed a general increase northward towards the interior.
The highest amount of PET in these areas may not be unconnected to location
towards the north where high solar radiation is recorded as a result of longer
period of sunshine hours. It is important to note that these are areas where
rain-fed agriculture is being practiced, staple foods are being grown and larger
percentage of the population depends on subsistence farming as source of
income. In a situation, whereby the mean annual PET rises above the mean
rainfall, the crop production and food security of the dwellers will be
threatened, their level of income and the general well-being will be
compromised. This situation can bring untold hardship, especially on the rural
populace whose lives depends entirely on rain-fed agriculture.
3.3 Spatio-temporal variation in Aridity Index in the study area
The variation in annual aridity index (AI) in the Western Lithoral
hydrological zone of Nigeria (WLHZ) between 1976 and 2015 is presented in
Figure 8.
Fig. 8. Trend in Aridity Index in the Western Lithoral Hydrological Zone of
Nigeria, 1976-2015.
E.D. Ashaolu and K.A. Iroye Rainfall and evapotranspiration in Nigeria
Ruhuna Journal of Science
Vol 9(2): 92-116, December 2018 113
The annual AI varied from 0.69 to 1.16 across the study area. The mean
annual AI for the study area during the period 1976 to 2015 was 0.94, with a
coefficient of variation of 12.98%. This result shows that AI was
homogeneous during the period of study in the study area. The AI however
increases at a rate of 0.0023 year-1 in the period of study (Figure 8). The 10-
years moving average computed for the study area reveals that AI has been on
the rise in the last 10 years of the study, with a mean of AI of 1.01. Based on
FAO (1993) AI classification (Table 1), the mean for the last 10 years
indicates that the WLHZ of Nigeria is still a humid environment.
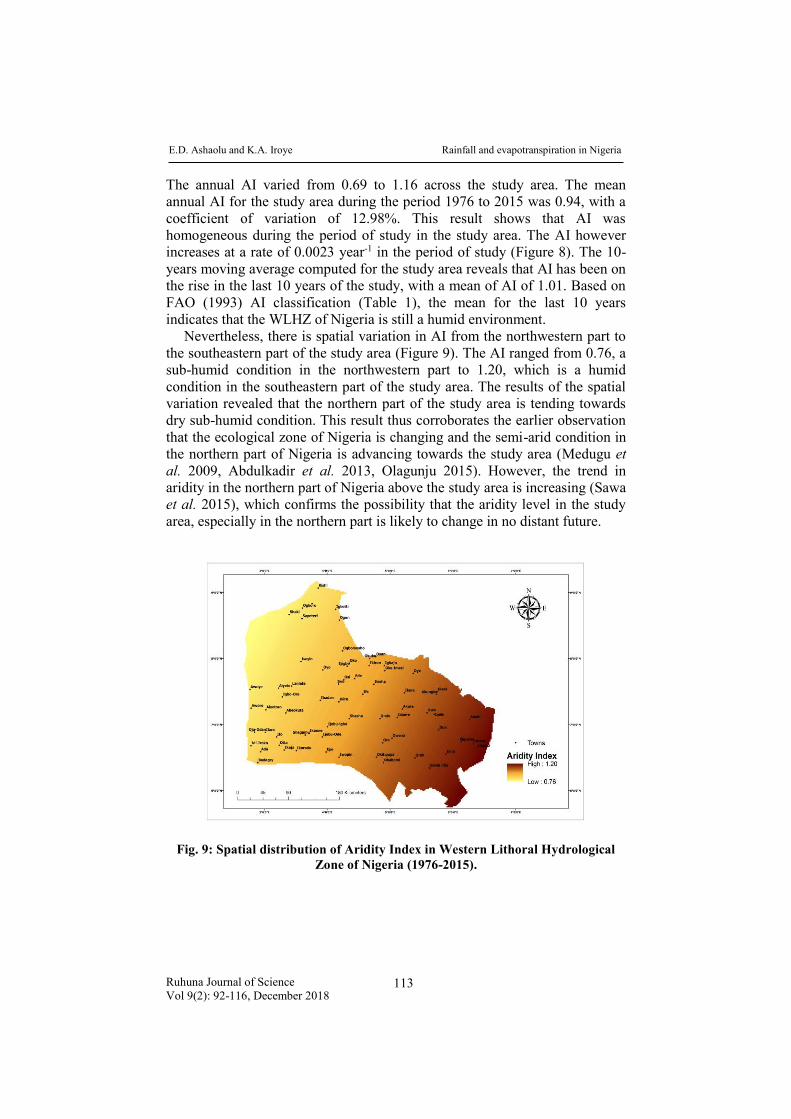
Nevertheless, there is spatial variation in AI from the northwestern part to
the southeastern part of the study area (Figure 9). The AI ranged from 0.76, a
sub-humid condition in the northwestern part to 1.20, which is a humid
condition in the southeastern part of the study area. The results of the spatial
variation revealed that the northern part of the study area is tending towards
dry sub-humid condition. This result thus corroborates the earlier observation
that the ecological zone of Nigeria is changing and the semi-arid condition in
the northern part of Nigeria is advancing towards the study area (Medugu et
al. 2009, Abdulkadir et al. 2013, Olagunju 2015). However, the trend in
aridity in the northern part of Nigeria above the study area is increasing (Sawa
et al. 2015), which confirms the possibility that the aridity level in the study
area, especially in the northern part is likely to change in no distant future.
Fig. 9: Spatial distribution of Aridity Index in Western Lithoral Hydrological
Zone of Nigeria (1976-2015).

E.D. Ashaolu and K.A. Iroye Rainfall and evapotranspiration in Nigeria
Ruhuna Journal of Science 114
Vol 9(2): 92-116, December 2018
4 Conclusions
Generally, the level of water balance in the Western Lithoral hydrological
zone on a monthly time scale revealed six months of water surplus (May-
October) and six months of water deficit (November-April). The six months
of water surplus coincided with crop cultivation period in the study area.
Although there are spatial variations with the length of crop cultivation period
because some part of the study area experienced seven months of water
surplus. The study concluded that the water surplus of the wet months be
conserved to augment the deficit experienced in the dry months, especially to
boost agriculture and water supply in the study area. This can be achieved
through construction of barriers across rivers, use of large depressions to store
runoffs from open fields and bare surfaces. The pounded water which can
subsequently be used to irrigate farmlands during the dry period can also be
treated for both domestic and industrial usage. There was 27 years of water
deficit from the 40 years (1976-2015) of record, thus, it can be concluded that
there was water deficit in the study area for the period of study. However, the
statistically significant increase in both rainfall amount and PET suggested
that the differences in the rate of increase of these two hydrological
components will determine the climatic water balance scenario of the study
area in the future. Despite being a humid environment, AI in the northern part
of the study area is tending towards dry sub-humid condition, thus a change in
the general pattern of AI is expected in the near future. Based on the observed
temporal and spatial pattern of rainfall and PET and their influence on
climatic water balance in the study area, it is recommended that the
influencing factors of rainfall amount and PET in the Western Lithoral
hydrological zone of Nigeria be investigated in subsequent study.
Acknowledgments
The authors appreciate the managements of Nigeria Meteorological Agency (NIMET) for the data used in this work. The anonymous reviewers are greatly appreciated for their comments on the initial manuscript.
References
Abdulkadir A, Usman MT, Shaba AH. 2015. An integrated approach to delineation of the ecoclimatic zones in Northern Nigeria. Journal of Ecology and the Natural Environment 7(9): 247-255.
Abdulkadir A, Usman, MT, Shaba AH. 2013. Climate change, aridity trend and agricultural sustainability of the Sudano-Sahelian belt of Nigeria. International Journal of Development and Sustainability 2(2): 1436-1456.
Ashaolu ED. 2018. Effect of climate and land use/land cover change on groundwater recharge in Osun drainage basin, Nigeria. (Ph.D. Thesis), University of Ilorin, Nigeria.
Ayoade JO. 2008. Introduction to agro-climatology. University Press Ibadan, Nigeria.

E.D. Ashaolu and K.A. Iroye Rainfall and evapotranspiration in Nigeria
Ruhuna Journal of Science
Vol 9(2): 92-116, December 2018 115
Ayoade JO. 2003. Tropical hydrology and water resources. Agbo Areo Publishers., Ibadan, Nigeria.
Bello NJ. 1997. Evaluation of reference–crop evapotranspiration by empirical method for predicting consumptive water use of a crop in a tropical wet-dry climate. Indian Journal of Agricultural Science 67 (6): 269-270.
Bello OB, Ganiyu OT, Wahab MKA, Afolabi MS, Oluleye F, Ig SA, Mahmud J, Azeez MA, Abdulmaliq SY. 2012. Evidence of climate change impacts on agriculture and food security in Nigeria. International Journal of Agriculture and Forestry 2(2): 49-55.
Cannarozzo M, Noto LV, Viola F. 2006. Spatial distribution of rainfall trends in Sicily (1921–2000). Physics and Chemistry of the Earth 31:1201–1211.
Chen S, Liu Y, Thomas A. 2006. Climatic change on the Tibetan plateau: Potential evapotranspiration trends from 1961–2000. Climatic Change 76: 291–319.
Chineke TC, Idinoba ME, Ajayi OC. 2011. Seasonal evapotranspiration signatures under a changing landscape and ecosystem management in Nigeria: Implications for agriculture and food security. American Journal of Scientific and Industrial Research, 2(2): 191-204.
Chong-yu X, Lebing G, Tong J, Deliang C, Singh VP. 2006. Analysis of spatial distribution and temporal trend of reference evapotranspiration and pan evaporation in Changjiang (Yangtze River) Catchment. Journal of Hydrology 327: 81–93.
Christopherson RW. 1995. Elemental Geosystems, Macmillan, New York. Pp. 230-239. Cubash U, Dai XJ, Ding Y, Griggs DJ, Hewtson B, Houghton JT, Isaksen I, Karl T, Mcfarlaid
M, Meleshko VP, Mitchell JFB, Noguer M, Nyenzi BS, Oppenheimer M, Penner JE, Pollonais S, Stocker T, Trenberth TE. 2001. Technical Summary Report by Working Group Ι of the IPCC, Pg. 68
Egwuonwu CC, Okafor VC, Ezeanya NC, Nzediegwu C, Okorafor OO. 2012. A comparison of the reliability of six evapotranspiration computing models for Abeokuta in south western Nigeria. Greener Journal of Physical Sciences 2 (4): 64-69.
Ejieji CJ. 2011. Performance of Three Empirical Reference Evapotranspiration Models under Three Sky Conditions using two Solar Radiation Estimation Methods at Ilorin, Nigeria. Agricultural Engineering International: CIGR Journal 13(3): 1-21.
Fan Z, Thomas A. 2012. Spatiotemporal variability of reference evapotranspiration and its contributing climatic factors in Yunnan province, SW China, 1961–2004. Climatic Change, DOI 10.1007/s10584-012-0479-4.
FAO 1993. Forest Resources Assessment 1990. Tropical Countries. Forestry Paper 112. Rome: Food and Agriculture Organization of the United Nations (FAO).
Federal Ministry of Water Resources [FMWR] 2014. The Project for Review and Update of Nigeria National Water Resources Master Plan. Volume 2, Summary Report
Fisher JB, Whittaker RJ, Malhi Y. 2011. ET come home: Potential evapotranspiration in Geographical Ecology. Global Ecological Biogeography 20: 1–18.
Gao G, Chen D, Ren G, Chen Y, Liao Y. 2006. Spatial and temporal variations and controlling factors of potential evapotranspiration in China: 1956-2000. Journal of Geographical Sciences 16 (1):3-12.
Ingol-Blanco E. 2008. Climate Impacts on the Water Resources: An overview of Global Impacts and Technique to Assess at Local Scale. University of Texas at Austin.
IPCC 2007. Summary for policymakers. In: Solomon S, Qin D, Manning M, Chen Z, Marquis M, Averyt K, Tignor M, Miller HL (eds) Climate change 2007: the physical science basis. Contribution of working group I to the Forth Assessment Report of the Intergovernmental Panel on Climate Change. Cambridge University Press, Cambridge, pp 1–18.
Iroye KA. 2013. Water budget position and its implications on basin management in urbanized catchment in a tropical city of Ilorin, Nigeria. Ethiopian Journal of Environmental Studies and Management 6(4): 358-364.
Jensen ME, Burman RD, Allen RG. 1990. Evaporation and irrigation water requirements. ASCE Manuals and Reports on Engineering Practices No.70. American Society of Civil Engineers, New York.
E.D. Ashaolu and K.A. Iroye Rainfall and evapotranspiration in Nigeria
Ruhuna Journal of Science 116
Vol 9(2): 92-116, December 2018
Khambhammettu P. 2005. Mann-Kendall analysis, annual groundwater monitoring report of Hydro Geologic Incorporated, Fort Ord, California
Li Y, Feng A, Liu W, Ma X, Dong G. 2017. Variation of Aridity Index and the Role of Climate Variables in the Southwest China. Water 9: 743; DOI: 10.3390/w9100743.
Maliva R, Missimer T. 2012. Arid Lands Water Evaluation and Management, Environmental Science and Engineering, DOI: 10.1007/978-3-642-29104-3-2, Springer-Verlag, Berlin Heidelberg.
McBean E, Motiee H. 2008. Assessment of impact of climate change on water resources: A long term analysis of the Great Lakes of North America, Hydrology and Earth System Sciences 12:239–255.
Medugu NI, Majid MR, Johar F. 2009. The consequences of drought and desertification in Nigeria. The IUP Journal of Environmental Sciences 3(3): 66-84.
National Bureau of Statistics 2012. Annual Abstract of Statistics, 2012. Federal Republic of Nigeria.
Nigerian Meteorological Agency 2013. Quarterly Weather Review for January, February, March and April. Pp: 1-25.
Nigerian Meteorological Agency 2012. Agro-meteorological Bulletin, Quarterly Compilation Decadal, April-June, 2012. Pp: 1-27.
Odekunle TO, Eludoyin AO. 2008. Sea surface temperature patterns in the Gulf of Guinea: their implications for the spatio-temporal variability of precipitation in West Africa. International Journal of Climatology 28: 1507-1517.
Olagunju TE. 2015. Drought, desertification and the Nigerian environment: A review. Journal of Ecology and Natural Environment 7(7): 196-209.
Olofintoye OO, Sule BF. 2010. Impact of global warming on the rainfall and temperature in the Niger Delta of Nigeria, Journal of Research Information in Civil Engineering, 7(2):33-48.
Oriola EO, Ifabiyi IP, Mousafawou AA. 2017. Temporal analysis of water balance in a Sahelian City: Implication for water management. Malaysia Journal of Society and Space 13(2): 75-83.
Owoade IA. 1989. Some aspects of the hydrogeology of the crystalline Basement Complex rocks of south western Nigeria. (Ph.D. Thesis), Loughborough University of Technology.
Penman HL. 1956. Evaporation: an introductory survey. Netherlands Journal of Agricultural Science 1:9–29.
Paparrisoz S, Maris F, Matzarakis A. 2016. Integrated analysis and mapping of aridity over Greek areas with different climate conditions. Global Nest Journal 18(1): 131-145.
Raes D. 2012. Reference manual- ETO calculator, version 3.2. Food and Agriculture Organization of the United Nations Land and Water Division. Rome, Italy.
Salami AW, Raji MO, Sule BF, Abdulkareem YA, Bilewu SO. 2010. Impacts of climate change on the water resources of Jebba Hydropower Reservoir, 2nd Annual Civil Engineering Conference, University of Ilorin, Nigeria. 26–28 July, 2010, International conference on sustainable urban water supply in developing countries: 298–312.
Sawa BA, Ati OF, Jayeoba IA, Oladipo EO. 2015. Trends in aridity of the arid and semi-arid regions of northern Nigeria: Journal of Environment and Earth Science 5(10): 61-68.
Tesfamichael G, De Smedt F, Walraevens K, Gebresilassie S, Hussien A, Hagos M, Amare K, Deckers J, Gebrehiwot K. 2013. Application of a spatially distributed water balance model for assessing surface water and groundwater resources in the Geba Basin, Tigray, Ethiopia. Journal of Hydrology 499: 110-123.
Thomas A. 2000. Spatial and temporal characteristics of potential evapotranspiration trends over China. International Journal of Climatology 20 (4): 381–396.
Zhifeng Y, Qiang L, Baoshan C. 2011 Spatial distribution and temporal variation of reference evapotranspiration during 1961–2006 in the Yellow River Basin, China. Hydrological Sciences Journal 56 (6):1015-1026.