radiological conditions in selected areas of southern · pdf fileradiological conditions in...
TRANSCRIPT
INTERNATIONAL ATOMIC ENERGY AGENCYVIENNA
ISBN 978–92–0–100910–4ISSN 1020–6566
During the conflict in Iraq in 2003, depleted uranium munitions were employed by the Coalition Forces. As a result, residues of depleted uranium contaminated both localized areas of land and vehicles. The possible health effects of such residues on the Iraqi population living in the vicinity of the affected areas raised concerns. In 2004, the Iraqi Minister of Environment made a formal request of the United Nations Environment Programme for a comprehensive field assessment. In early 2005, a meeting involving UNEP, the World Health Organization and the IAEA took place to discuss, plan and coordinate work on the assessment of depleted uranium residues in southern Iraq. In 2006, during a follow-up meeting that included UNEP, the IAEA and the Radiation Protection Centre of the Iraqi Ministry of Environment, the IAEA was invited to undertake a radiological assessment of the data collected by the Radiation Protection Centre. This report describes the methods, assumptions and parameters used by the IAEA in the assessment of the post-conflict radiological conditions of specified locations for local populations and in the environment. The report uses the results provided by UNEP from the 2006–2007 sampling campaigns, and presents these results, findings and conclusions.
Report by aninternational group of experts
Radiological Conditions inSelected Areas of Southern Iraq withResidues of Depleted Uranium
RADIOLOGICALA S S E S S M E N TR E P O R T SS E R I E S
Radiological C
onditions in Selected A
reas of Southern Iraq w
ith Residues of D
epleted Uranium
P1434_cover.indd 1 2010-07-22 11:13:38

RELATED PUBLICATIONS
www.iaea.org/books
EnvironmEntal ConsEquEnCEs of thE ChErnobyl aCCidEnt and thEir rEmEdiation: twEnty yEars of ExpEriEnCE report of the un Chernobyl forum Expert Group “Environment”radiological assessment reportsSTI/PUB/1239 (166 pp.; 2006)ISBN 92–0–114705–8 €40.00
radioloGiCal Conditions in thE dniEpEr rivEr basinradiological assessment reportsSTI/PUB/1230 (185 pp.; 2006)ISBN 92–0–104905–6 €38.00
radioloGiCal Conditions in arEas of Kuwait with rEsiduEs of dEplEtEd uraniumradiological assessment reportsSTI/PUB/1164 (73 pp.; 2003)ISBN 92–0–106603–1 €25.00
radioloGiCal Conditions of thE wEstErn Kara sEaradiological assessment reportsSTI/PUB/1068 (124 pp.; 1999)ISBN 92–0–104298–1 €32.00
radioloGiCal Conditions at thE sEmipalatinsK tEst sitE, KazaKhstan: prEliminary assEssmEnt and rECommEndations for furthEr studyradiological assessment reportsSTI/PUB/1063 (43 pp.; 1998)ISBN 92–0–104098–9 €14.50
thE radioloGiCal situation at thE atolls of mururoa and fanGataufa: main rEportradiological assessment reportsSTI/PUB/1028 (282 pp.; 1998)ISBN 92–0–101198–9 €87.00
radioloGiCal Conditions at biKini atoll: prospECts for rEsEttlEmEntradiological assessment reportsSTI/PUB/1054 (67 pp.; 1998)ISBN 92–0–100398–6 €20.50
IAEA SAFETY RELATED PUBLICATIONS
IAEA SAFETY STANDARDS
Under the terms of Article III of its Statute, the IAEA is authorized to establish or adopt standards of safety for protection of health and minimization of danger to life and property, and to provide for the application of these standards.
The publications by means of which the IAEA establishes standards are issued in the IAEA Safety Standards Series. This series covers nuclear safety, radiation safety, transport safety and waste safety. The publication categories in the series are Safety Fundamentals, Safety Requirements and Safety Guides.
Information on the IAEA’s safety standards programme is available at the IAEA Internet site
http://www-ns.iaea.org/standards/
The site provides the texts in English of published and draft safety standards. The texts of safety standards issued in Arabic, Chinese, French, Russian and Spanish, the IAEA Safety Glossary and a status report for safety standards under development are also available. For further information, please contact the IAEA at PO Box 100, 1400 Vienna, Austria.
All users of IAEA safety standards are invited to inform the IAEA of experience in their use (e.g. as a basis for national regulations, for safety reviews and for training courses) for the purpose of ensuring that they continue to meet users’ needs. Information may be provided via the IAEA Internet site or by post, as above, or by email to [email protected].
OTHER SAFETY RELATED PUBLICATIONS
The IAEA provides for the application of the standards and, under the terms of Articles III and VIII.C of its Statute, makes available and fosters the exchange of information relating to peaceful nuclear activities and serves as an intermediary among its Member States for this purpose.
Reports on safety and protection in nuclear activities are issued as Safety Reports, which provide practical examples and detailed methods that can be used in support of the safety standards.
Other safety related IAEA publications are issued as Radiological Assessment Reports, the International Nuclear Safety Group’s INSAG Reports, Technical Reportsand TECDOCs. The IAEA also issues reports on radiological accidents, training manuals and practical manuals, and other special safety related publications. Security related publications are issued in the IAEA Nuclear Security Series.
Cover:A satellite image of an area in southern Iraq. The orange markings indicate sampling areas. (Photograph courtesy of UNEP.)
P1434_cover.indd 2 2010-07-22 11:13:39

RADIOLOGICAL CONDITIONS INSELECTED AREAS OF
SOUTHERN IRAQ WITHRESIDUES OF DEPLETED URANIUM
Report by aninternational group of experts

The following States are Members of the International Atomic Energy Agency:
AFGHANISTAN
ALBANIA
ALGERIA
ANGOLA
ARGENTINA
ARMENIA
AUSTRALIA
AUSTRIA
AZERBAIJAN
BAHRAIN
BANGLADESH
BELARUS
BELGIUM
BELIZE
BENIN
BOLIVIA
BOSNIA AND HERZEGOVINA
BOTSWANA
BRAZIL
BULGARIA
BURKINA FASO
BURUNDI
CAMBODIA
CAMEROON
CANADA
CENTRAL AFRICAN
REPUBLIC
CHAD
CHILE
CHINA
COLOMBIA
CONGO
COSTA RICA
CÔTE D�IVOIRE
CROATIA
CUBA
CYPRUS
CZECH REPUBLIC
DEMOCRATIC REPUBLIC
OF THE CONGO
DENMARK
DOMINICAN REPUBLIC
ECUADOR
EGYPT
EL SALVADOR
ERITREA
ESTONIA
ETHIOPIA
FINLAND
FRANCE
GABON
GEORGIA
GERMANY
GHANA
GREECE
GUATEMALA
HAITI
HOLY SEE
HONDURAS
HUNGARY
ICELAND
INDIA
INDONESIA
IRAN, ISLAMIC REPUBLIC OF
IRAQ
IRELAND
ISRAEL
ITALY
JAMAICA
JAPAN
JORDAN
KAZAKHSTAN
KENYA
KOREA, REPUBLIC OF
KUWAIT
KYRGYZSTAN
LATVIA
LEBANON
LESOTHO
LIBERIA
LIBYAN ARAB JAMAHIRIYA
LIECHTENSTEIN
LITHUANIA
LUXEMBOURG
MADAGASCAR
MALAWI
MALAYSIA
MALI
MALTA
MARSHALL ISLANDS
MAURITANIA
MAURITIUS
MEXICO
MONACO
MONGOLIA
MONTENEGRO
MOROCCO
MOZAMBIQUE
MYANMAR
NAMIBIA
NEPAL
NETHERLANDS
NEW ZEALAND
NICARAGUA
NIGER
NIGERIA
NORWAY
OMAN
PAKISTAN
PALAU
PANAMA
PARAGUAY
PERU
PHILIPPINES
POLAND
PORTUGAL
QATAR
REPUBLIC OF MOLDOVA
ROMANIA
RUSSIAN FEDERATION
SAUDI ARABIA
SENEGAL
SERBIA
SEYCHELLES
SIERRA LEONE
SINGAPORE
SLOVAKIA
SLOVENIA
SOUTH AFRICA
SPAIN
SRI LANKA
SUDAN
SWEDEN
SWITZERLAND
SYRIAN ARAB REPUBLIC
TAJIKISTAN
THAILAND
THE FORMER YUGOSLAV
REPUBLIC OF MACEDONIA
TUNISIA
TURKEY
UGANDA
UKRAINE
UNITED ARAB EMIRATES
UNITED KINGDOM OF
GREAT BRITAIN AND
NORTHERN IRELAND
UNITED REPUBLIC
OF TANZANIA
UNITED STATES OF AMERICA
URUGUAY
UZBEKISTAN
VENEZUELA
VIETNAM
YEMEN
ZAMBIA
ZIMBABWE
The Agency’s Statute was approved on 23 October 1956 by the Conference on the Statute of the IAEA held atUnited Nations Headquarters, New York; it entered into force on 29 July 1957. The Headquarters of the Agency aresituated in Vienna. Its principal objective is “to accelerate and enlarge the contribution of atomic energy to peacehealth and prosperity throughout the world’’.
,

RADIOLOGICAL CONDITIONS INSELECTED AREAS OF
SOUTHERN IRAQ WITHRESIDUES OF DEPLETED URANIUM
Report by aninternational group of experts
RADIOLOGICAL ASSESSMENT REPORTS SERIES
INTERNATIONAL ATOMIC ENERGY AGENCYVIENNA, 2010

IAEA Library Cataloguing in Publication Data
Radiological conditions in selected areas of Southern Iraq with residues of depleted uranium. — Vienna : International Atomic Energy Agency, 2010.
p. ; 30 cm. — (Radiological assessment reports series,ISSN 1020-6566)STI/PUB/1434ISBN 978–92–0–100910–4Includes bibliographical references.
1. Radioactive pollution — Iraq. 2. Depleted uranium — Health aspects — Iraq. 3. Depleted uranium — Environmental aspects — Iraq. 4. Depleted uranium – Military applications. I. International Atomic Energy Agency. II. Series.
IAEAL 10–00629
COPYRIGHT NOTICE
All IAEA scientific and technical publications are protected by the terms of the Universal Copyright Convention as adopted in 1952 (Berne) and as revised in 1972 (Paris). The copyright has since been extended by the World Intellectual Property Organization (Geneva) to include electronic and virtual intellectual property. Permission to use whole or parts of texts contained in IAEA publications in printed or electronic form must be obtained and is usually subject to royalty agreements. Proposals for non-commercial reproductions and translations are welcomed and considered on a case-by-case basis. Enquiries should be addressed to the IAEA Publishing Section at:
Marketing and Sales Unit, Publishing SectionInternational Atomic Energy AgencyVienna International CentrePO Box 1001400 Vienna, Austriafax: +43 1 2600 29302tel.: +43 1 2600 22417email: [email protected] http://www.iaea.org/books
© IAEA, 2010
Printed by the IAEA in AustriaJune 2010
STI/PUB/1434

FOREWORD
Various locations around the world have been affected by radioactive residues at some time or another. Some of these residues are the result of peaceful activities; others from military actions, such as nuclear weapons testing and, in the more recent past, also from the use of depleted uranium in conventional munitions in conflicts.
Following these conflicts, questions have arisen regarding the possible radiological consequences of such residues for local populations and the environment, and the governments of the affected countries were obliged to respond. Many of these residues are in countries where the infrastructure and expertise necessary for evaluating the radiation risks posed by the residues, and for making decisions on remediation, are insufficient. In such cases, governments have felt it necessary to obtain outside help. In other cases, it has been considered to be socially and politically desirable to obtain independent expert opinions on the radiological conditions caused by such residues.
As a result, the IAEA has been requested by the governments of a number of Member States to provide assistance in this context. This assistance has been provided by the IAEA under its statutory obligation “to establish…standards of safety for protection of health…and to provide for the application of these standards…at the request of a State”. In situations involving depleted uranium (DU) munitions, the IAEA conducted its activities in consultation and collaboration with other United Nations organizations, including the United Nations Environment Programme (UNEP) and the World Health Organization (WHO).
In 2004, UNEP received a request from the Iraqi Ministry of Environment to perform an assessment in relation to the residues of DU munitions that exist at four selected areas in southern Iraq, left over from the 2003 conflict in Iraq. The IAEA was subsequently invited to undertake a radiological assessment of the results obtained through the sampling campaign and laboratory measurements conducted by UNEP.
For this purpose, the IAEA convened a team of experts who were involved in past similar radiological studies in different post-conflict situations involving DU. The team was led by P.R. Danesi, an external consultant; the IAEA technical officers were D. Telleria and D. Louvat, of the Division of Radiation, Waste and Transport Safety.
The information reported in Appendixes I, II and III was taken from documentation provided to the IAEA by UNEP. Particular acknowledgement is made of the contribution of M. Burger (Spiez Laboratory, Switzerland, and external consultant to UNEP), who made available to the IAEA the information reported in Tables 22–25, and who participated in several technical discussions.
This report describes the methods, assumptions and parameters used by the IAEA during the assessment of the post-conflict radiological conditions of the environment and populations using the results provided by UNEP from the 2006–2007 sampling campaigns, and presents results, findings and conclusions in connection therewith.

EDITORIAL NOTE
Although great care has been taken to maintain the accuracy of information contained in this publication, neither the IAEA nor its Member States assume any responsibility for consequences which may arise from its use.
The use of particular designations of countries or territories does not imply any judgement by the publisher, the IAEA, as to the legal status of such countries or territories, of their authorities and institutions or of the delimitation of the boundaries.
The mention of names of specific companies or products (whether or not indicated as registered) does not imply any intention to infringe proprietary rights, nor should it be construed as an endorsement or recommendation on the part of the IAEA.

CONTENTS
SUMMARY . . . . . . . . . . . . . . . . . . . . . . . . . . . . . . . . . . . . . . . . . . . . . . . . . . . . . . . . . . . . . . . . . . . . . . . . . . . . 1
1. INTRODUCTION . . . . . . . . . . . . . . . . . . . . . . . . . . . . . . . . . . . . . . . . . . . . . . . . . . . . . . . . . . . . . . . . . . . 3
1.1. Background to the project. . . . . . . . . . . . . . . . . . . . . . . . . . . . . . . . . . . . . . . . . . . . . . . . . . . . . . . . . 31.2. DU residues in Iraq . . . . . . . . . . . . . . . . . . . . . . . . . . . . . . . . . . . . . . . . . . . . . . . . . . . . . . . . . . . . . . 31.3. Work programme . . . . . . . . . . . . . . . . . . . . . . . . . . . . . . . . . . . . . . . . . . . . . . . . . . . . . . . . . . . . . . . 3
2. BACKGROUND . . . . . . . . . . . . . . . . . . . . . . . . . . . . . . . . . . . . . . . . . . . . . . . . . . . . . . . . . . . . . . . . . . . . 6
2.1. Activity and radiation dose . . . . . . . . . . . . . . . . . . . . . . . . . . . . . . . . . . . . . . . . . . . . . . . . . . . . . . . . 62.2. International safety standards . . . . . . . . . . . . . . . . . . . . . . . . . . . . . . . . . . . . . . . . . . . . . . . . . . . . . . 62.3. Uranium and DU. . . . . . . . . . . . . . . . . . . . . . . . . . . . . . . . . . . . . . . . . . . . . . . . . . . . . . . . . . . . . . . . 72.4. Uranium in nature . . . . . . . . . . . . . . . . . . . . . . . . . . . . . . . . . . . . . . . . . . . . . . . . . . . . . . . . . . . . . . . 82.5. Exposure routes for DU . . . . . . . . . . . . . . . . . . . . . . . . . . . . . . . . . . . . . . . . . . . . . . . . . . . . . . . . . . 8
3. RADIATION EXPOSURE . . . . . . . . . . . . . . . . . . . . . . . . . . . . . . . . . . . . . . . . . . . . . . . . . . . . . . . . . . . . 9
3.1. General assessment approach . . . . . . . . . . . . . . . . . . . . . . . . . . . . . . . . . . . . . . . . . . . . . . . . . . . . . . 93.2. Radiation exposure pathways considered . . . . . . . . . . . . . . . . . . . . . . . . . . . . . . . . . . . . . . . . . . . . . 93.3. Limitations of the assessment . . . . . . . . . . . . . . . . . . . . . . . . . . . . . . . . . . . . . . . . . . . . . . . . . . . . . . 9
4. METHODOLOGY USED FOR THE ESTIMATION OF DOSE. . . . . . . . . . . . . . . . . . . . . . . . . . . . . . . 10
4.1. Inhalation of DU contaminated soil resuspended by wind or human activities . . . . . . . . . . . . . . . . 104.2. Inhalation of resuspended dust inside military vehicles hit by DU munitions . . . . . . . . . . . . . . . . . 114.3. Ingestion of soil. . . . . . . . . . . . . . . . . . . . . . . . . . . . . . . . . . . . . . . . . . . . . . . . . . . . . . . . . . . . . . . . . 114.4. Ingestion of vegetables and drinking water . . . . . . . . . . . . . . . . . . . . . . . . . . . . . . . . . . . . . . . . . . . 12
4.4.1. Vegetables . . . . . . . . . . . . . . . . . . . . . . . . . . . . . . . . . . . . . . . . . . . . . . . . . . . . . . . . . . . . . . . 124.4.2. Water . . . . . . . . . . . . . . . . . . . . . . . . . . . . . . . . . . . . . . . . . . . . . . . . . . . . . . . . . . . . . . . . . . . 12
4.5. Direct contact with DU penetrators or DU fragments . . . . . . . . . . . . . . . . . . . . . . . . . . . . . . . . . . . 124.6. Ingestion of DU contaminated dust from flat surfaces (metal, concrete, walls). . . . . . . . . . . . . . . . 124.7. Inhalation and ingestion of DU during scrap metal operations for military vehicles hit
by DU munitions. . . . . . . . . . . . . . . . . . . . . . . . . . . . . . . . . . . . . . . . . . . . . . . . . . . . . . . . . . . . . . . . 13
5. CONSIDERATION OF THE POSSIBLE HAZARDS ASSOCIATED WITHTHE RE-MELTING OF SCRAP METAL FROM DISMANTLED MILITARY VEHICLES . . . . . . . . 14
6. EVALUATION OF THE RADIATION DOSES AT THE FOUR INVESTIGATED LOCATIONS . . . 15
6.1. As Samawah . . . . . . . . . . . . . . . . . . . . . . . . . . . . . . . . . . . . . . . . . . . . . . . . . . . . . . . . . . . . . . . . . . . 156.1.1. Doses due to the inhalation of soil resuspended by wind or human activities . . . . . . . . . . . 156.1.2. Doses due to the ingestion of soil . . . . . . . . . . . . . . . . . . . . . . . . . . . . . . . . . . . . . . . . . . . . . 166.1.3. Doses due to the ingestion of vegetables and drinking water . . . . . . . . . . . . . . . . . . . . . . . . 166.1.4. Doses due to the ingestion of DU contaminated dust from flat surfaces
(metal, concrete, walls) . . . . . . . . . . . . . . . . . . . . . . . . . . . . . . . . . . . . . . . . . . . . . . . . . . . . . 166.2. An Nasiriyah . . . . . . . . . . . . . . . . . . . . . . . . . . . . . . . . . . . . . . . . . . . . . . . . . . . . . . . . . . . . . . . . . . . 16
6.2.1. Doses due to the inhalation of soil resuspended by wind or human activities . . . . . . . . . . . 166.2.2. Doses due to the ingestion of soil . . . . . . . . . . . . . . . . . . . . . . . . . . . . . . . . . . . . . . . . . . . . . 176.2.3. Doses due to the ingestion of vegetables and drinking water . . . . . . . . . . . . . . . . . . . . . . . . 186.2.4. Doses due to the ingestion of DU contaminated dust from flat surfaces
(metal, concrete, walls) . . . . . . . . . . . . . . . . . . . . . . . . . . . . . . . . . . . . . . . . . . . . . . . . . . . . . 18
6.3. Al Basrah . . . . . . . . . . . . . . . . . . . . . . . . . . . . . . . . . . . . . . . . . . . . . . . . . . . . . . . . . . . . . . . . . . . . . 196.3.1. Doses due to the inhalation of soil resuspended by wind or human activities . . . . . . . . . . . 196.3.2. Doses due to the ingestion of soil . . . . . . . . . . . . . . . . . . . . . . . . . . . . . . . . . . . . . . . . . . . . . 196.3.3. Doses due to the ingestion of vegetables and drinking water . . . . . . . . . . . . . . . . . . . . . . . . 206.3.4. Doses due to the ingestion of DU contaminated dust from flat surfaces
(metal, concrete, walls) . . . . . . . . . . . . . . . . . . . . . . . . . . . . . . . . . . . . . . . . . . . . . . . . . . . . . 206.4. Az Zubayr . . . . . . . . . . . . . . . . . . . . . . . . . . . . . . . . . . . . . . . . . . . . . . . . . . . . . . . . . . . . . . . . . . . . . 21
6.4.1. Doses due to the inhalation of soil resuspended by wind or human activities . . . . . . . . . . . 216.4.2. Doses due to the ingestion of DU contaminated soil . . . . . . . . . . . . . . . . . . . . . . . . . . . . . . 216.4.3. Doses due to the ingestion of vegetation and drinking water . . . . . . . . . . . . . . . . . . . . . . . . 226.4.4. Doses due to the ingestion of DU contaminated dust from flat surfaces
(metal, concrete, walls) . . . . . . . . . . . . . . . . . . . . . . . . . . . . . . . . . . . . . . . . . . . . . . . . . . . . . 22
7. SUMMARY OF FINDINGS AND CONCLUSIONS. . . . . . . . . . . . . . . . . . . . . . . . . . . . . . . . . . . . . . . . 23
7.1. Estimates of radiation doses inside abandoned military vehicles hit by DU munitions. . . . . . . . . . 237.2. Site specific findings. . . . . . . . . . . . . . . . . . . . . . . . . . . . . . . . . . . . . . . . . . . . . . . . . . . . . . . . . . . . . 23
7.2.1. As Samawah . . . . . . . . . . . . . . . . . . . . . . . . . . . . . . . . . . . . . . . . . . . . . . . . . . . . . . . . . . . . . 237.2.2. An Nasiriyah . . . . . . . . . . . . . . . . . . . . . . . . . . . . . . . . . . . . . . . . . . . . . . . . . . . . . . . . . . . . . 237.2.3. Al Basrah. . . . . . . . . . . . . . . . . . . . . . . . . . . . . . . . . . . . . . . . . . . . . . . . . . . . . . . . . . . . . . . . 237.2.4. Az Zubayr . . . . . . . . . . . . . . . . . . . . . . . . . . . . . . . . . . . . . . . . . . . . . . . . . . . . . . . . . . . . . . . 23
7.3. Overall findings . . . . . . . . . . . . . . . . . . . . . . . . . . . . . . . . . . . . . . . . . . . . . . . . . . . . . . . . . . . . . . . . 24
APPENDIX I: DESCRIPTION OF THE FOUR LOCATIONS INVESTIGATEDAND OF THE MAJOR BATTLES THAT TOOK PLACE THERE . . . . . . . . . . . . . . . . . . . 25
APPENDIX II: IDENTIFICATION OF THE SAMPLING LOCATIONSAND SAMPLING METHODOLOGY . . . . . . . . . . . . . . . . . . . . . . . . . . . . . . . . . . . . . . . . . . 38
APPENDIX III: LABORATORY ANALYSIS AND ANALYTICAL RESULTS . . . . . . . . . . . . . . . . . . . . . . 40
APPENDIX IV: HABIT DATA UTILIZED FOR RADIATION DOSE ASSESSMENTS . . . . . . . . . . . . . . . 72
APPENDIX V: EXAMPLES OF RADIATION DOSES RECEIVED BY PEOPLE FROMDIFFERENT TYPES OF VOLUNTARY AND INVOLUNTARY EXPOSURES . . . . . . . . 73
REFERENCES . . . . . . . . . . . . . . . . . . . . . . . . . . . . . . . . . . . . . . . . . . . . . . . . . . . . . . . . . . . . . . . . . . . . . . . . . . 75
CONTRIBUTORS TO DRAFTING AND REVIEW . . . . . . . . . . . . . . . . . . . . . . . . . . . . . . . . . . . . . . . . . . . . 77

SUMMARY
During the conflict in Iraq in 2003, depleted uranium (DU) munitions were employed by the Coalition Forces. As a result, residues of DU contaminated both localized areas of land and vehicles. The possible health effects of such residues on the Iraqi population living in the vicinity of the affected areas raised concerns in Iraq as well as in other parts of the world.
The United Nations Environment Programme (UNEP), after receiving a formal request from the Iraqi Minister of Environment, HE Mishkat Moumin, for a comprehensive field assessment to investigate the use of DU and its residual impacts, decided to train and equip national experts from the Radiation Protection Centre (RPC) of the Iraqi Ministry of Environment to undertake a sampling campaign for DU in Iraq. The IAEA was subsequently invited to become involved; its specific role was to undertake a radiological assessment of the results obtained through the sampling campaign.
RPC staff collected environmental samples at selected sites in southern Iraq during sampling campaigns conducted in 2006–2007. A total of 520 samples of soil, water, vegetation and smear samples were taken. The samples were collected at four locations in southern Iraq, namely, As Samawah, An Nasiriyah, Al Basrah and Az Zubayr. The samples were then shipped from Iraq to UNEP in Geneva, Switzerland, and analysed by the Spiez Laboratory inSwitzerland.
In the subsequent radiation dose assessment performed by the IAEA, the following exposure pathways were considered:
(1) Inhalation of DU contaminated soil resuspended by the action of wind or human activities;
(2) Inhalation of resuspended DU dust inside military vehicles hit by DU munitions;
(3) Ingestion of DU contaminated soil;(4) Ingestion of DU contaminated vegetables and
drinking water;(5) Direct contact with DU penetrators or DU
fragments;(6) Ingestion of DU contaminated dust from flat
surfaces (metal, concrete, walls);
(7) Inhalation and ingestion of DU during operations at scrap metal facilities involving military vehicles hit by DU munitions.
On the basis of assumptions on the habits of local residents, which were corroborated by the experts from the Iraqi RPC, and the results of measurements of environmental samples, the estimation of the radiological risk from DU was performed in a very conservative way. Assumptions concerning human habits and exposure scenarios were made such that radiation doses at the upper end of the possible range would result. From the data provided by the RPC/Spiez Laboratory, those data showing the highest DU contamination levels were mainly used.
In this report, it is concluded that the radiation doses from DU do not pose a radiological hazard to the population at the four studied locations in southern Iraq. The estimated annual committed effective radiation doses that could arise from exposure to DU residues are low, always less than 100 µSv/a and only to a few, if any, individuals, and therefore of little radiological concern. The estimated radiation doses are less than those received on average by individuals from natural sources of radiation in the environment (worldwide average 2.4 mSv/a), below internationally recommended dose limits for members of the public (1 mSv/a) and below the action level of 10 mSv/a set out in the IAEA Safety Standard on Remediation of Areas Contaminated by Past Activities and Accidents [1] to establish whether remedial actions are necessary.
The conclusions concerning the radiological impact are relevant to the locations investigated and cannot be directly extrapolated to other locations in Iraq where DU ammunition was used. However, it is likely that the general picture is not very different at other locations in Iraq where DU was used in the 2003 conflict. The conclusions reached in international studies of other situations where DU munitions were employed (Kuwait and the Balkans) were similar to those of this report and support the belief that the radiological impact of the residues from the firing of DU munitions is also likely to be low in other parts of Iraq.
1

The doses that could be accumulated by individuals who enter abandoned vehicles which have been hit by DU ammunition may be higher than those from DU in the environment due to the inhalation of residual dust containing DU inside the vehicles. It should be recognized that such vehicles may present an inhalation hazard and members of the public should be prevented from entering them.
In the absence of special facilities, it is not advisable for metal from vehicles hit by DU munitions to be used as scrap metal. Direct disposal as low level radioactive waste (LLRW) (without any decontamination) is to be preferred from a radio-logical perspective since it is associated with fewer potential exposure pathways.
Although very few DU penetrators or DU penetrator fragments were identified during the sampling campaign, it cannot be excluded that they might be found and collected by members of the public in areas where DU munitions were used. Although the radiation dose would become significant only if the person exposed were to be in direct contact with DU munitions or fragments for a considerable period of time, nevertheless, the handling of DU penetrators or fragments should be kept to a minimum, and protective gloves should be worn when DU munitions are being handled. DU fragments and penetrators should be considered and managed as LLRW.
2

1. INTRODUCTION
1.1. BACKGROUND TO THE PROJECT
During the conflict in Iraq in 2003, depleted uranium (DU) munitions were employed by the Coalition Forces. As a result, residues of DU contaminated localized areas of land and vehicles.
The possible health effects of DU residues on the Iraqi population living in the vicinity of the affected areas raised concerns in Iraq as well as in other parts of the world. Following a formal request in August 2004 from the Iraqi Minister of Environment, that a comprehensive field assessment be conducted in Iraq to investigate the use of DU and its residual impacts, the United Nations Environment Programme (UNEP), in association with the World Health Organization (WHO), submitted a proposal to the United Nations Development Group Iraq Trust Fund in late 2004. The proposal was not approved, but UNEP carried on with a scaled down plan of work, with the help of funding from the United Kingdom’s Department for International Development.
The original plan of UNEP called for the deployment of international experts to Iraq to conduct the investigation. In June 2005, however, due to the continuously deteriorating security situation, UNEP decided instead to train and equip national experts from the Radiation Protection Centre (RPC) of the Iraqi Ministry of Environment to undertake the DU assessment locally.
On 6 April 2005, a meeting of UNEP, WHO and the IAEA was convened in Geneva to discuss, coordinate and plan work on DU in Iraq. The three organizations share a history of collaboration in the field of DU, for example, in Kuwait in 2001 [2]. At the meeting, UNEP, WHO and the IAEA agreed to collaborate with the Iraqi Ministry of Environment’s RPC. WHO and the IAEA also agreed to actively participate in a programme of seminars and workshops organized by UNEP on the topic of DU. Both agencies subsequently took part in a UNEP seminar in Amman, Jordan, in May 2005, where they presented their latest findings in the field of radiation protection, DU and related health effects. This gave them the opportunity to meet and share their latest knowledge with other stakeholders.
In March 2006, a meeting involving the IAEA, UNEP and the RPC was held in Geneva to review the procedures and preliminary results of the first phase
of the local expert DU assessment, and to offer feedback to the Iraqi experts. UNEP and the RPC also defined follow-up field activities and the second phase of the assessment. The IAEA was invited to undertake a radiological assessment based on data collected by the experts of the RPC in 2006 and 2007. This is the subject of the present report.
1.2. DU RESIDUES IN IRAQ
During the conflict in 2003, air attacks were mounted on selected Iraqi targets by US aircraft. In some of the air attacks, DU munitions were employed. Such munitions were also used by United Kingdom and US tanks in land battles, mainly against Iraqi T-type tanks.
The total amount of DU ammunition used during the conflict in 2003 is still unknown, but speculative figures from various studies cite the range as 170–1700 t. The United Kingdom Ministry of Defence has indicated that its forces deployed less than 1 t of DU ammunition during the 1991 Gulf War, and approximately 1.9 t in the 2003 conflict in Iraq. The ammunition was fired exclusively from tanks, as DU munitions were not used by the United Kingdom from aircraft in either conflict.
While it has not been disclosed where such ammunition was used in the 1991 conflict, the United Kingdom Ministry of Defence provided UNEP in June 2003 with the coordinates of DU firing points for its Challenger 2 tanks in the 2003 Iraq conflict. Up to now, the United States Government has not released information to UNEP on DU target coordinates for either the 1991 conflict or the 2003 one.
1.3. WORK PROGRAMME
For the purpose of the project, staff from the Iraqi RPC were trained by UNEP on DU radiological related issues. The main objectives of UNEP’s DU capacity building project in Iraq were to: train RPC staff to undertake a field based assessment of DU using internationally approved protocols and modern equipment; provide RPC staff with precise information on sites to assess and types of samples to collect; supervise remotely the assessment and retrieve samples; analyse the field observations,
3

monitoring results and samples to draw conclusions on the effectiveness of the capacity building activities; and review the results and provide recommendations to the Iraqi Ministry of Environment on follow-up actions.
The scope of the DU assessment performed by local experts in southern Iraq included the identifi-cation of areas where DU ammunition had been used; where contamination might be detected; and the implementation of a sampling programme for DU in soil, water, vegetation and on surfaces.
Environmental samples were collected by RPC staff from selected sites in southern Iraq in sampling campaigns carried out in 2006 and 2007. A total of 520 samples of soil, water, vegetation and smear samples were taken. The samples were collected at four locations in southern Iraq, namely, As Samawah, An Nasiriyah, Al Basrah and Az Zubayr (Fig. 1). Descriptions of the four locations and of the major battles that took place there are reported in Appendix I. The methods used for identifying the sampling locations and the sampling
FIG. 1. Map of Iraq indicating the four investigated locations. This map is based on UN Map No. 3835, Rev. 4, January 2004.(The original was used with the kind permission of the UN Cartographic Section.)
4

methodology employed are described in Appendix II. The information reported in the two appendixes was taken from documentation provided to the IAEA by UNEP.
The collected samples were analysed for their uranium content by the Spiez Laboratory, Switzerland, on behalf of UNEP. The results of the analyses were reported as weight of the four U isotopes, 238U, 236U,
235U and 234U per gram of dried sample (soil and vegetation samples), per millilitre of water (water samples), and per smear sample.
On the basis of this information, the IAEA assessed the radiological risk from DU to the local population living in the vicinity of the sites where the presence of DU had been identified.
5

2. BACKGROUND
In this section, the internationally accepted concepts and quantities relevant to the assessment of radiation dose to exposed humans are outlined and some basic information on uranium and DU is provided.
2.1. ACTIVITY AND RADIATION DOSE
The amount of a given radionuclide in a particular material is normally expressed in terms of activity, which is the rate at which nuclear transformations occur at a certain time. The unit of activity is the becquerel (Bq). Radionuclides can differ markedly in their physical characteristics (decay mode, radioactive half-life), and in their behaviour in the human body and in the environment. Consequently, the relative importance of different pathways of exposure to radiation is also dependent on the radionuclide of interest. Exposure can occur via external irradiation, when radionuclides are outside the human body, or via internal irradiation, following the intake of radionuclides via ingestion or inhalation. The potential harm to a person from exposure to radiation is expressed in terms of radiation dose — which is a measure of the energy deposited in tissue by radiation. The quantity ‘effective dose’ takes account of the varying radiation sensitivities of different organs and tissues to different types of radiation; its unit is the sievert (Sv). The radiation doses received as a result of the intake of radionuclides into the human body may be delivered over a considerable period of time after the intake and, in this report, they are assessed in terms of ‘committed effective doses’, this means the effective dose integrated to 50 years after intake for adults and 70 years after intake for children. The IAEA [3] and the International Commission on Radiological Protection (ICRP) [4, 5] have published coefficients relating intakes of radionuclides and the associated committed effective radiation doses. In practice, the annual radiation doses arising from the presence of radionuclides in the environment are at the level of millisievert (mSv), which is one thousandth of one sievert, or microsievert (µSv), which is one millionth of one sievert.
Exposure to any radioactive material, whether of natural or artificial origin, gives rise to an
incremental risk of developing cancer. This risk is assumed to be proportional to the dose received [3, 6]. The additional risk of fatal cancer associated with a dose of 1 mSv is assumed to be about 1 in 20 000. This small increase in lifetime risk can be contrasted with the 1 in 5 risk of fatal cancer that people usually incur from all causes in their lives.
2.2. INTERNATIONAL SAFETY STANDARDS
The IAEA, together with other relevant international organizations, has established the basic requirements for protection against the risks associated with exposure to ionizing radiation; these are published in the Basic Safety Standards (BSS) [3]. The BSS are based primarily on the recommendations of the ICRP [6] and on the assessments of the health effects of radiation of the United Nations Scientific Committee on the Effects of Atomic Radiation (UNSCEAR) [7], and do not apply to non-ionizing radiation or to chemical or biological pollutants.
The BSS cover a wide range of situations that give rise to or could give rise to exposure to radiation, and are applicable to exposures from any combination of uranium isotopes, including those present in DU.
Another international safety standard provides requirements for the Remediation of Areas Contaminated by Past Activities and Accidents [1]. It recommends, as a generic reference level for aiding decisions on remediation, an individual existing annual effective dose of 10 mSv from all sources, including natural background radiation. In addition, it recommends an upper value of 100 mSv to any organ at which intervention would be justified under almost any circumstances.
To put it into perspective, the worldwide average annual effective dose from natural background radiation is 2.4 mSv, with a typical range of 1–20 mSv [7]. The most significant contribution to the worldwide average annual effective dose comes from exposure to radon and its decay products (1.15 mSv); exposure to terrestrial gamma rays and cosmic rays account for 0.48 mSv and 0.38 mSv, respectively; the contribution of the intake of natural radionuclides in air, food and water to the average dose is 0.31 mSv, mainly due to 40K (0.17 mSv), 210Po (0.086 mSv), 210Pb (0.032 mSv)
6

and 228Ra (0.021 mSv); uranium isotopes contribute little to the dose.
2.3. URANIUM AND DU
Uranium is a naturally occurring radioactive element. In its pure form, it is a silver coloured heavy metal similar to lead, cadmium and tungsten. Like tungsten, it is very dense, with a density of about 19 g/cm3. In its natural state, uranium consists of three isotopes (238U, 235U and 234U). Other isotopes which can exist but are not found in natural uranium are 237U, 236U, 233U and 232U.
In the process of uranium enrichment, uranium is enriched in its 235U content. The enriched uranium is mainly used in nuclear reactors to produce energy. During the uranium enrichment process, the fraction of 235U is increased from its natural level (0.72% by mass) to 2% or more by mass. The uranium that remains after the enriched fraction has been removed has reduced concentrations of 235Uand 234U. This by-product of the enrichment process is known as DU. Typically, the percentage concentration by mass of 235U in DU used for military purposes is 0.2% [8].
The total specific activity of natural uranium (i.e. the activity per unit mass of natural uranium
metal) is 25.4 Bq/mg. In nature, uranium isotopes are in radioactive equilibrium with the other isotopes, such as 234Th, 231Th, 226Ra, 223Ra, 222Rn, 210Pb and 210Po, created as a result of radioactive decay. In DU, only traces of decay products beyond 234Th and 231Th are present, as these decay products have not had time to form. The specific activity of DU is 14.2 Bq/mg.
Table 1 gives the half-lives and specific activities of the three isotopes of natural uranium and 236U, and compares their relative abundance by mass in natural uranium and in DU.
There have been reports that the DU in munitions contains small amounts of other radio-nuclides, such as isotopes of americium and plutonium, as well as 236U. The presence of these human-made radionuclides indicates that some of the DU has been obtained from uranium that had been irradiated in nuclear reactors and subsequently reprocessed. However, published information from other theatres of war, as well as the results of this study, indicate that the amounts of these isotopes present in DU are very small [9, 10]. Isotopes of natural uranium decay mainly by emitting alpha particles. The emissions of beta particles and gamma radiation are low. The average energies per transformation emitted by the isotopes of natural uranium are shown in Table 2.
TABLE 1. HALF-LIVES, SPECIFIC ACTIVITIES AND RELATIVE ABUNDANCES OF URANIUM ISOTOPES IN NATURAL URANIUM AND DU
Isotope Half-life (a) Specific activity (Bq/mg)Isotopic abundance (%) by mass
Natural uranium DU
238U 4.51 × 10⁹ 12.44 99.28 99.8236U 2.34 × 10⁷ 2400 0 0.0003
235U 7.1 × 10¹⁰ 80 0.72 0.2234U 2.47 × 10⁵ 230 700 0.0055 0.0007
TABLE 2. AVERAGE ENERGY PER TRANSFORMATION OF THE URANIUM ISOTOPES 238U, 236U, 235U AND 234U
IsotopeAverage energy per transformation (MeV/Bq)
Alpha radiation Beta radiation Gamma radiation
238U 4.26 0.01 0.001
236U 4.57 0.011 0.05235U 4.47 0.048 0.154234U 4.84 0.0013 0.002
7

2.4. URANIUM IN NATURE
Uranium is found in trace amounts in all rocks and soil, in water and air, and in materials made from natural substances. It is a reactive metal, therefore, it is not present in metallic form in the environment, but as uranium compounds. The solubility of uranium compounds varies greatly. Uranium in the environment is dominated by uranium oxides such as UO2, which is an anoxic insoluble compound found in minerals, and UO3, a moderately soluble compound found in surface waters. The chemical form of the uranium compound determines how easily it can move through the environment, as well as how chemically toxic it is.
2.5. EXPOSURE ROUTES FOR DU
The radiation emitted from DU is predominantly in the form of alpha particles (Table 2). Alpha particles have a very limited range in tissue; they can barely penetrate the external layer of the skin, hence do not pose a hazard in terms of external irradiation. Alpha particles, however, are very energetic, and if emitted inside the body can damage nearby cells. Uranium is not transferred very effectively along food chains, and so inhalation is usually the route of intake that merits primary attention.
In a combat situation, the main radiological hazard associated with DU munitions is inhalation of the aerosols created when DU munitions hit an armoured target. Studies carried out at test ranges show that most of the DU aerosols created by the impact of penetrators against an armoured target settle within a short time of the impact and in close
proximity to the site, although smaller particles may be carried to a distance of several hundred metres by the wind [11]. This investigation is concerned with the possible long term effects of DU residues on the population of Iraq; therefore, short term exposures (i.e. of military personnel during the conflict) are not considered.
A possible exposure pathway for those visiting or living in DU affected areas after the aerosols have settled is the inhalation of DU particles in soil that are resuspended through wind or human activities such as ploughing.
Inhalation of DU dust by individuals entering military or other abandoned vehicles hit by DU munitions is also an important exposure pathway.
Another possible pathway of exposure that merits consideration is the inadvertent or deliberate ingestion of soil. For example, farmers working in fields in which DU munitions were fired could inadvertently ingest small quantities of soil, as could small children in such an environment, who may eat small quantities of soil as they play.
Generally, a large proportion of DU munitions fired from aircraft miss their intended targets. The physical state of these munitions, once fired, varies from small fragments to whole intact penetrators, either totally or partially encased in their aluminium jackets. Individuals who find and handle such munitions could be exposed via external irradiation due to the beta particles and gamma rays emitted by the DU (Table 2).
Penetrators that do not hit the target corrode with time, forming fragments and particles containing DU oxides, which may range from several millimetres to less than a micrometre in size [13]. People may ingest or inhale some of the uranium oxides formed through this weathering process.
8
3. RADIATION EXPOSURE
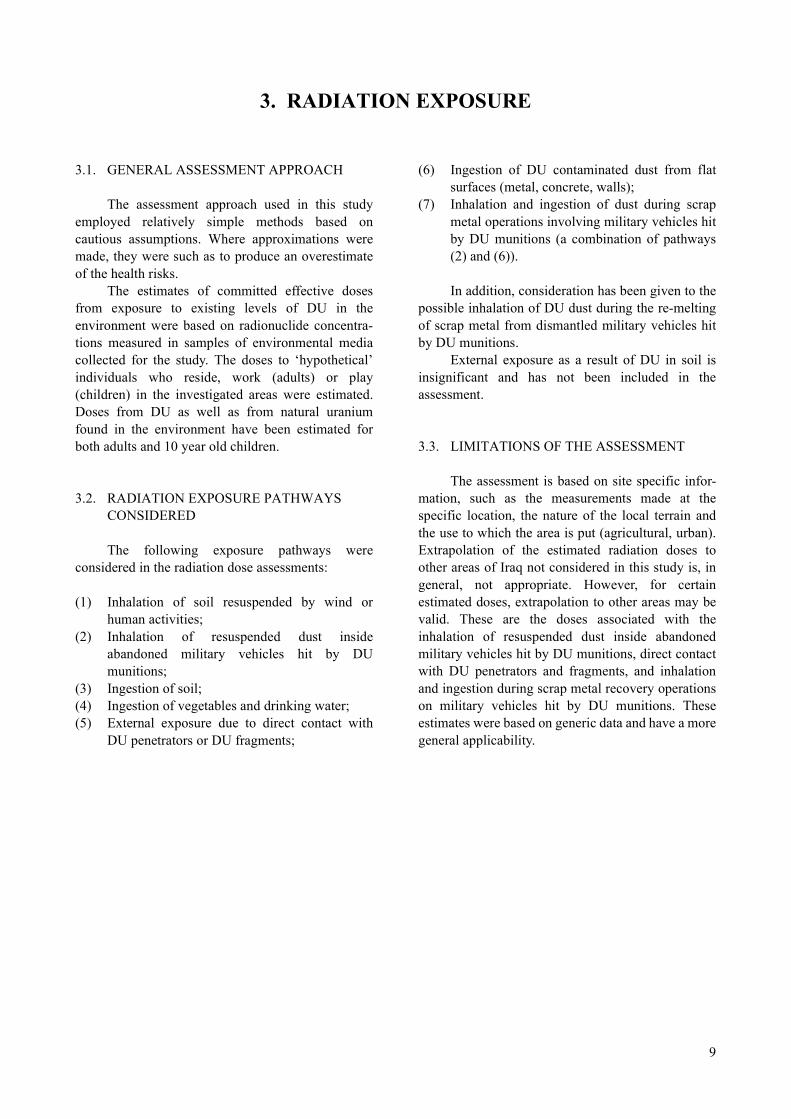
3.1. GENERAL ASSESSMENT APPROACH
The assessment approach used in this study employed relatively simple methods based on cautious assumptions. Where approximations were made, they were such as to produce an overestimate of the health risks.
The estimates of committed effective doses from exposure to existing levels of DU in the environment were based on radionuclide concentra-tions measured in samples of environmental media collected for the study. The doses to ‘hypothetical’ individuals who reside, work (adults) or play (children) in the investigated areas were estimated. Doses from DU as well as from natural uranium found in the environment have been estimated for both adults and 10 year old children.
3.2. RADIATION EXPOSURE PATHWAYS CONSIDERED
The following exposure pathways were considered in the radiation dose assessments:
(1) Inhalation of soil resuspended by wind or human activities;
(2) Inhalation of resuspended dust inside abandoned military vehicles hit by DU munitions;
(3) Ingestion of soil;(4) Ingestion of vegetables and drinking water;(5) External exposure due to direct contact with
DU penetrators or DU fragments;
(6) Ingestion of DU contaminated dust from flat surfaces (metal, concrete, walls);
(7) Inhalation and ingestion of dust during scrap metal operations involving military vehicles hit by DU munitions (a combination of pathways (2) and (6)).
In addition, consideration has been given to the possible inhalation of DU dust during the re-melting of scrap metal from dismantled military vehicles hit by DU munitions.
External exposure as a result of DU in soil is insignificant and has not been included in the assessment.
3.3. LIMITATIONS OF THE ASSESSMENT
The assessment is based on site specific infor-mation, such as the measurements made at the specific location, the nature of the local terrain and the use to which the area is put (agricultural, urban). Extrapolation of the estimated radiation doses to other areas of Iraq not considered in this study is, in general, not appropriate. However, for certain estimated doses, extrapolation to other areas may be valid. These are the doses associated with the inhalation of resuspended dust inside abandoned military vehicles hit by DU munitions, direct contact with DU penetrators and fragments, and inhalation and ingestion during scrap metal recovery operations on military vehicles hit by DU munitions. These estimates were based on generic data and have a more general applicability.
9

4. METHODOLOGY USED FOR THE ESTIMATION OF DOSE
4.1. INHALATION OF DU CONTAMINATED SOIL RESUSPENDED BY WINDOR HUMAN ACTIVITIES
The estimation of radiation doses from the inhalation of resuspended material requires information on the concentration of the material in air. In this study, these concentrations were modelled, not measured, using a simple air dust loading approach expressed in the following equation:
Cair, i = SCsoil, i
where Cair, i is the activity concentration of each uranium isotope in air (Bq/m3), S is the dust loading factor (kg/m3) and Csoil, i is the activity concentration of each uranium isotope in soil (Bq/kg).
The dust loading approach has an advantage over more process oriented approaches in that it requires no data on the processes giving rise to airborne concentrations, for example, wind velocity and particle size. However, it tends to be conservative in assuming a constant airborne concentration of locally derived soil particles. The model also implies that the radionuclides inhaled are associated with the soil particles, which is likely to become realistic only after a longer period of time following the deposition event. Finally, the use of air concentrations derived from the dust loading model assumes that the size distribution of the DU particles associated with the soil is in the respirable range (less than 10 μm). In fact, in another similar assessment study, the presence of DU particles in the respirable range, being AMAD <10 μm (where AMAD refers to ‘activity median aerodynamic diameter’), was experimentally confirmed [2].
The dust loading factor used in this assessment was evaluated on the basis of the information in Ref. [9], where dust loading factors of 2.0 × 10⁻⁶ kg/m3
for wind driven resuspension and 3.0 × 10⁻⁵ kg/m3 for human-made resuspension (agriculture, digging, driving) are reported. These values were based on measurements taken at the Emu and Maralinga nuclear test sites in Australia [14]. Since no information on dust loading factors was available for the investigated locations, an average value of S = 1.6 × 10⁻⁵ (kg/m3) was assumed in the calculations.
The uranium isotope activity concentrations in soil were obtained by multiplying the measured concentrations expressed in mg/kg by the specific activities of 238U, 236U, 235U and 234U contained in column 3 of Table 1.
The next step in the dose assessment is the evaluation of the intake of air containing DU by an exposed individual at the DU contaminated location. Average inhalation rates of adults and children considered in the assessment were taken from Ref. [15] and are given in Table 3. The intake of DU contaminated air (m3) by inhalation can be evaluated from knowledge of the time spent by hypothetical exposed individuals at the location.
The total amount of radioactivity (Bq) of each uranium isotope that a hypothetical individual would inhale is obtained by multiplying the intake (m3) by the activity concentration in air, Cair, i (Bq/m3). This may be converted to radiation dose (Sv) using the dose coefficients in Table 4.
The dose coefficients for inhalation used in the calculations were taken from the BSS [3]. Dose coefficients for inhalation are available for three types of material, classified as type F, M and S, according to whether the absorption rate of the material into body fluids from the respiratory tract is considered to be fast (very soluble compounds), moderate or slow (insoluble compounds). The chemical composition of the DU particles produced from the oxidation of uranium in the DU munitions has been shown by experimental studies [16] to consist of 50% UO2, and 50% U3O8 or a mixture of ⅔ UO2 and ⅓ U3O8. As shown in Ref. [17], both of these forms can be considered as slightly soluble uranium oxides. Consequently, in this assessment, the inhalation dose coefficients used were those for compounds with a slow absorption rate (type S).
TABLE 3. AVERAGE INHALATION RATES
Age group Inhalation rate (m3/h)
Adults 0.84
Children (10 years old) 0.64
10
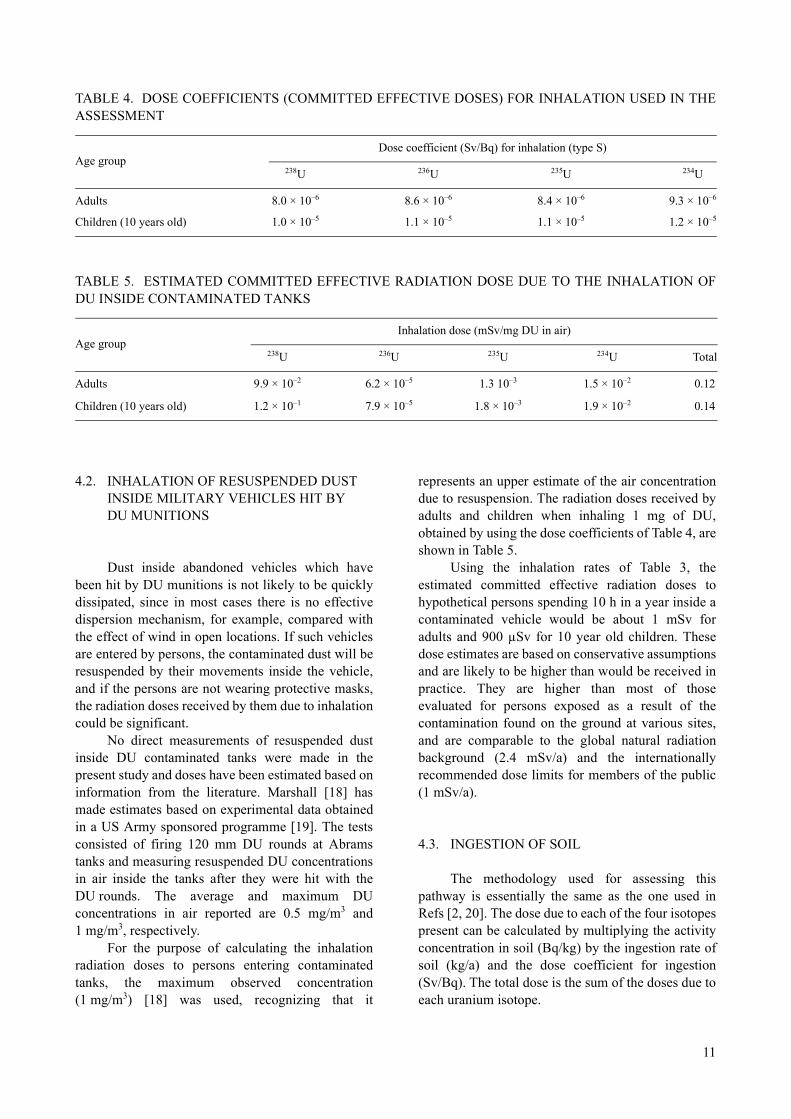
4.2. INHALATION OF RESUSPENDED DUST INSIDE MILITARY VEHICLES HIT BY DU MUNITIONS
Dust inside abandoned vehicles which have been hit by DU munitions is not likely to be quickly dissipated, since in most cases there is no effective dispersion mechanism, for example, compared with the effect of wind in open locations. If such vehicles are entered by persons, the contaminated dust will be resuspended by their movements inside the vehicle, and if the persons are not wearing protective masks, the radiation doses received by them due to inhalation could be significant.
No direct measurements of resuspended dust inside DU contaminated tanks were made in the present study and doses have been estimated based on information from the literature. Marshall [18] has made estimates based on experimental data obtained in a US Army sponsored programme [19]. The tests consisted of firing 120 mm DU rounds at Abrams tanks and measuring resuspended DU concentrations in air inside the tanks after they were hit with the DU rounds. The average and maximum DU concentrations in air reported are 0.5 mg/m3 and 1 mg/m3, respectively.
For the purpose of calculating the inhalation radiation doses to persons entering contaminated tanks, the maximum observed concentration (1 mg/m3) [18] was used, recognizing that it
represents an upper estimate of the air concentration due to resuspension. The radiation doses received by adults and children when inhaling 1 mg of DU, obtained by using the dose coefficients of Table 4, are shown in Table 5.
Using the inhalation rates of Table 3, the estimated committed effective radiation doses to hypothetical persons spending 10 h in a year inside a contaminated vehicle would be about 1 mSv for adults and 900 µSv for 10 year old children. These dose estimates are based on conservative assumptions and are likely to be higher than would be received in practice. They are higher than most of those evaluated for persons exposed as a result of the contamination found on the ground at various sites, and are comparable to the global natural radiation background (2.4 mSv/a) and the internationally recommended dose limits for members of the public (1 mSv/a).
4.3. INGESTION OF SOIL
The methodology used for assessing this pathway is essentially the same as the one used in Refs [2, 20]. The dose due to each of the four isotopes present can be calculated by multiplying the activity concentration in soil (Bq/kg) by the ingestion rate of soil (kg/a) and the dose coefficient for ingestion (Sv/Bq). The total dose is the sum of the doses due to each uranium isotope.
TABLE 4. DOSE COEFFICIENTS (COMMITTED EFFECTIVE DOSES) FOR INHALATION USED IN THE ASSESSMENT
Age groupDose coefficient (Sv/Bq) for inhalation (type S)
238U 236U 235U 234U
Adults 8.0 × 10⁻⁶ 8.6 × 10⁻⁶ 8.4 × 10⁻⁶ 9.3 × 10⁻⁶
Children (10 years old) 1.0 × 10⁻⁵ 1.1 × 10⁻⁵ 1.1 × 10⁻⁵ 1.2 × 10⁻⁵
TABLE 5. ESTIMATED COMMITTED EFFECTIVE RADIATION DOSE DUE TO THE INHALATION OF DU INSIDE CONTAMINATED TANKS
Age groupInhalation dose (mSv/mg DU in air)
238U 236U 235U 234U Total
Adults 9.9 × 10⁻² 6.2 × 10⁻⁵ 1.3 10–3 1.5 × 10⁻² 0.12
Children (10 years old) 1.2 × 10⁻¹ 7.9 × 10⁻⁵ 1.8 × 10⁻³ 1.9 × 10⁻² 0.14
11
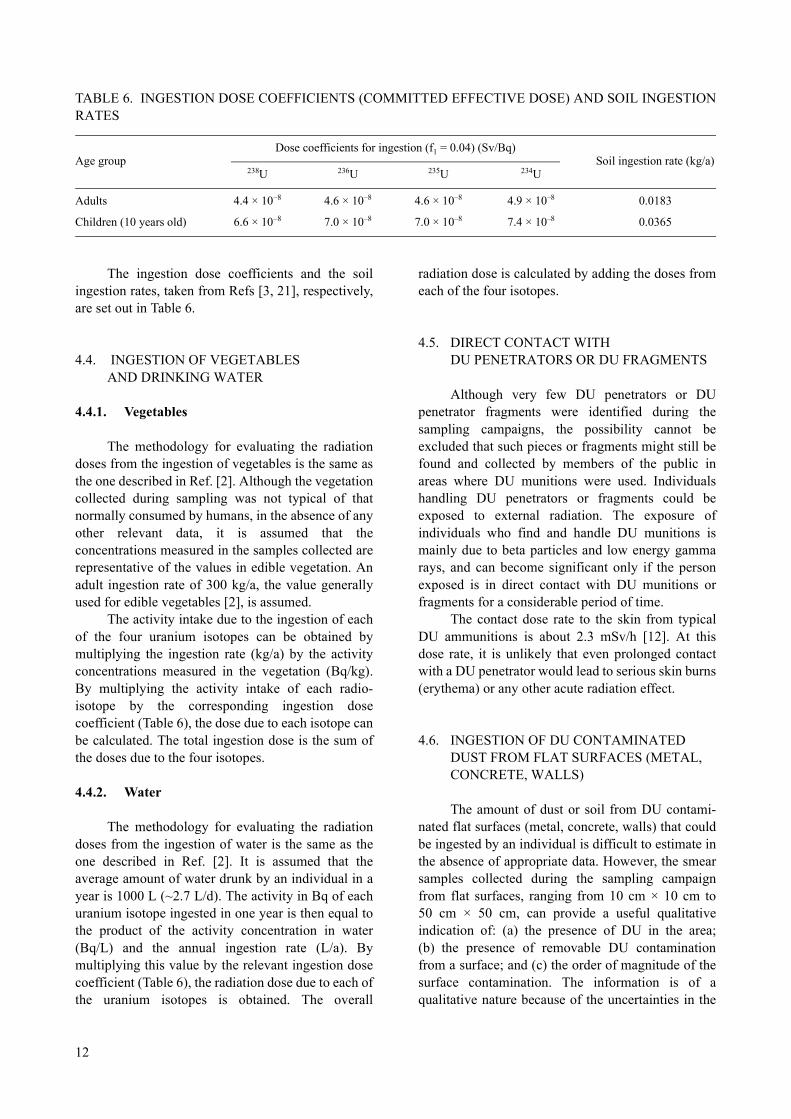
The ingestion dose coefficients and the soil ingestion rates, taken from Refs [3, 21], respectively, are set out in Table 6.
4.4. INGESTION OF VEGETABLESAND DRINKING WATER
4.4.1. Vegetables
The methodology for evaluating the radiation doses from the ingestion of vegetables is the same as the one described in Ref. [2]. Although the vegetation collected during sampling was not typical of that normally consumed by humans, in the absence of any other relevant data, it is assumed that the concentrations measured in the samples collected are representative of the values in edible vegetation. An adult ingestion rate of 300 kg/a, the value generally used for edible vegetables [2], is assumed.
The activity intake due to the ingestion of each of the four uranium isotopes can be obtained by multiplying the ingestion rate (kg/a) by the activity concentrations measured in the vegetation (Bq/kg). By multiplying the activity intake of each radio-isotope by the corresponding ingestion dose coefficient (Table 6), the dose due to each isotope can be calculated. The total ingestion dose is the sum of the doses due to the four isotopes.
4.4.2. Water
The methodology for evaluating the radiation doses from the ingestion of water is the same as the one described in Ref. [2]. It is assumed that the average amount of water drunk by an individual in a year is 1000 L (~2.7 L/d). The activity in Bq of each uranium isotope ingested in one year is then equal to the product of the activity concentration in water (Bq/L) and the annual ingestion rate (L/a). By multiplying this value by the relevant ingestion dose coefficient (Table 6), the radiation dose due to each of the uranium isotopes is obtained. The overall
radiation dose is calculated by adding the doses from each of the four isotopes.
4.5. DIRECT CONTACT WITHDU PENETRATORS OR DU FRAGMENTS
Although very few DU penetrators or DU penetrator fragments were identified during the sampling campaigns, the possibility cannot be excluded that such pieces or fragments might still be found and collected by members of the public in areas where DU munitions were used. Individuals handling DU penetrators or fragments could be exposed to external radiation. The exposure of individuals who find and handle DU munitions is mainly due to beta particles and low energy gamma rays, and can become significant only if the person exposed is in direct contact with DU munitions or fragments for a considerable period of time.
The contact dose rate to the skin from typical DU ammunitions is about 2.3 mSv/h [12]. At this dose rate, it is unlikely that even prolonged contact with a DU penetrator would lead to serious skin burns (erythema) or any other acute radiation effect.
4.6. INGESTION OF DU CONTAMINATED DUST FROM FLAT SURFACES (METAL, CONCRETE, WALLS)
The amount of dust or soil from DU contami-nated flat surfaces (metal, concrete, walls) that could be ingested by an individual is difficult to estimate in the absence of appropriate data. However, the smear samples collected during the sampling campaign from flat surfaces, ranging from 10 cm × 10 cm to 50 cm × 50 cm, can provide a useful qualitative indication of: (a) the presence of DU in the area; (b) the presence of removable DU contamination from a surface; and (c) the order of magnitude of the surface contamination. The information is of a qualitative nature because of the uncertainties in the
TABLE 6. INGESTION DOSE COEFFICIENTS (COMMITTED EFFECTIVE DOSE) AND SOIL INGESTION RATES
Age groupDose coefficients for ingestion (f1 = 0.04) (Sv/Bq)
Soil ingestion rate (kg/a)238U 236U 235U 234U
Adults 4.4 × 10⁻⁸ 4.6 × 10⁻⁸ 4.6 × 10⁻⁸ 4.9 × 10⁻⁸ 0.0183
Children (10 years old) 6.6 × 10⁻⁸ 7.0 × 10⁻⁸ 7.0 × 10⁻⁸ 7.4 × 10⁻⁸ 0.0365
12

nature of the surface from which the smear samples were taken and, among other things, the variability of the pressure exerted by persons taking the smear sample.
Nevertheless, a conservative estimation of the doses from ingestion of DU from the sampled surfaces was made based on the following assumptions:
— The smear samples where the highest total uranium mass was measured are representative of all the smear samples taken in this area;
— The reported primary analytical data, expressed as the total mass of each uranium isotope present in the smear test, actually represents the mass of each uranium isotope present on the sampled surface;
— The total mass is completely collected from the surface by an individual touching the surface with his/her hands;
— The total mass is then fully ingested by this individual;
— The individual touches surfaces having the same highest uranium isotope concentration of 100 times per year.
The total dose due to each of the four uranium isotopes can then be calculated by multiplying the measured activity (Bq) of the uranium isotope taken from the sampled surface by 100 and by the dose coefficient for ingestion of the uranium isotope (Sv/Bq). The total dose is the sum of the doses from each isotope.
4.7. INHALATION AND INGESTION OF DU DURING SCRAP METAL OPERATIONS FOR MILITARY VEHICLES HIT BY DU MUNITIONS
The calculation of the possible doses received during the various processes involved in manipu-lating scrap metal from contaminated military vehicles can be assessed by a combination of the pathways previously discussed, that is, inhalation of resuspended dust inside military vehicles hit by DU munitions and ingestion of DU contaminated dust from flat surfaces.
13

5. CONSIDERATION OFTHE POSSIBLE HAZARDS ASSOCIATED WITHTHE RE-MELTING OF SCRAP METAL FROM
DISMANTLED MILITARY VEHICLES
The radiological concern in melting radioactive contaminated metal scrap is that the melting process can create potential exposure pathways. Four main possibilities exist in the melting of ferrous scrap:
(1) The contaminant element can stay in the metal (e.g. cobalt and ruthenium).
(2) The contaminant element can enter the slag (e.g. lanthanides and actinides).
(3) The contaminant element can become associated with the furnace dust and be collected with the fly ash (e.g. caesium).
(4) The contaminant element can pass through all filtration/retention processes to enter the air in the local environment (e.g. iodine) [23].
In the case of uranium, about 95% of it by weight goes into slag and about 5% accompanies the
furnace dust or fly ash. Thus, radiation exposure may occur during: the transport of the metal to the melter; the cutting process; the transfer of off-gases to the bag house; the processing of the dust; and the processing of the slag.
For ensuring radiation protection, it is important that the melting facilities are properly equipped so that radiation exposure is minimized. This requires special facilities and equipment that is not likely to be present in normal scrap metal melters. For these reasons, it is not advisable for metal from vehicles hit by DU munitions to be used as scrap metal unless such special facilities are available. In the absence of such facilities, direct disposal as LLRW (without any decontamination) is to be preferred from a radiological perspective, since it is associated with fewer potential exposure pathways.
14
6. EVALUATION OF THE RADIATION DOSES ATTHE FOUR INVESTIGATED LOCATIONS
A description of the four investigated locations (As Samawah, An Nasiriyah, Al Basrah and Az Zubayr) and of the battles that took place there is given in Appendix I. At each location a number of selected areas, nominated areas of interest (AOI), were investigated. These are also described in Appendix I. The criteria used to identify these areas and the sampling methodology employed are described in Appendix II.
The results of the analyses conducted by the Spiez Laboratory are reported in Appendix III: Table 45 Soil Samples; Table 46 Water Samples; Table 47 Vegetation Samples; and Table 48 Surface Samples (Smears).
Unless otherwise specified, the estimated radiation doses are committed effective doses calculated for intakes in an assumed period of one year using the measured radionuclide concentrations in the samples (Appendix III) and the habit data summarized in Appendix IV.
The overall radiation doses were calculated by adding the individual doses from each of the four isotopes (238U, 236U, 235U and 234U) present in the samples. The doses due only to DU were calculated by first calculating the percentage of DU present in the sample using the equation given in Appendix III. This assumes that the isotope ratio 235U/238U of DU is 0.002.
In most instances, the dose calculations were based on the samples having the highest DU concentrations.
The doses were calculated for both adults and 10 year old children.
6.1. AS SAMAWAH
6.1.1. Doses due to the inhalation of soil resuspended by wind or human activities
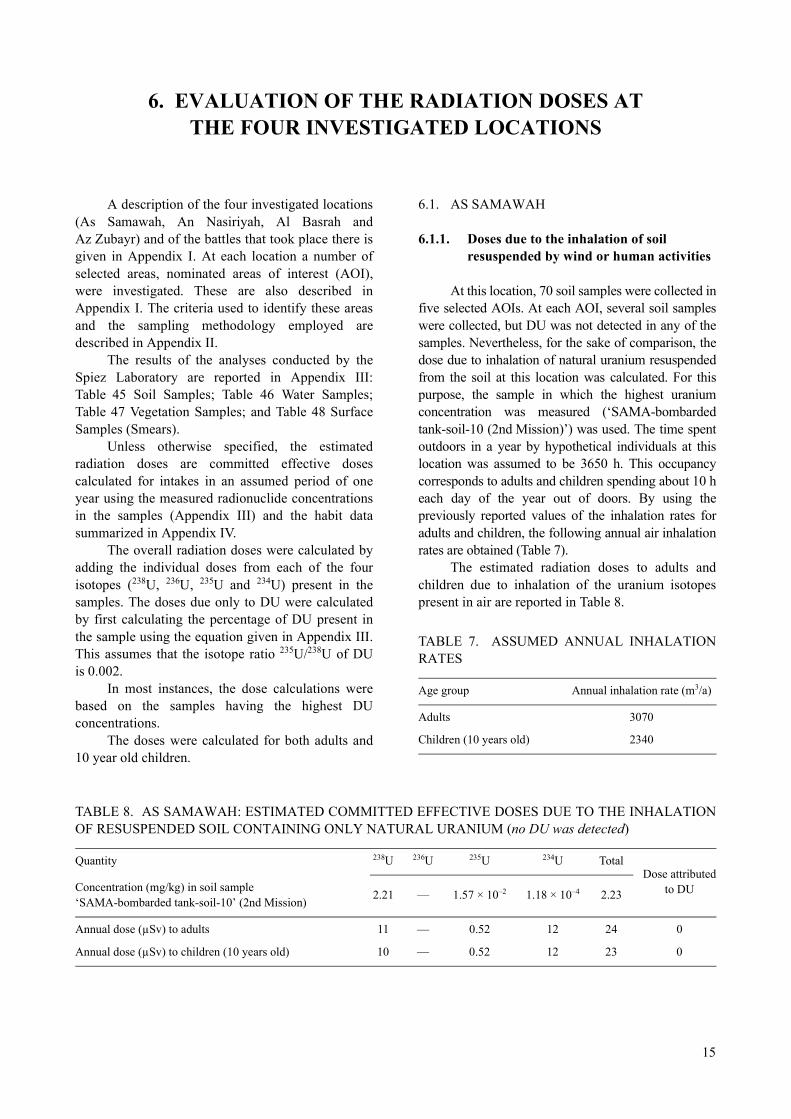
At this location, 70 soil samples were collected in five selected AOIs. At each AOI, several soil samples were collected, but DU was not detected in any of the samples. Nevertheless, for the sake of comparison, the dose due to inhalation of natural uranium resuspended from the soil at this location was calculated. For this purpose, the sample in which the highest uranium concentration was measured (‘SAMA-bombarded tank-soil-10 (2nd Mission)’) was used. The time spent outdoors in a year by hypothetical individuals at this location was assumed to be 3650 h. This occupancy corresponds to adults and children spending about 10 h each day of the year out of doors. By using the previously reported values of the inhalation rates for adults and children, the following annual air inhalation rates are obtained (Table 7).
The estimated radiation doses to adults and children due to inhalation of the uranium isotopes present in air are reported in Table 8.
TABLE 7. ASSUMED ANNUAL INHALATION RATES
Age group Annual inhalation rate (m3/a)
Adults 3070
Children (10 years old) 2340
TABLE 8. AS SAMAWAH: ESTIMATED COMMITTED EFFECTIVE DOSES DUE TO THE INHALATION OF RESUSPENDED SOIL CONTAINING ONLY NATURAL URANIUM (no DU was detected)
Quantity 238U 236U 235U 234U TotalDose attributed
to DUConcentration (mg/kg) in soil sample‘SAMA-bombarded tank-soil-10’ (2nd Mission)
2.21 — 1.57 × 10⁻² 1.18 × 10⁻⁴ 2.23
Annual dose (µSv) to adults 11 — 0.52 12 24 0
Annual dose (µSv) to children (10 years old) 10 — 0.52 12 23 0
15

For a perspective on the values reported in Table 8, the estimated radiation dose (to both adults and children spending a large portion of their time out of doors) due to the inhalation of uranium naturally present in soil (i.e. DU is absent) at this location is about 1% of the global average annual effective dose due to natural radiation (~2.4 mSv) [7]. In fact, the doses due to resuspended natural uranium in soil are likely to be much lower owing to the conservative nature of the dust loading modelling approach (see Section 4.1).
6.1.2. Doses due to the ingestion of soil
As no DU was detected in any of the soil samples collected, no calculation of radiation dose due to ingestion was performed.
6.1.3. Doses due to the ingestion of vegetables and drinking water
6.1.3.1. Vegetables
At this AOI, 15 samples of vegetation (of an unknown type) were collected. In three samples, traces of DU were detected. However, the analysing laboratory (Spiez Laboratory) reported that the presence of DU was most likely to be due to cross-contamination. As a conservative approach, it was assumed that the values are real. The annual radiation doses due to the ingestion of this vegetation were calculated using the concentrations measured in sample ‘SAMA-103-vegetation-A’. The estimated doses are reported in Table 9.
6.1.3.2. Water
At this AOI, ten water samples were collected. No DU was detected in any of the samples.
6.1.4. Doses due to the ingestion ofDU contaminated dust from flatsurfaces (metal, concrete, walls)
Fifty-seven smear samples were collected at this location. For many of the samples, the analytical laboratory reported that there was evidence of cross-contamination which most likely occurred during the sample packaging. Seventeen smear samples were taken from parts of tanks and artillery cannons still on the railway train where they were hit by DU ammunition during the conflict. The highest DU percentage (18%) was measured in a sample taken from a wall, namely, sample ‘SAMA-409-smear-W-A’. The estimation of the radiation dose due to ingestion was made using this sample. It must be emphasized again that this is a very unlikely ‘worst case’ situation, as it implies that a person (child or adult) could have his/her hands in contact with the contaminated surface on 100 occasions in a year, and that all uranium collected by the surface smear is equivalently transferred to his/her hands, and that all of the transferred material is ingested. The radiation doses are reported in Table 10.
6.2. AN NASIRIYAH
6.2.1. Doses due to the inhalation of soil resuspended by wind or human activities
At this location, samples were collected in 13 out of the 15 selected AOIs. The total number of soil samples collected was 106. DU was detected in 12 samples. In all AOIs, several soil samples were collected with the exception of the AOI denominated as ‘additional points’, where only two samples were collected, namely, at a scrapyard of destroyed
TABLE 9. AS SAMAWAH: ESTIMATED COMMITTED EFFECTIVE DOSES DUE TO THE INGESTION OF VEGETATION (10.5% DU)
Quantity 238U 236U 235U 234U TotalDose attributed
to DUConcentration (mg/kg dry weight) in sample‘SAMA-103-vegetation-A’
7.20 × 10⁻² 1.63 × 10⁻⁷ 4.73 × 10⁻⁴ 4.01 × 10⁻⁶ 7.25 × 10⁻²
Annual dose (µSv) to adults 11.7 0.0054 0.51 13.5 ~ 26 ~ 2
Annual dose (µSv) to children (10 years old) 17.7 0.0081 0.78 20.4 ~ 39 ~ 3
16

military vehicles (‘Nasir-soil-scraps’) and near a tank hit by DU ammunition (‘Nasir-soil bombed tank’). Owing to the unique nature of these two samples, they are not considered to be representative of the average composition of the soil that could become resuspended. For this reason, they have not been included in the calculation of the annual doses attrib-utable to soil resuspension. However, it must be observed that, even if they had been included, the resulting doses would not have been substantially changed. In physical terms, this means that, in the case of soil resuspension, where air with resuspended soil from several and sometimes distant locations becomes mixed, the influence of these two unique samples on the average concentration of DU in air is not significant, because of the considerable dilution with air coming from other areas. The situation is different in the case of soil ingestion, as it cannot be excluded that an adult may work or a child play at these precise contaminated spots (see Section 6.2.2).
The sample in which the highest DU concen-tration was measured (‘Nasir-soil-02-09’) was used for the calculation of the inhalation dose. The time spent outdoors in a year by hypothetical exposed individuals at this location was assumed to be 3650 h. This occupancy corresponds to adults and children spending about 10 h each day of the year out of doors.
By using the previously reported values of the inhalation rates for adults and children (Table 7), the inhalation doses shown in Table 11 were calculated.
The estimated annual inhalation dose due to DU in this area to both adults and children is about 1 µSv. This is a small radiation dose, about 0.6% of the world average annual dose due to natural radiation (~2.4 mSv/a). In fact, the doses received by any persons living in this vicinity are likely to be much smaller than the estimates in Table 11, because the time that any persons are exposed in a year is likely to be much less than that assumed here and also because of the conservative nature of the dust loading model employed (see Section 4.1).
6.2.2. Doses due to the ingestion of soil
The radiation dose that a person could receive via this pathway by spending 10 d in a year at the most contaminated spot identified in this area can be calculated using the uranium isotope concentrations measured in the sample ‘Nasir-soil-scraps’. This sample was collected in the proximity of a tank hit by DU ammunition. The dose estimate based on this measurement is conservative because the measurement is higher than the average levels in soil at An Nasiriyah and, furthermore, it is unlikely that
TABLE 10. AS SAMAWAH: ESTIMATED COMMITTED EFFECTIVE DOSES DUE TO THE INGESTION OF URANIUM ISOTOPES PRESENT ON THE MOST DU CONTAMINATED SURFACE MEASURED (18% DU)
Quantity 238U 236U 235U 234U TotalDose attributed
to DUAmount (mg) present insample ‘SAMA-409-smear-W-A’
2.65 × 10⁻⁵ 5.03 × 10⁻¹⁰ 1.84 × 10⁻⁷ 1.55 × 10⁻⁹ 2.67 × 10⁻⁵
Annual dose (µSv) to adults 1.5 × 10⁻³ 5.6 × 10⁻⁶ 6.8 × 10⁻⁵ 1.8 × 10⁻³ ~ 3 × 10⁻³ 1 × 10⁻⁴
Annual dose (µSv) to children(10 years old)
2.2 × 10⁻³ 8.5 × 10⁻⁶ 1.0 × 10⁻⁴ 2.6 × 10⁻³ ~ 5 × 10⁻³ 2 × 10⁻⁴
TABLE 11. AN NASIRIYAH: ESTIMATED COMMITTED EFFECTIVE DOSES DUE TO THE INHALATION OF RESUSPENDED SOIL
Quantity 238U 236U 235U 234U TotalDose attributed
to DUConcentration (mg/kg) insoil sample ‘Nasir-soil-02-09’
2.10 3 × 10⁻⁶ 13.8 × 10⁻³ 1.11 × 10⁻⁴ 2.11
Annual dose (µSv) to adults 10 0.0030 0.45 12 ~ 22 ~ 1
Annual dose (µSv) to children(10 years old)
9.8 0.0030 0.45 11 ~ 22 ~ 1
17

an individual would spend 10 d in a year at exactly the spot where the sample was taken. It is, therefore, a very conservative assumed exposure scenario.
The results of the calculations are shown in Table 12.
6.2.3. Doses due to the ingestion of vegetables and drinking water
6.2.3.1. Vegetables
No vegetation samples were collected.
6.2.3.2. Water
At this location, three water samples were collected from surface water puddles. Although all three samples were found to contain some DU, in two of them, cross-contamination was suspected by the analysts of the Spiez Laboratory. For the purpose of the dose calculation, however, all samples were included. The estimates of radiation doses due to the ingestion of water were made using the sample ‘Nasir-water-01-02’, in which the highest uranium concentration and the highest percentage of DU (12%) were measured (Table 13). This is a conservative calculation because of the suspected
cross-contamination and because, in reality, the puddle water is not used for drinking purposes.
Although this is a very conservative calculation, the estimates of dose are low. In fact, the total uranium concentration in the water sample is about five times lower than the WHO guideline value for drinking water of 15 g/L [22].
6.2.4. Doses due to the ingestion ofDU contaminated dust from flatsurfaces (metal, concrete, walls)
Forty-four smear samples were collected in this area. In some of them, there was evidence of cross-contamination that probably occurred during the packaging of the samples. One smear sample (‘smear-bombarded tank (outlet)’) was taken at the point/hole at which a DU penetrator exited the wall of the tank. In this sample, the highest DU percentage (99.1%) was measured. The dose estimates based on this sample are reported in Table 14.
The estimated doses are low but, in view of the conservative assumptions made for ingestion from surfaces (see Section 4.6), and taking account of the extreme nature of the sample chosen, they are undoubtedly overestimates.
TABLE 12. AN NASIRIYAH: ESTIMATED COMMITTED EFFECTIVE DOSES DUE TO THE INGESTION OF SOIL (99.4% DU)
U isotope 238U 236U 235U 234U Total Dose attributed
to DUConcentration (mg/kg) insoil sample ‘Nasir-soil-scraps’
3224 0.0351 6.44 0.0248 3250
Annual dose (Sv) to adults 0.9 0.002 0.012 0.14 ~ 1 ~ 1
Annual dose (Sv) to children(10 years old)
2.7 0.006 0.037 0.43 ~ 3 ~ 3
TABLE 13. AN NASIRIYAH: ESTIMATED COMMITTED EFFECTIVE DOSES DUE TO THE INGESTION OF WATER (12% DU)
U isotope 238U 236U 235U 234U Total Dose attributed
to DUConcentration (mg/L) inwater sample ‘Nasir-water-01-02’
3.32 × 10⁻³ 7.1 × 10⁻⁶ 2.16 × 10⁻⁵ 2.02 × 10⁻⁷ 3.35 × 10⁻³
Annual dose (Sv) to adults 1.81 0.78 0.08 2.28 ~ 5 ~ 1
Annual dose (Sv) to children(10 years old)
2.73 1.19 0.12 3.45 ~ 8 ~ 2
18

6.3. AL BASRAH
6.3.1. Doses due to the inhalation of soil resuspended by wind or human activities
The soil in Al Basrah was sampled in four different AOIs (AOI-1, AOI-2, AOI-3 and AOI-4). A total of 65 soil samples were collected. DU was detected in 26 samples. In AOI-2, no DU was measured. Small amounts of DU were measured in some soil samples taken from AOI-3 and AOI-4. The highest DU concentrations were measured in the soil from AOI-1, where 21 soil samples were collected. Seventeen samples out of 21 were found to contain DU. The highest DU concentrations were found in the four soil samples collected near a tank hit by DU munitions (‘BASRA-115-soil’, ‘BASRA-115-soil a’, ‘BASRA-115-soil b’, ‘BASRA-115-soil c’). However, similarly to the case of An Nasiriyah and for the same reasons given earlier, these samples are not representative and were not used for the calculation.
The inhalation radiation doses were calculated utilizing the concentrations measured in sample ‘BASRA-113-soil’ where the DU percentage was 42.7%. The time spent at the site by hypothetical individuals was assumed to be the same as for An Nasiriyah. Estimated doses from inhalation of resuspended soil are shown in Table 15.
The estimated annual inhalation radiation doses to adults and 10 year old children in Table 16 are very similar to those evaluated for An Nasiriyah.
As an extreme case, the possible inhalation of resuspended contaminated soil that may occur when an abandoned DU contaminated tank is moved from one location to another has been evaluated. The exposed person was assumed not to be wearing a protective mask. Assuming that such an operation would last for 4 h, and that all the dust is generated from the location of the sample (sample ‘BASRA-115-soil c’) where the highest uranium concentration (1901 mg/kg) and DU percentage (10%) were measured, the estimated dose would be about 10 Sv. However, the dust inhaled is most likely to be derived from soils having a uranium concentration that is close to the average of the four samples (‘BASRA-115-soil’, ‘BASRA-115-soil a’, ‘BASRA-115-soil b’, ‘BASRA-115-soil c’), namely, about 700 mg/kg. This concentration corresponds to an inhalation dose of about 3 Sv.
6.3.2. Doses due to the ingestion of soil
Radiation doses due to the ingestion of soil were calculated for an adult working or a child playing near the abandoned tank hit by DUmunitions, directly on the spot where the most contaminated soil was measured (sample
TABLE 14. AN NASIRIYAH: ESTIMATED COMMITTED EFFECTIVE DOSES DUE TO INGESTION FROM CONTAMINATED SURFACES (99.1% DU)
U isotope 238U 236U 235U 234U Total Dose attributed
to DUAmount in mg present in sample‘smear-bombarded tank (outlet)’
9.35 × 10⁻² 1.12 × 10⁻⁴ 1.88 × 10⁻⁴ 6.1 × 10⁻⁷ 9.29 × 10⁻²
Annual dose (Sv) to adults 5.10 0.012 0.07 0.69 ~ 6 ~ 6
Annual dose (Sv) to children(10 years old)
7.66 0.019 0.11 1.04 ~ 9 ~ 9
TABLE 15. AL BASRAH: ESTIMATED COMMITTED EFFECTIVE DOSES DUE TO THE INHALATION OF RESUSPENDED SOIL (4.2% DU)
U isotope 238U 236U 235U 234U Total Dose attributed
to DUConcentration (mg/kg)in soil sample ‘BASRA-113-soil’
2.60 3.5 × 10⁻⁵ 0.0128 1.01 × 10⁻⁴ 2.61
Annual dose (µSv) to adults 13 0.035 0.42 11 ~ 24 ~ 6
Annual dose (µSv) to children(10 years old)
12 0.035 0.42 10 ~ 23 ~ 6
19

‘BASRA-115-soil c’). The radiation doses are given in Table 16. The calculation indicates that even with these pessimistic assumptions, the radiation doses due to ingestion are very low.
6.3.3. Doses due to the ingestion of vegetables and drinking water
6.3.3.1. Vegetables
No vegetation samples were collected.
6.3.3.2. Water
At this location, four water samples were collected. In only two of the samples was DU detected, namely, in ‘BASRA-108-water’ (from a puddle) with total uranium equal to 1.1 µg/L, and ‘BASRA-116-water’ (drinking water) with total uranium equal to 0.9 µg/L. For these two samples, the analysing laboratory reported that the presence of DU was probably due to cross-contamination of the samples. However, even if these samples are included, the concentration of all uranium isotopes in all samples is low in comparison to the sample
‘Nasir-water-01-02’, previously discussed (Table 13). The conclusion can, therefore, be reached that the annual radiation doses from all uranium present will be extremely low.
6.3.4. Doses due to the ingestion ofDU contaminated dust from flat surfaces (metal, concrete, walls)
Thirty-four smear samples were collected at this location. In some of them, there was evidence of cross-contamination that probably occurred during the packaging of the samples. The radiation doses from ingestion of DU contaminated dust were calculated using concentrations measured in smear sample ‘BASRA-115-A-smear-S’, which had the highest DU percentage (~100%) and the highest total U mass. The estimated radiation doses are reported in Table 17.
The estimated doses are low, nevertheless, in view of the conservative assumptions made for ingestion from surfaces (see Section 4.7), and taking account of the extreme nature of the sample chosen, they are undoubtedly overestimates.
TABLE 16. AL BASRAH: ESTIMATED COMMITTED EFFECTIVE DOSES FROM THE INGESTION OF SOIL (100% DU)
U isotope 238U 236U 235U 234U Total Dose attributed
to DUConcentration (mg/kg)in soil sample ‘BASRA-115-soil c’
1901 5.69 × 10⁻² 3.12 1.03 × 10⁻² 1904
Annual dose (µSv) to adults 0.52 0.0031 0.0057 0.058 ~ 0.6 ~ 0.6
Annual dose (µSv) to children(10 years old)
1.6 0.0096 0.017 0.18 ~ 2 ~ 2
TABLE 17. AL BASRAH: ESTIMATED COMMITTED EFFECTIVE DOSES DUE TO INGESTION FROM CONTAMINATED SURFACES (100% DU)
U isotope 238U 236U 235U 234U Total Dose attributed
to DUAmount in mg present in smearsample ‘BASRA-115-A-smear-S’
8.50 × 10⁻² 2.4 × 10⁻⁶ 1.39 × 10⁻⁴ 4.80 × 10⁻⁷ 8.50 × 10⁻²
Annual dose (µSv) to adults 4.7 0.026 0.051 0.54 ~ 5 ~ 5
Annual dose (µSv) to children(10 years old)
7.0 0.040 0.078 0.82 ~ 8 ~ 8
20

6.4. AZ ZUBAYR
6.4.1. Doses due to the inhalation of soil resuspended by wind or human activities
Twenty-two soil samples were collected at this location. DU was measured in nine of them. The most contaminated soil was found at a scrapyard where tanks hit by DU shells and parts of tanks were stored (‘ZUBA-105’). Soil concentra-tions of up to 590 mg/kg were measured at some points. The median soil concentration at this scrapyard (seven samples, all containing DU) was used to calculate doses due to the inhalation of resuspended soil.
The time spent in a year by hypothetical adults and children at the scrapyard was assumed to be 2000 h. This occupancy corresponds to an adult working at the site for about 6 h each day for the whole year, or working 40 h/week for about 12 months of each year, and corresponds to a child playing in the DU contaminated area for about 6 h each day for one year. Inhalation rates for adults and children used in the calculation are reported in Table 4. Annual inhalation rates used in the assessment are reported in Table 18. Estimated annual doses due to the inhalation of resuspended DU contaminated soil are reported in Table 19.
The estimated radiation doses due to the inhalation of resuspended material at this location are higher than the doses estimated at other locations but, nevertheless, small in comparison with the global natural radiation background (2.4 mSv/a) and in comparison with internationally recommended dose limits for members of the public (1 mSv/a). As previously stated, the assumptions made with respect to occupancy and the modelling of resuspension are such that the doses via this pathway are likely to be significantly overestimated.
6.4.2. Doses due to the ingestion ofDU contaminated soil
The radiation doses due to the ingestion of soil at Az Zubayr calculated using the median concen-tration of the seven samples measured (‘ZUBA-105-soil- (2nd mission)’) are reported in Table 20.
TABLE 18. AZ ZUBAYR: ASSUMED ANNUAL INHALATION RATE AT THE SCRAPYARD
Age group Annual inhalation rate (m3/a)
Adults 1680
Children (10 years old) 1280
TABLE 19. AZ ZUBAYR: ESTIMATED COMMITTED EFFECTIVE DOSES DUE TO THE INHALATION OF RESUSPENDED SOIL AT THE SCRAPYARD (94% DU)
U isotope 238U 236U 235U 234U Total
Dose attributedto DU
Concentration (mg/kg)in median ‘ZUBA-105-soil’ samples(‘ZUBA-105-soil-F (2nd Mission)’)
27 5.6 × 10⁻⁴ 5.9 × 10⁻² 2.9 × 10⁻⁴ 27.1
Annual dose (µSv) to adults 72 0.32 1.06 16.8 ~ 90 ~ 72
Annual dose (µSv) to children(10 years old)
68 0.30 1.06 16.4 ~ 86 ~ 70
TABLE 20. AZ ZUBAYR: ESTIMATED COMMITTED EFFECTIVE DOSES DUE TO THE INGESTION OF SOIL (95.4% DU)
U Isotope 238U 236U 235U 234U Total Dose attributed
to DUConcentration (mg/kg)in median ‘ZUBA-105-soil’ samples
27 5.6 × 10⁻⁴ 5.9 × 10⁻² 2.9 × 10⁻⁴ 27.1
Annual dose (µSv) to adults 0.27 0.0011 0.0040 0.060 ~ 0.33 ~ 0.3
Annual dose (µSv) to children(10 years old)
0.81 0.0034 0.012 0.18 ~ 1 ~ 1
21

6.4.3. Doses due to the ingestion of vegetation and drinking water
6.4.3.1. Vegetation
Fifteen vegetation samples were collected. DU was not detected in any of them.
6.4.3.2. Water
One water sample was collected and no DU was detected in it.
6.4.4. Doses due to the ingestion of DU contaminated dust from flatsurfaces (metal, concrete, walls)
Twenty-nine smear samples were collected at this location. In some of them, there was evidence of cross-contamination that probably occurred during the packaging of the samples. One smear sample, ‘ZUBA-105-D1-smear Surface Tank (2nd Mission)’, was taken from the surface of a tank hit by DU ammunition. In this sample, the highest total uranium concentration and one of the highest DU percentages (>99%) were measured. The radiation doses were calculated using this sample and are reported in Table 21. Although slightly higher than doses estimated at other locations, the values are still low in comparison to natural radiation background.
TABLE 21. AZ ZUBAYR: ESTIMATED COMMITTED EFFECTIVE DOSES DUE TO INGESTION FROM CONTAMINATED SURFACES (100% DU)
U Isotope 238U 236U 235U 234U Total
Dose attributedto DU
Amount in mg present in sample‘ZUBA-105-D1-smear Surface Tank(2nd Mission)’
0.154 7 × 10⁻⁷ 3.11 × 10⁻⁴ 1.04 × 10⁻⁶ 0.154
Annual dose (µSv) to adults 8.4 0.0077 0.11 1.2 ~ 10 ~ 10
Annual dose (µSv) to children(10 years old)
13 0.012 0.17 1.8 ~ 15 ~ 15
22

7. SUMMARY OF FINDINGS AND CONCLUSIONS
7.1. ESTIMATES OF RADIATION DOSES INSIDE ABANDONED MILITARY VEHICLES HIT BY DU MUNITIONS
The impact of DU munition on an object generates a DU dust cloud, even if the DU penetrator traverses it and does not remain in the object. The impact causes localized ground contamination around the object and surface contamination on the object itself. In general, the surface contamination is not substantial from a radiological perspective, but some precautionary measures are needed when the objects are touched, handled or manipulated by persons.
As explained in Section 4.2, the doses accumulated by individuals who enter vehicles which have been hit by DU ammunition (generally tanks or armed personnel carriers) due to the inhalation of resuspended dust containing residual DU are likely to be higher than those received out of doors due to the inhalation of resuspended contaminated soil. This is due to the relatively higher concentrations of DU that can be present in the dust inside vehicles and because the dust can remain in place longer periods, since there is no mechanism to disperse it. If it is assumed that a person could spend 10 h inside such a vehicle (adults dismantling it or children playing) and the air concentration of DU is maintained at its maximum estimated value, the committed effective doses via inhalation could be of the order of 1 mSv. These doses are higher than most of those evaluated for persons exposed as a result of the contamination found on the ground at various sites and comparable with the global natural radiation background (2.4 mSv/a) and the internationally recommended dose limits for members of the public (1 mSv/a).
7.2. SITE SPECIFIC FINDINGS
7.2.1. As Samawah
At this location, no DU residues were detected in soil. Two destroyed tanks were found at this location. It was concluded from sampling that one of them was not hit by DU munitions, but it is not known whether any other tank was destroyed by DU munitions as no samples were taken.
7.2.2. An Nasiriyah
DU residues were detected in soil at this location. However, the DU concentrations in soil are low. Upper estimates of the annual doses to adults and children due to the possible inhalation of DU present in the soil are about 1 µSv; doses via ingestion pathways are of the same order. DU was also detected in the scrapyard at this location where local people have been active in steel recycling. Smear tests taken from the surfaces of battle tanks and other military equipment showed evidence of the presence of DU contamination — confirming that the surfaces of tanks hit by DU ammunition become contaminated. The maximum estimated annual radiation dose due to the possible ingestion of DU from contaminated surfaces is about 9 µSv.
7.2.3. Al Basrah
At this location, DU residues were detected in soil. However, the concentrations were low and the maximum estimated annual doses as a result of the possible inhalation of DU present in soil were about 6 µSv; estimated doses due to the ingestion of vegetables, water and soil are less than this. DU was also detected on walls and surfaces of tanks in the area. Maximum possible doses due to the ingestion of DU removed from contaminated walls and surfaces of tanks are about 8 µSv.
7.2.4. Az Zubayr
At this location, DU was detected in the soil samples collected at a scrapyard where tanks hit by DU shells and parts of tanks were stored. Most of the smear tests taken from the battle tanks or other military equipment clearly indicated the presence of DU, and soil spots contaminated with DU were identified with DU concentrations of up to 590 mg/kg. The maximum estimated annual radiation dose due to the inhalation of resuspended soil is about 70 µSv. The radiation doses due to other possible exposure pathways, i.e. the ingestion of DU from surfaces and soil, are significantly lower than this.
23

7.3. OVERALL FINDINGS
(1) On the basis of the measurements carried out on the samples collected in this study, and the estimations using the assumptions and parameters of conservative models, the radiation doses from DU do not pose a radiological hazard to the population at the four studied locations in southern Iraq. The estimated annual radiation doses that could arise from exposure to DU residues in the environment are low, always less than 100 µSv in a year and only to a few, if any, individuals, and therefore of little radiological concern. For perspective, the estimated radiation doses are less than those received on average by individuals in the world from natural sources of radiation in the environment (2.4 mSv/a) and below internationally recommended dose limits for members of the public (1 mSv/a). A further perpective on the radiation doses reported here is provided in Appendix V which contains information on radiation doses received by people from different types of voluntary and involuntary exposures.
(2) The estimated radiation doses are far below the action level of 10 mSv/a set out in the Basic Safety Standards [1] as a criterion to establish whether remedial actions are necessary. Therefore, on the basis of this assessment, no remediation measures (involving soil removal, covering, etc.) are necessary at any of the sites investigated.
(3) The results and conclusions given previously were based on site specific information, such as the measurements made at the specific location, the nature of the local terrain and the use to which the area is put (agricultural, urban), and cannot be directly extrapolated to other locations in Iraq where DU ammunition was used. However, it is likely that the general picture is similar at other locations in Iraq where DU was used in the 2003 conflict. The
conclusions reached in the studies of the radiological situation in Kuwait [2] and in the Balkans [10] were similar to those of this report, and support the conclusion that the radiological impact of the firing of DU munitions is also likely to be generally low in other parts of Iraq.
(4) The doses that could be accumulated by individuals who enter abandoned vehicles which have been hit by DU ammunition may be higher than those from DU in the environment due to the inhalation of residual dust containing DU inside the vehicles. It should be recognized that such vehicles may present an inhalation hazard and members of the public should be prevented from entering them.
(5) Although very few DU penetrators or DU penetrator fragments were identified during the sampling campaign, it cannot be excluded that they might be found and collected by members of the public in areas where DU munitions were used. Individuals who handle DU penetrators or fragments could be exposed to external radiation. Although the radiation dose would become significant only if the person exposed were to be in direct contact with DU munitions or fragments for a considerable period of time, the handling of DU penetrators or fragments should be kept to a minimum, and protective gloves should be worn when DU munitions are being handled. Used DU munitions or fragments should be considered and managed as LLRW.
(6) If military vehicles which have been hit by DU munitions are reprocessed for scrap, exposure may occur during the various scrap metal handling and treatment processes. For this reason, metal from vehicles hit by DU munitions should not be used as scrap metal unless specially equipped melting facilities are available. Rather, the vehicles should be directly disposed of (i.e. without decontami-nation) as LLRW.
24

Appendix I
DESCRIPTION OF THE FOUR LOCATIONS INVESTIGATEDAND OF THE MAJOR BATTLES THAT TOOK PLACE THERE
The information in this appendix was taken from documentation provided to the IAEA by UNEP.
I.1. AS SAMAWAH
As Samawah has a population of approximately 180 000 inhabitants and is located about 250 km south of Baghdad along the main road that links the port of Umm Qasr in the south to Baghdad. The town is split at its northern end by the Euphrates River. Several bridges link both sides of the town together. One main bridge connecting both sides of the town’s main road was subject to heavy fighting in 2003 between Iraqi forces and the Coalition Forces. The major fighting is thought to have taken place on both the south and north sides of the bridge. A cement factory is located to the south-east of the town and was believed to have been used as a strategic location for protection of the main bridge by Iraqi tanks. Tanks were placed south and south-east of the factory in order to provide protection to the main bridge located about 1.5 km away (the approximate firing range of a T-72 tank). The main road continues southwards from the main bridge and curves eastwards for 3–4 km from the main bridge. It is believed that a number of Iraqi tanks were placed along both sides of the road to give protection to the main bridge and town. The sites described comprise the main areas of the current study. Iraqi T-72 tanks are thought to have been placed at and around each of these sites. Although the number of tanks is not known, estimates (based on reports and on common conflict strategies) indicate that about 50 Iraqi tanks were used during the As Samawah battle. Several A-10 Thunderbolt II (‘Warthog’) aircraft attacks are believed to have targeted these sites between 29 March and 2 April 2003. The exact number of attacks is unknown, but reports mention six A-10 ‘Warthog’ attacks and 305 tank rounds. It is known that, in one A-10 attack, up to 2000 DU penetrators can be dropped on the target and its surroundings. The directions of flight of the A-10 planes are unknown.
Four AOIs were investigated within As Samawah, including the area surrounding the main bridge, the main road (upper section), the cement factory and the main road (lower section). Additional investigations were conducted in areas where DU contamination was suspected based on field observa-tions. These areas included vacant land on the outskirts of As Samawah, the train station in the Al-Khafora region, a scrapyard near the cement factory, and areas in which piles of waste and debris were observed. Intact and bombed tanks were observed at several of these locations. Smear and soil samples were collected from the tanks and the immediate areas. A total of 202 samples was collected in the five AOIs (including the additional investigation points), with the following breakdown: 71 soil samples, 10 water samples, 106 smear samples and 15 vegetation samples.
I.1.1. As Samawah — AOI-1
AOI-1 is within an urban area, and the predominant land uses are commercial and residential (Table 22). The ground surface cover consists of paved roads and bridges, bare sandy soil and grassy vegetated areas. The Euphrates River is the main body of surface water in this area, and flows from west to east. AOI-1 was subdivided into 13 sampling areas. In each area, soil, water, surface and vegetation samples were collected. A total of 56 samples (14 soil samples, 5 water samples, 30 smear samples and 7 vegetation samples) were collected. No DU fragments were found. DU was measured in 12 of the smear samples, including those taken from wall and horizontal surfaces. However, the mass spectrometric analysis of the packages of samples indicated that a certain degree of cross-contamination of the samples had occurred during the fieldwork. The results of the DU sampling programme indicate that DU munitions were used in this AOI. The range of the ambient dose rate (1 m above ground) was 0.08–0.16 Sv/h. No DU residues (penetrators, fragments) were found.
25

I.1.2. As Samawah — AOI-2
Tank positions along the road were subject to A-10 aircraft attacks. AOI-2 is within an urban area, consisting predominantly of commercial and residential properties (Table 23). The ground surface cover consists of paved roads, bare sandy soil and grassy vegetated areas. Traffic along the main road is typically heavy. AOI-2 was subdivided into ten sampling areas. In each area, soil, water, surface and vegetation samples were taken. A total of 39 samples (12 soil samples, 5 water samples, 20 smear samples and 2 vegetation samples) were collected. No DU fragments were found. DU was detected in six of the smear samples, including the ones taken from wall and horizontal surfaces. However, the mass spectrometric analysis of the sample packages indicated a certain degree of cross-contamination of the samples during the fieldwork. The results of the DU sampling programme indicate that DU munitions may have been used in AOI-2. The range of the ambient dose rate (1 m above ground) was 0.06–0.15 Sv/h. No DU residues (penetrators, fragments) were found.
I.1.3. As Samawah — AOI-3
TABLE 22. AS SAMAWAH — AOI-1
City/town As Samawah
Area of interest AOI-1
Description Area surrounding the main bridge
UTM coordinates (centroid)
527990 E
3464442 N
Area size 850 m × 700 m
Investigation dates
5–6 February 2006, 7–8 May 2006
Infrastructure
Two bridges across the Euphrates River, located approximately 530 m apart, linking both sides of the main north–south road, bordered by several buildings
Conflict dates March–April 2003
Conflict description
Heavy fighting occurred on both the north and south sides of the bridge, including multiple A-10 attacks
Samples SAMA 101–SAMA 113
TABLE 23. AS SAMAWAH — AOI-2
City/town As Samawah
Area of interest AOI-2
Description The main road (upper section)
UTM coordinates (centroid)
527453 E
3463193 N
Area size 1700 m × 1200 m
Investigation dates
6–7 February 2006, 9 May 2006
InfrastructureThe main north–south road, bordered by buildings to the west and predominantly open space to the east
Conflict dates March–April 2003
Conflict description
It is believed that Iraqi tanks werepositioned along both sides of the road togive protection to the main bridge and thetown
Samples SAMA 201–SAMA 210
TABLE 24. AS SAMAWAH — AOI-3
City/town As Samawah
Area of interest AOI-3
Description Cement factory
UTM coordinates (centroid)
5286230 E
3462766 N
Area size 2000 m × 1500 m
Investigation dates
5–7 February 2006, 7–8 May 2006
InfrastructureA cement factory consisting of multiple buildings and roadways
Conflict dates March–April 2003
Conflict description
It is believed that the cement factorywas used as a strategic location by theIraqi forces for the protection of themain bridge; tanks were placed onthe south and south-eastern sides of thefactory
Samples SAMA 301–SAMA 311
26

Iraqi tanks were placed on the southern and south-eastern sides of the factory and the area was subject to attacks involving the use of DU munitions. AOI-3 is within an abandoned industrial area, consisting of multiple buildings (Table 24). The ground surface cover consists of paved roadways and bare sandy soil. Only very sparse vegetation is present and no surface water was observed. The cement factory is no longer operational and is enclosed by fences. AOI-3 was subdivided into 11 sampling areas. In each area, soil, water, surface and vegetation samples were taken. A total of 38 samples (14 soil samples, 20 smear samples and 4 vegetation samples) were collected. No DU fragments were found. DU was detected in the two smear samples taken from wall and horizontal surfaces approximately 16 m apart. However, the mass spectrometric analysis of the sample packages indicated that a certain degree of cross-contamination of the samples had occurred during the fieldwork. The results of the DU sampling programme indicate that DU munitions were used in this AOI. The range of the ambient dose rate (1 m above ground) was 0.03–0.18 Sv/h. No DU residues (penetrators, fragments) were found.
I.1.4. As Samawah — AOI-4
The main road in As Samawah curves towards the east for approximately 3 km at the southern edge of the city. Tanks were positioned along both sides of the road to give protection to the town and the main bridge. The area was the site of an intense battle involving the use of DU munitions. AOI-4 consists of predominantly vacant land to the north and south of the main road (Table 25). Sparse residential and commercial buildings are present in the area, and the ground surface cover is primarily bare soil and grassy vegetation. Surface water was not observed in the area. Traffic along this section of the main road is typically heavy. AOI-4 was subdivided into 11 sampling areas. In each area, soil, water, surface and vegetation samples were taken. A total of 32 samples (11 soil samples, 19 smear samples and 2 vegetation samples) were collected. No DU fragments were found. DU was detected in the smear samples taken from wall and horizontal surfaces. However, the mass spectrometric analysis of the sample packages indicated that a certain degree of cross-contamination of the samples had occurred during the fieldwork. The results indicate that DU munitions were used in this AOI. The range of the ambient dose rate (1 m above ground) was 0.10-0.18 Sv/h. No DU residues (penetrators, fragments) were found.
I.1.5. As Samawah — Additional investigation points
Additional investigations were conducted in areas where DU contamination was suspected based on field observations (Table 26). These areas included vacant land on the outskirts of As Samawah, the train station in the Al-Khafora region, a scrapyard near the cement factory, and areas in which piles of waste and debris were observed. Intact and bombed tanks were observed at several of these locations. Smear samples were taken from tank surfaces and soil samples were collected in the immediate areas. Railway staff reported that the bombed tanks and cannons present on railway wagons were being transported by railway between several stations, including the Al-Khafora and Al-Khader stations. However, neither their origins nor final destinations were known. A total of 37 samples (20 soil samples and 17 smear samples) were collected at these additional investigation points. DU was detected in all of the smear samples taken from the artillery cannons and the tank surfaces. The range of the ambient dose rate (1 m above ground) was 0.03–0.10 Sv/h. No DU residues (penetrators, fragments) were found.
TABLE 25. AS SAMAWAH — AOI- 4
City/town As Samawah
Area of interest AOI-4
Description The main road (lower section)
UTM coordinates (centroid)
5288355 E
3461856 N
Area size 3000 m × 1000 m
Investigation dates
7–12 February 2006, 10 May 2006
Infrastructure The east–west curve of the main road, sparsely bordered by buildings to thenorth and south
Conflict dates March–April 2003
Conflict description
It is believed that Iraqi tanks were positioned along both sides of the road to give protection to the town
Samples SAMA 401–SAMA 411
27
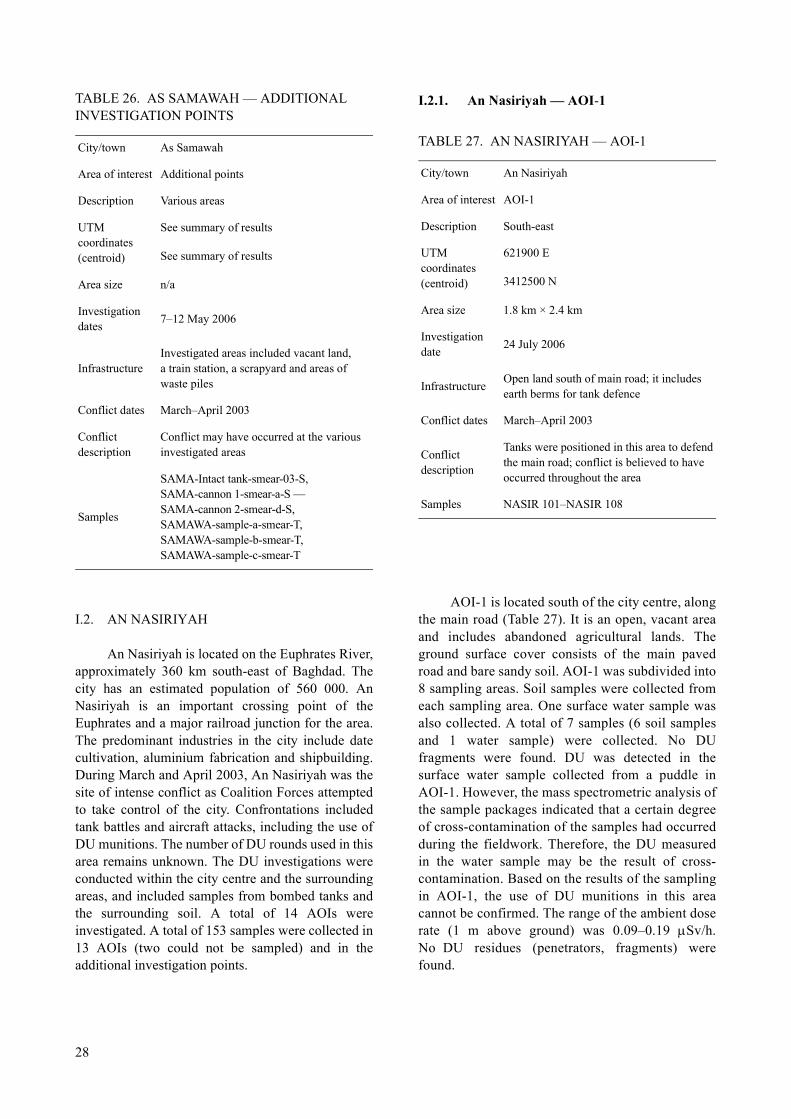
I.2. AN NASIRIYAH
An Nasiriyah is located on the Euphrates River, approximately 360 km south-east of Baghdad. The city has an estimated population of 560 000. An Nasiriyah is an important crossing point of the Euphrates and a major railroad junction for the area. The predominant industries in the city include date cultivation, aluminium fabrication and shipbuilding. During March and April 2003, An Nasiriyah was the site of intense conflict as Coalition Forces attempted to take control of the city. Confrontations included tank battles and aircraft attacks, including the use of DU munitions. The number of DU rounds used in this area remains unknown. The DU investigations were conducted within the city centre and the surrounding areas, and included samples from bombed tanks and the surrounding soil. A total of 14 AOIs were investigated. A total of 153 samples were collected in 13 AOIs (two could not be sampled) and in the additional investigation points.
I.2.1. An Nasiriyah — AOI-1
AOI-1 is located south of the city centre, along the main road (Table 27). It is an open, vacant area and includes abandoned agricultural lands. The ground surface cover consists of the main paved road and bare sandy soil. AOI-1 was subdivided into 8 sampling areas. Soil samples were collected from each sampling area. One surface water sample was also collected. A total of 7 samples (6 soil samples and 1 water sample) were collected. No DU fragments were found. DU was detected in the surface water sample collected from a puddle in AOI-1. However, the mass spectrometric analysis of the sample packages indicated that a certain degree of cross-contamination of the samples had occurred during the fieldwork. Therefore, the DU measured in the water sample may be the result of cross-contamination. Based on the results of the sampling in AOI-1, the use of DU munitions in this area cannot be confirmed. The range of the ambient dose rate (1 m above ground) was 0.09–0.19 Sv/h. No DU residues (penetrators, fragments) were found.
TABLE 26. AS SAMAWAH — ADDITIONAL INVESTIGATION POINTS
City/town As Samawah
Area of interest Additional points
Description Various areas
UTM coordinates (centroid)
See summary of results
See summary of results
Area size n/a
Investigation dates
7–12 May 2006
InfrastructureInvestigated areas included vacant land,a train station, a scrapyard and areas ofwaste piles
Conflict dates March–April 2003
Conflict description
Conflict may have occurred at the various investigated areas
Samples
SAMA-Intact tank-smear-03-S,SAMA-cannon 1-smear-a-S — SAMA-cannon 2-smear-d-S,SAMAWA-sample-a-smear-T,SAMAWA-sample-b-smear-T,SAMAWA-sample-c-smear-T
TABLE 27. AN NASIRIYAH — AOI-1
City/town An Nasiriyah
Area of interest AOI-1
Description South-east
UTM coordinates (centroid)
621900 E
3412500 N
Area size 1.8 km × 2.4 km
Investigation date
24 July 2006
InfrastructureOpen land south of main road; it includes earth berms for tank defence
Conflict dates March–April 2003
Conflict description
Tanks were positioned in this area to defend the main road; conflict is believed to have occurred throughout the area
Samples NASIR 101–NASIR 108
28

I.2.2. An Nasiriyah — AOI-2
AOI-2 is located south of the city centre, south of the main road (Table 28). An abandoned railway is located within this area. AOI-2 is an open, vacant area and includes abandoned agricultural lands. The ground surface cover primarily consists of bare sandy soil. AOI-2 was subdivided into ten sampling areas. Soil samples were collected from each sampling area. A total of ten soil samples were collected. No DU fragments were found. DU was detected in three of the soil samples taken from AOI-2. The range of the ambient dose rate (1 m above ground) was 0.03–0.20 Sv/h. No DU residues (penetrators, fragments) were found.
I.2.3. An Nasiriyah — AOI-3
AOI-3 consists of an open area located to the south of An Nasiriyah (Table 29). AOI-3 was subdivided into ten sampling areas. Soil samples were collected from each sampling area. Water and smear samples were collected at selected locations. A total of 12 samples (10 soil samples, 1 surface water sample and 1 smear sample) was collected. No DU fragments were found. DU was detected in one of the soil samples from AOI-3. DU was also detected in a surface water sample collected from a puddle.
However, the mass spectrometric analysis of the sample packages indicated that a certain degree of cross-contamination of the samples had occurred during the fieldwork. Therefore, the DU contami-nation measured in the water sample may be a result of cross-contamination. DU was detected in the smear sample from AOI-3. The results of the sampling programme indicate that activities during the conflict involving the use of DU ammunition were conducted in this area. The range of the ambient dose rate (1 m above ground) was 0.09–0.25 Sv/h. No DU residues (penetrators, fragments) were found.
I.2.4. An Nasiriyah — AOI-4
AOI-4 consists of an open area located to the south of An Nasiriyah and includes a former munitions storehouse, and was subdivided into ten sampling areas (Table 30). Soil samples were collected from each sampling area. Smear samples were collected at selected locations. A total of 12 samples (10 soil samples and 2 smear samples) was collected. No DU fragments were found. DU was detected in one of the ten soil samples from AOI-4. DU was detected in one of the two smear samples taken from walls of the former munitions storehouse facility. The results indicate that DU munitions were used in this area. The range of the ambient dose rate
TABLE 28. AN NASIRIYAH — AOI-2
City/town An Nasiriyah
Area of interest AOI-2
Description South of main road
UTM coordinates (centroid)
614175 E
3413800 N
Area size 1.8 km × 2.4 km
Investigation date
23 July 2006
InfrastructureOpen land, including an abandoned railway and earth berms for tank defence
Conflict dates March–April 2003
Conflict description
Tanks were positioned in this area to defend the main road; conflict is believed to have occurred throughout the area
Samples NASIR 201–NASIR 210
TABLE 29. AN NASIRIYAH — AOI-3
City/town An Nasiriyah
Area of interest AOI-3
Description Army camp/warehouse
UTM coordinates (centroid)
613900 E
3427500 N
Area size 1.8 km × 2.4 km
Investigation date
25 July 2006
InfrastructureOpen land, includes a former camp and warehouse of the Iraqi Army
Conflict dates March–April 2003
Conflict description
It is believed that conflict occurred throughout the area
Samples NASIR 301–NASIR 310
29

(1 m above ground) was 0.10–0.19 Sv/h. No DU residues (penetrators, fragments) were found.
I.2.5. An Nasiriyah — AOI-5 and AOI-6
Investigations were planned for two AOIs located to the south of An Nasiriyah, but no samples were taken for security reasons.
I.2.6. An Nasiriyah — AOI-7
AOI-7 primarily consists of an open area located to the south of An Nasiriyah (Table 31). The area includes a former munitions storehouse facility, with associated roads and buildings. AOI-7 was subdivided into ten sampling areas. Soil samples were collected from each sampling area. Smear samples were collected at selected locations. A total of 12 samples (10 soil samples and 2 smear samples) was collected. No DU fragments were found. DU was detected in three of the ten soil samples and in both the smear samples. The results indicate that DU munitions were used in this area. However, the mass spectrometric analysis of the sample packages indicated that a certain degree of cross-contamination of the smear samples had occurred during the fieldwork. Therefore, the DU contamination measured in the smear samples may be the result of cross-contamination. The range of
the ambient dose rate (1 m above ground) was 0.12–0.38 Sv/h. No DU residues (penetrators, fragments) were found.
I.2.7. An Nasiriyah — AOI-8
TABLE 30. AN NASIRIYAH — AOI-4
City/town An Nasiriyah
Area of interest AOI-4
Description Munitions storehouse
UTM coordinates (centroid)
611500 E
3427500 N
Area size 1.8 km × 2.4 km
Investigation date
25 July 2006
InfrastructureOpen land; it includes a former munitions storehouse
Conflict dates March–April 2003
Conflict description
It is believed that conflict occurred throughout the area
Samples NASIR 401–NASIR 410
TABLE 31. AN NASIRIYAH — AOI-7
City/town An Nasiriyah
Area of interest AOI-7
Description Munitions storehouse
UTM coordinates (centroid)
610400 E
3430000 N
Area size 1.8 km × 2.4 km
Investigation date
25 July 2006
InfrastructureOpen land; it includes a former munitions storehouse and road
Conflict dates March–April 2003
Conflict description
It is believed that conflict occurred throughout the area
Samples NASIR 701–NASIR 710
TABLE 32. AN NASIRIYAH — AOI-8
City/town An Nasiriyah
Area of interest AOI-8
Description South-west of city
UTM coordinates (centroid)
600250 E
3429100 N
Area size 1.8 km × 2.4 km
Investigation date
24 July 2006
InfrastructureOpen land, near a former Coalition military camp, east of the main road
Conflict dates March–April 2003
Conflict description
It is believed that conflict occurred throughout the area
Samples NASIR 801–NASIR 810
30

AOI-8 consists of an open area located to the south-west of An Nasiriyah (Table 32). The area is situated near a former Coalition military camp, and the main road is located at the western edge of AOI-8. AOI-8 was subdivided into ten sampling areas. Soil samples were collected from each sampling area. Smear samples were collected at selected locations. A total of 14 samples (10 soil samples and 4 smear samples) was collected in this AOI. DU was detected in one of the ten soil samples. DU was also detected in one of the four smear samples. However, the mass spectrometric analysis of the sample packages indicated that a certain degree of cross-contamination of the samples had occurred during the fieldwork. Therefore, the DU contamination measured in the smear samples may be a result of cross-contamination. The results of the samples collected indicate that some activity involving DU ammunition had taken place in this area. The range of the ambient dose rate (1 m above ground) was 0.10–0.22 Sv/h. No DU residues (penetrators, fragments) were found.
I.2.8. An Nasiriyah — AOI-9
AOI-9 consists of an open area located to the south-west of An Nasiriyah (Table 33). The area is located near a former Coalition military camp. AOI-9 was subdivided into eight sampling areas. Soil samples were collected from each sampling area. Smear samples were collected at selected locations.
A total of 10 samples (8 soil samples and 2 smear samples) was collected. No DU fragments were found. None of the soil samples contained DU. DU was detected in one of the two smear samples. However, the mass spectrometric analysis of the sample packages indicated that a certain degree of cross-contamination of the samples had occurred during the fieldwork. Therefore, the DU contami-nation measured in the smear samples may be a result of cross-contamination. The results do not provide a clear indication that DU munitions were used in this area. The range of the ambient dose rate (1 m above ground) was 0.12–0.19 Sv/h. No DU residues (penetrators, fragments) were found.
I.2.9. An Nasiriyah — AOI-10
AOI-10 consists of an open area located to the west of An Nasiriyah, south of the Euphrates River (Table 34). AOI-10 was subdivided into seven sampling areas. Soil samples were collected from each sampling area. Smear samples were collected at selected locations. A total of 9 samples (7 soil samples and 2 smear samples) was collected in this AOI. No DU fragments were found. None of the soil samples contained DU. There was no DU present in the analysed smear samples. The results indicate that no DU ammunition was used in this area. The range of the ambient dose rate (1 m above ground) was 0.09–0.20 Sv/h. No DU residues (penetrators, fragments) were found.
TABLE 33. AN NASIRIYAH — AOI-9
City/town An Nasiriyah
Area of interest AOI-9
Description South-west of city
UTM coordinates (centroid)
600700 E
3434150 N
Area size 1.8 km × 2.4 km
Investigation date
26 July 2006
InfrastructureOpen land, near former Coalition military camp, east of the main road
Conflict dates March–April 2003
Conflict description
It is believed that conflict occurred throughout the area
Samples NASIR 901–NASIR 909
TABLE 34. AN NASIRIYAH — AOI-10
City/town An Nasiriyah
Area of interest AOI-10
Description West of city, south of Euphrates River
UTM coordinates (centroid)
604700 E
3438800 N
Area size 1.8 km × 2.4 km
Investigation date
26 July 2006
InfrastructureOpen land south of the Euphrates River;it includes various roadways
Conflict dates March–April 2003
Conflict description
It is believed that conflict occurred throughout the area
Samples NASIR 1001–NASIR 1007
31

I.2.10. An Nasiriyah — AOI-11
AOI-11 is located at the northern edge of the urban area of An Nasiriyah (Table 35). The DU investigation focused on the areas surrounding the main north–south road and the bridge across the waterway. Samples were also collected from an open area located to the north-east of the bridge. AOI-11 was subdivided into nine sampling areas. Soil samples were collected from each sampling area. Smear samples were collected at selected locations. A total of 14 samples (9 soil samples and 5 smear samples) were collected in this AOI. No DU fragments were found. DU was detected in one of the nine soil samples. DU was detected in three of the five smear samples, including wall and horizontal surface samples. However, the mass spectrometric analysis of the sample packages indicated that a certain degree of cross-contamination of the samples had occurred during the fieldwork. Therefore, the DU measured in the smear samples may be the result of cross-contamination. The results indicate that DU ammunition was used in this area. The range of the ambient dose rate (1 m above ground) was 0.10–0.38 Sv/h. No DU residues (penetrators, fragments) were found.
I.2.11. An Nasiriyah — AOI-12
AOI-12 is located within the urban area of An Nasiriyah (Table 36). The DU investigation focused on the areas surrounding the main roadways and the bridges across the Euphrates River. Also investigated was a former Iraqi military camp located to the south of the river. AOI-12 was subdivided into 16 sampling areas. Soil samples were collected from each sampling area. Smear samples were collected at selected locations. A total of 26 samples (13 soil samples and 13 smear samples) was collected. No DU fragments were found. None of the soil samples contained DU. DU was detected in eight of the 13 smear samples. These samples were collected from areas near the main roads, near bombarded houses and bridges. However, the mass spectrometric analysis of the sample packages indicated that a certain degree of cross-contamination of the samples had occurred during the fieldwork. Therefore, the DU measured in the smear samples may be the result of cross-contamination. The range of the ambient dose rate (1 m above ground) was 0.10–0.22 Sv/h. No DU residues (penetrators, fragments) were found.
TABLE 35. AN NASIRIYAH — AOI-11
City/town An Nasiriyah
Area of interest AOI-11
Description North of city
UTM coordinates (centroid)
619700 E
3439700 N
Area size 1.8 km × 2.4 km
Investigation date
24 July 2006
InfrastructureNorthern edge of urban area includes residential, commercial and industrial properties, as well as roads and waterways
Conflict dates March–April 2003
Conflict description
It is believed that conflict occurred throughout the area, and primarily in the vicinity of the bridge across the waterway
Samples NASIR 1101–NASIR 1109
TABLE 36. AN NASIRIYAH — AOI-12
City/town An Nasiriyah
Area of interest AOI-12
Description City centre
UTM coordinates (centroid)
619400 E
3435450 N
Area size 1.8 km × 2.1 km
Investigation date
25 July 2006
Infrastructure
Urban area, includes residential, commercial and industrial properties, as well as roadways; the Euphrates River flows from west to east and three bridges crossing the river are located within AOI-12
Conflict dates March–April 2003
Conflict description
It is believed that conflict occurred throughout the area, and primarily along the main roads and in the vicinity of the bridges across the Euphrates River
Samples NASIR 1201–NASIR 1216
32

I.2.12. An Nasiriyah — AOI-13
AOI-13 is located to the south of An Nasiriyah, in a primarily industrial area with open land and bare, sandy soil (Table 37). A main road runs north–south through AOI-3. The remains of a bombed tank were also identified in the area. The DU investigation focused on the areas surrounding the main road and on the bombed tank. AOI-13 was subdivided into six sampling areas. Soil samples were collected from each sampling area. Smear samples were collected at selected locations. None of the soil samples was found to contain DU. DU was detected in three of the five smear samples collected, including both wall and horizontal surface samples. These samples were collected from areas near the main road, and in open areas. However, the mass spectrometric analysis of the sample packages indicated that a certain degree of cross-contamination of the samples had occurred during the fieldwork. Therefore, the DU measured in the smear samples may be the result of cross-contamination. The range of the ambient dose rate (1 m above ground) was 0.01–0.08 Sv/h. No DU residues (penetrators, fragments) were found.
I.2.13. An Nasiriyah — AOI-14
AOI-14 is located to the north-east of An Nasiriyah, along a main north–south road with a bridge across the waterway (Table 38). The area is primarily open land and wetlands, although the south-west corner of AOI-14 includes residential areas. The DU investigation focused on the areas surrounding the main road and bridge. AOI-14 was subdivided into 6 sampling areas. Soil samples were collected from each sampling area. Surface water and smear samples were collected at selected locations. A total of 9 samples (5 soil samples, 1 surface water sample and 3 smear samples) was collected in this AOI. No DU fragments were found. None of the soil samples was found to contain DU. DU was detected in the surface water sample. DU was detected in all three smear samples collected, including both wall and horizontal surface samples. These samples were collected from surfaces on and near the bridge. However, the mass spectrometric analysis of the sample packages indicated that a certain degree of cross-contamination of the samples had occurred
TABLE 37. AN NASIRIYAH — AOI-13
City/town An Nasiriyah
Area of interest AOI-13
Description South of city
UTM coordinates (centroid)
620850 E
3430900 N
Area size 1.8 km × 2.4 km
Investigation date
26 July 2006
InfrastructureArea south of the city, primarily industrial properties and open land
Conflict dates March–April 2003
Conflict description
It is believed that conflict occurred throughout the area
Samples NASIR 1301–NASIR 1306
TABLE 38. AN NASIRIYAH — AOI-14
City/town An Nasiriyah
Area of interest AOI-14
Description North-east of city
UTM coordinates (centroid)
622500 E
3439300 N
Area size 1.8 km × 1.8 km
Investigation date
23 July 2006
Infrastructure
North-east edge of the city; it includesa main north–south road and a bridgeacross the waterway; primarily open land, forested areas and wetlands
Conflict dates March–April 2003
Conflict description
It is believed that conflict occurred primarily along the main roadway
Samples NASIR 1401–NASIR 1406
33

during the fieldwork. Therefore, the DU measured in the smear samples may be the result of cross-contamination. Nevertheless, the puddle water analysed indicates that some DU ammunition was used in this area. The range of the ambient dose rate (1 m above ground) was 0.11–0.22 Sv/h. No DU residues (penetrators, fragments) were found.
I.2.14. An Nasiriyah — Additional investigation points
A total of 7 samples (2 soil samples and 5 smear samples) was collected at the additional investigation points (Table 39). DU was detected in all the soil and smear samples collected. DU was measured on most of the surfaces of the tanks or the military equipment in the scrapyard where local people are conducting steel recycling. In addition, residual PCBs and hydraulic oils are present at this site. The range of the ambient dose rate (1 m above ground) was 0.11–0.22 Sv/h. DU residues were found on and near the investigated military equipment.
I.3. AL BASRAH
Al Basrah, located on the west bank of Shatt Al-Arab waterway, is the second largest city in Iraq, with an estimated population of 2.6 million. The city is situated approximately 55 km from the Persian Gulf, 550 km south-east of Baghdad. Al Basrah is the main port in Iraq, and is the terminal point for oil pipelines. Intense conflict occurred in and around Al Basrah in 2003 as Coalition Forces advanced into the city. Multiple tank battles and aircraft attacks were reported in the area, including the use of DU munitions. The DU investigations focused on areas south of the city centre and the city’s southern suburbs. A total of four AOIs were investigated. A total of 103 samples were collected in the four AOIs, with the following breakdown: 65 soil samples, 4 water samples and 34 smear samples.
I.3.1. Al Basrah — AOI-1
AOI-1 is located south of the city centre (Table 40). Between 25 March and 6 April 2003, the area was the location of an intense battle involving tanks and air strikes. DU munitions were reportedly used during the conflict, but the number of rounds is unknown. AOI-1 is within an urban area and the predominant land uses are industrial, commercial and residential. The ground surface cover consists of
TABLE 39. AN NASIRIYAH — ADDITIONAL INVESTIGATION POINTS
City/town An Nasiriyah
Area of interest Additional points
Description City area
UTM coordinates of bombed tank
620617 E
3431554 N
UTM coordinates of scrapyard
619503 E
3429394 N
Investigation date
26 July 2006
InfrastructureOne bombed tank located in the northern part of the city and one scrapyard located south of the city
Conflict dates March–April 2003
Conflict description
It is believed that conflict occurred atthe location of the bombed tank, but not in the area of the scrapyard
Samples
Nasir-soil-scraps, Nasir-soil-bombarded tank, smear-bombarded tank (entry),smear-bombarded tank (outlet),smear-scraps A–smear-scraps C
TABLE 40. AL BASRAH — AOI-1
City/town Al Basrah
Area of interest AOI-1
Description North-west quadrant
UTM coordinates (centroid)
767050 E
3374750 N
Area size 4.2 km × 2.7 km
Investigation dates
21–22 June 2006
InfrastructureUrban area including the main south-west–north-east road; it includes industrial, commercial and residential areas
Conflict dates March–April 2003
Conflict description
Heavy fighting primarily occurred alongthe main road, but included locations throughout the area
Samples BASRA 101–BASRA 118
34

paved roads, bare sandy soil and grassy vegetated areas. AOI-1 was subdivided into 18 sampling areas. Soil samples were collected from each sampling area. Water and smear samples were collected at selected locations. A total of 39 samples (21 soil samples, 2 water samples and 16 smear samples) were collected. DU was detected in all 16 of the smear samples collected, including wall and horizontal surface samples. The results of the smear samples confirm the use of DU munitions in this AOI. The range of the ambient dose rate (1 m above ground) was 0.06–0.25 Sv/h. No DU residues (penetrators, fragments) were found.
I.3.2. Al Basrah — AOI-2
This is an urban area located south of the city centre. Conflicts primarily occurred along the main east–west road. DU munitions were reportedly used during the battle, but the number of rounds is unknown. The land is for industrial, commercial and residential uses. The ground surface cover consists of paved roads, bare sandy soil and grassy vegetated areas. The area was subdivided into 11 sampling areas, based on the available conflict information and inferred areas of interest. Soil samples were collected from each sampling area, and water and smear samples were collected at selected locations. A total of 17 samples (11 soil samples, 1 water sample and
5 smear samples) were collected. DU was identified in all the smear samples, including the ones collected on wall and horizontal surfaces. This indicated that a certain number of DU munitions were used in the area. However, the mass spectrometric analysis of the sample packages indicated that a certain cross-contamination of filter material occurred during the fieldwork. The range of the ambient dose rate (1 m above ground) was 0.10–0.25 Sv/h. No DU residues (penetrators, fragments) were found.
I.3.3. Al Basrah — AOI-3
AOI-3 includes the edge of the urban area in Al Basrah (Table 42). Industrial, commercial and residential neighbourhoods are located at the western side. The area was subdivided into 14 sampling areas. Soil samples were collected from each sampling area. Water and smear samples were collected at selected locations. A total of 17 samples were collected (14 soil samples, 1 water sample and 2 smear samples). DU was detected in both of the smear samples collected from AOI-3. However, the mass spectrometric analysis of the sample packages indicated that a certain degree of cross-contamination of the samples had occurred during the fieldwork. Therefore, the DU contamination measured in the smear samples may be a result of cross-contamination. The results of the measurements
TABLE 41. AL BASRAH — AOI-2
City/town Al Basrah
Area of interest AOI-2
Description North-east quadrant
UTM coordinates (centroid)
771150 E
3374750 N
Area size 4.2 km × 2.7 km
Investigation dates
22–23 June 2006
InfrastructureUrban area including the main east–west road; it includes industrial, commercial and residential areas
Conflict dates March–April 2003
Conflict description
Heavy fighting primarily occurred alongthe main road
Samples BASRA 201–BASRA 211
TABLE 42. AL BASRAH — AOI-3
City/town Al Basrah
Area of interest AOI-3
Description South-east quadrant
UTM coordinates (centroid)
771150 E
3372150 N
Area size 4.2 km × 2.7 km
Investigation dates
23–24 June 2006
InfrastructureIndustrial, commercial and residential properties on the western side of the area, vacant land on the eastern side of the area
Conflict dates March–April 2003
Conflict description
It is believed that conflict occurred throughout the area
Samples BASRA 301–BASRA 314
35

indicate that DU munitions may have been used in this AOI. The range of the ambient dose rate (1 m above ground) was 0.09–0.226 Sv/h. No DU residues (penetrators, fragments) were found.
I.3.4. Al Basrah — AOI-4
The area is located to the south-west of the city centre (Table 43). AOI-4 is within an urban area, and the predominant land uses are industrial, commercial and residential. The ground surface cover consists of paved roads, bare sandy soil and grassy vegetated areas. The area was subdivided into 19 sampling areas and a total of 30 samples was collected, comprising 19 soil samples, one from each sampling area, and 11 smear samples from selected locations. DU was detected in four of the 19 soil samples. DU was also identified in all the smear samples taken from walls and horizontal surfaces and tank surfaces. However, the mass spectrometric analysis of the sample packages indicated that a certain degree of cross-contamination of the samples had occurred during the fieldwork. Therefore, the DU measured in the smear samples may be a result of cross-contamination. The results of the DU sampling programme indicate that DU munitions have been used in this area. The range of the ambient dose rate (1 m above ground) was 0.09–0.31 Sv/h. No DU residues (penetrators, fragments) were found.
I.4. AZ ZUBAYR
Az Zubayr, with an approximate population of 185 000, is located in south-eastern Iraq, to the south-east of Lake al-Hammar, at the terminus of a railway line to Baghdad. It has long been an important centre of trade with Saudi Arabia and Kuwait, and is approximately 20 km south of the major city of Al Basrah. A former munitions storage facility is also located in Az Zubayr. Az Zubayr was the site of intense conflict in April 2003 as Coalition Forces moved towards Al Basrah. DU munitions were reportedly used during A-10 aircraft attacks throughout the city. Several bombed tanks and tank parts were identified during the field investigations, and soil and surface smear samples were taken from the tanks and surrounding areas. For the purposes of this investigation, the city was considered to be a single AOI. A total of 62 samples was collected in this AOI, with the following breakdown: 22 soil samples, 1 water sample, 29 smear samples and 10 vegetation samples.
I.4.1. Az Zubayr — AOI-1
TABLE 43. AL BASRAH — AOI-4
City/town Al Basrah
Area of interest AOI-4
Description South-west quadrant
UTM coordinates (centroid)
767050 E
3372150 N
Area size 4.2 km × 2.7 km
Investigation dates
24–25 June 2006
InfrastructureUrban area, including the mainsouth-west–north-east road; it includes industrial, commercial and residential areas
Conflict dates March–April 2003
Conflict description
Heavy fighting primarily occurred alongthe main road, but included locations throughout the area
Samples BASRA 401–BASRA 419
TABLE 44. AZ ZUBAYR — AOI-1
City/town Az Zubayr
Area of interest AOI-1
Description Locations throughout the city
UTM coordinates (centroid)
4771263 E
3038117 N
Area size 5000 m × 6000 m
Investigation dates
6–9 February 2006, 26 June 2006
Infrastructure
Industrial, commercial and residential areas, including roads, buildings and open areas; several tank parts investigated during 2nd Mission
Conflict dates March–April 2003
Conflict description
Coalition Forces performed precisionstrikes at various strategic locationsin the city
Samples ZUBA 101–ZUBA 113, Zubayr 01-02, Zubayr 01-03, Zubayr 01-05 A–Zubayr 01-05 H, Zubayr 01-11
36

This AOI is within an urban area that includes industrial, commercial and residential land uses. The ground surface cover consists of paved roads, bare sandy soil and grassy areas. Intact and bombed tanks were observed at several locations. Samples of soil were collected from the tanks and the immediate areas. The area was subdivided into 13 sampling areas. In each area, soil, water, surface samples and vegetation were taken. A total of 62 samples (22 soil samples, 1 water sample, 29 smear samples and 10 vegetation samples) was collected. DU was measured in nine of the soil samples, six of which were collected from a military scrapyard area, where
bombed tanks and tank parts were being stored (ZUBA-105) and steel recycling operations were being conducted. The other samples were collected from areas identified on the basis of the United Kingdom Ministry of Defence DU shooting coordinates. DU was measured in 27 of the 29 smear samples taken, including those taken from vertical and horizontal surfaces, and tank surfaces. The results confirmed that DU munitions had been used in Az Zubayr. The ambient dose rate (1 m above ground) was about 0.10 Sv/h. DU residues (penetrators, fragments) were found near or on military equipment hit by DU munitions.
37

Appendix II
IDENTIFICATION OF THE SAMPLING LOCATIONSAND SAMPLING METHODOLOGY
The information reported in this appendix was taken from documentation provided to the IAEA by UNEP.
II.1. IDENTIFICATION OFSAMPLING LOCATIONS
The identification of the sampling locations was performed by UNEP using the following sources of information and criteria:
(1) The exact coordinates of the DU targets fired upon by United Kingdom tanks during the 2003 conflict in Iraq as provided by the Ministry of Defence of the United Kingdom to UNEP on 24 June 2003. These consisted of a list of 51 coordinates and an associated map with Challenger 2 tank DU target points. The amount of DU fired by the United Kingdom during the conflict was around 1.9 t. Information on amounts of DU used by the United Kingdom forces during the conflict in 1990–1991 was also included in the 24 June 2003 correspondence. In that conflict, less than 1 t of DU tank ammunition was used. No data were given on the coordinates of firing points or target sites in that conflict.
(2) Maps illustrating the areas affected by DU in Iraq in general, and specifically in Al Basrah, provided to UNEP by the Iraqi RPC.
(3) Other sources of information such as obtained from extensive Internet searches, media coverage, specialized reports, and proceedings of international seminars and conferences, and details provided by the Coalition Forces.
(4) Expertise in DU investigations gained from previous assessments.
Having identified the tentative locations, UNEP procured high resolution satellite images of these areas on dates both before and after the conflict. Based on this work, a series of maps containing suggested sampling areas was then
produced. Typical DU targets included the following:
— Where Iraqi tanks were placed/hidden;— Where signs of intense fighting were apparent;— Bridges and locations of military strategic
importance, for example, where important damage could be detected.
By means of this process, UNEP was able to define precise sampling areas and sampling points at which DU contamination was thought to be present. The maps with the suggested sampling areas and the additional information were then provided to the staff of the Iraqi RPC to guide them in performing ground verification in the various areas and in the collection of environmental samples.
In order to identify DU contaminated areas and surfaces, and to locate any existing penetrators and/or fragments, the Iraqi RPC sampling staff used field radiological measurements. Global position coordinates were determined using Garmin GPS-12 model type.
The identification of spots contaminated by DU is a complex task. Even when coordinates are known, it is difficult to identify the presence of radiation, even if the observations are performed within a few metres of the source. Moreover, the sources may have been moved in the intervening period (i.e. between the conflict and the time of the survey). Finally, due to the nature of the terrain, sources could have been buried under the ground surface. In this case, radiation signals would no longer be detectable on the surface.
II.2. SAMPLING METHODOLOGY
II.2.1. Soil samples
The following procedure was followed for the collection of soil samples:
— Soil samples ranging from 0 cm to 5 cm depth were collected using a manual corer.
38

— Each soil sample consisted of at least seven soil cores collected from an area of approximately 2 m × 2 m.
— The soil cores were combined in a double plastic bag and the bags were labelled with the sample code. A sampling form was completed for each sample.
— The typical mass of each composite soil sample was approximately 1 kg. From this total, approximately 250 g of soil was submitted to the Spiez Laboratory.
II.2.2. Vegetation samples
Vegetation sampling focused on grass, vegetables and dates. The collected samples were transported to the RPC laboratory and then shipped to the Spiez Laboratory.
II.2.3. Water samples
In order to verify the presence of DU in drinking water, water samples from private wells and taps were collected, where possible. One litre of water was sampled at each location using a polyethylene bottle. Samples were preserved immediately after sampling according to standard methods. Bottles were labelled, stored and then transported to the Iraqi RPC laboratory, before being shipped to the Spiez Laboratory.
II.2.4. Smear samples
Smear samples on smooth surfaces were collected using dry smear sampling kits from an approximate area ranging from 100 cm2 to 2500 cm2. The smear sample was folded and placed in a plastic bag, coded and the corresponding sampling form was filled in. Field blank samples were also collected for quality assurance/quality control purposes. These samples were transported in the field, exposed to atmospheric conditions and subjected to the standard sample handling procedures, but were not used to collect a smear.
The number of AOIs identified at each location and the total number of samples collected varied, according to the region:
— As Samawah: Five AOIs. A total of 202 samples was collected in the AOIs (including the additional investigation points), with the following breakdown: 71 soil samples, 10 water samples, 106 smear samples and 15 vegetation samples.
— An Nasiriyah: 15 AOIs. A total of 153 samples was collected in 13 AOIs (two could not be sampled) and in the additional investigation points.
— Al Basrah: Four AOIs. A total of 103 samples was collected in the AOIs, with the following breakdown: 65 soil samples, 4 water samples and 34 smear samples.
— Az Zubayr: One AOI. A total of 62 samples was collected in this AOI, with the following breakdown: 22 soil samples, 1 water sample, 29 smear samples and 10 vegetation samples.
39

40

Appendix III
LABORATORY ANALYSIS AND ANALYTICAL RESULTS
The information reported in this appendix was taken from documentation provided to IAEA by UNEP.
This appendix provides the results of the analyses of the environmental samples collected at the four selected areas in southern Iraq.
The analyses were performed by the Spiez Laboratory. This is a governmental institute of the Swiss Ministry of Defence, Civil Protection and Sports, under the authority of Civil Protection. The Laboratory is focused mainly on nuclear, biological and chemical (NBC) defence related questions. In this field, it has become a reference laboratory for various international organizations. The various departments of the Spiez Laboratory are all accredited in accordance with ISO/IEC 17025. Accredited procedures (ISO/IEC 17025) in Spiez Laboratory’s STS 028 Testing Laboratory were implemented to prepare and measure the samples.
Samples of the various media (soil, water, smear samples and vegetation) were prepared for analysis following standard procedures specific to that sample type. Soil samples were dried and homogenized prior to preparation for analysis. Water samples were filtered and acidified with HNO3. Vegetation samples were dried and separated from the soil and leaves prior to analysis. The smear sample filter papers were leached in HNO3 and exposed to an ultrasonic bath prior to leachate filtration.
All samples were analysed with a double focusing sector field inductively coupled plasma mass spectrometer (ICP-MS). The 238U concentration in each sample was measured quantitatively with external calibration. The uranium isotopes 236U, 235U and 234U were also measured. The uranium contribution of the chemical reagents was determined by the analysis of blank samples. In the case of the soil, vegetation and smear samples, nitric acid was used as a blank. Distilled water was analysed as a blank for the water samples. The uranium contribution was found to be low enough to be neglected for all blank samples.
The percentage of DU present was calculated from the 235U/238U isotope ratio as follows:
RU – nat Isotope ratio 235U/238U ofnatural U ( = 0.00725)
RDU Isotope ratio 235U/238U ofdepleted U ( = 0.002)
Rm Measured isotope ratio 235U/238U ofthe sample
It should be noted, however, that there is inherent uncertainty in the measurement of uranium isotopes, which corresponds to combined laboratory procedural errors. The detection limit of the percentage of DU of the total uranium was calculated from three times the uncertainty of the isotope ratio 235U/238U.
Small amounts of DU were detected in several of the field blank samples, ranging from 0.2 ng to 10 ng DU per filter. These results highlight the difficulty in obtaining truly representative samples, and in avoiding cross-contamination during the handling of equipment and other samples in the field. Therefore, the results of the sampling programme, particularly those samples in which very low levels of DU were detected, are subject to additional uncertainties related to the field blank results.
The tables given in this appendix, that is, Table 45 Soil Samples, Table 46 Water Samples and Table 47 Vegetation Samples, give the sample codes and the concentrations of 238U, 235U, 234U, 236U, the isotopic mass ratio 235U/238U, the total uranium concentration, the percentage of DU and the total DU concentration in each sample. In Table 48 Surface Samples (Smears), the total masses of 238U, 235U, 234U and 236U detected in the smear sample are reported.
DUR R
R R
R
U nat m
U nat DU
m
[%]
..
= ◊--
= ◊-
-
-100
1000 00725
0 00525
40

TAB
LE
45.
SO
IL S
AM
PL
ES
Sam
ple
238 U
235 U
234 U
236 U
235 U
/238 U
Tota
l UD
U o
f to
tal U
DL
(D
U)
Tota
l DU
in s
ampl
eD
L
(μg/
g)±
1σ(μ
g/g)
(ng/
g)±
1σ(n
g/g)
(pg/
g)±
1σ(p
g/g)
(pg/
g)±
1σ(p
g/g)
At r
atio
± 1σ
at r
atio
(μg/
g)Pe
rcen
tage
(mas
s%)
± 1σ
(mas
s%)
(mas
s%)
(mg/
kg)
(mg/
kg)
As
Sam
awah
SA
MA
-101
-soi
l-A
1.24
0.08
8.8
0.8
6813
<3
0.00
723
0.00
003
1.25
< D
L—
1.9
< D
L0.
024
SA
MA
-102
-soi
l-A
1.06
0.06
7.6
0.6
6010
<7
0.00
724
0.00
005
1.07
< D
L—
3.1
< D
L0.
033
SA
MA
-103
-soi
l-A
1.58
0.10
11.3
0.9
8310
<4
0.00
724
0.00
003
1.59
< D
L—
1.8
< D
L0.
028
SA
MA
-104
-soi
l-A
1.35
0.08
9.6
0.6
7311
<4
0.00
721
0.00
006
1.36
< D
L—
3.4
< D
L0.
047
SA
MA
-106
-soi
l-A
1.30
0.08
9.3
0.6
705
<2
0.00
724
0.00
005
1.31
< D
L—
2.9
< D
L0.
038
SA
MA
-107
-soi
l-A
1.46
0.09
10.5
0.6
838
<2
0.00
729
0.00
002
1.47
< D
L—
1.4
< D
L0.
021
SA
MA
-111
-soi
l-A
1.35
0.08
9.7
0.6
847
<4
0.00
728
0.00
008
1.36
< D
L—
4.6
< D
L0.
062
SA
MA
-112
-soi
l-A
1.68
0.10
12.0
0.7
989
<5
0.00
727
0.00
002
1.69
< D
L—
1.2
< D
L0.
020
SA
MA
-202
-soi
l-A
1.01
0.06
7.3
0.5
554
<2
0.00
725
0.00
003
1.02
< D
L—
2.0
< D
L0.
020
SA
MA
-204
-soi
l-A
1.82
0.11
13.0
0.8
103
10<
90.
0072
60.
0000
11.
84<
DL
—0.
8<
DL
0.01
5
SA
MA
-205
-soi
l1.
830.
1113
.10.
811
624
<10
0.00
725
0.00
002
1.84
< D
L—
0.9
< D
L0.
017
SA
MA
-207
-soi
l-A
1.09
0.07
7.9
0.5
6812
<22
0.00
731
0.00
002
1.10
< D
L—
1.0
< D
L0.
011
SA
MA
-208
-soi
l-A
1.51
0.09
10.8
0.7
837
<8
0.00
726
0.00
003
1.52
< D
L—
1.8
< D
L0.
028
SA
MA
-209
-soi
l-A
1.00
0.06
7.2
0.4
575
<10
0.00
728
0.00
005
1.01
< D
L—
2.7
< D
L0.
028
SA
MA
-210
-soi
l-A
1.70
0.10
12.0
0.7
989
<7
0.00
719
0.00
004
1.71
< D
L—
2.0
< D
L0.
034
SA
MA
-301
-soi
l-A
1.50
0.09
10.7
0.7
838
<7
0.00
723
0.00
004
1.51
< D
L—
2.3
< D
L0.
034
SA
MA
-302
-soi
l-A
1.28
0.08
9.2
0.6
737
<3
0.00
727
0.00
019
1.29
< D
L—
10.8
< D
L0.
140
SA
MA
-303
-soi
l-A
2.19
0.14
15.5
1.0
134
10<
40.
0071
60.
0000
62.
21<
DL
—3.
3<
DL
0.07
4
41

SA
MA
-304
-soi
l-A
1.99
0.12
14.2
0.9
114
10<
40.
0072
10.
0000
42.
01<
DL
—2.
3<
DL
0.04
6
SA
MA
-305
-soi
l-A
1.55
0.10
11.1
0.7
888
<9
0.00
726
0.00
002
1.56
< D
L—
1.1
< D
L0.
017
SA
MA
-306
-soi
l-A
1.50
0.09
10.7
0.7
818
<8
0.00
729
0.00
003
1.51
< D
L—
1.6
< D
L0.
025
SA
MA
-307
-soi
l-A
1.14
0.07
8.1
0.5
5113
<21
0.00
727
0.00
006
1.14
< D
L—
3.4
< D
L0.
039
SA
MA
-308
-soi
l-A
1.49
0.09
10.7
0.7
8810
<7
0.00
726
0.00
002
1.50
< D
L—
1.1
< D
L0.
016
SA
MA
-309
-soi
l-A
1.23
0.08
8.8
0.6
728
<5
0.00
725
0.00
002
1.24
< D
L—
1.4
< D
L0.
017
SA
MA
-311
-soi
l-A
1.95
0.12
14.0
0.9
109
11<
50.
0073
00.
0000
21.
96<
DL
—1.
2<
DL
0.02
4
SA
MA
-401
-soi
l-A
1.53
0.09
11.0
0.7
889
<3
0.00
724
0.00
006
1.54
< D
L—
3.3
< D
L0.
051
SA
MA
-403
-soi
l-A
1.74
0.11
12.5
0.8
9110
<13
0.00
723
0.00
006
1.76
< D
L—
3.2
< D
L0.
056
SA
MA
-405
-soi
l-A
1.20
0.07
8.6
0.6
727
<9
0.00
723
0.00
004
1.21
< D
L—
2.2
< D
L0.
026
SA
MA
-405
-soi
l-B
1.67
0.10
11.9
0.8
889
<16
0.00
720
0.00
003
1.68
< D
L—
1.6
< D
L0.
027
SA
MA
-406
-soi
l-A
2.15
0.13
15.5
1.0
124
14<
50.
0072
50.
0000
72.
17<
DL
—4.
2<
DL
0.09
1
SA
MA
-407
-soi
l-C
1.87
0.11
13.4
0.8
115
10<
50.
0072
40.
0000
61.
88<
DL
—3.
5<
DL
0.06
5
SA
MA
-408
-soi
l-A
2.06
0.13
14.8
1.1
125
16<
120.
0072
80.
0000
42.
08<
DL
—2.
2<
DL
0.04
6
SA
MA
-411
-soi
l-A
1.40
0.09
10.1
0.9
8011
<6
0.00
728
0.00
005
1.41
< D
L—
2.8
< D
L0.
039
As
Sam
awah
(2n
d M
issi
on)
SA
MA
-102
-soi
l-A
(2n
d M
issi
on)
0.96
0.03
6.8
0.3
469
<7
0.00
737
0.00
010
0.96
< D
L—
5.5
< D
L0.
053
SA
MA
-103
-soi
l-A
(2n
d M
issi
on)
1.45
0.04
10.1
0.4
6913
<4
0.00
714
0.00
009
1.46
< D
L—
5.3
< D
L0.
077
SA
MA
-104
-soi
l-A
(2n
d Mis
sion
)1.
550.
0411
.00.
583
16<
30.
0073
00.
0000
91.
56<
DL
—5.
3<
DL
0.08
3
TAB
LE
45.
SO
IL S
AM
PL
ES
(co
nt.)
Sam
ple
238 U
235 U
234 U
236 U
235 U
/238 U
Tota
l UD
U o
f to
tal U
DL
(D
U)
Tota
l DU
in s
ampl
eD
L
(μg/
g)±
1σ(μ
g/g)
(ng/
g)±
1σ(n
g/g)
(pg/
g)±
1σ(p
g/g)
(pg/
g)±
1σ(p
g/g)
At r
atio
± 1σ
at r
atio
(μg/
g)Pe
rcen
tage
(mas
s%)
± 1σ
(mas
s%)
(mas
s%)
(mg/
kg)
(mg/
kg)
42
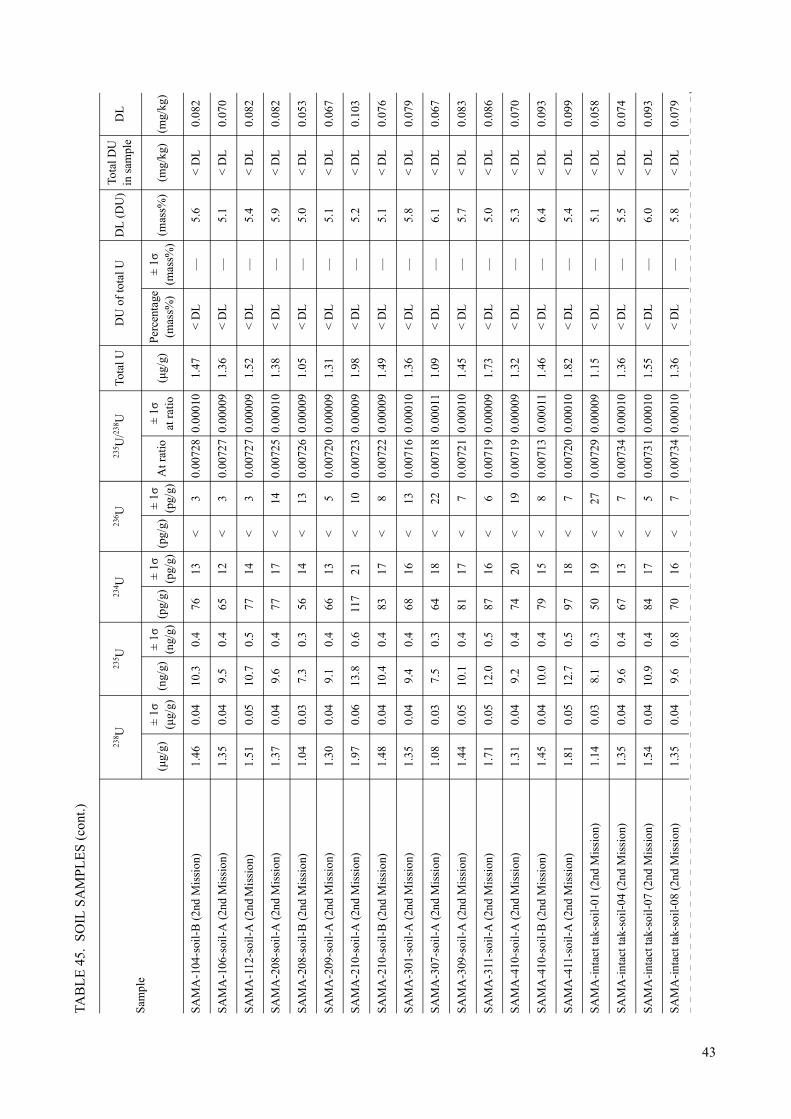
SA
MA
-104
-soi
l-B
(2n
d M
issi
on)
1.46
0.04
10.3
0.4
7613
<3
0.00
728
0.00
010
1.47
< D
L—
5.6
< D
L0.
082
SA
MA
-106
-soi
l-A
(2n
d M
issi
on)
1.35
0.04
9.5
0.4
6512
<3
0.00
727
0.00
009
1.36
< D
L—
5.1
< D
L0.
070
SA
MA
-112
-soi
l-A
(2n
d Mis
sion
)1.
510.
0510
.70.
577
14<
30.
0072
70.
0000
91.
52<
DL
—5.
4<
DL
0.08
2
SA
MA
-208
-soi
l-A
(2n
d M
issi
on)
1.37
0.04
9.6
0.4
7717
<14
0.00
725
0.00
010
1.38
< D
L—
5.9
< D
L0.
082
SA
MA
-208
-soi
l-B
(2n
d M
issi
on)
1.04
0.03
7.3
0.3
5614
<13
0.00
726
0.00
009
1.05
< D
L—
5.0
< D
L0.
053
SA
MA
-209
-soi
l-A
(2n
d M
issi
on)
1.30
0.04
9.1
0.4
6613
<5
0.00
720
0.00
009
1.31
< D
L—
5.1
< D
L0.
067
SA
MA
-210
-soi
l-A
(2n
d M
issi
on)
1.97
0.06
13.8
0.6
117
21<
100.
0072
30.
0000
91.
98<
DL
—5.
2<
DL
0.10
3
SA
MA
-210
-soi
l-B
(2n
d M
issi
on)
1.48
0.04
10.4
0.4
8317
<8
0.00
722
0.00
009
1.49
< D
L—
5.1
< D
L0.
076
SA
MA
-301
-soi
l-A
(2n
d M
issi
on)
1.35
0.04
9.4
0.4
6816
<13
0.00
716
0.00
010
1.36
< D
L—
5.8
< D
L0.
079
SA
MA
-307
-soi
l-A
(2n
d M
issi
on)
1.08
0.03
7.5
0.3
6418
<22
0.00
718
0.00
011
1.09
< D
L—
6.1
< D
L0.
067
SA
MA
-309
-soi
l-A
(2n
d M
issi
on)
1.44
0.05
10.1
0.4
8117
<7
0.00
721
0.00
010
1.45
< D
L—
5.7
< D
L0.
083
SA
MA
-311
-soi
l-A
(2n
d M
issi
on)
1.71
0.05
12.0
0.5
8716
<6
0.00
719
0.00
009
1.73
< D
L—
5.0
< D
L0.
086
SA
MA
-410
-soi
l-A
(2n
d M
issi
on)
1.31
0.04
9.2
0.4
7420
<19
0.00
719
0.00
009
1.32
< D
L—
5.3
< D
L0.
070
SA
MA
-410
-soi
l-B
(2n
d M
issi
on)
1.45
0.04
10.0
0.4
7915
<8
0.00
713
0.00
011
1.46
< D
L—
6.4
< D
L0.
093
SA
MA
-411
-soi
l-A
(2n
d M
issi
on)
1.81
0.05
12.7
0.5
9718
<7
0.00
720
0.00
010
1.82
< D
L—
5.4
< D
L0.
099
SA
MA
-int
act t
ak-s
oil-
01 (
2nd
Mis
sion
)1.
140.
038.
10.
350
19<
270.
0072
90.
0000
91.
15<
DL
—5.
1<
DL
0.05
8
SA
MA
-int
act t
ak-s
oil-
04 (
2nd
Mis
sion
)1.
350.
049.
60.
467
13<
70.
0073
40.
0001
01.
36<
DL
—5.
5<
DL
0.07
4
SA
MA
-int
act t
ak-s
oil-
07 (
2nd
Mis
sion
)1.
540.
0410
.90.
484
17<
50.
0073
10.
0001
01.
55<
DL
—6.
0<
DL
0.09
3
SA
MA
-int
act t
ak-s
oil-
08 (
2nd
Mis
sion
)1.
350.
049.
60.
870
16<
70.
0073
40.
0001
01.
36<
DL
—5.
8<
DL
0.07
9
TAB
LE
45.
SO
IL S
AM
PL
ES
(co
nt.)
Sam
ple
238 U
235 U
234 U
236 U
235 U
/238 U
Tota
l UD
U o
f to
tal U
DL
(D
U)
Tota
l DU
in s
ampl
eD
L
(μg/
g)±
1σ(μ
g/g)
(ng/
g)±
1σ(n
g/g)
(pg/
g)±
1σ(p
g/g)
(pg/
g)±
1σ(p
g/g)
At r
atio
± 1σ
at r
atio
(μg/
g)Pe
rcen
tage
(mas
s%)
± 1σ
(mas
s%)
(mas
s%)
(mg/
kg)
(mg/
kg)
43

SA
MA
-int
act t
ak-s
oil-
09 (
2nd
Mis
sion
)1.
660.
0411
.80.
582
15<
60.
0073
20.
0001
01.
67<
DL
—5.
4<
DL
0.09
1
SA
MA
-bom
bard
ed ta
nk-s
oil-
10 (
2nd
Mis
sion
)2.
210.
0615
.70.
711
823
<16
0.00
732
0.00
010
2.23
< D
L—
5.6
< D
L0.
125
SA
MA
-bom
bard
ed ta
nk-s
oil-
11 (
2nd
Mis
sion
)2.
040.
0614
.50.
712
022
<9
0.00
730
0.00
010
2.05
< D
L—
5.6
< D
L0.
114
SA
MA
-bom
bard
ed ta
nk-s
oil-
12 (
2nd
Mis
sion
)1.
610.
0511
.50.
577
17<
170.
0073
40.
0000
91.
62<
DL
—5.
2<
DL
0.08
5
SA
MA
-bom
bard
ed ta
nk-s
oil-
15 (
2nd
Mis
sion
)1.
930.
0513
.60.
696
18<
50.
0072
70.
0000
91.
94<
DL
—5.
3<
DL
0.10
3
SA
MA
-bom
bard
ed ta
nk-s
oil-
16 (
2nd
Mis
sion
)1.
480.
0410
.40.
475
14<
60.
0072
60.
0000
91.
49<
DL
—5.
1<
DL
0.07
6
SA
MA
-bom
bard
ed ta
nk-s
oil-
17 (
2nd
Mis
sion
)1.
600.
0511
.30.
577
17<
130.
0072
90.
0000
91.
61<
DL
—5.
2<
DL
0.08
4
SA
MA
-bom
bard
ed ta
nk-s
oil-
18 (
2nd
Mis
sion
)1.
840.
0513
.10.
584
16<
30.
0073
00.
0001
01.
86<
DL
—5.
9<
DL
0.10
9
SA
MA
-bom
bard
ed ta
nk-s
oil-
19 (
2nd
Mis
sion
)1.
350.
049.
60.
465
14<
40.
0073
30.
0000
91.
36<
DL
—5.
3<
DL
0.07
2
SA
MA
-bom
bard
ed ta
nk-s
oil-
20 (
2nd
Mis
sion
)1.
120.
037.
90.
346
15<
200.
0072
80.
0001
01.
13<
DL
—5.
7<
DL
0.06
4
SA
MA
-bom
bard
ed ta
nk-s
oil-
21 (
2nd
Mis
sion
)1.
890.
0513
.40.
590
20<
110.
0073
20.
0001
01.
90<
DL
—5.
5<
DL
0.10
5
SA
MA
-bom
bard
ed ta
nk-s
oil-
22 (
2nd
Mis
sion
)1.
490.
0410
.60.
476
15<
70.
0072
80.
0000
91.
50<
DL
—5.
3<
DL
0.07
9
SA
MA
-bom
bard
ed ta
nk-s
oil-
23 (
2nd
Mis
sion
)1.
490.
0410
.60.
474
15<
120.
0073
20.
0001
01.
50<
DL
—5.
5<
DL
0.08
3
SA
MA
-bom
bard
ed ta
nk-s
oil-
24 (
2nd
Mis
sion
)1.
600.
0411
.20.
573
15<
130.
0072
30.
0000
91.
61<
DL
—5.
1<
DL
0.08
2
SA
MA
-can
non
1-so
il (2
nd M
issi
on)
1.22
0.03
8.4
0.3
6512
<3
0.00
716
0.00
009
1.22
< D
L—
5.2
< D
L0.
063
SA
MA
-far
m-s
oil (
2nd
Mis
sion
)1.
460.
0410
.20.
466
15<
80.
0072
60.
0001
21.
47<
DL
—6.
6<
DL
0.09
7
Az
Zub
ayr
ZU
BA
-102
-soi
l-A
1.10
0.07
7.8
0.5
646
<16
0.00
725
0.00
005
1.11
< D
L—
2.7
< D
L0.
030
ZU
BA
-103
-soi
l-A
1.21
0.07
7.8
0.5
608
<5
0.00
658
0.00
003
1.21
13.0
0.6
1.8
0.15
0.02
2
TAB
LE
45.
SO
IL S
AM
PL
ES
(co
nt.)
Sam
ple
238 U
235 U
234 U
236 U
235 U
/238 U
Tota
l UD
U o
f to
tal U
DL
(D
U)
Tota
l DU
in s
ampl
eD
L
(μg/
g)±
1σ(μ
g/g)
(ng/
g)±
1σ(n
g/g)
(pg/
g)±
1σ(p
g/g)
(pg/
g)±
1σ(p
g/g)
At r
atio
± 1σ
at r
atio
(μg/
g)Pe
rcen
tage
(mas
s%)
± 1σ
(mas
s%)
(mas
s%)
(mg/
kg)
(mg/
kg)
44

ZU
BA
-104
-soi
l-A
1.00
0.06
7.1
0.4
626
<3
0.00
723
0.00
006
1.01
< D
L—
3.3
< D
L0.
033
ZU
BA
-105
-soi
l-A
1.04
0.06
7.4
0.5
658
<4
0.00
723
0.00
005
1.04
< D
L—
2.7
< D
L0.
028
ZU
BA
-106
-soi
l-A
1.48
0.09
10.6
0.7
848
<3
0.00
722
0.00
003
1.49
< D
L—
1.9
< D
L0.
028
ZU
BA
-107
-soi
l-A
0.71
0.04
5.1
0.3
426
<5
0.00
725
0.00
003
0.71
< D
L—
1.7
< D
L0.
012
ZU
BA
-108
-soi
l-A
0.99
0.06
7.0
0.4
575
<10
0.00
720
0.00
006
0.99
< D
L—
3.4
< D
L0.
034
ZU
BA
-109
-soi
l-A
0.65
0.04
4.6
0.3
373
<6
0.00
719
0.00
005
0.65
< D
L—
2.7
< D
L0.
017
ZU
BA
-110
-soi
l-A
2.77
0.17
19.8
1.2
182
18<
50.
0072
40.
0000
22.
79<
DL
—1.
3<
DL
0.03
5
ZU
BA
-111
-soi
l-A
3.46
0.21
24.7
1.5
222
18<
60.
0072
30.
0000
43.
49<
DL
—2.
1<
DL
0.07
3
ZU
BA
-112
-soi
l-A
0.72
0.04
5.0
0.3
404
32
0.00
714
0.00
003
0.72
2.1
0.5
1.6
0.01
0.01
2
ZU
BA
-113
-soi
l-A
1.03
0.06
7.3
0.4
636
<10
0.00
723
0.00
004
1.03
< D
L—
2.1
< D
L0.
021
Az
Zub
ayr
(2n
d M
issi
on)
ZU
BA
-102
-soi
l (2n
d M
issi
on)
0.87
0.02
6.2
0.2
535
<3
0.00
725
0.00
005
0.88
< D
L—
2.8
< D
L0.
024
ZU
BA
-103
-soi
l (2n
d M
issi
on)
1.03
0.03
6.7
0.2
523
31
0.00
663
0.00
003
1.04
12.0
0.5
1.6
0.12
0.01
6
ZU
BA
-105
-soi
l-A
(2n
d M
issi
on)
0.95
0.02
6.8
0.2
584
<2
0.00
725
0.00
005
0.95
< D
L—
2.9
< D
L0.
028
ZU
BA
-105
-soi
l-B
(2n
d M
issi
on)
3.00
0.08
10.8
0.3
655
163
0.00
367
0.00
002
3.01
68.2
0.3
1.0
2.05
0.02
9
ZU
BA
-105
-soi
l-C
(2n
d M
issi
on)
591.
0015
.00
1182
.031
.057
7829
9583
7242
50.
0020
40.
0000
359
2.20
99.3
0.1
0.2
588.
000.
992
ZU
BA
-105
-soi
l-D
(2n
d M
issi
on)
52.7
01.
3011
1.0
3.0
401
4922
032
0.00
215
0.00
002
52.7
797
.20.
51.
451
.28
0.73
7
ZU
BA
-105
-soi
l-F
(2n
d M
issi
on)
27.0
00.
8059
.02.
029
114
562
570.
0022
40.
0000
327
.10
95.4
0.5
1.5
25.8
50.
395
ZU
BA
-105
-soi
l-G
(2n
d M
issi
on)
5.80
0.10
16.6
0.4
9915
114
100.
0029
30.
0000
15.
7882
.30.
10.
44.
750.
023
TAB
LE
45.
SO
IL S
AM
PL
ES
(co
nt.)
Sam
ple
238 U
235 U
234 U
236 U
235 U
/238 U
Tota
l UD
U o
f to
tal U
DL
(D
U)
Tota
l DU
in s
ampl
eD
L
(μg/
g)±
1σ(μ
g/g)
(ng/
g)±
1σ(n
g/g)
(pg/
g)±
1σ(p
g/g)
(pg/
g)±
1σ(p
g/g)
At r
atio
± 1σ
at r
atio
(μg/
g)Pe
rcen
tage
(mas
s%)
± 1σ
(mas
s%)
(mas
s%)
(mg/
kg)
(mg/
kg)
45

ZU
BA
-105
-soi
l-H
(2n
d M
issi
on)
62.1
01.
7012
9.0
4.0
506
2041
430
0.00
212
0.00
001
62.2
097
.70.
20.
560
.79
0.28
3
ZU
BA
-111
-soi
l (2n
d M
issi
on)
2.69
0.07
19.2
0.6
168
13<
30.
0072
60.
0000
52.
71<
DL
—2.
9<
DL
0.07
9
Al B
asra
h
BA
SR
A-1
01-s
oil
5.30
0.20
19.5
0.8
145
1994
100.
0037
80.
0000
25.
2966
.20.
41.
23.
500.
064
BA
SR
A-1
02-s
oil
14.8
00.
6035
.71.
519
831
361
370.
0024
50.
0000
314
.86
91.4
0.5
1.5
13.5
80.
217
BA
SR
A-1
03-s
oil
1.72
0.07
10.1
0.4
8212
166
0.00
601
0.00
004
1.73
23.7
0.7
2.0
0.41
0.03
5
BA
SR
A-1
04-s
oil
1.87
0.07
12.3
0.5
8810
62
0.00
673
0.00
005
1.88
10.0
0.9
2.7
0.19
0.05
1
BA
SR
A-1
05-s
oil
1.63
0.06
11.2
0.5
100
12<
140.
0069
90.
0000
41.
645.
00.
72.
20.
080.
036
BA
SR
A-1
06-s
oil
1.88
0.07
13.2
0.8
130
21<
180.
0071
60.
0000
41.
90<
DL
—2.
2<
DL
0.04
2
BA
SR
A-1
07-s
oil
1.50
0.06
10.6
0.5
949
<15
0.00
719
0.00
004
1.51
< D
L—
2.3
< D
L0.
035
BA
SR
A-1
08-s
oil
1.23
0.05
7.9
0.3
6911
<15
0.00
653
0.00
004
1.23
13.7
0.8
2.3
0.17
0.02
9
BA
SR
A-1
09-s
oil
1.16
0.05
8.1
0.3
678
<12
0.00
714
0.00
006
1.17
< D
L—
3.2
< D
L0.
037
BA
SR
A-1
10-s
oil
1.36
0.05
9.6
0.4
8313
<18
0.00
716
0.00
005
1.37
< D
L—
2.9
< D
L0.
040
BA
SR
A-1
11-s
oil
1.91
0.07
9.9
0.4
799
314
0.00
527
0.00
004
1.92
37.7
0.8
2.5
0.72
0.04
8
BA
SR
A-1
12-s
oil
1.42
0.06
8.6
0.3
767
275
0.00
618
0.00
005
1.43
20.4
0.9
2.6
0.29
0.03
7
BA
SR
A-1
13-s
oil
2.60
0.10
12.8
0.5
101
1035
30.
0050
10.
0000
22.
6142
.70.
41.
11.
120.
027
BA
SR
A-1
14-s
oil
0.77
0.03
5.0
0.4
394
31
0.00
670
0.00
003
0.77
10.5
0.6
1.9
0.08
0.01
5
BA
SR
A-1
15-s
oil
3.50
0.14
12.0
0.5
8615
7511
0.00
350
0.00
001
3.51
71.5
0.2
0.7
2.51
0.02
6
BA
SR
A-1
15-s
oil a
744.
0028
.00
1220
.049
.040
7959
822
225
2211
0.00
167
0.00
001
745.
4010
6.3
0.3
0.8
792.
006.
167
TAB
LE
45.
SO
IL S
AM
PL
ES
(co
nt.)
Sam
ple
238 U
235 U
234 U
236 U
235 U
/238 U
Tota
l UD
U o
f to
tal U
DL
(D
U)
Tota
l DU
in s
ampl
eD
L
(μg/
g)±
1σ(μ
g/g)
(ng/
g)±
1σ(n
g/g)
(pg/
g)±
1σ(p
g/g)
(pg/
g)±
1σ(p
g/g)
At r
atio
± 1σ
at r
atio
(μg/
g)Pe
rcen
tage
(mas
s%)
± 1σ
(mas
s%)
(mas
s%)
(mg/
kg)
(mg/
kg)
46

BA
SR
A-1
15-s
oil b
80.8
03.
1013
8.0
6.0
470
5023
6921
40.
0017
40.
0000
180
.89
104.
90.
10.
484
.84
0.30
9
BA
SR
A-1
15-s
oil c
1901
.00
73.0
031
22.0
127.
010
273
1043
5693
151
920.
0016
70.
0000
119
05.0
010
6.2
0.1
0.4
2023
.00
7.44
9
BA
SR
A-1
16-s
oil
1.52
0.06
8.6
0.4
7611
206
0.00
577
0.00
002
1.53
28.1
0.3
0.9
0.43
0.01
4
BA
SR
A-1
17-s
oil
1.19
0.05
8.0
0.3
656
41
0.00
682
0.00
005
1.20
8.3
0.9
2.7
0.10
0.03
2
BA
SR
A-1
18-s
oil
1.39
0.06
8.9
0.4
697
61
0.00
656
0.00
002
1.40
13.1
0.5
1.4
0.18
0.01
9
BA
SR
A-2
01-s
oil
1.63
0.07
11.6
0.5
108
14<
120.
0072
70.
0000
41.
64<
DL
—2.
6<
DL
0.04
2
BA
SR
A-2
02-s
oil
1.22
0.05
8.7
0.4
7910
<11
0.00
729
0.00
003
1.23
< D
L—
1.7
< D
L0.
021
BA
SR
A-2
03-s
oil
1.13
0.04
8.0
0.3
638
<9
0.00
725
0.00
002
1.14
< D
L—
1.1
< D
L0.
012
BA
SR
A-2
04-s
oil
1.19
0.05
8.3
0.3
6812
<16
0.00
725
0.00
003
1.18
< D
L—
1.6
< D
L0.
019
BA
SR
A-2
05-s
oil
1.52
0.06
10.8
0.4
8113
<17
0.00
728
0.00
003
1.53
< D
L—
1.9
< D
L0.
029
BA
SR
A-2
06-s
oil
1.10
0.04
7.9
0.3
6712
<14
0.00
730
0.00
003
1.11
< D
L—
2.0
< D
L0.
022
BA
SR
A-2
07-s
oil
1.23
0.05
8.7
0.4
778
<8
0.00
724
0.00
007
1.24
< D
L—
3.8
< D
L0.
047
BA
SR
A-2
08-s
oil
0.71
0.03
5.0
0.2
5415
<23
0.00
729
0.00
004
0.71
< D
L—
2.0
< D
L0.
014
BA
SR
A-2
09-s
oil
1.45
0.06
10.3
0.5
9312
<12
0.00
730
0.00
004
1.46
< D
L—
2.1
< D
L0.
031
BA
SR
A-2
10-s
oil
1.38
0.05
9.8
0.4
8315
<19
0.00
727
0.00
003
1.39
< D
L—
1.9
< D
L0.
026
BA
SR
A-2
11-s
oil
1.15
0.05
8.2
0.4
7310
<11
0.00
724
0.00
006
1.16
< D
L—
3.4
< D
L0.
040
BA
SR
A-3
01-s
oil
1.86
0.07
12.8
0.5
115
14<
120.
0070
50.
0000
41.
873.
80.
82.
30.
070.
042
BA
SR
A-3
02-s
oil
1.32
0.05
8.5
0.4
8013
<17
0.00
663
0.00
004
1.32
11.8
0.8
2.5
0.16
0.03
3
BA
SR
A-3
03-s
oil
1.26
0.05
8.8
0.4
8112
<14
0.00
716
0.00
005
1.27
< D
L—
2.6
< D
L0.
033
TAB
LE
45.
SO
IL S
AM
PL
ES
(co
nt.)
Sam
ple
238 U
235 U
234 U
236 U
235 U
/238 U
Tota
l UD
U o
f to
tal U
DL
(D
U)
Tota
l DU
in s
ampl
eD
L
(μg/
g)±
1σ(μ
g/g)
(ng/
g)±
1σ(n
g/g)
(pg/
g)±
1σ(p
g/g)
(pg/
g)±
1σ(p
g/g)
At r
atio
± 1σ
at r
atio
(μg/
g)Pe
rcen
tage
(mas
s%)
± 1σ
(mas
s%)
(mas
s%)
(mg/
kg)
(mg/
kg)
47

BA
SR
A-3
04-s
oil
2.38
0.09
16.3
0.7
145
15<
100.
0070
20.
0000
22.
404.
40.
41.
30.
110.
032
BA
SR
A-3
05-s
oil
1.57
0.09
10.8
0.6
9310
93
0.00
706
0.00
006
1.58
3.6
1.2
3.6
0.06
0.05
7
BA
SR
A-3
06-s
oil
1.56
0.06
11.0
0.5
929
<16
0.00
725
0.00
003
1.57
< D
L—
1.6
< D
L0.
025
BA
SR
A-3
07-s
oil
1.79
0.07
12.6
0.6
115
11<
70.
0072
20.
0000
61.
80<
DL
—3.
2<
DL
0.05
8
BA
SR
A-3
08-s
oil
1.68
0.07
12.0
0.5
111
11<
80.
0072
90.
0000
21.
69<
DL
—1.
4<
DL
0.02
3
BA
SR
A-3
09-s
oil
1.63
0.06
11.4
0.5
104
12<
110.
0071
60.
0000
21.
641.
70.
31.
00.
030.
017
BA
SR
A-3
10-s
oil
1.87
0.07
13.3
0.5
123
14<
120.
0072
50.
0000
41.
89<
DL
—2.
5<
DL
0.04
8
BA
SR
A-3
11-s
oil
1.37
0.05
9.6
0.4
8612
<14
0.00
719
0.00
005
1.38
< D
L—
3.1
< D
L0.
043
BA
SR
A-3
12-s
oil
1.67
0.08
11.9
0.6
106
13<
170.
0072
90.
0000
51.
68<
DL
—3.
1<
DL
0.05
2
BA
SR
A-3
13 s
oil
1.64
0.06
11.6
0.5
102
12<
100.
0072
40.
0000
11.
65<
DL
—0.
5<
DL
0.00
9
BA
SR
A-3
14-s
oil
1.75
0.07
12.3
0.5
104
12<
90.
0072
30.
0000
11.
76<
DL
—0.
7<
DL
0.01
3
BA
SR
A-4
01-s
oil
1.73
0.07
12.2
0.5
108
12<
100.
0072
20.
0000
31.
75<
DL
—2.
0<
DL
0.03
5
BA
SR
A-4
02-s
oil
1.57
0.06
10.8
0.5
9210
<11
0.00
703
0.00
004
1.58
4.1
0.7
2.2
0.07
0.03
5
BA
SR
A-4
03-s
oil
1.28
0.05
8.9
0.4
698
<12
0.00
714
0.00
004
1.29
< D
L—
2.5
< D
L0.
033
BA
SR
A-4
04-s
oil
1.38
0.05
9.8
0.4
8213
<18
0.00
722
0.00
005
1.39
< D
L—
3.0
< D
L0.
042
BA
SR
A-4
05-s
oil
1.87
0.07
13.1
0.5
114
11<
140.
0071
80.
0000
41.
88<
DL
—2.
2<
DL
0.04
1
BA
SR
A-4
06-s
oil
2.26
0.09
15.7
0.6
145
11<
100.
0071
20.
0000
32.
272.
40.
61.
90.
060.
044
BA
SR
A-4
07-s
oil
1.13
0.04
8.0
0.3
729
<11
0.00
720
0.00
007
1.14
< D
L—
3.9
< D
L0.
045
BA
SR
A-4
08-s
oil
1.71
0.07
11.9
0.5
106
12<
150.
0070
90.
0000
91.
73<
DL
—5.
2<
DL
0.08
9
TAB
LE
45.
SO
IL S
AM
PL
ES
(co
nt.)
Sam
ple
238 U
235 U
234 U
236 U
235 U
/238 U
Tota
l UD
U o
f to
tal U
DL
(D
U)
Tota
l DU
in s
ampl
eD
L
(μg/
g)±
1σ(μ
g/g)
(ng/
g)±
1σ(n
g/g)
(pg/
g)±
1σ(p
g/g)
(pg/
g)±
1σ(p
g/g)
At r
atio
± 1σ
at r
atio
(μg/
g)Pe
rcen
tage
(mas
s%)
± 1σ
(mas
s%)
(mas
s%)
(mg/
kg)
(mg/
kg)
48

BA
SR
A-4
09-s
oil
0.97
0.04
6.9
0.3
616
<19
0.00
719
0.00
004
0.98
< D
L—
2.1
< D
L0.
020
BA
SR
A-4
10-s
oil
1.86
0.07
12.4
0.5
100
920
40.
0068
10.
0000
31.
878.
40.
61.
90.
160.
035
BA
SR
A-4
11-s
oil
1.13
0.05
7.8
0.3
678
<11
0.00
710
0.00
007
1.14
< D
L—
3.8
< D
L0.
044
BA
SR
A-4
12-s
oil
1.37
0.05
9.4
0.4
7411
<15
0.00
702
0.00
005
1.38
4.4
1.0
2.9
0.06
0.03
9
BA
SR
A-4
13-s
oil
1.59
0.06
11.2
0.5
909
<16
0.00
721
0.00
004
1.60
< D
L—
2.1
< D
L0.
034
BA
SR
A-4
14-s
oil
2.90
0.11
20.5
0.8
188
17<
290.
0072
20.
0000
42.
92<
DL
—2.
0<
DL
0.05
9
BA
SR
A-4
15-s
oil
1.76
0.07
12.4
0.5
109
8<
17.6
0.00
720
0.00
005
1.77
< D
L—
2.8
< D
L0.
050
BA
SR
A-4
16-s
oil
1.61
0.06
11.4
0.5
958
<16
0.00
721
0.00
005
1.62
< D
L—
3.0
< D
L0.
049
BA
SR
A-4
17-s
oil
1.64
0.07
11.6
0.5
106
9<
160.
0072
00.
0000
51.
65<
DL
—3.
0<
DL
0.04
9
BA
SR
A-4
18-s
oil
1.35
0.05
9.5
0.4
756
<27
0.00
717
0.00
003
1.36
< D
L—
1.9
< D
L0.
026
BA
SR
A-4
19-s
oil
1.59
0.06
11.2
0.5
898
<16
0.00
723
0.00
005
1.60
< D
L—
2.8
< D
L0.
044
An
Nas
iriy
ah
Nas
ir-s
oil-
01-0
21.
770.
0812
.50.
710
612
<9
0.00
730
0.00
003
1.78
< D
L—
1.9
< D
L0.
033
Nas
ir-s
oil-
01-0
41.
660.
0811
.80.
690
8<
50.
0072
90.
0000
31.
67<
DL
—1.
5<
DL
0.02
4
Nas
ir-s
oil-
01-0
51.
300.
069.
20.
567
8<
50.
0072
90.
0000
11.
31<
DL
—0.
8<
DL
0.01
1
Nas
ir-s
oil-
01-0
61.
440.
0710
.20.
580
9<
50.
0072
90.
0000
21.
45<
DL
—1.
2<
DL
0.01
7
Nas
ir-s
oil-
01-0
71.
280.
069.
10.
568
11<
150.
0072
80.
0000
21.
29<
DL
—1.
1<
DL
0.01
4
Nas
ir-s
oil-
01-0
81.
510.
0710
.70.
683
8<
50.
0072
60.
0000
31.
52<
DL
—1.
6<
DL
0.02
4
Nas
ir-s
oil-
02-0
11.
690.
0811
.90.
692
10<
50.
0072
60.
0000
31.
70<
DL
—2.
0<
DL
0.03
4
TAB
LE
45.
SO
IL S
AM
PL
ES
(co
nt.)
Sam
ple
238 U
235 U
234 U
236 U
235 U
/238 U
Tota
l UD
U o
f to
tal U
DL
(D
U)
Tota
l DU
in s
ampl
eD
L
(μg/
g)±
1σ(μ
g/g)
(ng/
g)±
1σ(n
g/g)
(pg/
g)±
1σ(p
g/g)
(pg/
g)±
1σ(p
g/g)
At r
atio
± 1σ
at r
atio
(μg/
g)Pe
rcen
tage
(mas
s%)
± 1σ
(mas
s%)
(mas
s%)
(mg/
kg)
(mg/
kg)
49

Nas
ir-s
oil-
02-0
21.
700.
0812
.00.
794
9<
60.
0072
90.
0000
21.
71<
DL
—1.
0<
DL
0.01
8
Nas
ir-s
oil-
02-0
31.
560.
0711
.00.
690
10<
80.
0072
50.
0000
21.
57<
DL
—1.
0<
DL
0.01
5
Nas
ir-s
oil-
02-0
41.
360.
079.
50.
575
7<
40.
0072
40.
0000
21.
37<
DL
—1.
2<
DL
0.01
7
Nas
ir-s
oil-
02-0
52.
010.
0911
.80.
690
87
20.
0060
20.
0000
12.
0223
.40.
20.
70.
470.
015
Nas
ir-s
oil-
02-0
61.
970.
0912
.90.
710
312
<3
0.00
674
0.00
004
1.99
9.6
0.8
2.4
0.19
0.04
7
Nas
ir-s
oil-
02-0
71.
950.
0913
.70.
711
210
<4
0.00
725
0.00
004
1.96
< D
L—
2.3
< D
L0.
045
Nas
ir-s
oil-
02-0
81.
670.
0811
.70.
697
10<
90.
0072
40.
0000
31.
68<
DL
—1.
7<
DL
0.02
8
Nas
ir-s
oil-
02-0
92.
100.
1013
.80.
711
112
32
0.00
679
0.00
003
2.11
8.7
0.5
1.5
0.18
0.03
2
Nas
ir-s
oil-
02-1
01.
900.
0913
.00.
710
48
<6
0.00
711
0.00
005
1.91
< D
L—
2.9
< D
L0.
055
Nas
ir-s
oil-
03-0
11.
790.
0913
.00.
610
811
<4
0.00
725
0.00
002
1.80
< D
L—
1.2
< D
L0.
021
Nas
ir-s
oil-
03-0
22.
260.
1116
.00.
814
011
<8
0.00
724
0.00
003
2.28
< D
L—
1.5
< D
L0.
034
Nas
ir-s
oil-
03-0
31.
660.
0811
.80.
696
10<
70.
0072
70.
0000
31.
68<
DL
—1.
5<
DL
0.02
5
Nas
ir-s
oil-
03-0
42.
320.
1116
.40.
914
815
<5
0.00
726
0.00
004
2.33
< D
L—
2.2
< D
L0.
051
Nas
ir-s
oil-
03-0
53.
040.
1421
.51.
119
614
<9
0.00
726
0.00
003
3.06
< D
L—
1.6
< D
L0.
048
Nas
ir-s
oil-
03-0
61.
770.
0812
.40.
610
311
<8
0.00
719
0.00
002
1.78
< D
L—
1.3
< D
L0.
024
Nas
ir-s
oil-
03-0
72.
000.
0914
.10.
711
99
<7
0.00
723
0.00
002
2.02
< D
L—
1.3
< D
L0.
027
Nas
ir-s
oil-
03-0
81.
510.
0710
.50.
591
11<
180.
0071
50.
0000
31.
522.
00.
51.
50.
030.
023
Nas
ir-s
oil-
03-0
92.
040.
1014
.40.
713
215
<7
0.00
725
0.00
004
2.06
< D
L—
2.1
< D
L0.
043
Nas
ir-s
oil-
03-1
02.
070.
1014
.50.
712
59
<14
0.00
720
0.00
008
2.08
< D
L—
4.6
< D
L0.
096
TAB
LE
45.
SO
IL S
AM
PL
ES
(co
nt.)
Sam
ple
238 U
235 U
234 U
236 U
235 U
/238 U
Tota
l UD
U o
f to
tal U
DL
(D
U)
Tota
l DU
in s
ampl
eD
L
(μg/
g)±
1σ(μ
g/g)
(ng/
g)±
1σ(n
g/g)
(pg/
g)±
1σ(p
g/g)
(pg/
g)±
1σ(p
g/g)
At r
atio
± 1σ
at r
atio
(μg/
g)Pe
rcen
tage
(mas
s%)
± 1σ
(mas
s%)
(mas
s%)
(mg/
kg)
(mg/
kg)
50

Nas
ir-s
oil-
04-0
12.
080.
1014
.30.
711
29
<12
0.00
703
0.00
002
2.10
4.3
0.4
1.1
0.09
0.02
2
Nas
ir-s
oil-
04-0
21.
830.
0912
.90.
710
38
<18
0.00
722
0.00
003
1.84
< D
L—
1.7
< D
L0.
031
Nas
ir-s
oil-
04-0
31.
700.
0812
.00.
697
11<
170.
0072
50.
0000
31.
71<
DL
—1.
5<
DL
0.02
5
Nas
ir-s
oil-
04-0
41.
290.
069.
10.
579
9<
190.
0072
20.
0000
41.
30<
DL
—2.
0<
DL
0.02
6
Nas
ir-s
oil-
04-0
52.
010.
1014
.30.
711
810
<18
0.00
727
0.00
002
2.03
< D
L—
1.1
< D
L0.
022
Nas
ir-s
oil-
04-0
61.
720.
0812
.20.
610
07
<3
0.00
728
0.00
003
1.73
< D
L—
1.9
< D
L0.
033
Nas
ir-s
oil-
04-0
71.
680.
0812
.00.
710
410
<4
0.00
727
0.00
008
1.70
< D
L—
4.4
< D
L0.
075
Nas
ir-s
oil-
04-0
81.
660.
0811
.80.
898
8<
80.
0072
60.
0000
31.
67<
DL
—1.
7<
DL
0.02
9
Nas
ir-s
oil-
04-0
91.
490.
0710
.60.
589
7<
60.
0072
70.
0000
31.
50<
DL
—1.
5<
DL
0.02
2
Nas
ir-s
oil-
04-1
01.
750.
0812
.40.
610
66
<3
0.00
724
0.00
007
1.77
< D
L—
4.0
< D
L0.
070
Nas
ir-s
oil-
07-0
11.
990.
0913
.20.
711
47
<4
0.00
679
0.00
004
2.00
8.7
0.8
2.4
0.17
0.04
9
Nas
ir-s
oil-
07-0
21.
630.
0811
.60.
697
7<
30.
0072
50.
0000
41.
64<
DL
—2.
1<
DL
0.03
4
Nas
ir-s
oil-
07-0
31.
710.
0812
.10.
610
07
<5
0.00
723
0.00
003
1.72
< D
L—
1.6
< D
L0.
027
Nas
ir-s
oil-
07-0
41.
980.
1014
.00.
711
410
<4
0.00
720
0.00
006
2.00
< D
L—
3.3
< D
L0.
065
Nas
ir-s
oil-
07-0
51.
820.
0912
.90.
611
29
<12
0.00
723
0.00
004
1.84
< D
L—
2.3
< D
L0.
043
Nas
ir-s
oil-
07-0
61.
560.
0710
.90.
590
7<
30.
0071
90.
0000
21.
57<
DL
—1.
4<
DL
0.02
2
Nas
ir-s
oil-
07-0
72.
080.
1014
.40.
712
111
<4
0.00
710
0.00
003
2.09
2.9
0.6
1.9
0.06
0.04
0
Nas
ir-s
oil-
07-0
82.
000.
1013
.80.
711
78
<3
0.00
708
0.00
004
2.01
3.3
0.8
2.4
0.07
0.04
8
Nas
ir-s
oil-
07-0
91.
780.
0812
.60.
610
77
<9
0.00
725
0.00
003
1.79
< D
L—
1.5
< D
L0.
027
TAB
LE
45.
SO
IL S
AM
PL
ES
(co
nt.)
Sam
ple
238 U
235 U
234 U
236 U
235 U
/238 U
Tota
l UD
U o
f to
tal U
DL
(D
U)
Tota
l DU
in s
ampl
eD
L
(μg/
g)±
1σ(μ
g/g)
(ng/
g)±
1σ(n
g/g)
(pg/
g)±
1σ(p
g/g)
(pg/
g)±
1σ(p
g/g)
At r
atio
± 1σ
at r
atio
(μg/
g)Pe
rcen
tage
(mas
s%)
± 1σ
(mas
s%)
(mas
s%)
(mg/
kg)
(mg/
kg)
51
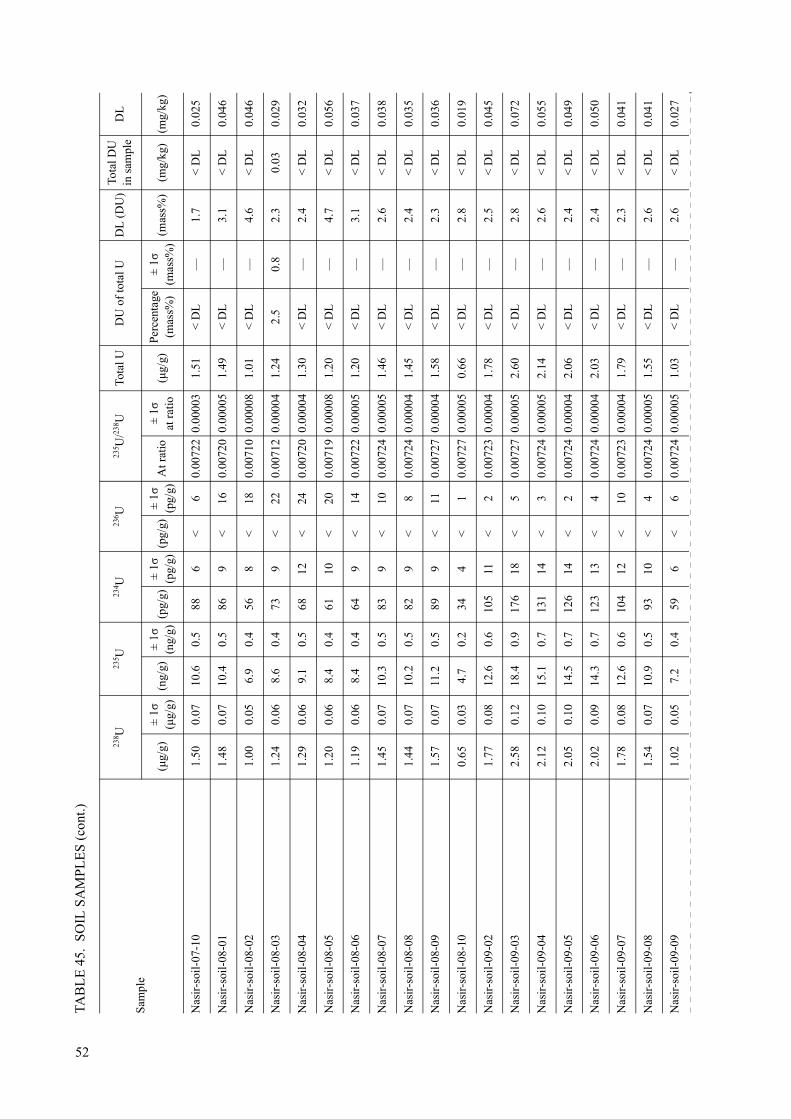
Nas
ir-s
oil-
07-1
01.
500.
0710
.60.
588
6<
60.
0072
20.
0000
31.
51<
DL
—1.
7<
DL
0.02
5
Nas
ir-s
oil-
08-0
11.
480.
0710
.40.
586
9<
160.
0072
00.
0000
51.
49<
DL
—3.
1<
DL
0.04
6
Nas
ir-s
oil-
08-0
21.
000.
056.
90.
456
8<
180.
0071
00.
0000
81.
01<
DL
—4.
6<
DL
0.04
6
Nas
ir-s
oil-
08-0
31.
240.
068.
60.
473
9<
220.
0071
20.
0000
41.
242.
50.
82.
30.
030.
029
Nas
ir-s
oil-
08-0
41.
290.
069.
10.
568
12<
240.
0072
00.
0000
41.
30<
DL
—2.
4<
DL
0.03
2
Nas
ir-s
oil-
08-0
51.
200.
068.
40.
461
10<
200.
0071
90.
0000
81.
20<
DL
—4.
7<
DL
0.05
6
Nas
ir-s
oil-
08-0
61.
190.
068.
40.
464
9<
140.
0072
20.
0000
51.
20<
DL
—3.
1<
DL
0.03
7
Nas
ir-s
oil-
08-0
71.
450.
0710
.30.
583
9<
100.
0072
40.
0000
51.
46<
DL
—2.
6<
DL
0.03
8
Nas
ir-s
oil-
08-0
81.
440.
0710
.20.
582
9<
80.
0072
40.
0000
41.
45<
DL
—2.
4<
DL
0.03
5
Nas
ir-s
oil-
08-0
91.
570.
0711
.20.
589
9<
110.
0072
70.
0000
41.
58<
DL
—2.
3<
DL
0.03
6
Nas
ir-s
oil-
08-1
00.
650.
034.
70.
234
4<
10.
0072
70.
0000
50.
66<
DL
—2.
8<
DL
0.01
9
Nas
ir-s
oil-
09-0
21.
770.
0812
.60.
610
511
<2
0.00
723
0.00
004
1.78
< D
L—
2.5
< D
L0.
045
Nas
ir-s
oil-
09-0
32.
580.
1218
.40.
917
618
<5
0.00
727
0.00
005
2.60
< D
L—
2.8
< D
L0.
072
Nas
ir-s
oil-
09-0
42.
120.
1015
.10.
713
114
<3
0.00
724
0.00
005
2.14
< D
L—
2.6
< D
L0.
055
Nas
ir-s
oil-
09-0
52.
050.
1014
.50.
712
614
<2
0.00
724
0.00
004
2.06
< D
L—
2.4
< D
L0.
049
Nas
ir-s
oil-
09-0
62.
020.
0914
.30.
712
313
<4
0.00
724
0.00
004
2.03
< D
L—
2.4
< D
L0.
050
Nas
ir-s
oil-
09-0
71.
780.
0812
.60.
610
412
<10
0.00
723
0.00
004
1.79
< D
L—
2.3
< D
L0.
041
Nas
ir-s
oil-
09-0
81.
540.
0710
.90.
593
10<
40.
0072
40.
0000
51.
55<
DL
—2.
6<
DL
0.04
1
Nas
ir-s
oil-
09-0
91.
020.
057.
20.
459
6<
60.
0072
40.
0000
51.
03<
DL
—2.
6<
DL
0.02
7
TAB
LE
45.
SO
IL S
AM
PL
ES
(co
nt.)
Sam
ple
238 U
235 U
234 U
236 U
235 U
/238 U
Tota
l UD
U o
f to
tal U
DL
(D
U)
Tota
l DU
in s
ampl
eD
L
(μg/
g)±
1σ(μ
g/g)
(ng/
g)±
1σ(n
g/g)
(pg/
g)±
1σ(p
g/g)
(pg/
g)±
1σ(p
g/g)
At r
atio
± 1σ
at r
atio
(μg/
g)Pe
rcen
tage
(mas
s%)
± 1σ
(mas
s%)
(mas
s%)
(mg/
kg)
(mg/
kg)
52

Nas
ir-s
oil-
10-0
11.
410.
0710
.00.
577
10<
210.
0072
50.
0000
31.
42<
DL
—1.
8<
DL
0.02
6
Nas
ir-s
oil-
10-0
21.
690.
0812
.00.
610
07
<5
0.00
728
0.00
003
1.70
< D
L—
2.0
< D
L0.
034
Nas
ir-s
oil-
10-0
31.
750.
0812
.40.
610
17
<3
0.00
726
0.00
004
1.76
< D
L—
2.2
< D
L0.
039
Nas
ir-s
oil-
10-0
42.
270.
1116
.10.
813
410
<3
0.00
725
0.00
002
2.29
< D
L—
1.1
< D
L0.
024
Nas
ir-s
oil-
10-0
51.
380.
079.
90.
583
8<
140.
0072
90.
0000
51.
39<
DL
—2.
9<
DL
0.04
0
Nas
ir-s
oil-
10-0
61.
750.
0812
.40.
611
110
<18
0.00
727
0.00
005
1.76
< D
L—
2.6
< D
L0.
045
Nas
ir-s
oil-
10-0
72.
090.
1014
.90.
713
311
<19
0.00
729
0.00
002
2.11
< D
L—
1.1
< D
L0.
023
Nas
ir-s
oil-
11-0
11.
350.
079.
60.
575
6<
40.
0072
60.
0000
21.
36<
DL
—1.
2<
DL
0.01
6
Nas
ir-s
oil-
11-0
21.
510.
0710
.70.
585
6<
30.
0072
40.
0000
41.
53<
DL
—2.
4<
DL
0.03
7
Nas
ir-s
oil-
11-0
31.
450.
0710
.30.
584
6<
30.
0072
50.
0000
41.
46<
DL
—2.
3<
DL
0.03
3
Nas
ir-s
oil-
11-0
41.
720.
089.
90.
573
513
10.
0058
90.
0000
31.
7325
.80.
61.
80.
450.
031
Nas
ir-s
oil-
11-0
51.
370.
079.
70.
573
7<
120.
0072
50.
0000
31.
38<
DL
—1.
7<
DL
0.02
3
Nas
ir-s
oil-
11-0
61.
360.
069.
60.
575
8<
90.
0072
30.
0000
41.
37<
DL
—2.
2<
DL
0.03
0
Nas
ir-s
oil-
11-0
71.
160.
068.
20.
470
5<
60.
0072
40.
0000
41.
17<
DL
—2.
1<
DL
0.02
4
Nas
ir-s
oil-
11-0
81.
550.
0710
.90.
586
8<
30.
0072
20.
0000
21.
56<
DL
—1.
2<
DL
0.01
8
Nas
ir-s
oil-
11-0
91.
280.
069.
10.
474
6<
30.
0072
20.
0000
31.
29<
DL
—1.
5<
DL
0.02
0
Nas
ir-s
oil-
12-0
11.
240.
068.
80.
469
6<
60.
0072
20.
0000
61.
25<
DL
—3.
2<
DL
0.04
0
Nas
ir-s
oil-
12-0
21.
190.
068.
40.
464
8<
110.
0072
30.
0000
51.
20<
DL
—2.
8<
DL
0.03
4
Nas
ir-s
oil-
12-0
31.
240.
068.
80.
468
10<
140.
0072
30.
0000
61.
25<
DL
—3.
2<
DL
0.04
0
TAB
LE
45.
SO
IL S
AM
PL
ES
(co
nt.)
Sam
ple
238 U
235 U
234 U
236 U
235 U
/238 U
Tota
l UD
U o
f to
tal U
DL
(D
U)
Tota
l DU
in s
ampl
eD
L
(μg/
g)±
1σ(μ
g/g)
(ng/
g)±
1σ(n
g/g)
(pg/
g)±
1σ(p
g/g)
(pg/
g)±
1σ(p
g/g)
At r
atio
± 1σ
at r
atio
(μg/
g)Pe
rcen
tage
(mas
s%)
± 1σ
(mas
s%)
(mas
s%)
(mg/
kg)
(mg/
kg)
53

Nas
ir-s
oil-
12-0
41.
650.
0811
.80.
693
9<
30.
0072
50.
0000
51.
66<
DL
—2.
9<
DL
0.04
9
Nas
ir-s
oil-
12-0
51.
340.
069.
50.
577
7<
60.
0072
30.
0000
61.
34<
DL
—3.
2<
DL
0.04
3
Nas
ir-s
oil-
12-0
71.
630.
0811
.50.
686
10<
30.
0071
80.
0000
31.
64<
DL
—1.
4<
DL
0.02
3
Nas
ir-s
oil-
12-0
90.
840.
046.
00.
348
5<
30.
0072
40.
0000
50.
85<
DL
—2.
6<
DL
0.02
2
Nas
ir-s
oil-
12-1
01.
380.
079.
80.
579
7<
30.
0072
40.
0000
51.
38<
DL
—2.
8<
DL
0.03
9
Nas
ir-s
oil-
12-1
21.
430.
0710
.10.
584
7<
40.
0072
30.
0000
21.
44<
DL
—1.
3<
DL
0.01
8
Nas
ir-s
oil-
12-1
32.
130.
1015
.10.
712
810
<9
0.00
722
0.00
007
2.14
< D
L—
3.8
< D
L0.
081
Nas
ir-s
oil-
12-1
41.
380.
079.
80.
577
7<
90.
0072
20.
0000
71.
39<
DL
—4.
0<
DL
0.05
6
Nas
ir-s
oil-
12-1
50.
910.
046.
40.
356
5<
50.
0072
00.
0000
30.
92<
DL
—1.
7<
DL
0.01
6
Nas
ir-s
oil-
12-1
61.
430.
0710
.10.
581
7<
30.
0072
00.
0001
01.
44<
DL
—5.
7<
DL
0.08
3
Nas
ir-s
oil-
13-0
12.
020.
1014
.40.
712
812
<20
0.00
723
0.00
003
2.04
< D
L—
1.9
< D
L0.
038
Nas
ir-s
oil-
13-0
22.
010.
1014
.10.
711
58
<52
0.00
716
0.00
004
2.02
< D
L—
2.0
< D
L0.
041
Nas
ir-s
oil-
13-0
32.
000.
0914
.20.
712
38
<6
0.00
725
0.00
004
2.01
< D
L—
2.0
< D
L0.
040
Nas
ir-s
oil-
13-0
41.
440.
0710
.30.
588
9<
90.
0072
90.
0000
41.
45<
DL
—2.
1<
DL
0.03
1
Nas
ir-s
oil-
13-0
52.
090.
1014
.80.
812
87
<10
0.00
724
0.00
006
2.10
< D
L—
3.4
< D
L0.
072
Nas
ir-s
oil-
13-0
61.
430.
0710
.10.
587
10<
70.
0072
20.
0000
41.
44<
DL
—2.
1<
DL
0.03
0
Nas
ir-s
oil-
14-0
11.
360.
069.
60.
577
6<
110.
0072
60.
0000
51.
37<
DL
—3.
1<
DL
0.04
3
Nas
ir-s
oil-
14-0
31.
680.
0811
.90.
699
10<
200.
0072
50.
0000
41.
69<
DL
—2.
2<
DL
0.03
8
Nas
ir-s
oil-
14-0
41.
730.
0812
.20.
695
6<
100.
0072
20.
0000
71.
74<
DL
—3.
7<
DL
0.06
5
TAB
LE
45.
SO
IL S
AM
PL
ES
(co
nt.)
Sam
ple
238 U
235 U
234 U
236 U
235 U
/238 U
Tota
l UD
U o
f to
tal U
DL
(D
U)
Tota
l DU
in s
ampl
eD
L
(μg/
g)±
1σ(μ
g/g)
(ng/
g)±
1σ(n
g/g)
(pg/
g)±
1σ(p
g/g)
(pg/
g)±
1σ(p
g/g)
At r
atio
± 1σ
at r
atio
(μg/
g)Pe
rcen
tage
(mas
s%)
± 1σ
(mas
s%)
(mas
s%)
(mg/
kg)
(mg/
kg)
54

Nas
ir-s
oil-
14-0
51.
600.
0811
.20.
691
5<
80.
0071
90.
0000
71.
61<
DL
—3.
9<
DL
0.06
3
Nas
ir-s
oil-
14-0
61.
120.
067.
90.
465
5<
90.
0072
50.
0000
31.
13<
DL
—1.
8<
DL
0.02
0
Nas
ir-s
oil-
scra
ps32
44.0
015
4.00
6442
.032
4.0
2485
830
5435
359
4457
0.00
203
0.00
001
3251
.00
99.4
0.2
0.5
3231
.00
16.9
46
Nas
ir-s
oil-
bom
bard
ed ta
nk49
.70
2.30
107.
05.
341
051
575
660.
0022
10.
0000
249
.77
96.0
0.4
1.2
47.7
60.
613
TAB
LE
45.
SO
IL S
AM
PL
ES
(co
nt.)
Sam
ple
238 U
235 U
234 U
236 U
235 U
/238 U
Tota
l UD
U o
f to
tal U
DL
(D
U)
Tota
l DU
in s
ampl
eD
L
(μg/
g)±
1σ(μ
g/g)
(ng/
g)±
1σ(n
g/g)
(pg/
g)±
1σ(p
g/g)
(pg/
g)±
1σ(p
g/g)
At r
atio
± 1σ
at r
atio
(μg/
g)Pe
rcen
tage
(mas
s%)
± 1σ
(mas
s%)
(mas
s%)
(mg/
kg)
(mg/
kg)
55

TAB
LE
46.
WA
TE
R S
AM
PLE
S
Sam
ple
238 U
235 U
234 U
236 U
235 U
/238 U
Tota
l UD
U o
f To
tal U
DL
(D
U)
Tota
l DU
in S
ampl
eD
L
(ng/
ml)
± 1σ
(ng/
ml)
(pg/
ml)
± 1σ
(pg/
ml)
(fg/
ml)
± 1σ
(fg/
ml)
(fg/
ml)
± 1σ
(fg/
ml)
at r
atio
± 1σ
at r
atio
(ng/
ml)
perc
enta
ge(m
ass%
)±
1σ(m
ass%
)(m
ass%
)(μ
g/l)
(μg/
l)
As
Sam
awah
SA
MA
-102
-T1.
910.
0913
.70.
612
013
<2.
60.
0072
80.
0000
51.
92<
DL
—2.
6<
DL
0.05
0
SA
MA
-102
-S1.
890.
0913
.50.
612
013
<2.
70.
0072
80.
0000
51.
91<
DL
—2.
6<
DL
0.05
0
SA
MA
-108
-T2.
890.
1320
.71.
018
722
<4.
00.
0072
70.
0000
62.
91<
DL
—3.
3<
DL
0.09
0
SA
MA
-108
-S2.
850.
1320
.31.
018
721
<4.
00.
0072
60.
0000
72.
87<
DL
—4.
2<
DL
0.12
0
SA
MA
-110
-T2.
050.
0914
.50.
712
914
<2.
70.
0072
20.
0000
42.
06<
DL
—2.
4<
DL
0.05
0
SA
MA
-201
2.06
0.09
14.7
0.7
128
15<
2.8
0.00
726
0.00
004
2.08
< D
L—
2.5
< D
L0.
050
SA
MA
-204
1.91
0.09
13.6
0.6
117
13<
2.8
0.00
724
0.00
005
1.92
< D
L—
2.9
< D
L0.
060
SA
MA
-207
1.91
0.09
13.5
0.6
122
13<
2.8
0.00
722
0.00
004
1.92
< D
L—
2.4
< D
L0.
050
SA
MA
-208
1.91
0.09
13.6
0.6
121
14<
2.8
0.00
723
0.00
007
1.92
< D
L—
3.8
< D
L0.
070
SA
MA
-209
1.83
0.08
13.0
0.6
115
14<
2.8
0.00
725
0.00
005
1.84
< D
L—
2.9
< D
L0.
050
Az
Zu
bayr
ZU
BA
-101
126.
005.
7089
7.0
42.0
7742
928
<16
2.0
0.00
723
0.00
004
127.
20<
DL
—2.
3<
DL
2.91
0
Al B
asra
h
BA
SR
A-1
08-w
ater
1.10
0.04
7.4
0.3
754
2.4
0.8
0.00
688
0.00
003
1.10
7.0
0.6
1.7
0.08
0.02
0
BA
SR
A-1
16-w
ater
0.90
0.04
5.6
0.3
513
3.7
0.3
0.00
629
0.00
006
0.90
18.3
1.2
3.5
0.17
0.03
0
BA
SR
A-2
01-w
ater
0.96
0.04
6.8
0.3
693
<0.
70.
0072
20.
0000
60.
97<
DL
—3.
7<
DL
0.04
0
BA
SR
A-3
04-w
ater
0.52
0.02
3.8
0.2
374
<0.
40.
0072
40.
0000
60.
53<
DL
—3.
7<
DL
0.02
0
56

An
Nas
iriy
ah
Nas
ir-w
ater
-01-
023.
320.
0921
.60.
720
214
7.1
1.8
0.00
662
0.00
005
3.34
12.0
0.9
2.6
0.40
0.09
0
Nas
ir-w
ater
-03-
103.
130.
0921
.20.
718
814
3.8
1.4
0.00
690
0.00
004
3.15
6.6
0.8
2.4
0.21
0.07
0
Nas
ir-w
ater
-14-
011.
200.
038.
30.
385
5<
1.5
0.00
707
0.00
004
1.21
3.4
0.7
2.2
0.04
0.03
0
TAB
LE
46.
WA
TE
R S
AM
PLE
S (
cont
.)
Sam
ple
238 U
235 U
234 U
236 U
235 U
/238 U
Tota
l UD
U o
f To
tal U
DL
(D
U)
Tota
l DU
in S
ampl
eD
L
(ng/
ml)
± 1σ
(ng/
ml)
(pg/
ml)
± 1σ
(pg/
ml)
(fg/
ml)
± 1σ
(fg/
ml)
(fg/
ml)
± 1σ
(fg/
ml)
at r
atio
± 1σ
at r
atio
(ng/
ml)
perc
enta
ge(m
ass%
)±
1σ(m
ass%
)(m
ass%
)(μ
g/l)
(μg/
l)
57

TAB
LE
47.
VE
GE
TA
TIO
N S
AM
PLE
S
Sam
ple
238 U
235 U
234 U
236 U
Tota
l U23
5 U/23
8 UD
U o
f To
tal U
DL
(D
U)
Tota
l DU
in S
ampl
eD
L
(ng/
g)±
1σ(n
g/g)
(pg/
g)±
1σ(p
g/g)
(fg/
g)±
1σ(f
g/g)
(fg/
g)±
1σ
(fg/
g)(n
g/g)
at r
atio
± 1σ
at r
atio
perc
enta
ge(m
ass%
)±
1σ(m
ass%
)(m
ass%
)(μ
g/kg
)(μ
g/kg
)
As
Sam
awah
SA
MA
-102
-veg
etat
ion-
A56
.00
5.70
401.
041
.033
6340
0<
45.0
57.0
000.
0071
80.
0000
5<
DL
—2.
9<
DL
1.60
0
SA
MA
-103
-veg
etat
ion-
A72
.00
7.30
473.
049
.040
0750
216
345
.072
.247
0.00
670
0.00
006
10.5
1.2
3.5
7.59
2.50
0
SA
MA
-103
-veg
etat
ion-
B62
.00
6.30
420.
048
.034
5843
399
30.0
62.0
000.
0069
10.
0000
56.
51.
02.
94.
071.
800
SA
MA
-104
-veg
etat
ion-
A9.
000.
9063
.08.
052
772
<8.
09.
070
0.00
711
0.00
005
< D
L—
3.1
< D
L0.
300
SA
MA
-111
-veg
etat
ion-
B18
.00
1.80
125.
013
.010
1212
7<
144.
018
.000
0.00
703
0.00
006
4.3
1.2
3.5
0.77
0.60
0
SA
MA
-112
-veg
etat
ion-
A6.
300.
6045
.05.
037
044
<13
.06.
320
0.00
725
0.00
004
< D
L—
2.1
< D
L0.
100
SA
MA
-112
-veg
etat
ion-
B12
.00
1.20
85.0
9.0
779
88<
36.0
12.0
000.
0072
40.
0000
9<
DL
—5.
2<
DL
0.60
0
SA
MA
-202
-veg
etat
ion
39.0
03.
9028
0.0
29.0
2744
400
<37
15.0
39.0
000.
0072
30.
0000
9<
DL
—5.
1<
DL
2.00
0
SA
MA
-210
-veg
etat
ion
85.0
08.
6060
9.0
62.0
5345
625
<62
.086
.000
0.00
724
0.00
005
< D
L—
2.8
< D
L2.
400
SA
MA
-301
-veg
etat
ion-
A36
6.00
37.0
026
47.0
269.
024
057
3679
<25
7.0
369.
000
0.00
730
0.00
005
< D
L—
2.9
< D
L10
.900
SA
MA
-301
-veg
etat
ion-
B27
3.00
27.6
019
73.0
201.
018
619
2156
<54
6.0
275.
000
0.00
730
0.00
007
< D
L—
4.1
< D
L11
.200
SA
MA
-311
-veg
etat
ion-
A11
7.00
11.8
084
2.0
87.0
7076
864
<84
.011
8.00
00.
0072
70.
0000
8<
DL
—4.
5<
DL
5.30
0
SA
MA
-311
-veg
etat
ion-
B10
0.00
10.1
072
4.0
74.0
5904
686
<72
.010
1.00
00.
0072
80.
0000
5<
DL
—2.
8<
DL
2.80
0
SA
MA
-411
-veg
etat
ion-
A21
.00
2.10
147.
016
.012
6317
1<
237.
021
.000
0.00
719
0.00
004
< D
L—
2.1
< D
L0.
400
SA
MA
-411
-veg
etat
ion-
B20
7.00
20.9
014
69.0
173.
013
027
1717
<15
7.0
208.
000
0.00
722
0.00
008
< D
L—
4.8
< D
L10
.100
Az
Zu
bay
r
ZU
BA
-101
-veg
etat
ion
7.90
0.80
56.0
6.0
494
60<
7.0
7.91
00.
0072
30.
0000
9<
DL
—5.
0<
DL
0.40
0
ZU
BA
-104
-veg
etat
ion-
A16
1.00
16.2
011
38.0
122.
098
1114
19<
121.
016
2.0
0.00
720
0.00
004
< D
L—
2.2
< D
L3.
600
58
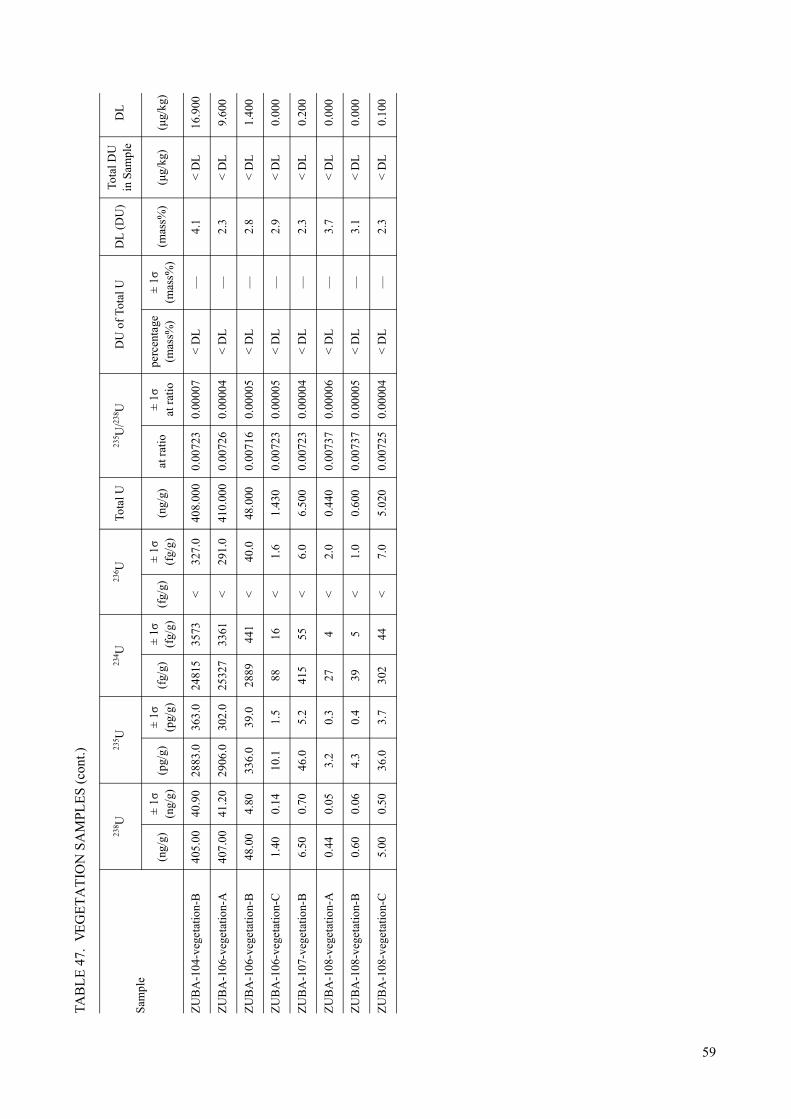
ZU
BA
-104
-veg
etat
ion-
B40
5.00
40.9
028
83.0
363.
024
815
3573
<32
7.0
408.
000
0.00
723
0.00
007
< D
L—
4.1
< D
L16
.900
ZU
BA
-106
-veg
etat
ion-
A40
7.00
41.2
029
06.0
302.
025
327
3361
<29
1.0
410.
000
0.00
726
0.00
004
< D
L—
2.3
< D
L9.
600
ZU
BA
-106
-veg
etat
ion-
B48
.00
4.80
336.
039
.028
8944
1<
40.0
48.0
000.
0071
60.
0000
5<
DL
—2.
8<
DL
1.40
0
ZU
BA
-106
-veg
etat
ion-
C1.
400.
1410
.11.
588
16<
1.6
1.43
00.
0072
30.
0000
5<
DL
—2.
9<
DL
0.00
0
ZU
BA
-107
-veg
etat
ion-
B6.
500.
7046
.05.
241
555
<6.
06.
500
0.00
723
0.00
004
< D
L—
2.3
< D
L0.
200
ZU
BA
-108
-veg
etat
ion-
A0.
440.
053.
20.
327
4<
2.0
0.44
00.
0073
70.
0000
6<
DL
—3.
7<
DL
0.00
0
ZU
BA
-108
-veg
etat
ion-
B0.
600.
064.
30.
439
5<
1.0
0.60
00.
0073
70.
0000
5<
DL
—3.
1<
DL
0.00
0
ZU
BA
-108
-veg
etat
ion-
C5.
000.
5036
.03.
730
244
<7.
05.
020
0.00
725
0.00
004
< D
L—
2.3
< D
L0.
100
TAB
LE
47.
VE
GE
TA
TIO
N S
AM
PLE
S (
cont
.)
Sam
ple
238 U
235 U
234 U
236 U
Tota
l U23
5 U/23
8 UD
U o
f To
tal U
DL
(D
U)
Tota
l DU
in S
ampl
eD
L
(ng/
g)±
1σ(n
g/g)
(pg/
g)±
1σ(p
g/g)
(fg/
g)±
1σ(f
g/g)
(fg/
g)±
1σ
(fg/
g)(n
g/g)
at r
atio
± 1σ
at r
atio
perc
enta
ge(m
ass%
)±
1σ(m
ass%
)(m
ass%
)(μ
g/kg
)(μ
g/kg
)
59

TAB
LE
48.
SU
RF
AC
E S
AM
PL
ES
(SM
EA
RS
) (*
: MA
SS%
)
Sam
ple
238 U
235 U
234 U
236 U
Tota
l U23
5 U/23
8 UD
U o
f To
tal U
(ng)
± 1σ
(ng)
(pg)
± 1σ
(pg)
(fg)
± 1σ
(fg)
(fg)
± 1σ
(fg)
(ng)
at r
atio
± 1σ
at r
atio
mas
s%± 1σ
*
DL
(mas
s%
)
As
Sam
awah
(1s
t M
issi
on)
SA
MA
-101
-sm
ear-
W5.
850.
2041
.02.
035
859
<59
.05.
890
0.00
710
0.00
003
2.8
0.6
1.7
SA
MA
-101
-sm
ear-
S7.
540.
5052
.04.
044
646
<41
.07.
590
0.00
704
0.00
004
4.0
0.7
2.2
SA
MA
-105
-sm
ear-
W7.
830.
3055
.03.
047
436
<24
.07.
890
0.00
706
0.00
004
3.7
0.7
2.1
SA
MA
-105
-sm
ear-
S6.
100.
5040
.03.
034
333
254.
06.
140
0.00
663
0.00
003
11.8
0.6
1.7
SA
MA
-106
-sm
ear-
W3.
470.
2023
.01.
017
819
<22
.03.
490
0.00
683
0.00
006
7.9
1.2
3.5
SA
MA
-106
-sm
ear-
S6.
490.
3045
.02.
040
840
<18
.06.
540
0.00
706
0.00
003
3.5
0.5
1.6
SA
MA
-107
-sm
ear-
W3.
710.
2027
.01.
022
215
<5.
03.
740
0.00
724
0.00
003
< D
L—
1.9
SA
MA
-107
-sm
ear-
S22
.01
0.80
156.
06.
012
7712
7<
440.
022
.170
0.00
719
0.00
003
< D
L—
2.0
SA
MA
-108
-sm
ear-
W15
.95
0.50
115.
04.
092
819
7<
158.
016
.070
0.00
729
0.00
004
< D
L—
2.0
SA
MA
-108
-sm
ear-
S6.
370.
2045
.02.
040
118
<8.
06.
420
0.00
712
0.00
007
< D
L—
4.0
SA
MA
-109
-sm
ear-
W6.
950.
3049
.02.
041
635
<21
.07.
000
0.00
715
0.00
002
1.8
0.4
1.3
SA
MA
-109
-sm
ear-
S7.
350.
3050
.02.
044
331
2310
.07.
400
0.00
690
0.00
005
6.7
0.9
2.7
SA
MA
-110
-sm
ear-
W7.
730.
4055
.04.
045
648
<9.
07.
790
0.00
718
0.00
007
< D
L—
3.9
SA
MA
-110
-sm
ear-
S7.
160.
3051
.02.
047
074
<20
.07.
210
0.00
721
0.00
003
< D
L—
1.6
SA
MA
-113
-sm
ear-
W12
.86
0.40
90.0
5.0
769
62<
13.0
12.9
500.
0070
60.
0000
43.
50.
72.
1
SA
MA
-113
-sm
ear-
S7.
240.
3051
.02.
047
438
<8.
07.
290
0.00
718
0.00
004
< D
L—
2.0
SA
MA
-201
-sm
ear-
W4.
220.
2030
.02.
024
018
<19
.04.
250
0.00
717
0.00
005
< D
L—
2.9
SA
MA
-201
-sm
ear-
S7.
500.
3054
.03.
045
934
<8.
07.
550
0.00
725
0.00
005
< D
L—
2.9
SA
MA
-202
-sm
ear-
W8.
750.
4062
.03.
049
030
<9.
08.
810
0.00
714
0.00
003
2.2
0.5
1.6
60

SA
MA
-203
-sm
ear-
W9.
820.
5069
.04.
065
715
2<
1669
.09.
890
0.00
713
0.00
020
< D
L—
11.2
SA
MA
-203
-sm
ear-
S10
.60
0.40
75.0
3.0
713
106
<23
3.0
10.6
800.
0017
30.
0001
3<
DL
—7.
7
SA
MA
-204
-sm
ear-
W6.
490.
3046
.02.
040
682
<22
.06.
540
0.00
714
0.00
006
< D
L—
3.5
SA
MA
-205
-sm
ear-
W5.
480.
3038
.02.
036
351
<7.
05.
520
0.00
710
0.00
004
2.9
0.8
2.5
SA
MA
-205
-sm
ear-
S4.
680.
2033
.02.
030
952
<47
.04.
710
0.00
712
0.00
010
< D
L—
5.6
SA
MA
-206
-sm
ear-
W2.
740.
2019
.01.
015
014
<10
.02.
760
0.00
706
0.00
003
3.5
0.6
1.9
SA
MA
-206
-sm
ear-
S4.
360.
3031
.02.
028
422
<16
.04.
390
0.00
724
0.00
007
< D
L—
3.8
SA
MA
-207
-sm
ear-
W3.
470.
2025
.01.
022
021
<5.
03.
490
0.00
717
0.00
004
< D
L—
2.3
SA
MA
-207
-sm
ear-
S20
.39
0.60
145.
09.
013
5111
9<
408.
020
.540
0.00
722
0.00
008
< D
L—
4.8
SA
MA
-209
-sm
ear-
W6.
270.
2044
.02.
038
131
<31
.06.
310
0.00
710
0.00
004
2.8
0.8
2.4
SA
MA
-209
-sm
ear-
S4.
930.
3034
.02.
030
447
<21
.04.
960
0.00
693
0.00
003
6.1
0.6
1.8
SA
MA
-301
-sm
ear-
W18
.70
0.60
133.
06.
012
2898
<21
5.0
18.8
300.
0072
10.
0000
6<
DL
—3.
3
SA
MA
-301
-sm
ear-
S17
.41
0.60
125.
05.
010
2566
<50
.017
.540
0.00
724
0.00
003
< D
L—
2.0
SA
MA
-302
-sm
ear-
W12
.13
0.40
87.0
4.0
756
153
<24
3.0
12.2
200.
0072
20.
0001
2<
DL
—6.
7
SA
MA
-302
-sm
ear-
S14
.51
0.50
105.
04.
090
677
<17
7.0
14.6
200.
0072
90.
0000
7<
DL
—4.
2
SA
MA
-305
-sm
ear-
W6.
420.
2046
.02.
041
548
<25
.06.
470
0.00
722
0.00
009
< D
L—
5.0
SA
MA
-305
-sm
ear-
S5.
520.
3039
.02.
038
828
<6.
05.
560
0.00
718
0.00
007
< D
L—
3.8
SA
MA
-306
-sm
ear-
W-A
7.77
0.30
55.0
2.0
466
25<
8.0
7.83
00.
0071
40.
0000
32.
10.
61.
9
SA
MA
-306
-sm
ear-
W-B
7.69
0.30
54.0
3.0
432
41<
9.0
7.74
00.
0070
80.
0000
33.
20.
61.
8
SA
MA
-310
-sm
ear-
W-A
19.5
00.
7014
1.0
8.0
1206
131
<39
0.0
19.6
400.
0073
10.
0001
6<
DL
—9.
0
TAB
LE
48.
SU
RF
AC
E S
AM
PL
ES
(SM
EA
RS
) (*
: MA
SS%
) (c
ont.)
Sam
ple
238 U
235 U
234 U
236 U
Tota
l U23
5 U/23
8 UD
U o
f To
tal U
(ng)
± 1σ
(ng)
(pg)
± 1σ
(pg)
(fg)
± 1σ
(fg)
(fg)
± 1σ
(fg)
(ng)
at r
atio
± 1σ
at r
atio
mas
s%± 1σ
*
DL
(mas
s%
)
61

SA
MA
-310
-sm
ear-
W-B
49.4
21.
5035
4.0
35.0
2914
375
<54
.049
.780
0.00
726
0.00
005
< D
L—
2.8
SA
MA
-310
-sm
ear-
S-A
13.5
50.
4097
.04.
082
678
<27
1.0
13.6
500.
0072
70.
0001
1<
DL
—6.
4
SA
MA
-310
-sm
ear-
S-B
84.5
92.
6060
6.0
26.0
4862
217
<70
.085
.200
0.00
724
0.00
005
< D
L—
3.0
SA
MA
-401
-sm
ear-
W-A
17.5
10.
6012
6.0
5.0
975
67<
175.
017
.640
0.00
728
0.00
007
< D
L—
4.1
SA
MA
-401
-sm
ear-
W-B
10.6
50.
6076
.05.
073
610
0<
224.
010
.730
0.00
719
0.00
012
< D
L—
7.0
SA
MA
-402
-sm
ear-
W18
.47
0.60
131.
05.
013
0821
3<
369.
018
.600
0.00
720
0.00
004
< D
L—
2.3
SA
MA
-402
-sm
ear-
S5.
800.
2041
.02.
037
319
<58
.05.
840
0.00
716
0.00
003
< D
L—
1.8
SA
MA
-403
-sm
ear-
W25
.43
0.80
182.
08.
016
1415
8<
763.
025
.610
0.00
726
0.00
011
< D
L—
6.2
SA
MA
-403
-sm
ear-
S15
.93
0.50
113.
04.
096
215
3<
150.
016
.040
0.00
719
0.00
009
< D
L—
5.3
SA
MA
-404
-sm
ear-
W-A
6.71
0.30
48.0
2.0
365
26<
32.0
6.76
00.
0072
60.
0000
4<
DL
—2.
0
SA
MA
-404
-sm
ear-
W-B
34.6
31.
0024
8.0
10.0
1997
132
<37
.034
.880
0.00
725
0.00
005
< D
L—
2.6
SA
MA
-404
-sm
ear-
S15
.78
0.60
113.
05.
086
711
9<
158.
015
.890
0.00
728
0.00
002
< D
L—
1.2
SA
MA
-409
-sm
ear-
W-A
29.4
70.
9018
4.0
8.0
1552
134
503
155.
029
.660
0.00
631
0.00
012
18.0
2.3
7.0
SA
MA
-409
-sm
ear-
W-B
9.96
0.40
71.0
4.0
660
101
<29
9.0
10.0
300.
0072
00.
0001
5<
DL
—8.
3
SA
MA
-409
-sm
ear-
S-A
10.6
80.
4076
.04.
064
742
<21
.010
.750
0.00
724
0.00
003
< D
L—
1.5
SA
MA
-409
-sm
ear-
S-B
4.21
0.20
30.0
2.0
256
32<
6.0
4.24
00.
0071
40.
0000
4<
DL
—2.
2
SA
MA
-410
-sm
ear-
S24
.84
0.90
177.
08.
015
0916
0<
497.
025
.020
0.00
721
0.00
005
< D
L—
2.7
SA
MA
-410
-sm
ear-
T4.
040.
2026
.01.
021
021
<14
.04.
070
0.00
651
0.00
005
14.0
0.9
2.8
TAB
LE
48.
SU
RF
AC
E S
AM
PL
ES
(SM
EA
RS
) (*
: MA
SS%
) (c
ont.)
Sam
ple
238 U
235 U
234 U
236 U
Tota
l U23
5 U/23
8 UD
U o
f To
tal U
(ng)
± 1σ
(ng)
(pg)
± 1σ
(pg)
(fg)
± 1σ
(fg)
(fg)
± 1σ
(fg)
(ng)
at r
atio
± 1σ
at r
atio
mas
s%± 1σ
*
DL
(mas
s%
)
62

As
Sam
awah
(2n
d M
issi
on)
SA
MA
-102
-sm
ear-
W (
2nd
Mis
sion
)7.
130.
3051
.02.
038
828
<13
.07.
180
0.00
722
0.00
003
< D
L—
2.0
SA
MA
-102
-sm
ear-
S (
2nd
Mis
sion
)5.
620.
3040
.02.
032
632
<12
.05.
660
0.00
722
0.00
005
< D
L—
3.1
SA
MA
-103
-sm
ear-
W (
2nd
Mis
sion
)11
.19
0.40
78.0
3.0
688
50<
20.0
11.2
700.
0070
90.
0000
43.
10.
72.
2
SA
MA
-103
-sm
ear-
S (
2nd
Mis
sion
)5.
330.
3035
.02.
030
324
266.
05.
360
0.00
667
0.00
006
11.1
1.1
3.2
SA
MA
-104
-sm
ear-
W (
2nd
Mis
sion
)6.
870.
3049
.02.
040
343
<34
.06.
920
0.00
722
0.00
004
< D
L—
2.5
SA
MA
-104
-sm
ear-
S (
2nd
Mis
sion
)11
.28
0.50
80.0
4.0
751
103
<56
.011
.360
0.00
720
0.00
005
< D
L—
2.9
SA
MA
-105
-sm
ear-
W (
2nd
Mis
sion
)8.
820.
3062
.03.
054
131
<35
.08.
880
0.00
718
0.00
002
1.3
0.4
1.1
SA
MA
-105
-sm
ear-
S (
2nd
Mis
sion
)8.
870.
5063
.04.
052
637
<14
.08.
940
0.00
718
0.00
009
< D
L—
5.1
SA
MA
-106
-sm
ear-
W (
2nd
Mis
sion
)16
.62
0.70
119.
05.
097
075
<21
.016
.740
0.00
725
0.00
004
< D
L—
2.0
SA
MA
-106
-sm
ear-
S (
2nd
Mis
sion
)14
.91
0.60
105.
05.
086
970
<21
.015
.020
0.00
718
0.00
006
< D
L—
3.3
SA
MA
-112
-sm
ear-
W (
2nd
Mis
sion
)8.
140.
4058
.03.
050
288
<33
.08.
200
0.00
721
0.00
003
< D
L—
1.9
SA
MA
-112
-sm
ear-
S (
2nd
Mis
sion
)10
.73
0.50
77.0
5.0
659
47<
54.0
10.8
000.
0072
70.
0000
5<
DL
—2.
8
SA
MA
-113
-sm
ear-
W (
2nd
Mis
sion
)20
.20
0.70
143.
06.
011
8975
<21
.020
.340
0.00
719
0.00
004
< D
L—
2.2
SA
MA
-113
-sm
ear-
S (
2nd
Mis
sion
)12
.63
0.50
89.0
4.0
783
89<
63.0
12.7
200.
0071
70.
0000
6<
DL
—3.
2
SA
MA
-208
-sm
ear-
W (
2nd
Mis
sion
)17
.46
0.70
125.
05.
011
0973
<20
.017
.590
0.00
727
0.00
004
< D
L—
2.1
SA
MA
-208
-sm
ear-
S (
2nd
Mis
sion
)19
.07
0.60
137.
06.
011
9778
<22
.019
.210
0.00
728
0.00
005
< D
L—
2.8
SA
MA
-209
-sm
ear-
W (
2nd
Mis
sion
)14
.90
0.60
105.
07.
091
272
<22
.015
.010
0.00
716
0.00
008
< D
L—
4.4
SA
MA
-209
-sm
ear-
S (
2nd M
issi
on)
6.35
0.30
43.0
2.0
381
39<
32.0
6.39
00.
0069
70.
0000
35.
30.
51.
4
SA
MA
-210
-sm
ear-
W (
2nd
Mis
sion
)5.
530.
2039
.02.
035
520
<39
.05.
570
0.00
727
0.00
004
< D
L—
2.4
TAB
LE
48.
SU
RF
AC
E S
AM
PL
ES
(SM
EA
RS
) (*
: MA
SS%
) (c
ont.)
Sam
ple
238 U
235 U
234 U
236 U
Tota
l U23
5 U/23
8 UD
U o
f To
tal U
(ng)
± 1σ
(ng)
(pg)
± 1σ
(pg)
(fg)
± 1σ
(fg)
(fg)
± 1σ
(fg)
(ng)
at r
atio
± 1σ
at r
atio
mas
s%± 1σ
*
DL
(mas
s%
)
63

SA
MA
-210
-sm
ear-
S (
2nd
Mis
sion
)8.
470.
3060
.02.
047
758
<42
.08.
530
0.00
719
0.00
003
< D
L—
1.5
SA
MA
-301
-sm
ear-
W (
2nd
Mis
sion
)12
.12
0.40
87.0
3.0
736
73<
36.0
12.2
100.
0072
70.
0000
4<
DL
—2.
2
SA
MA
-301
-sm
ear-
S (
2nd
Mis
sion
)30
.36
1.00
215.
012
.018
2915
0<
29.0
30.5
800.
0072
20.
0000
2<
DL
—1.
4
SA
MA
-307
-sm
ear-
W (
2nd
Mis
sion
)14
.75
0.50
106.
04.
097
964
<44
.014
.850
0.00
729
0.00
006
< D
L—
3.2
SA
MA
-307
-sm
ear-
S (
2nd
Mis
sion
)9.
270.
4065
.03.
053
433
<13
.09.
330
0.00
717
0.00
003
< D
L—
1.5
SA
MA
-309
-sm
ear-
W (
2nd
Mis
sion
)11
.47
0.40
82.0
3.0
702
60<
46.0
11.5
500.
0072
90.
0000
4<
DL
—2.
5
SA
MA
-309
-sm
ear-
S (
2nd
Mis
sion
)20
.45
0.80
147.
06.
012
8794
<25
.020
.600
0.00
730
0.00
007
< D
L—
4.0
SA
MA
-311
-sm
ear-
W (
2nd
Mis
sion
)5.
950.
3042
.02.
034
524
<36
.05.
990
0.00
720
0.00
005
< D
L—
3.0
SA
MA
-311
-sm
ear-
S (
2nd
Mis
sion
)19
.14
0.70
136.
013
.011
6314
6<
24.0
19.2
800.
0072
20.
0000
5<
DL
—3.
1
SA
MA
-410
-sm
ear-
W (
2nd
Mis
sion
)21
.44
0.70
153.
06.
013
1410
9<
43.0
21.5
900.
0072
30.
0000
4<
DL
—2.
4
SA
MA
-410
-sm
ear-
S (
2nd
Mis
sion
)5.
740.
3040
.02.
033
632
<29
.05.
780
0.00
718
0.00
007
< D
L—
4.1
SA
MA
-411
-sm
ear-
W (
2nd
Mis
sion
)50
.27
1.80
359.
015
.031
0419
4<
151.
050
.630
0.00
727
0.00
003
< D
L—
1.5
SA
MA
-411
-sm
ear-
S (
2nd
Mis
sion
)8.
040.
4057
.03.
050
835
<13
.08.
100
0.00
722
0.00
003
< D
L—
1.7
SA
MA
-int
act t
ank-
smea
r-02
-S (
2nd
Mis
sion
)13
.17
0.50
94.0
4.0
841
59<
20.0
13.2
600.
0072
20.
0000
8<
DL
—4.
5
SA
MA
-int
act t
ank-
smea
r-03
-S (
2nd
Mis
sion
)7.
150.
3049
.02.
041
722
276.
07.
200
0.00
698
0.00
006
5.2
1.2
3.7
SA
MA
-int
act t
ank-
smea
r-05
-S (
2nd
Mis
sion
)10
.28
0.40
73.0
4.0
634
49<
31.0
10.3
500.
0072
00.
0000
2<
DL
—1.
2
SA
MA
-int
act t
ank-
smea
r-05
-W (
2nd
Mis
sion
)11
.05
0.40
77.0
4.0
651
44<
19.0
11.1
300.
0071
20.
0000
4<
DL
—2.
6
SA
MA
-sm
ear-
14-W
(2n
d M
issi
on)
9.33
0.30
66.0
3.0
551
29<
13.0
9.40
00.
0072
10.
0001
1<
DL
—6.
4
SA
MA
-sm
ear-
14-S
(2n
d M
issi
on)
17.3
90.
7012
3.0
7.0
1067
77<
35.0
17.5
200.
0071
90.
0000
7<
DL
—4.
0
SA
MA
-bom
bard
ed ta
nk-s
mea
r-19
-S (
2nd
Mis
sion
)14
.97
0.60
106.
05.
092
776
<45
.015
.080
0.00
722
0.00
005
< D
L—
2.7
TAB
LE
48.
SU
RF
AC
E S
AM
PL
ES
(SM
EA
RS
) (*
: MA
SS%
) (c
ont.)
Sam
ple
238 U
235 U
234 U
236 U
Tota
l U23
5 U/23
8 UD
U o
f To
tal U
(ng)
± 1σ
(ng)
(pg)
± 1σ
(pg)
(fg)
± 1σ
(fg)
(fg)
± 1σ
(fg)
(ng)
at r
atio
± 1σ
at r
atio
mas
s%± 1σ
*
DL
(mas
s%
)
64

SA
MA
-can
non
1-sm
ear-
a-S
(2n
d M
issi
on)
203.
036.
8042
0.0
31.0
1676
195
5352
399.
020
3.50
00.
0021
10.
0000
198
.00.
10.
4
SA
MA
-can
non
1-sm
ear-
b-S
(2nd
Mis
sion
)50
622.
0016
73.3
098
842.
040
22.0
3332
2130
789
1165
791
7367
5.0
5072
1.00
00.
0019
90.
0000
110
0.2
0.2
0.7
SA
MA
-can
non
1-sm
ear-
c-S
(2n
d M
issi
on)
59.2
92.
1014
1.0
6.0
680
7414
5412
3.0
59.4
300.
0024
20.
0000
192
.00.
20.
6
SA
MA
-can
non
2-sm
ear-
a-S
(2n
d M
issi
on)
244.
688.
3051
4.0
22.0
2263
149
6686
602.
024
5.20
00.
0021
40.
0000
297
.40.
51.
4
SA
MA
-can
non
2-sm
ear-
b-S
(2nd
Mis
sion
)43
.87
2.30
111.
06.
057
852
948
74.0
43.9
800.
0025
90.
0000
188
.80.
30.
8
SA
MA
-can
non
2-sm
ear-
c-S
(2n
d M
issi
on)
71.8
42.
7016
7.0
12.0
748
7015
8524
3.0
72.0
100.
0023
70.
0000
193
.00.
30.
8
SA
MA
-can
non
2-sm
ear-
d-S
(2nd
Mis
sion
)30
17.3
610
1.50
5890
.029
9.0
2157
513
2068
259
3260
.030
23.3
000.
0019
90.
0000
210
0.2
0.3
0.9
SA
MA
-sam
ple-
a-sm
ear-
T (
2nd
Mis
sion
)39
70.6
013
2.00
7854
.029
5.0
3050
533
6593
873
4385
.039
78.5
000.
0020
20.
0000
299
.70.
41.
2
SA
MA
-sam
ple-
b-sm
ear-
T (
2nd
Mis
sion
)47
26.7
015
9.20
9332
.045
4.0
3256
016
9211
5071
8603
.047
36.1
000.
0020
10.
0000
199
.80.
30.
8
SA
MA
-sam
ple-
c-sm
ear-
T (
2nd
Mis
sion
)97
6.45
33.5
019
49.0
87.0
6874
773
2240
517
50.0
978.
400
0.00
203
0.00
001
99.4
0.2
0.6
Az
Zu
bayr
(1s
t M
issi
on)
ZU
BA
-101
-sm
ear-
A (
ZU
BA
-101
-sm
ear-
W-A
)2.
050.
2014
.01.
019
249
<17
.02.
060
0.00
710
0.00
004
2.9
0.8
2.3
ZU
BA
-101
-sm
ear-
B (
ZU
BA
-101
-sm
ear-
W-B
)2.
770.
3020
.02.
017
328
<43
.02.
790
0.00
712
0.00
005
< D
L—
2.7
ZU
BA
-101
-sm
ear-
C (
ZU
BA
-101
-sm
ear-
S-A
)2.
660.
2019
.02.
016
818
<5.
02.
680
0.00
711
0.00
004
2.6
0.8
2.3
ZU
BA
-101
-sm
ear-
D (
ZU
BA
-101
-sm
ear-
S-B
)1.
590.
1011
.01.
013
270
<16
.01.
600
0.00
718
0.00
005
< D
L—
3.0
ZU
BA
-103
-sm
ear-
S2.
840.
2020
.02.
026
745
<5.
02.
860
0.00
698
0.00
003
5.2
0.6
1.8
ZU
BA
-105
-sm
ear-
S2.
090.
2014
.01.
014
319
<11
.02.
100
0.00
675
0.00
003
9.5
0.6
1.8
ZU
BA
-112
-sm
ear-
A18
.66
1.30
118.
09.
097
080
100
48.0
18.7
800.
0064
20.
0000
315
.80.
61.
7
ZU
BA
-112
-sm
ear-
B2.
760.
2019
.02.
016
320
<72
.02.
780
0.00
697
0.00
002
5.4
0.4
1.3
ZU
BA
-113
-sm
ear-
W2.
740.
2019
.02.
016
835
<18
.02.
760
0.00
687
0.00
007
7.2
1.4
4.1
TAB
LE
48.
SU
RF
AC
E S
AM
PL
ES
(SM
EA
RS
) (*
: MA
SS%
) (c
ont.)
Sam
ple
238 U
235 U
234 U
236 U
Tota
l U23
5 U/23
8 UD
U o
f To
tal U
(ng)
± 1σ
(ng)
(pg)
± 1σ
(pg)
(fg)
± 1σ
(fg)
(fg)
± 1σ
(fg)
(ng)
at r
atio
± 1σ
at r
atio
mas
s%± 1σ
*
DL
(mas
s%
)
65
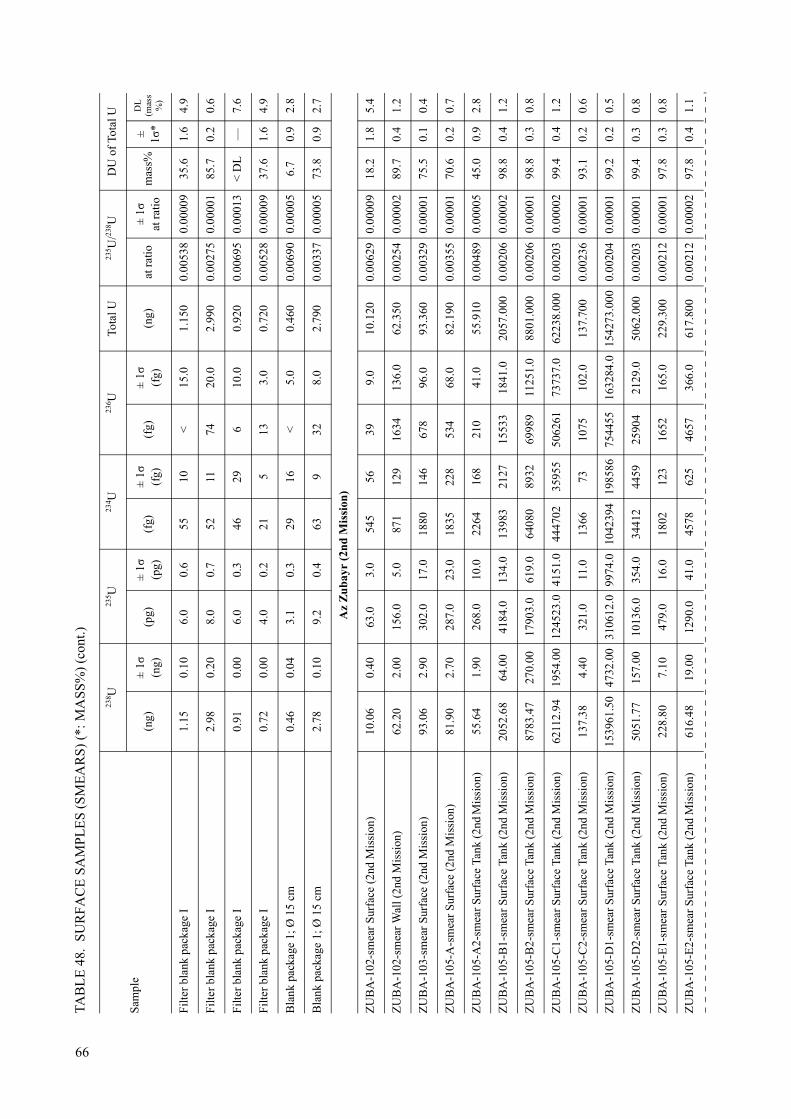
Filt
er b
lank
pac
kage
I1.
150.
106.
00.
655
10<
15.0
1.15
00.
0053
80.
0000
935
.61.
64.
9
Filt
er b
lank
pac
kage
I2.
980.
208.
00.
752
1174
20.0
2.99
00.
0027
50.
0000
185
.70.
20.
6
Filt
er b
lank
pac
kage
I0.
910.
006.
00.
346
296
10.0
0.92
00.
0069
50.
0001
3<
DL
—7.
6
Filt
er b
lank
pac
kage
I0.
720.
004.
00.
221
513
3.0
0.72
00.
0052
80.
0000
937
.61.
64.
9
Bla
nk p
acka
ge 1
; Ø 1
5 cm
0.46
0.04
3.1
0.3
2916
<5.
00.
460
0.00
690
0.00
005
6.7
0.9
2.8
Bla
nk p
acka
ge 1
; Ø 1
5 cm
2.78
0.10
9.2
0.4
639
328.
02.
790
0.00
337
0.00
005
73.8
0.9
2.7
Az
Zu
bay
r (2
nd
Mis
sion
)
ZU
BA
-102
-sm
ear
Sur
face
(2n
d M
issi
on)
10.0
60.
4063
.03.
054
556
399.
010
.120
0.00
629
0.00
009
18.2
1.8
5.4
ZU
BA
-102
-sm
ear
Wal
l (2n
d M
issi
on)
62.2
02.
0015
6.0
5.0
871
129
1634
136.
062
.350
0.00
254
0.00
002
89.7
0.4
1.2
ZU
BA
-103
-sm
ear
Sur
face
(2n
d M
issi
on)
93.0
62.
9030
2.0
17.0
1880
146
678
96.0
93.3
600.
0032
90.
0000
175
.50.
10.
4
ZU
BA
-105
-A-s
mea
r S
urfa
ce (
2nd
Mis
sion
)81
.90
2.70
287.
023
.018
3522
853
468
.082
.190
0.00
355
0.00
001
70.6
0.2
0.7
ZU
BA
-105
-A2-
smea
r S
urfa
ce T
ank
(2nd
Mis
sion
)55
.64
1.90
268.
010
.022
6416
821
041
.055
.910
0.00
489
0.00
005
45.0
0.9
2.8
ZU
BA
-105
-B1-
smea
r S
urfa
ce T
ank
(2nd
Mis
sion
)20
52.6
864
.00
4184
.013
4.0
1398
321
2715
533
1841
.020
57.0
000.
0020
60.
0000
298
.80.
41.
2
ZU
BA
-105
-B2-
smea
r S
urfa
ce T
ank
(2nd
Mis
sion
)87
83.4
727
0.00
1790
3.0
619.
064
080
8932
6998
911
251.
088
01.0
000.
0020
60.
0000
198
.80.
30.
8
ZU
BA
-105
-C1-
smea
r S
urfa
ce T
ank
(2nd
Mis
sion
)62
112.
9419
54.0
012
4523
.041
51.0
4447
0235
955
5062
6173
737.
062
238.
000
0.00
203
0.00
002
99.4
0.4
1.2
ZU
BA
-105
-C2-
smea
r S
urfa
ce T
ank
(2nd
Mis
sion
)13
7.38
4.40
321.
011
.013
6673
1075
102.
013
7.70
00.
0023
60.
0000
193
.10.
20.
6
ZU
BA
-105
-D1-
smea
r S
urfa
ce T
ank
(2nd
Mis
sion
)15
3961
.50
4732
.00
3106
12.0
9974
.010
4239
419
8586
7544
5516
3284
.015
4273
.000
0.00
204
0.00
001
99.2
0.2
0.5
ZU
BA
-105
-D2-
smea
r S
urfa
ce T
ank
(2nd
Mis
sion
)50
51.7
715
7.00
1013
6.0
354.
034
412
4459
2590
421
29.0
5062
.000
0.00
203
0.00
001
99.4
0.3
0.8
ZU
BA
-105
-E1-
smea
r S
urfa
ce T
ank
(2nd
Mis
sion
)22
8.80
7.10
479.
016
.018
0212
316
5216
5.0
229.
300
0.00
212
0.00
001
97.8
0.3
0.8
ZU
BA
-105
-E2-
smea
r S
urfa
ce T
ank
(2nd
Mis
sion
)61
6.48
19.0
012
90.0
41.0
4578
625
4657
366.
061
7.80
00.
0021
20.
0000
297
.80.
41.
1
TAB
LE
48.
SU
RF
AC
E S
AM
PL
ES
(SM
EA
RS
) (*
: MA
SS%
) (c
ont.)
Sam
ple
238 U
235 U
234 U
236 U
Tota
l U23
5 U/23
8 UD
U o
f To
tal U
(ng)
± 1σ
(ng)
(pg)
± 1σ
(pg)
(fg)
± 1σ
(fg)
(fg)
± 1σ
(fg)
(ng)
at r
atio
± 1σ
at r
atio
mas
s%± 1σ
*
DL
(mas
s%
)
66

ZU
BA
-105
-F1-
smea
r S
urfa
ce T
ank
(2nd
Mis
sion
)12
691.
9939
2.00
2559
1.0
852.
080
871
6424
2783
8739
301.
012
718.
000
0.00
204
0.00
002
99.2
0.4
1.3
ZU
BA
-105
-F2-
smea
r S
urfa
ce T
ank
(2nd
Mis
sion
)19
235.
5059
0.00
3875
0.0
1272
.014
6406
2142
943
3724
3146
2.0
1927
4.00
00.
0020
40.
0000
199
.30.
20.
6
ZU
BA
-105
-G1-
smea
r S
urfa
ce T
ank
(2nd
Mis
sion
)16
1.83
5.10
374.
013
.016
3912
320
1517
6.0
162.
200
0.00
234
0.00
001
93.5
0.1
0.4
ZU
BA
-105
-G2-
smea
r S
urfa
ce T
ank
(2nd
Mis
sion
)14
9.44
4.90
403.
017
.020
0125
218
3411
8.0
149.
800
0.00
273
0.00
001
86.1
0.1
0.4
ZU
BA
-105
-H1-
smea
r S
urfa
ce T
ank
(2nd
Mis
sion
)57
680.
9617
91.0
011
6061
.040
44.0
4122
3656
187
2321
8733
360.
057
797.
000
0.00
204
0.00
001
99.3
0.2
0.5
ZU
BA
-105
-H2-
smea
r S
urfa
ce T
ank
(2nd
Mis
sion
)80
5.86
24.8
017
04.0
63.0
6013
435
5607
1060
.080
7.60
00.
0021
40.
0000
297
.30.
41.
1
ZU
BA
-111
-A1-
smea
r Su
rfac
e Ta
nk (
2nd
Mis
sion
)81
.91
2.60
337.
011
.024
6813
342
373
.082
.250
0.00
416
0.00
001
58.9
0.2
0.7
Al B
asra
h
Bas
ra-1
09-s
mea
r-W
16.8
50.
6089
.03.
072
072
192
22.0
16.9
400.
0053
80.
0000
235
.70.
31.
0
Bas
ra-1
09-s
mea
r-S
18.1
30.
6011
8.0
4.0
1035
8779
12.0
18.2
500.
0065
90.
0000
312
.50.
72.
0
Bas
ra-1
11-s
mea
r-W
54.8
41.
8016
7.0
6.0
1046
107
1165
92.0
55.0
100.
0030
90.
0000
279
.30.
41.
2
Bas
ra-1
11-s
mea
r-S
69.7
62.
2021
5.0
7.0
1427
9915
2063
.069
.980
0.00
311
0.00
004
78.8
0.8
2.3
Bas
ra-1
12-s
mea
r-W
65.9
62.
1016
0.0
7.0
944
5117
0210
6.0
66.1
200.
0024
50.
0000
191
.50.
20.
6
Bas
ra-1
12-s
mea
r-S
67.9
62.
1019
1.0
6.0
1228
127
1622
80.0
68.1
500.
0028
40.
0000
283
.90.
31.
0
Bas
ra-1
13-s
mea
r-W
73.5
42.
3026
8.0
10.0
1792
113
1513
139.
073
.810
0.00
368
0.00
002
68.0
0.3
1.0
Bas
ra-1
13-s
mea
r-S
61.4
82.
0016
0.0
6.0
948
7815
5911
7.0
61.6
400.
0026
40.
0000
187
.80.
20.
5
Bas
ra-1
14-s
mea
r-W
151.
764.
8039
7.0
14.0
2384
173
3714
232.
015
2.20
00.
0026
40.
0000
287
.70.
30.
9
Bas
ra-1
14-s
mea
r-S
133.
534.
2025
5.0
10.0
1099
101
3727
412.
013
3.80
00.
0019
30.
0000
110
1.3
0.2
0.6
Bas
ra-1
15-A
-sm
ear-
S84
969.
9025
96.0
013
9411
.044
75.0
4803
0610
0366
2395
464
1528
12.0
8511
0.00
00.
0016
60.
0000
110
6.5
0.1
0.3
Bas
ra-1
15-B
-sm
ear-
S69
30.2
021
2.00
1157
3.0
364.
039
257
5845
2005
3283
24.0
6942
.000
0.00
169
0.00
001
105.
90.
10.
3
TAB
LE
48.
SU
RF
AC
E S
AM
PL
ES
(SM
EA
RS
) (*
: MA
SS%
) (c
ont.)
Sam
ple
238 U
235 U
234 U
236 U
Tota
l U23
5 U/23
8 UD
U o
f To
tal U
(ng)
± 1σ
(ng)
(pg)
± 1σ
(pg)
(fg)
± 1σ
(fg)
(fg)
± 1σ
(fg)
(ng)
at r
atio
± 1σ
at r
atio
mas
s%± 1σ
*
DL
(mas
s%
)
67

Bas
ra-1
15-C
-sm
ear-
S26
79.6
083
.00
4571
.015
4.0
1686
015
2977
963
6974
.026
84.0
000.
0017
30.
0000
110
5.2
0.2
0.6
Bas
ra-1
15-D
-sm
ear-
S13
508.
2041
7.00
2232
0.0
1184
.077
537
6531
3972
3020
766.
013
531.
000
0.00
167
0.00
001
106.
20.
20.
6
Bas
ra-1
18-s
mea
r-W
8.66
0.40
36.0
2.0
259
3813
827
.08.
700
0.00
423
0.00
002
57.6
0.4
1.2
Bas
ra-1
18-s
mea
r-S
18.5
50.
8010
9.0
5.0
895
9817
127
.018
.660
0.00
599
0.00
003
24.1
0.6
1.7
Bas
ra-2
04-s
mea
r-S
18.3
20.
7010
5.0
4.0
887
6615
815
.018
.430
0.00
583
0.00
002
27.0
0.5
1.4
Bas
ra-2
07-s
mea
r-S
11.2
60.
4060
.02.
049
952
124
14.0
11.3
200.
0054
30.
0000
334
.60.
61.
9
Bas
ra-2
07-s
mea
r-W
16.9
50.
6095
.04.
079
210
116
220
.017
.050
0.00
567
0.00
003
30.1
0.5
1.6
Bas
ra-2
11-s
mea
r-S
48.7
01.
6026
0.0
9.0
2340
203
447
49.0
48.9
600.
0054
20.
0000
334
.90.
61.
9
Bas
ra-2
11-s
mea
r-W
19.2
10.
6078
.03.
060
148
340
31.0
19.2
900.
0041
00.
0000
260
.00.
41.
2
Bas
ra-3
05-s
mea
r-S
21.0
20.
7010
5.0
5.0
920
8827
144
.021
.130
0.00
507
0.00
005
41.4
1.0
3.1
Bas
ra-3
06-s
mea
r-S
18.0
10.
6080
.03.
062
361
280
36.0
18.0
900.
0044
90.
0000
252
.60.
41.
2
Bas
ra-4
03-s
mea
r-S
36.0
81.
4020
6.0
9.0
1719
186
349
51.0
36.2
900.
0057
80.
0000
228
.00.
41.
1
Bas
ra-4
04-s
mea
r-S
45.1
41.
4024
4.0
8.0
1954
148
440
48.0
45.3
900.
0054
90.
0000
333
.60.
61.
9
Bas
ra-4
05-s
mea
r-S
33.3
21.
2085
.04.
053
142
903
81.0
33.4
100.
0026
00.
0000
188
.50.
20.
7
Bas
ra-4
10-s
mea
r-W
107.
463.
4034
6.0
13.0
2226
103
1531
103.
010
7.80
00.
0032
60.
0000
176
.00.
20.
5
Bas
ra-4
10-s
mea
r-S
158.
915.
4044
7.0
16.0
2637
164
1740
170.
015
9.40
00.
0028
40.
0000
183
.90.
30.
8
Bas
ra-4
11-A
-sm
ear-
Tank
177.
525.
6043
3.0
17.0
2066
142
1914
130.
017
8.00
00.
0024
70.
0000
391
.10.
51.
5
Bas
ra-4
11-B
-sm
ear-
Tank
389.
4012
.00
794.
025
.026
5340
329
4734
9.0
390.
200
0.00
206
0.00
002
98.8
0.4
1.2
Bas
ra-4
12-s
mea
r-W
32.1
21.
0011
9.0
4.0
916
8765
549
.032
.240
0.00
377
0.00
003
66.3
0.6
1.8
Bas
ra-4
12-s
mea
r-S
48.9
31.
6016
7.0
6.0
1188
125
987
85.0
49.1
000.
0034
50.
0000
272
.30.
41.
2
TAB
LE
48.
SU
RF
AC
E S
AM
PL
ES
(SM
EA
RS
) (*
: MA
SS%
) (c
ont.)
Sam
ple
238 U
235 U
234 U
236 U
Tota
l U23
5 U/23
8 UD
U o
f To
tal U
(ng)
± 1σ
(ng)
(pg)
± 1σ
(pg)
(fg)
± 1σ
(fg)
(fg)
± 1σ
(fg)
(ng)
at r
atio
± 1σ
at r
atio
mas
s%± 1σ
*
DL
(mas
s%
)
68

Bas
ra-4
13-s
mea
r-S
79.5
52.
5027
4.0
25.0
1906
378
1471
138.
079
.830
0.00
348
0.00
005
71.8
0.9
2.6
Bas
ra-4
16-s
mea
r-S
52.5
41.
8014
1.0
6.0
907
119
1248
100.
052
.680
0.00
272
0.00
004
86.4
0.7
2.1
An
Nas
iriy
ah
Nas
ir-s
mea
r-03
-10
surf
ace
10.2
90.
4063
.03.
057
751
2812
.010
.360
0.00
624
0.00
002
19.1
0.4
1.1
Nas
ir-s
mea
r-04
-03
wal
l (A
)32
.60
1.10
231.
08.
019
6114
7<
30.0
32.8
300.
0072
00.
0000
3<
DL
—1.
9
Nas
ir-s
mea
r-04
-03
wal
l (B
)11
.66
0.40
82.0
3.0
692
55<
16.0
11.7
400.
0071
40.
0000
22.
00.
30.
9
Nas
ir-s
mea
r-07
-07
surf
ace
38.7
11.
3026
6.0
9.0
2552
204
<36
.038
.980
0.00
701
0.00
005
4.6
0.9
2.8
Nas
ir-s
mea
r-07
-08
surf
ace
22.7
90.
8013
8.0
6.0
1218
103
5820
.022
.930
0.00
615
0.00
002
20.9
0.4
1.3
Nas
ir-s
mea
r-08
-04
surf
ace
4.48
0.20
31.0
2.0
278
26<
7.0
4.51
00.
0071
00.
0000
6<
DL
—3.
3
Nas
ir-s
mea
r-08
-04
wal
l4.
080.
2029
.01.
025
430
<6.
04.
110
0.00
718
0.00
006
< D
L—
3.3
Nas
ir-s
mea
r-08
-06
surf
ace
3.44
0.10
24.0
1.0
217
25<
6.0
3.46
00.
0070
20.
0000
54.
31.
03.
1
Nas
ir-s
mea
r-08
-09
surf
ace
6.46
0.20
46.0
2.0
401
38<
14.0
6.50
00.
0071
90.
0000
6<
DL
—3.
4
Nas
ir-s
mea
r-09
-07
surf
ace
11.1
40.
4079
.03.
073
958
<15
.011
.220
0.00
724
0.00
002
< D
L—
1.2
Nas
ir-s
mea
r-09
-09
surf
ace
6.64
0.00
44.0
2.0
383
51<
14.0
6.68
00.
0067
90.
0000
58.
81.
02.
9
Nas
ir-s
mea
r-10
-03
from
tree
5.24
0.00
37.0
1.0
338
3311
7.0
5.28
00.
0072
90.
0000
4<
DL
—2.
0
Nas
ir-s
mea
r-10
-03
from
pal
m5.
550.
0040
.02.
035
429
<6.
05.
590
0.00
726
0.00
003
< D
L—
1.8
Nas
ir-s
mea
r-11
-08
wal
l10
.05
0.00
70.0
3.0
611
56<
15.0
10.1
200.
0071
30.
0000
22.
30.
30.
9
Nas
ir-s
mea
r-11
-09
surf
ace
6.24
0.20
43.0
2.0
351
30<
14.0
6.29
00.
0069
50.
0000
45.
70.
82.
3
Nas
ir-s
mea
r-11
-09
wal
l15
.62
0.50
110.
04.
093
076
<18
.015
.730
0.00
718
0.00
003
< D
L—
1.9
Nas
ir-s
mea
r-11
-02
surf
ace
21.7
80.
8015
4.0
6.0
1360
115
<23
.021
.940
0.00
721
0.00
003
< D
L—
1.9
TAB
LE
48.
SU
RF
AC
E S
AM
PL
ES
(SM
EA
RS
) (*
: MA
SS%
) (c
ont.)
Sam
ple
238 U
235 U
234 U
236 U
Tota
l U23
5 U/23
8 UD
U o
f To
tal U
(ng)
± 1σ
(ng)
(pg)
± 1σ
(pg)
(fg)
± 1σ
(fg)
(fg)
± 1σ
(fg)
(ng)
at r
atio
± 1σ
at r
atio
mas
s%± 1σ
*
DL
(mas
s%
)
69

Nas
ir-s
mea
r-11
-02
wal
l9.
090.
3063
.02.
052
043
<15
.09.
150
0.00
706
0.00
002
3.6
0.3
0.9
Nas
ir-s
mea
r-12
-01
surf
ace
13.2
60.
5093
.03.
079
570
<17
.013
.350
0.00
715
0.00
002
2.0
0.4
1.2
Nas
ir-s
mea
r-12
-02
surf
ace
26.1
70.
9018
5.0
7.0
1632
152
<25
.026
.360
0.00
721
0.00
003
< D
L—
1.5
Nas
ir-s
mea
r-12
-03
surf
ace
22.1
30.
8015
6.0
6.0
1368
109
<22
.022
.280
0.00
720
0.00
002
< D
L—
1.3
Nas
ir-s
mea
r-12
-04
surf
ace
7.77
0.30
54.0
2.0
461
39<
14.0
7.83
00.
0070
50.
0000
23.
80.
41.
3
Nas
ir-s
mea
r-12
-05
11.1
10.
4076
.03.
063
767
<16
.011
.190
0.00
698
0.00
003
5.2
0.6
1.8
Nas
ir-s
mea
r-12
-06
5.69
0.20
39.0
2.0
342
3616
10.0
5.73
00.
0070
00.
0000
24.
80.
51.
4
Nas
ir-s
mea
r-12
-07
59.4
92.
0042
4.0
16.0
3596
285
<61
.059
.920
0.00
726
0.00
002
< D
L—
1.1
Nas
ir-s
mea
r-12
-08
surf
ace
6.77
0.30
46.0
2.0
407
35<
14.0
6.82
00.
0069
80.
0000
45.
20.
72.
1
Nas
ir-s
mea
r-12
-09
surf
ace
21.8
80.
8015
5.0
6.0
1359
106
<22
.022
.040
0.00
723
0.00
003
< D
L—
1.6
Nas
ir-s
mea
r-12
-10
surf
ace
33.7
11.
2023
9.0
10.0
2086
174
<34
.033
.950
0.00
723
0.00
005
< D
L—
2.7
Nas
ir-s
mea
r-12
-11
surf
ace
14.1
80.
5099
.04.
089
474
307.
014
.280
0.00
711
0.00
003
2.6
0.6
1.7
Nas
ir-s
mea
r-12
-12
surf
ace
6.04
0.00
42.0
1.0
377
328
16.0
6.08
00.
0070
40.
0000
54.
01.
02.
9
Nas
ir-s
mea
r-12
-15
surf
ace
9.92
0.40
70.0
3.0
598
51<
15.0
9.99
00.
0071
70.
0000
31.
60.
51.
5
Nas
ir-s
mea
r-13
-03
tank
32.7
71.
1023
1.0
8.0
1974
158
<32
.033
.000
0.00
719
0.00
002
< D
L—
1.3
Nas
ir-s
mea
r-13
-05
surf
ace
5.93
0.20
41.0
2.0
375
31<
6.0
5.97
00.
0071
30.
0000
6<
DL
—3.
5
Nas
ir-s
mea
r-13
-05
wal
l5.
190.
2031
.01.
024
121
153.
05.
220
0.00
605
0.00
003
22.8
0.6
1.9
Nas
ir-s
mea
r-13
-06
surf
ace
15.1
70.
5097
.04.
080
776
206.
015
.270
0.00
649
0.00
005
14.4
1.0
2.9
Nas
ir-s
mea
r-13
-06
wal
l14
.20
0.50
81.0
3.0
671
6270
18.0
14.2
900.
0058
30.
0000
227
.00.
41.
1
Nas
ir-s
mea
r-14
-01
wal
l5.
590.
2020
.01.
013
418
4715
.05.
610
0.00
363
0.00
003
69.0
0.5
1.4
TAB
LE
48.
SU
RF
AC
E S
AM
PL
ES
(SM
EA
RS
) (*
: MA
SS%
) (c
ont.)
Sam
ple
238 U
235 U
234 U
236 U
Tota
l U23
5 U/23
8 UD
U o
f To
tal U
(ng)
± 1σ
(ng)
(pg)
± 1σ
(pg)
(fg)
± 1σ
(fg)
(fg)
± 1σ
(fg)
(ng)
at r
atio
± 1σ
at r
atio
mas
s%± 1σ
*
DL
(mas
s%
)
70

Nas
ir-s
mea
r-14
-02
surf
ace
4.02
0.10
23.0
1.0
180
2121
4.0
4.04
00.
0057
50.
0000
628
.61.
23.
7
Nas
ir-s
mea
r-14
-03
surf
ace
6.21
0.20
35.0
1.0
291
3728
8.0
6.24
00.
0056
80.
0000
429
.90.
72.
2
Sm
ear-
bom
bard
ed ta
nk (
entr
y)44
5.10
15.0
097
3.0
36.0
3650
371
5187
466.
044
6.10
00.
0022
30.
0000
295
.70.
31.
0
Sm
ear-
bom
bard
ed ta
nk (
outl
et)
9350
4.30
3186
.00
1881
45.0
6953
.061
0201
4812
411
2514
811
8998
.093
693.
000
0.00
205
0.00
001
99.1
0.1
0.3
Sm
ear-
scra
ps A
3819
.80
129.
0076
74.0
365.
027
258
3472
3941
040
42.0
3828
.000
0.00
205
0.00
001
99.1
0.1
0.3
Sm
ear-
scra
ps B
2565
.30
85.6
051
35.0
178.
017
822
1892
2119
932
46.0
2570
.000
0.00
204
0.00
001
99.3
0.3
0.8
Sm
ear-
scra
ps C
871.
1029
.00
1806
.066
.071
0369
386
3083
2.0
872.
900
0.00
211
0.00
001
97.9
0.2
0.5
Filt
er b
lank
pac
kage
II
2.30
0.10
4.0
0.3
172
585.
02.
300
0.00
286
0.00
003
83.6
0.5
1.6
Filt
er b
lank
pac
kage
II
1.18
0.10
3.0
0.3
233
117.
01.
190
0.00
254
0.00
004
89.7
0.8
2.3
Filt
er b
lank
pac
kage
II
9.83
0.30
19.0
0.7
717
250
14.0
9.85
00.
0019
80.
0000
110
0.5
0.3
0.8
Filt
er b
lank
pac
kage
II
1.11
0.00
3.0
0.2
212
116.
01.
120
0.00
295
0.00
007
81.9
1.3
4.0
Bla
nk p
acka
ge 2
; Ø 1
2.5
cm0.
430.
022.
00.
217
65
6.0
0.43
00.
0047
00.
0001
848
.53.
510
.5
Bla
nk p
acka
ge 2
; Ø 1
2.5
cm1.
570.
104.
50.
235
1520
6.0
1.58
00.
0028
90.
0000
583
.00.
92.
6
TAB
LE
48.
SU
RF
AC
E S
AM
PL
ES
(SM
EA
RS
) (*
: MA
SS%
) (c
ont.)
Sam
ple
238 U
235 U
234 U
236 U
Tota
l U23
5 U/23
8 UD
U o
f To
tal U
(ng)
± 1σ
(ng)
(pg)
± 1σ
(pg)
(fg)
± 1σ
(fg)
(fg)
± 1σ
(fg)
(ng)
at r
atio
± 1σ
at r
atio
mas
s%± 1σ
*
DL
(mas
s%
)
71

Appendix IV
HABIT DATA UTILIZED FORRADIATION DOSE ASSESSMENTS
Summary of the non-radiological and habit data utilized for radiation dose assessments
Inhalation of DU contaminated resuspended soil outdoors
Dust loading factor = 1.6 × 10⁻⁵ kg/m3
Inhalation rate of children (10 years old) = 0.64 m3/hInhalation rate of adults = 0.84 m3/hTime spent outdoors by adults and children
= 10 h × 365 d = 3650 h/aTime spent in the Az Zubayr scrapyard by working
adults = 2000 h/aTime spent in the Az Zubayr scrapyard by children
= 2000 h/a
Inhalation of DU dust inside military vehicles (tanks) hit by DU munitions
Concentration of the DU dust inside the tank = 1 mg/m3
Time spent inside military vehicles hit by DU munitions = 10 h/a
Ingestion of DU from soil outdoors
Soil ingestion rate of adults = 0.0183 kg/aSoil ingestion rate of children = 0.0365 kg/a
Ingestion of DU from vegetation and drinking water
Ingestion of the collected (unknown) vegetation = 300 kg/a
Ingestion of drinking water = 2.7 L/d = 1000 L/a
Ingestion of DU from contaminated flat surfaces (metal, concrete, walls)
Ingestion 100 times/a of the total DU present in the smear test with the highest DU amount
72

Appendix V
EXAMPLES OF RADIATION DOSES RECEIVEDBY PEOPLE FROM DIFFERENT TYPES OF
VOLUNTARY AND INVOLUNTARY EXPOSURES
TABLE 49. EXAMPLES OF RADIATION DOSES RECEIVED BY PEOPLE FROM DIFFERENT TYPES OF VOLUNTARY AND INVOLUNTARY EXPOSURES
Type of exposure Yearly dose
Natural average world background [5] 2400 Sv/a
Cosmic rays [26] 310 Sv/a
Naturally occurring radioactive elements in the human body [26] 390 Sv/a
Additional annual dose received by people living in a room with granite floor tiles [24] up to 1000 Sv/a
Average annual effective dose in different occupations Yearly dose
Civil aircrew [25] 3000 Sv/a
Coal miners [25] 700 Sv/a
Radiotherapy [25] 600 Sv/a
Radiology [25] 500 Sv/a
Dentistry [25] 60 Sv/a
Watching TV regularly (2–3 h/d) [27] 10 Sv/a
Type of exposure (one exposure) Dose
One computed tomography scan to body [25] 1100 Sv
One mammogram [26] 100 Sv
One dental X ray [25] 80 Sv
One chest X ray [25] 100 Sv
One crossing of the USA by jet aircraft [26] 50 Sv
73

REFERENCES
[1] INTERNATIONAL ATOMIC ENERGY AGENCY, Remediation of Areas Contaminated by Past Activities and Accidents, IAEA Safety Standards Series No. WS-R-3, IAEA, Vienna (2003).
[2] INTERNATIONAL ATOMIC ENERGY AGENCY, Radiological Conditions in Areas of Kuwait with Residues of Depleted Uranium, Report by an Interna-tional Group of Experts, Radiological Assessment Reports Series, IAEA, Vienna (2003).
[3] FOOD AND AGRICULTURE ORGANIZATION OF THE UNITED NATIONS, INTERNATIONAL ATOMIC ENERGY AGENCY, INTERNATIONAL LABOUR ORGANISATION, OECD NUCLEAR ENERGY AGENCY, PAN AMERICAN HEALTH ORGANIZATION, WORLD HEALTH ORGANIZA-TION, International Basic Safety Standards for Protection against Ionizing Radiation and for the Safety of Radiation Sources, Safety Series No. 115, IAEA, Vienna (1996).
[4] INTERNATIONAL COMMISSION ON RADIO-LOGICAL PROTECTION, Age-dependent Doses to Members of the Public from Intake of Radionuclides: Part 3, Ingestion Dose Coefficients, Publication 69, Pergamon Press, Oxford and New York (1995).
[5] INTERNATIONAL COMMISSION ON RADIO-LOGICAL PROTECTION, Age-dependent Doses to Members of the Public from Intake of Radionuclides: Part 4, Inhalation Dose Coefficients, Publication 71, Pergamon Press, Oxford and New York (1995).
[6] INTERNATIONAL COMMISSION ON RADIO-LOGICAL PROTECTION, 1990 Recommendations of the International Commission on Radiological Protection, Publication 60, Pergamon Press, Oxford and New York (1991).
[7] UNITED NATIONS, Sources and Effects of Ionizing Radiation (Report to the General Assembly), Scientific Committee on the Effects of Atomic Radiation (UNSCEAR), UN, New York (2000).
[8] HARLEY, N.H., FOULKES, E.C., HILBORNE, L.H., HUDSON, A., ANTHONY, C.R., A Review of the Scientific Literature as it Pertains to Gulf War Illnesses, Vol. 7, Depleted Uranium, RAND Rep. MR-1018/7-OSD, National Defense Research Institute, Washington, DC (1999).
[9] ROYAL SOCIETY, The Health Hazards of Depleted Uranium Munitions, Part I, Royal Society, London (2001).
[10] UNITED NATIONS ENVIRONMENT PROGRAMME, Depleted Uranium in Kosovo, Post-Conflict Environmental Assessment, UNEP, Nairobi (2001).
[11] US ARMY CENTER FOR HEALTH PROMOTION AND PREVENTIVE MEDICINE, Depleted Uranium, Human Exposure Assessment and Health Risk Characterization in Support of the Environmental Exposure Report ‘Depleted Uranium in the Gulf’ of the Office of the Special Assistant to the Secretary of Defense for Gulf War Illnesses, Medical Readiness and Military Deployments (OSAGWI), Health Risk Assessment Consultation No. 26-MF-7555-OOD, USACHPPM, Washington, DC (2000).
[12] FETTER, S., VON HIPPEL, F.N., The hazard posed by depleted uranium munitions, Science and Global Security 8 2 (1999) 125–161.
[13] DANESI, P.R., et al., Depleted uranium particles in selected Kosovo samples, J. Environ. Radioact. 64(2003) 143–154.
[14] HAYWOOD, S., SMITH, J., Assessment of the Potential Radiological Impact of Residual Contamina-tion in the Maralinga and Emu Areas, Rep. NRPB-R237, HMSO, London (1990).
[15] NATIONAL RADIOLOGICAL PROTECTION BOARD, Radiological Protection Bulletin (e-Bulletin), “Generalized habit data for radiological assessments”, No. 4, December (2003).
[16] SALBU, B., et al., Oxidation states of uranium particles from Kuwait, J. Environ. Radioact. 78 (2005) 125–135.
[17] BLEISE, A., DANESI, P.R., BURKART, W., Properties, use and health effects of depleted uranium (DU): A general overview, J. Environ. Radioact. 64(2003) 93–112.
[18] MARSHALL, A.C., An Analysis of Uranium Dispersal and Health Effects Using a Gulf War Case Study, Sandia Rep., SAND2005-4331, July (2005).
[19] PARKHURST, M.A., et al., Capstone Depleted Uranium Aerosols: Generation and Characterization, Vols 1, 2 (PNNL-14168), prepared for the US Army by Pacific Northwest National Laboratory, PNNL, Richland, Washington, October (2004).
[20] ROYAL SOCIETY, The Health Hazard of Depleted Uranium Munition, Part II, Annex C: Estimate of doses from the direct ingestion of soil or dusts containing uranium and depleted uranium, Royal Society, London (2002).
[21] US ENVIRONMENTAL PROTECTION AGENCY, Exposure Factors Handbook, Vol. I: General Factors, Ch. 4 Soil Ingestion and Pica, Tables 4–23: Summary of Recommended Values for Soil Ingestion, August (1997).
[22] ANIGSTEIN, R., THURBER, W.C., MAURO, J.J., MARSCHKE, S.F., BEHLING, U.H., Potential Recycling of Scrap Metal from Nuclear Facilities, Part I: Radiological Assessment of Exposed Individuals, Vol. 1, Technical Support Document prepared for US Environmental Protection Agency, Office of Radiation and Indoor Air, September (2001).
75

[23] WORLD HEALTH ORGANIZATION, Uranium in Drinking Water, WHO Guidelines for Drinking Water Quality, 3rd edn, WHO/SDR/WSH/03.04/118, WHO, Geneva (2004).
[24] FOIKANOS, K., SARROUI, I., PASHALIDIS, I., Increased Radiation Exposure by Granite Used as Natural Tiling Rock in Cypriot Houses, Radiation Measurements 42 3 (2007) 446–448.
[25] INTERNATIONAL ATOMIC ENERGY AGENCY, Radiation, People and the Environment, IAEA/PI/A.75/04-00391, February (2004).
[26] ENVIRONMENTAL HEALTH CENTRE, Radiation Basics, EHP, Washington, DC (1997).
[27] AMERICAN NUCLEAR SOCIETY, Personal Radiation Dose, ANS (2000),www.ohiou.edu/ehs/docs/10_persnl_rad_dose.pdf
76

77
CONTRIBUTORS TO DRAFTING AND REVIEW
Burger, M. United Nations Environment Programme
Cabianca, T. Health Protection Agency, United Kingdom
Danesi, P.R. Private consultant, Italy
Linsley, G. Private consultant, United Kingdom
Louvat, D. International Atomic Energy Agency
Saleh, A. Ministry of Environment, Iraq
Telleria, D. International Atomic Energy Agency

RELATED PUBLICATIONS
www.iaea.org/books
EnvironmEntal ConsEquEnCEs of thE ChErnobyl aCCidEnt and thEir rEmEdiation: twEnty yEars of ExpEriEnCE report of the un Chernobyl forum Expert Group “Environment”radiological assessment reportsSTI/PUB/1239 (166 pp.; 2006)ISBN 92–0–114705–8 €40.00
radioloGiCal Conditions in thE dniEpEr rivEr basinradiological assessment reportsSTI/PUB/1230 (185 pp.; 2006)ISBN 92–0–104905–6 €38.00
radioloGiCal Conditions in arEas of Kuwait with rEsiduEs of dEplEtEd uraniumradiological assessment reportsSTI/PUB/1164 (73 pp.; 2003)ISBN 92–0–106603–1 €25.00
radioloGiCal Conditions of thE wEstErn Kara sEaradiological assessment reportsSTI/PUB/1068 (124 pp.; 1999)ISBN 92–0–104298–1 €32.00
radioloGiCal Conditions at thE sEmipalatinsK tEst sitE, KazaKhstan: prEliminary assEssmEnt and rECommEndations for furthEr studyradiological assessment reportsSTI/PUB/1063 (43 pp.; 1998)ISBN 92–0–104098–9 €14.50
thE radioloGiCal situation at thE atolls of mururoa and fanGataufa: main rEportradiological assessment reportsSTI/PUB/1028 (282 pp.; 1998)ISBN 92–0–101198–9 €87.00
radioloGiCal Conditions at biKini atoll: prospECts for rEsEttlEmEntradiological assessment reportsSTI/PUB/1054 (67 pp.; 1998)ISBN 92–0–100398–6 €20.50
IAEA SAFETY RELATED PUBLICATIONS
IAEA SAFETY STANDARDS
Under the terms of Article III of its Statute, the IAEA is authorized to establish or adopt standards of safety for protection of health and minimization of danger to life and property, and to provide for the application of these standards.
The publications by means of which the IAEA establishes standards are issued in the IAEA Safety Standards Series. This series covers nuclear safety, radiation safety, transport safety and waste safety. The publication categories in the series are Safety Fundamentals, Safety Requirements and Safety Guides.
Information on the IAEA’s safety standards programme is available at the IAEA Internet site
http://www-ns.iaea.org/standards/
The site provides the texts in English of published and draft safety standards. The texts of safety standards issued in Arabic, Chinese, French, Russian and Spanish, the IAEA Safety Glossary and a status report for safety standards under development are also available. For further information, please contact the IAEA at PO Box 100, 1400 Vienna, Austria.
All users of IAEA safety standards are invited to inform the IAEA of experience in their use (e.g. as a basis for national regulations, for safety reviews and for training courses) for the purpose of ensuring that they continue to meet users’ needs. Information may be provided via the IAEA Internet site or by post, as above, or by email to [email protected].
OTHER SAFETY RELATED PUBLICATIONS
The IAEA provides for the application of the standards and, under the terms of Articles III and VIII.C of its Statute, makes available and fosters the exchange of information relating to peaceful nuclear activities and serves as an intermediary among its Member States for this purpose.
Reports on safety and protection in nuclear activities are issued as Safety Reports, which provide practical examples and detailed methods that can be used in support of the safety standards.
Other safety related IAEA publications are issued as Radiological Assessment Reports, the International Nuclear Safety Group’s INSAG Reports, Technical Reportsand TECDOCs. The IAEA also issues reports on radiological accidents, training manuals and practical manuals, and other special safety related publications. Security related publications are issued in the IAEA Nuclear Security Series.
Cover:A satellite image of an area in southern Iraq. The orange markings indicate sampling areas. (Photograph courtesy of UNEP.)
P1434_cover.indd 2 2010-07-22 11:13:39

INTERNATIONAL ATOMIC ENERGY AGENCYVIENNA
ISBN 978–92–0–100910–4ISSN 1020–6566
During the conflict in Iraq in 2003, depleted uranium munitions were employed by the Coalition Forces. As a result, residues of depleted uranium contaminated both localized areas of land and vehicles. The possible health effects of such residues on the Iraqi population living in the vicinity of the affected areas raised concerns. In 2004, the Iraqi Minister of Environment made a formal request of the United Nations Environment Programme for a comprehensive field assessment. In early 2005, a meeting involving UNEP, the World Health Organization and the IAEA took place to discuss, plan and coordinate work on the assessment of depleted uranium residues in southern Iraq. In 2006, during a follow-up meeting that included UNEP, the IAEA and the Radiation Protection Centre of the Iraqi Ministry of Environment, the IAEA was invited to undertake a radiological assessment of the data collected by the Radiation Protection Centre. This report describes the methods, assumptions and parameters used by the IAEA in the assessment of the post-conflict radiological conditions of specified locations for local populations and in the environment. The report uses the results provided by UNEP from the 2006–2007 sampling campaigns, and presents these results, findings and conclusions.
Report by aninternational group of experts
Radiological Conditions inSelected Areas of Southern Iraq withResidues of Depleted Uranium
RADIOLOGICALA S S E S S M E N TR E P O R T SS E R I E S
Radiological C
onditions in Selected A
reas of Southern Iraq w
ith Residues of D
epleted Uranium
P1434_cover.indd 1 2010-07-22 11:13:38