radio coverage prediction for a wireless ip-based network in … coverage... · radio coverage...
TRANSCRIPT

Radio Coverage Prediction for a Wireless IP-based Network in Central Europe
Ralf Wilke DH3WR, Hubertus A. Munz and Dirk Heberling Institute of High Frequency Technology
RWTH Aachen University Aachen, Germany
Abstract—In the beginning of 2009 the idea of building up a wireless IP-based data network emerged from Austria. The classical backbone approach with distributed locations of routers, servers and user access equipment was pursued. Today in 2014, the network is covering Central Europe and still spreading. Every week new backbone interconnections and user access points are being installed. Based on an open source framework, a wiki-like website serves as an administrative platform, where IP assignments, meta-data and geographical locations of backbone nodes are stored. This paper presents the selection and implementation of RF propagation models to automatically predict the radio coverage area of user access points and display them on a map. As the RF path lengths differ from 300 m up to 30 km, several models where reviewed and merged into one software. The prediction was done based on a digital elevation model and land cover data.
Keywords—RF prediction, wireless user access, coverage, HamNet
I. INTRODUCTION
In the 2009 the Austrian amateur radio community started to build up a wireless network. The frequencies used are in the 2.4 GHz and 5.7 GHz WiFi band. Due to the fact that the operators are licensed radio amateurs, the EIRP of those installations is not limited to the regulations which apply for public use of radios in this frequency ranges. After one year, a lot of antennas and radios were installed at Austrian summits. The purpose of this network is to provide a digital IP based network which is independent from commercial tele-communication companies and provides a reliable means of transporting information even in disaster scenarios like heavy storms or power blackouts helping the public aid organizations with communication. The structure of the network consists of a backbone net interconnecting data relay nodes via directional radio links and distributed user access point via outdoor high range access points. One year later, the idea spread towards Germany where today several hundreds of nodes are active and continuous expansion is still going on.
To manage this network called HamNet, a wiki-like website [1] was built to support the planning and management of site locations, frequency use and IP assignment. To illustrate the current state of network deployment, node locations and
point-to-point radio links are displayed on a map. An excerpt of this map is shown in Fig. 1.
Fig. 1. Excerpt of the HamNet in southern North Rhine-Westphalia [1]
At all nodes marked with the letter “U” user access points with a coverage area of about 20 km are installed. The motivation of this work was to integrate a coverage prediction of those access points into the map presentation. The advantages of this method of illustration are:
1. Showing the up-to-date extension of user access coverage to interested people who would like to join the movement.
2. Helping the operators of the radio nodes to get an overview of the blank areas where there is no coverage available yet. This leads to a more goal-oriented extension of new installations and shows the demand in a simple way.
To generate those coverage maps different propagation models where reviewed and compiled into one software.
II. REVIEW ON PROPGATION MODELS
The most important empirical propagation models are shown in TABLE I.
TABLE I. OVERVIEW OF EMPIRICAL PROPAGATION MODELS
Terrain Models Vegetation Models Urbane Models
Egli Model (30 – 3000 MHz)
Weissberger's Model (0.2 – 95 GHz)
Young Model (150 – 3700 MHz)
Longley-Rice Model (20 MHz – 20 GHz)
Early ITU Vegetation Model
(Note a)
Okumura Model (200 – 1920 MHz)
ITU R-REC P.530 Model
(Note a)
Updated ITU Vegatation Model
(Note a)
Hata Model (150 – 1500 MHz)
Cost 231 Model
(1500 – 2000 MHz)
Lee Model
(900 MHz) a. No frequency range given
As a synthesis of this review the following propagation models are used in the software.
A. Free Space Loss
The most known propagation phenomena is the free space loss. It is a consequence of decrease of power flux density with increasing distance from a radio source.
20 log 32.4 20 log 20 log4
FSL f d
dB d MHz km
Eq. (1) shows the tailored version for f as frequency in MHz and d as distance in km.
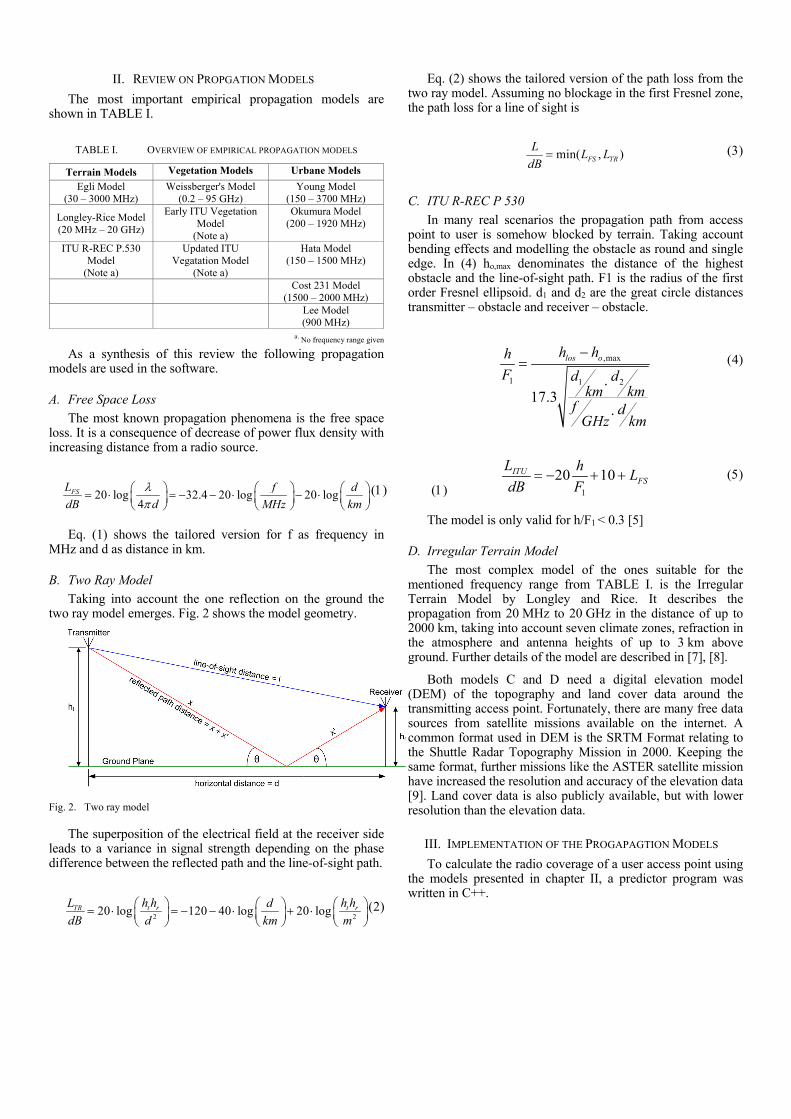
B. Two Ray Model
Taking into account the one reflection on the ground the two ray model emerges. Fig. 2 shows the model geometry.
Fig. 2. Two ray model
The superposition of the electrical field at the receiver side leads to a variance in signal strength depending on the phase difference between the reflected path and the line-of-sight path.
2 2
20 log 120 40 log 20 logt r t rTR h h h hL d
dB d km m
Eq. (2) shows the tailored version of the path loss from the two ray model. Assuming no blockage in the first Fresnel zone, the path loss for a line of sight is
min( , )FS TR
LL L
dB
C. ITU R-REC P 530
In many real scenarios the propagation path from access point to user is somehow blocked by terrain. Taking account bending effects and modelling the obstacle as round and single edge. In (4) ho,max denominates the distance of the highest obstacle and the line-of-sight path. F1 is the radius of the first order Fresnel ellipsoid. d1 and d2 are the great circle distances transmitter – obstacle and receiver – obstacle.
,max
1 1 2
17.3
los oh hh
F d dkm km
f dGHz km
1
20 10ITUFS
L hL
dB F
The model is only valid for h/F1 < 0.3 [5]
D. Irregular Terrain Model
The most complex model of the ones suitable for the mentioned frequency range from TABLE I. is the Irregular Terrain Model by Longley and Rice. It describes the propagation from 20 MHz to 20 GHz in the distance of up to 2000 km, taking into account seven climate zones, refraction in the atmosphere and antenna heights of up to 3 km above ground. Further details of the model are described in [7], [8].
Both models C and D need a digital elevation model (DEM) of the topography and land cover data around the transmitting access point. Fortunately, there are many free data sources from satellite missions available on the internet. A common format used in DEM is the SRTM Format relating to the Shuttle Radar Topography Mission in 2000. Keeping the same format, further missions like the ASTER satellite mission have increased the resolution and accuracy of the elevation data [9]. Land cover data is also publicly available, but with lower resolution than the elevation data.
III. IMPLEMENTATION OF THE PROGAPAGTION MODELS
To calculate the radio coverage of a user access point using the models presented in chapter II, a predictor program was written in C++.

A. Combination and transition between different models
The path loss and thus receiving signal strength for every pixel of the resulting coverage map needs to be calculated. The algorithm checks first which model to use depending on the path characteristics. For line-of-sight scenarios the two ray model is used. Otherwise the ITU or ITM model is predicting the path loss depending on the amount of blockage of the Fresnel zone. The following Fig. 3 shows the flow chart of the algorithm.
Fig. 3. Flow chart of the predictor algorithm
B. Distributed computation and batch server combination and transition between different models
The predictor itself can be executed for each pixel of the
resulting map independently. Only the input parameter of transmitter and receiver site plus an access to the DEM and land cover library is needed. Parallel computation can be done on a single machine using multi-threading. Besides, the use of a central batch server allows to distribute the computation processes to different machines located at different geographical places. The data interchange is done via the former mentioned HamNet IP backbone network. This assures parallelization speed-up and high availability even in case of backbone network outages.
Fig. 4. Predicted radio coverage area of an omni directional access point at Bielefeld, Germany
C. Implementation into global management database
The wiki-like website [1] is based on an open source framework. In the near future, the user interface of this database will be extended to store 3D antenna patterns, transmitter output power and cable losses. Once this data is entered into the database by the node operators, the prediction update jobs are automatically triggered. A redundant distributed data storage of the calculated coverage maps will ensure a high availability of the map overlay. Extending the Open Street Map display, the interested user of hamnetdb.net can enable the total or individual display of the coverage overlay.
IV. EVAUATION OF PREDICTED RADIO COVERAGE
The results of the algorithm have been compared against a well-established reference named Radio Mobile [10]. Fig. 5 gives a comparison of the coverage area of the same user access point. Slight differences can be noticed, but the overall results show a congruence of the predicted radio coverage area. In the future exemplary field verification measurements will be conducted to verify the prediction.
Fig. 5. Comparison between our algorithm (left) and reference (right)
ACKNOWLEDGMENT
We would like to thank Florian Radlherr and Jann Traschewski for their effort to run and improve the IP management website [1] and the deployment of emerging ideas to improve the network. Thanks to M. & M. Reiffenrath for the review of the paper.
REFERENCES [1] Website Hamnetdb hamnetdb.net
[2] John S. Seybold, Introduction to RF Propagation, Wiley, 2005
[3] Curt A. Levis, Joel T. Johnson, Fernando L. Teixeira, Radiowave Propagation - Physics and Applications, Wiley, 2010
[4] Erich Vogelsang, beam-Verlag, Wellenausbreitung in der Nachrichtentechnik, 2003
[5] International Telecommunication Union, Recommendation ITU-R P.530-15, Propagation data and prediction methods required for the design of terrestrial line-of-sight system, 2013
[6] International Telecommunication Union, Recommendation ITU-R P.1546-5, Method for point-to-area predictions for terrestrial services in the frequency range 30 MHz to 3000 MHz, 2013
[7] G.A. Hufford, A.G. Longley, W.A. Kissick, NTIA REPORT 82-100, A Guide to the use of the ITS Irregular Terrain Model in the Area Prediction Mode, April 1982

[8] A G. Longley and P. L. Rice, “Prediction of tropospheric radio transmissions over irregular terrain: a computer method”, Environmental Sciences Services Administration, U.S. Department of Commerce, Boulder Colorado, Tech. Rep. ERL 79-ITS 67, 1968
[9] Karsten Jacobsen, Leibniz University Hannover, Inst. of Photogrammetry and Geoinformation, Comparison of ASTER GDEMs with SRTM Height Models, 2010
[10] Roger Coudé, Radio Mobile, Prediction Programm, [online] http://www.cplus.org/rmw/english1.html
[11] Leif J. Harcke, Kenneth S. Dueker and David B. Leeson, „Frequency Coordination in the Amateur Radio Emergency Services”, Stanfort ECJ, spring 2004