radidr1etric correction of infra-red aerial … · radidr1etric correction of infra-red aerial...
TRANSCRIPT
RADIDr1ETRIC CORRECTION OF INFRA-RED
AERIAL COLOR FlU~
Yasufumi EMORI, Yoshizumi YASUDA, INSTITUTE OF COLOR TECHNOLOGY,
CHIBA UNIVERSITY, JAPAN.
and
Joji IISAKA, IBM SCIENTIFIC CENTRE, JAPAN.
Abstract
A method of correcting radiometric distortions for an infra-red color film is presented.
This method i nvo 1 ves deriving rna tehma t i ca 1 formulas, which explain various radiometric distortions, such as cos 4 law failure, overlaps of spectral sensitivities of multilayer film and unwanted absorptions of photographic dyes.
For some quantitative applications ofiR color films, thecorrectionschemepresented will give more useful result for an digital analysis of aerial IRcolor photography.
1. I\ITRODUCT I ON
The visual interpretation techniques using color film and/or infra-red
color film has widely been used as a standard qualitative analysis in the fields
of Remote Sensing and photogrametry. These films have excellent resolution and
have those sensitive layer in visible and near infra-red spectral region.
This multilayer film is coated onto a single base and the images of each
layer of this multilayer film are automatically registered. So , there is no
color fringing around the edges of objects. The color film is consider to be
good multispectral sensor.
1
Recently , the importance of digital analysis techniques of these films
has also been increased . However, the image on the film has a lot of radiometric
distortions . So, it is necessary to correct these distortions before automatic
quantitative analysis are performed .
In this paper , thebasic concept on radiometric distortions involved in
the aero color film and the correction techniques by a computer are reviewed
and the useful of this correction process are discussed from automatic classi
fication results of this film .
2 . RADJOMfTRIC DISTORTIONS CARRIED INTO COLOR FI LMS
The radiometric distortions of an aero color film image are divided into
two ways, first is caused by imaging camera system and the other is caused by the
film characteristics itself .
Firstly , the irradiance at the focal plane of an aero camera is varied
by COS 4 law in accordance with incident angle . Furthermore, path radiance oc
cured by scattering of atmosphere and flares due to internal multiple reflection
in the optical system are added . Therefore , the objects of same radiance which
exist in different portions of the view field will give different irradiance
of the focal plane .
Secondly , the input radiance energy through the camera lens is recorded on
infra-red, red and green sensitive layer as dye densities of cyan , magenta and
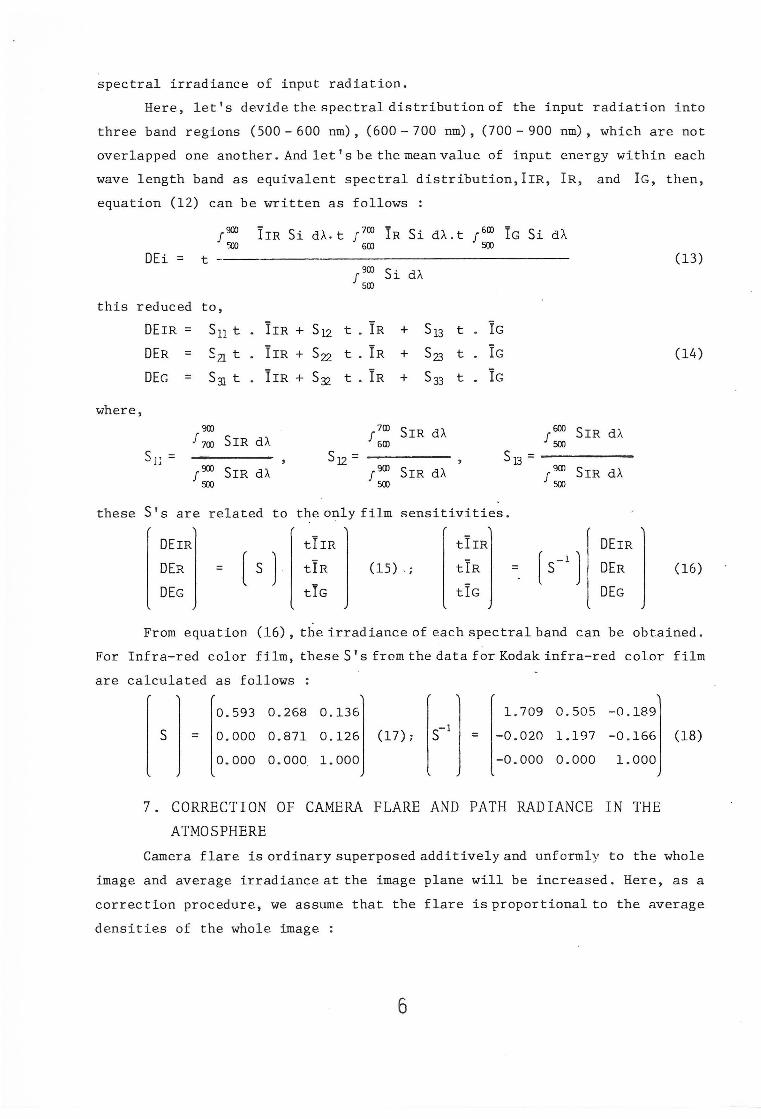
yellow respectively . InFig . 1 showsblockdiagram of color film model. As the
spectral sensitivity distributions of each layer overlapes one another, the re
quired exposures to yield unit dye densities are different . Moreover , the amount
of the produce dye whichshouldbe proportional to the input exposure will be
affected by the dye yielding in another layer which is called as the inter-image
effects occured during the developing process .
In addition, the spectral transmittance of three dyes have the spectral
overlappings, known as unwanted dye absorptions. So, densities of the color film
image measured through red , green, and blue filters are integral densities which
contains the effects of the unwanted dye absorptions .
After the correcting these distortions, exact spectral radiance distrib
ut i on of ground object can be obtained .
3. CORRECTION OF OVERLAPPING OF SPECTRAL DENSITIES OF DYES
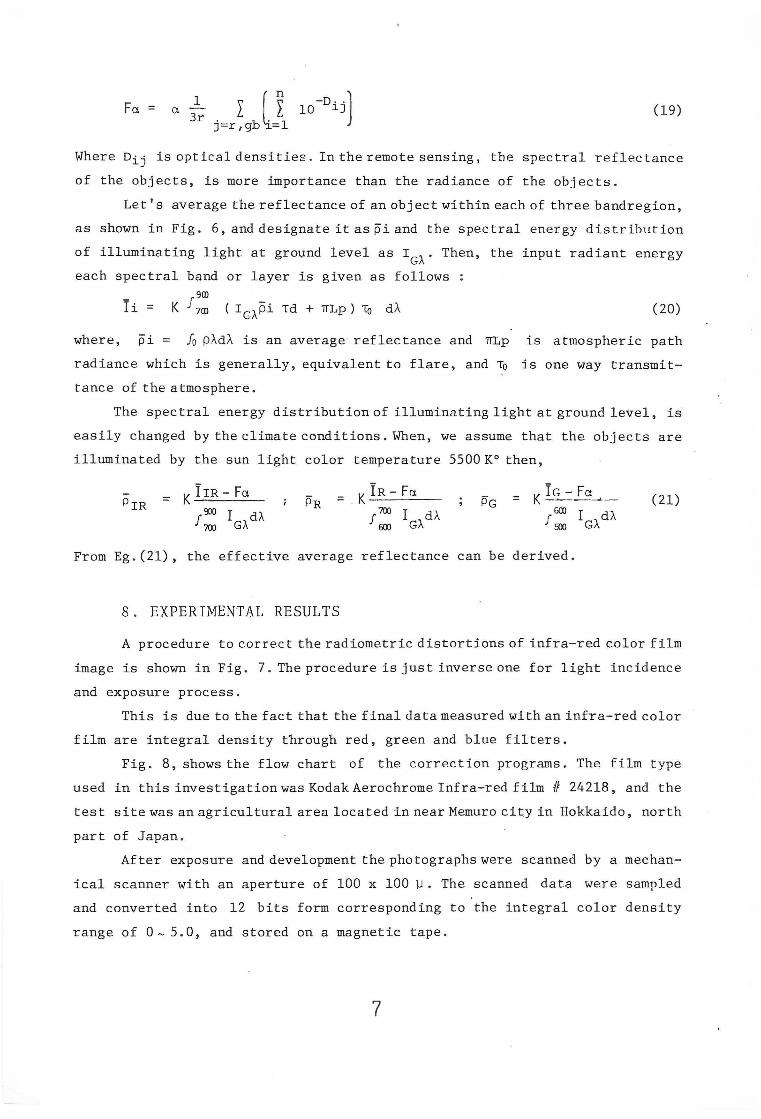
The spectral density curves of cyan , magenta and yellow dyes after de
veloping process have spectral overlaps each another known as unwanted dye ab
sorptions, as shown in Fig . 2 . So, when the dye densities of cyan , magenta and
yellow layers are measured with sharp cut Red , Green , and Blue filters respec
tively , the integral densities do not always show the dye densities correctly ,
because of the mi xing of unwanted dye absor ptions of other dyes .
The integral densities of sampling for each filters are expressed in the
following equations :
Dr = De 650 + Om 650 + Dy 650
Og = De 550 + Om 550 + Dy 550
Db = De 450 + Om 450 + Dy 450
(1)
where De , Om, and Dy are the analitycal density for cyan , magenta and yellow dye
at each peak wave lengths A and Dr , Og, and 00 are measured i ntegral density
with Red , Green, and Blue filters .
By normalizing Eg . (1) with each analytical densities De, Om, and Dy , the
following equations are obtained :
De650 Dm650 0y650 Dr = De650 X De + Dm550 X Om + Dy450 X Dy
De550 Dm550 Oy550
Og = De650 x De + Dm550 x Om + Oy450 x Dy (2)
De450 Dm550 Dy450
De De650 X De + Dm550 X Om + Dy450 X Dy
(4)
The analytical density of each layer can be estimated from measured in
tegral densities by using Eg . (4) .
Fig. 2, shows the spectral density curves of the three dyes for the IR
color film .
From the data, matrixes (A) and (A- 1 ) can be calculated as follows :
l( 1. 000 0 . 072
0 . 173 1.000
0 . 048 0 . 160
0 . 000] 0 . 040
1 . 000
3
-0 . 073
1.019
- 0 . 159
0 . 0021
0 . 040J
1 . 006
4. THE CORRECTION OF INTER-IMAGE EFFECT
The development of dye in each layer of the multi-layer film, give some
effects on development of dyes in other layers. This is known as the inter-image
effect .
In the case of two layer film, as an example shown in Fig. 3, the develop
ing process for a part of the lower layer under highly exposed upper layer is
inhibited more than for the other part under lower exposed upper layer due to the
·fatigue of developing agents. So, the density distribution lower layer is not
uniform even if uniform exposure is given for the lower layer .
The amount of inter-image effect .60 of another layer, due to the dye yield
of one layer, .60, are given as follows :
lid = K t.D (5)
where K is a gradient of inter- image effect as the infra-red color film has
three sensitive layer, the dye yield in one layer give the inter-image effects
to the other two layers. So, analytical densities of dyes which are measured,
De, Om, and Dy are given as follows :
D1
e I I
De kee + kemDm + key Oy
D1
c I I
Om = kme + kmmDm + kmy Dy ( 6)
D1
e I I
Dy = kye + kymOm + kyy Dy
where De, Om, and Dy are the analytical densities without the inter-image effects
Kij is the gradient of the inter-image effects of i layer to j layer. and i , j
are e, m, y.
Eg. ( 6) is also expressed as Eg. (7) and Eg. (8)
r De D1e
o:e l [ ~: l [n) 0~ (7) (rf1) (8) l Om
= Om J =
Dy Dly Dly
From equation 8, true dye density analytical generated by exposure in each layer
can be estimated from measured dye density . According to the measurement the
gradient coefficients of the inter-image effect were given as follows
1.000 0.036 0. 054] r-003 0.059 0.039] [ rr) = 0.002 1 . 000 0.000 (9) (rr-1) = 0 . 060 1 .004 0 . 043 (10)
0.060 0.041 1.000 0.000 0.000 1 . 000

5. CORRECTION OF DIFFERENT CHARACTERISTIC CURVES OF THREE
LAYERS The relationship between dye density and exposure is given by character
istic curve, or D-H curve. By using this curves, the effective exposure in each
layer can be estimated from dye density. Each H-D curve of the layer or an infra
red color film is different and non-linear. The dens it 1es H-D curve are generally
given by the integrated densities with red, green and blue filters. So, in order
to estimate the exposure, it is needed to obtain the H-D curves expressed in the
analytical density. In Fig. 4, shows the H-D curve used in this study, and D-P.
curves expressed in anaJytical density 1s sho~r ·n ii' "Fig. 6, calculated fro:n Eg. (4J
As seen in this f.i.gure, each H-D curve is different one anvth,•r and has
non-linear. Therefore, the H-D curves are approximated by polynomial equations
as follows -l.
F TR (D'c) -1
F R <Din)
EDG = -1
F G (Dy)
Where IR, R, and G are the polynomials approximating D-H curves for infra-red
sensitive cyan layer, red sensitive magenta layer and green sensitive yel1ow
layer, ED:rR, EDR, EDG are relative exposures for each layers, and D'c, !1m , D'y
are analytical dye densities for each layer. The amount of dye in a color film is
proportional tothe analytical densities of dyes .
6. CORRECTION OF DIFFERENT SPECTRAL SENSITIVITIES OF EACH THREE LAYERS
Spectral sensitivity curves of each sensitive layers of an infra-red color
film are overlapped one another, as shown in Fig. 5 . Suppose the case of 650 rnm
monochromatic light, this light exposes the infra-red sensitive layer, and re
sults in as if there exists infra-red light. Therefore, the overlapping of the
spectral sensitivity should be corrected in order to estimate the amount of the
incident radiant energy for each spectral band or layer . The amount of the ex
posure for each layer is proportional to the exposure time and the mean value
of input energy .
em /:00 I).. Si d:>..
DEi t i IR, R, G (12) em Si dA /:00
Where Si is the spectral sensitivity of i-th layer, i = IR, R, G, and I A is the
5
spectral irradiance of input radiation.
Here , let 1 s devide the spect r al distribu t ion of the input r adiation into
three band regions (500 - 600 nm) , (600 - 700 nm), (700 - 900 nm), which are not
over lapped one another . And let 1 s be the mean value of input energy wi thin each
wave length band as equivalent spectral distribution, lrR, I R, and IG, then ,
equation (12) can be written as follows
f<XJJ lrR Si dA. . t !700 lR Si dA.t !600 l G Si dA ~ 600 500
DEi = t (13) 900
1 soo Si dA.
this reduced to,
DEIR = S11 t lrR+ sl2 t . IR + S13 t l G
DER = s?1 t lrR+ s22 t . l R + s23 t lG (14)
DEG = s31 t lrR+ s32 t . l R + S33 t lG
where, 900 700 SIR dA. 600 SIR d A.
!700 SIR dA. !600 !500
Sn = sl2 = sl3 = f<XJJ SIR dA. !900 SIR dA. 900 SIR dA.
500 500 !500
these S 1 s a r e related to the only film sensitivities .
DEIR tliR (
tlrR DEIR
DER = [ s ) tlR (15) ' i tlR = [ s-1 ) DER (16)
DEG tlG tlG DEG
From equation (16), the irradiance of each spectral band can be obtained .
For Infra-red color film, these S 1 s from the data for Kodak infra- red color film
are calculated as follows :
0 . 593 0 . 268 0 . 136 1.709 0.505 - 0 . 189
s = o.ooo o . 8n o.126 (17); s-1 = -o . o2o 1.197 - o . 166 (18)
0. 000 0 . 000 1. 000 - 0 . 000 0 . 000 1.000
7 . CORRECTION OF CAMERA FLARE AND PATH RADIANCE IN THE
ATMOSPHERE
Camera flare is ordinary superposed additively and unformly to the whole
image and average irradiance at the image p l ane will be increased . Here , as a
correction procedure , we assume that the flare is proportional to the average
dens i ties of the whole image :
6
(19)
Where Dij is optical densities . In the remote sensing, the spectral reflectance
of the objects, is more importance than the radiance of the objects .
Let ' s average the reflectance of an object within each of three bandregion ,
as shown in Fig . 6, and designate it as pi and the spectral energy distribution
of illuminating light at ground level as IGA . Then , the input radiant energy
each spectral band or l ayer is given as follows
! 900 Ji = K 700 ( IGApi Td + 7TLp ) To dA. (20)
where , pi fo p.\dA. is an average reflectance and TILp is atmospher i c path
radiance which is generally , equivalent to flare, and ~ is one way transmit
tan ce of the atmosphere .
The spectral energy distribution of illuminating light at ground level, is
easily changed by the climate conditions . When , we assume that the objects are
illuminated by the sun light color temperature 5500 K0 then ,
- = K lrR - Fa PR = K l R - Fa
PG = K [Cl__: Fa__._ (21) PrR J'PJ !GAdA !100 I GAdA.
600 I GA.dA
700 600 f:m
From Eg . (21), the effective average reflectance can be derived .
8 . EXPERIMENTAL RESULTS
A procedure to correct the radiometric distortions of infra-red color film
image is shown in Fig . 7 . The procedure is just inverse one for light incidence
and exposure process .
This is due to the fact that the final data measured with an infra-red color
film are integr al density through red, green and blue filters.
Fig . 8, shows the flow chart of the correction programs . The film type
used in this investigat i on was Kodak Aerochrome Infra-red film fl 24218, and the
test site was an agricultural area located in near Memuro city in Hokkaido, north
part of Japan .
After exposur e and development the photographs were scanned by a mechan
ical scanner with an aperture of 100 x 100 lJ • The scanned data were sampled
and converted into 1 2 bits form corresponding to the integral color dens i ty
range of 0- 5 . 0 , and stored on a magnetic tape .
7
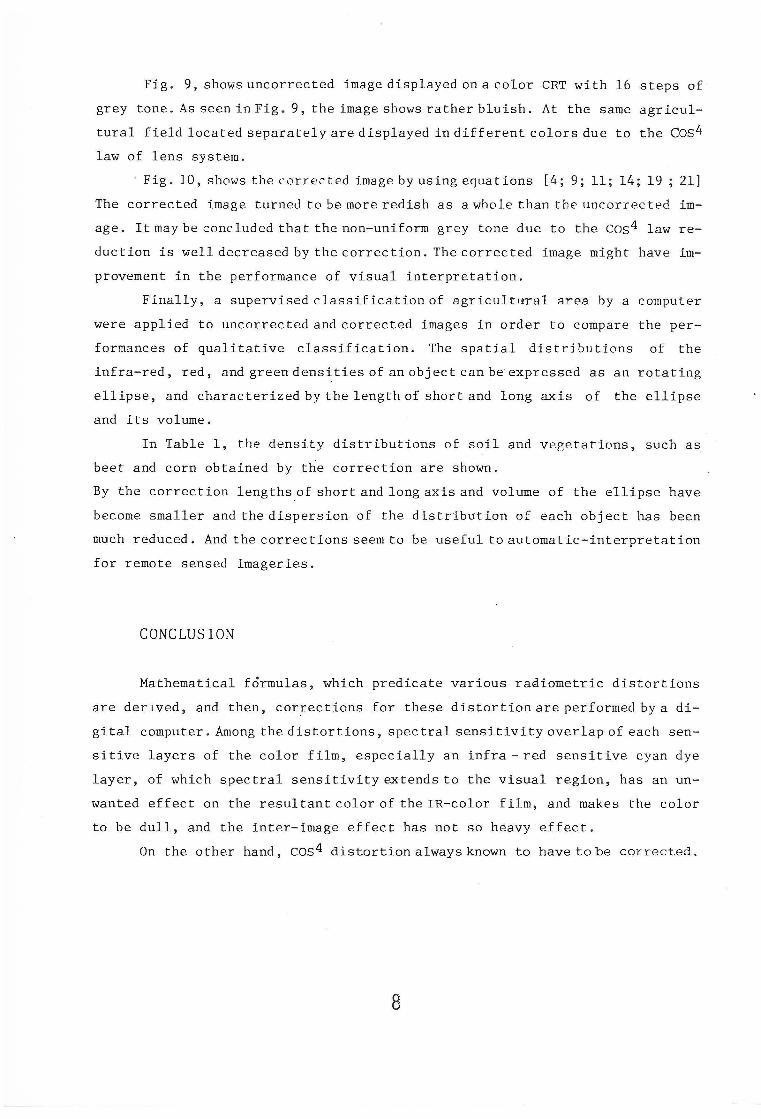
Fig. 9, shows uncorrected image displayed on a color CRT with 16 steps of
grey tone. As seen in Fig. 9, the image shows rather bluish. At the same agricul
tural field located separately are displayed in different colors due to the cos4
law of lens system.
• Fig. 10, shows the corrected image by using equations [4; 9; 11; 14; 19; 21]
The corrected image turned to be more redish as a whole than the uncorrected im
age. It may be concluded that the non-uniform grey tone due to the cos4 law re
duction is well decreased by the correction. The corrected image might have im
provement in the performance of visual interpretation.
Finally, a supervised classification of agricultttral area by a computer
were applied to uncorrected and corrected images in order to compare the per
formances of qualitative classification. The spatial distdbutions of the
infra-red, red, and green densities of an object can be expressed as an rotating
ellipse, and characterized by the length of short and long axis of the ellipse
and its volume.
In Table 1, the density distributions of soil and vegetations, such as
beet and corn obtained by the correction are shown.
By the correction lengths of short and long axis and volume of the ellipse have
become smaller and the dispersion of the distribution of each object has been
much reduced. And the corrections seem to be useful to automatic-interpretation
for remote sensed imageries.
CONCLUSION
Mathematical formulas, which predicate various radiometric distortions
are der~ved, and then, corrections for these distortion are performed by a di
gital computer. Among the distortions, spectral sensitivity overlap of each sen
sitive layers of the color film, especially an infra- red sensitive cyan dye
layer, of which spectral sensitivity extends to the visual region, has an un
wanted effect on the resultant color of theIR-color film, and makes the color
to be dull, and the inter-image effect has not so heavy effect.
On the other hand, cos4 distortion always known to have to be corrected.
8
Block di a~am or color nlm model havln& th e sp1t11l freqeuncy response a.
Figure 1.
Spectral Dye Density Curves
E u,-----,---,--N-e-w~t-r_a_l_1_1 __ ,
Ul z ~ ... 0
Wl\VELENGTII (nm)
( lnleTim3~cflecls J
Figure 3.
OD -lo· 2D 1D RELATIVE LOG EXPOSRE DENSITY
Fi gu r e 4 .
Figure 2
9
30! -----S-pectral Sf:nS1I1"1ty Cur~s
Magenta Formng Layer
20 Yellow Formrng Layer
Fitm:Type2443 >-
~ U1
~10
' ~~n Fcrmrg Layer
~bOO~~G~~~==R==~~;7;~;=====~~~~==~9?C WA . E LENGT'ocH-'I""n-=m-
1l--"-R _ _ _ ____,
Figure 5.
Olstr,blion of Refleclance
400 500 600 700 800 900 )._ (J'IM)
Equ1valenl Speclral Flo t
'"' Reflectance
II 1,00 500 600 700 800 900
h..lnll'l)
rigure G
CALCULAT ; ·It'
Figure 7
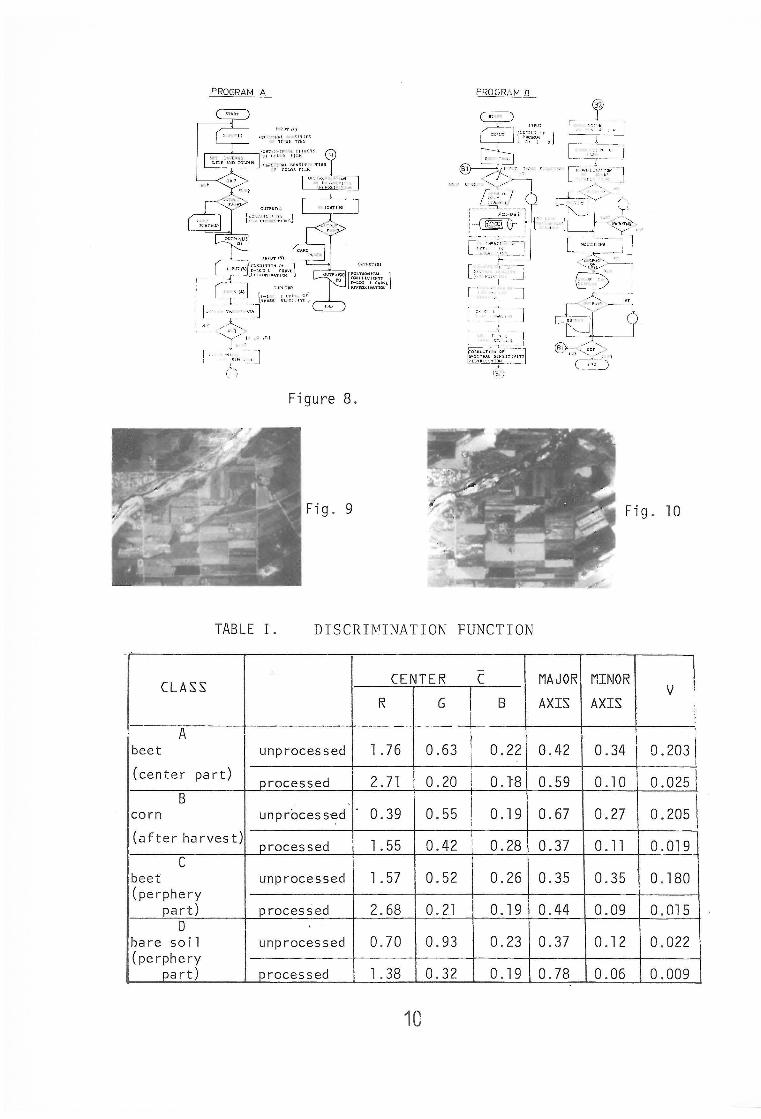
Figure 8 .
Fig . 10
TABLE I . DISCRIMINATION FUNCTION
CLASS CENTER c MAJOR MINOR \
I v
R G B AXIS AXIS
A
t
I 0 . 2031 beet unprocessed l. 76 0 .63 0 . 22 0 .42 0 . 34
(center part) processed 2. 71 0 . 20 i O.l8 0. 59 0 .1 0 0 .025\ I
B I 0. 205 \ corn unprocessed 0. 39 0 . 55 0 .1 9 0 . 67 0 . 27 i
(after harvest) processed l. 55 0. 42 I 0. 28 0 .37 0 .11 0 . 019
c beet unprocessed l. 57 0 . 52 0 . 26 0. 35 0 .35 0.1 80 (pe r phe r y
pa rt ) processed 2. 68 0. 21 0.1 9 0 .44 0 . 09 0 .015 D
ba re so il unprocessed 0. 70 0 . 93 0 . 23 0 .37 0 .1 2 0 . 022 (pe rph e ry
pa rt ) processed l. 38 0. 32 0 .1 9 0 . 78 0 .06 0 . 009
10