radiation doses and safety considerations medical college of georgia g. david, m.s., dabr associate...
TRANSCRIPT

Radiation Doses and Safety Considerations
Medical CollegeMedical Collegeof Georgiaof Georgia
G. David, M.S., DABR
Associate Professor of Radiology

Radiation SafetyWhom are we protecting?
Patient
Physicians & Staff
General Public
*

Patient Dose Factors / Considerations
Fluoroscopic exposure timeor
# of radiographic exposuresBeam parameters
IntensityPenetration
Distance from x-ray tubeBeam sizeSensitivity of exposed organs
damage threshold
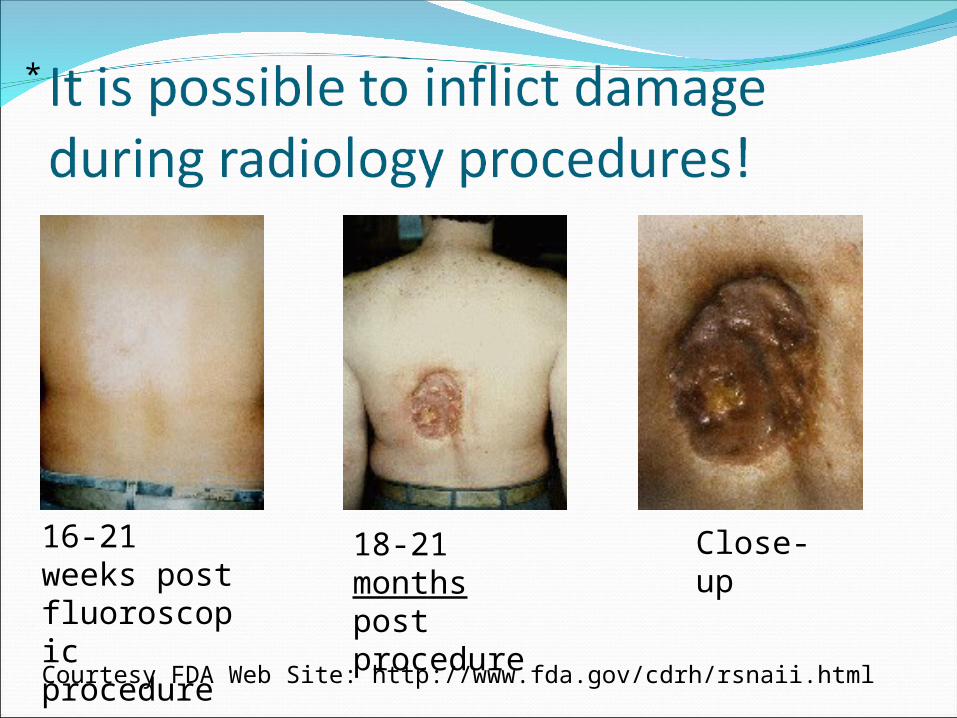
Courtesy FDA Web Site: http://www.fda.gov/cdrh/rsnaii.html
16-21 weeks post fluoroscopic procedure
18-21 months post procedure
Close-up
*

Prolonged fluoroscopy with cumulative dose >1500 rads to a single field
Each accredited health care organization is encouraged, but not required, to report to The Joint Commission any sentinel event meeting these criteria.

Patient Dose Depends Upon
patientthicknessbody part in beam
Operator-controlled factorsTechnique settingsmagnification modeoperational mode
normal / high doseCollimation (beam
size)
*****

Patient Dose -Exposure Time / # exposures
Fluoroscopypatient exposure proportional
to beam-on timeRadiography
# studies ordered# of films / study
Cine / angioLong fluoro timesMany images recorded
*

Beam Size (Collimation)Reduces volume of tissue irradiated
IITube
X-RayTube
IITube
X-RayTube

Minimizing Patient ExposureConsistent with clinical goals minimize
fluoroscopic beam-on time# of exposures
cine / angio fluoro times & imagesBeam size (as small as
clinically feasible)

Operator Protection Considerations
TimeDistanceShieldingCollimation

Operator Protection - TimeMinimize “beam-on” time
Your exposure is directly proportional to beam time

Operator Protection – Distance(“Inverse Square Law”)
Exposure rate falls off quickly with distanceIf distance doubles, exposure rate drops by 4
Exposure Rate Fall-off with Distance
0
10
20
30
40
50
60
70
80
90
100
0 1 2 3 4 5 6 7 8 9 10
Distance
Exp
osu
re r
ate
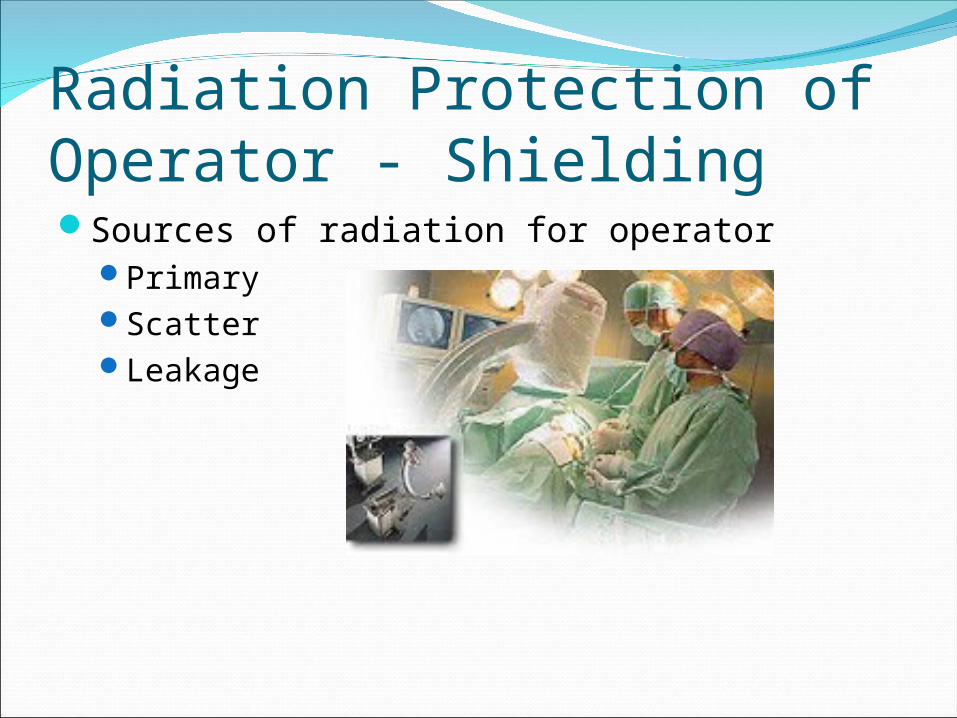
Radiation Protection of Operator - ShieldingSources of radiation for operator
PrimaryScatterLeakage

Primary X-Ray BeamBeam coming from
x-ray tubeOperator should
avoid primary beamkeep hands, etc.
out of primary beam area
Source of most patient exposure
IITube
X-RayTube
X
Primary Beam (High Intensity)

Scatter (Indirect) RadiationArises mostly from
patientEmitted in all directions
intensity varies Much lower intensity
than primarySource of virtually all
operator exposure
IITube
Table
Patient
X-RayTube
TV Camera

Leakage RadiationSome radiation leaks
through x-ray tube housing
Intensity much lower than scatterNegligible
contribution
IITube
Table
Patient
X-RayTube
TV Camera

Operator Protection - ShieldingShield between patient &
operator significantly reduces exposure to operator

Operator Protection - Shielding
ApronGlovesLead DrapesFace ShieldThyroid ShieldCeiling-mounted shield

CollimationReducing field size significantly reduces scatter
radiation Smaller scattering volume More shielding from patient
Image Receptor
X-RayTube
Image Receptor
X-RayTube

Minimizing Operator ExposureConsistent with clinical goals minimize time
fluoroscopic exposure timescine run lengths & frame rates
Use available lead protective apparel whenever possible.
Collimate as tightly as feasibleEducation

Protecting the General Public:Lead Shielding for x-ray Rooms
Physicist calculates shielding for each wall or barrier
Shielding requirement depends onWorkloadDistancesExam TypesUse of adjacent space

Radiation Risk CategoriesDeterministic (non-stochastic)Stochastic

Deterministic (non-stochastic) Radiation Risks
Effect has known threshold radiation dose
ExamplesErythemaCataract formation
Clearly addressed by regulations

Stochastic Radiation RisksRadiation affects probability of condition
which also occurs naturallyCause of condition cannot be determined
Severity of condition independent of doseExamples
Genetic effectsFetal abnormalitiesCancer

Stochastic EffectsPublished data based primarily
on high dosesRegulations based on a linear
model1/10,000 of the dose produces
1/10,000 the frequency of the effect
Linear model is controversial!!!

Background Radiation
EarthAirCosmicPeople

Threshold for Skin Effects from Radiation
300 radtemporary epilation
600 radmain erythema
1500-2000 radmoist desquamationdermal necrosissecondary ulceration
Reference: Triumf Safety Group

Threshold for Other Biological Effects from Radiation
Cataract induction200 rads
Acute radiation syndrome100-200 rads whole body irradiation
Permanent Sterility300-400 rads to gonads
females500-600 rads to gonads
males
Reference: Huda

Threshold for Other Biological Effects from Radiation
Fetal doses below 1 rad result in negligible congenital abnormalities
Risk from acute doses below 10 rads considered “small”Abortion not commonly
considered
Reference: Huda

Diagnostic Radiology Exposures Generally very low compared to
previous valuesGreatest concerns
Fetal doses
Angiography / cardiac cath / interventional studies
CT
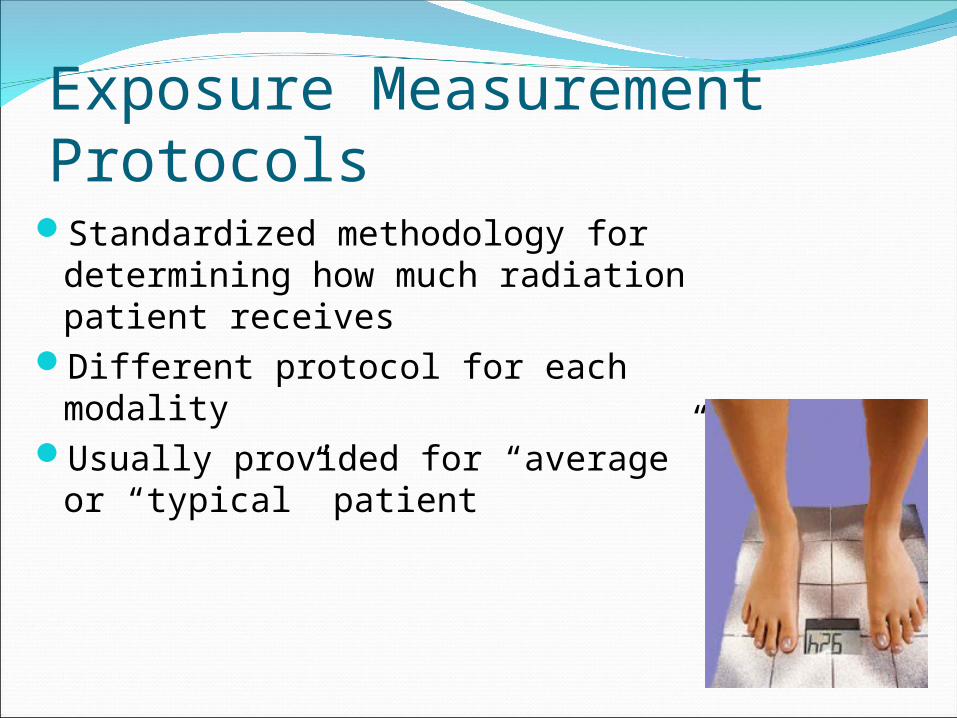
Exposure Measurement ProtocolsStandardized methodology for
determining how much radiation patient receives
Different protocol for each modalityUsually provided for “average” or
“typical” patient

Exposure Measurement Protocols
RadiograpyEntrance Skin Exposure (ESE)
MammographyMean glandular dose
CTCT dose index (CTDI)Dose length product (DLP)

Radiography / FluoroscopyEntrance Skin Exposure
Ionization measured where radiation enters patient
Does not address internal doses which depend uponBeam penetrabilityAbsorber
Tablet op
“Patient”R

Entrance Skin Exposures
PA Chest 10-20 mR Abdomen: ~300 mR

Entrance Skin Exposures
Elbow: ~20 mR
Hand ~ 20 mR
Femur ~ 200 mR
AP Skull ~ 150 mR

Comparison of Entrance Skin Exposure
0 50 100 150 200 250 300 350 400 450
Skull
C Spine
T Spine
L Spine
Pelvis
Abdomen (KUB)
Chest
Ribs (above diaph.)
Ribs (below diaph.)
Shoulder
Femur
Knee
Hand/Wrist
Elbow
Foot
Ankle
Finger/Toe
Humerus
mR
Entrance skin exposures.
Internal doses will be substantially less.
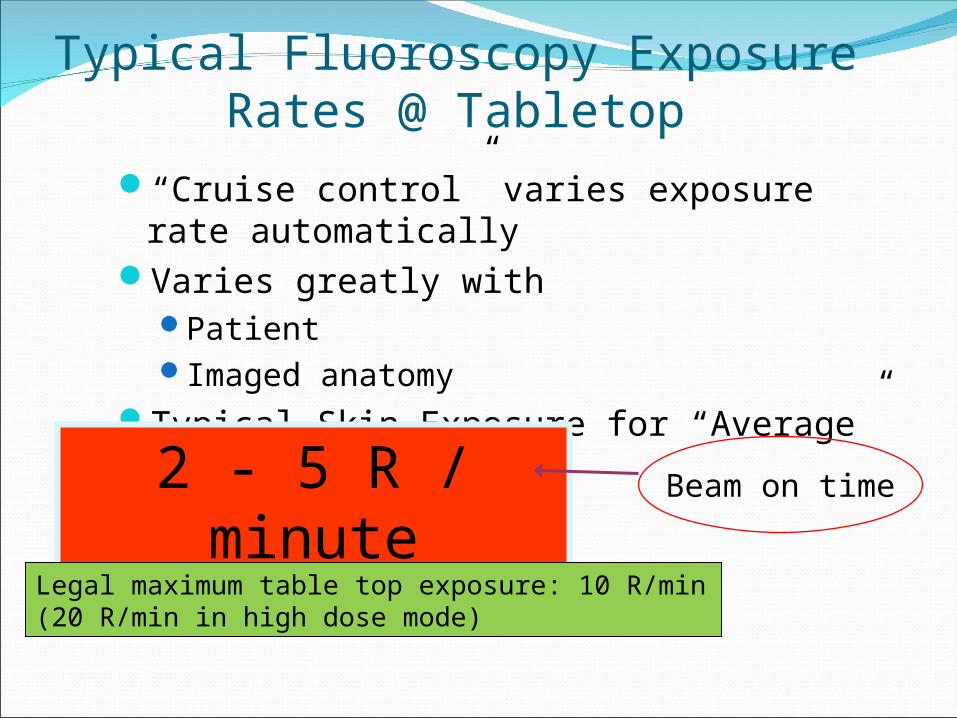
Typical Fluoroscopy Exposure Rates @ Tabletop
“Cruise control” varies exposure rate automatically
Varies greatly withPatientImaged anatomy
Typical Skin Exposure for “Average” patients2 - 5 R / minute Beam on time
Legal maximum table top exposure: 10 R/min (20 R/min in high dose mode)

Angiography / Interventional / Cardiology
Long fluoroscopic beam timesMultiple imaging exposures
Cine (cardiology)Subtraction images (Angiography)
Caution

Mammography Mean Glandular Dose (MGD)
Calculated from entrance skin exposure“Typical” breast assumptions
4.2 cm thick (accreditation phantom)Breast firmly compressedBreast composed of 50% adipose / 50%
glandular tissue average breast closer to 70% adipose / 30%
glandular tissue

Measuring Mean Glandular Dose (MGD)
Measure ESE with chamberCompression paddle
& accreditation phantom in place
MGD calculated from ESE
MammoTube
Compression Device
Breast Support
Image Receptor
Grid
Phantom
R

Mammography Mean Glandular Dose
LimitsACR
100 mrad w/o grid 300 mrad w/ grid
MQSA 300 mrad CC View FDA approved phantom
Typical~100 mrad (digital)

CT Patient DoseCT Patient Dose
Because tube rotates around patient, dose distribution different from radiography
Skull dose distributionFairly uniform
Body dose distributionDose to center of body ~ half of skin dose

CT Dose PhantomLucite5 holes
One centerFour in periphery
Comes in two flavors“Head”“Body”

CT Dose MeasurementChamber placed in one holeLucite plugs placed in remaining
4 holesSlice centered on phantomStandardize technique
kVpmAsscan timepitchbeam thickness
Chamber
Plugs

Measuring CT Dose“Pencil” ion chamber usedPencil pointed in “Z” direction
Dose Phantom
Chamber
Z
Beam

Typical CT Doses4 rads head2 rads bodySurface doses for
body scans may be 2X the dose at center

CT Usage
Annual growthU.S. Population: <1%CT Procedures: >10%
~ 67,000,000 procedures in 2006about 10% pediatric CT
Computed Tomography — An Increasing Source of Radiation ExposureDavid J. Brenner, Ph.D., D.Sc., and Eric J. Hall, D.Phil., D.Sc.
New England Journal of Medicine, 2007

Exposure Increase 1982-2006
60%
40%CT
Other
0
1
2
3
4
5
6
mSv
Total Medical
U.S. Per Capita Exposure
1982
2006
500% medical exposure increase
in 24 years

CT Usage16% of imaging
procedures
23% of total per capita exposure
49% of medical exposure

CT Causes Cancer?“On the basis of …data on CT use from 1991 through 1996, it has been estimated that about 0.4% of all cancers in the United States may be attributable to the radiation from CT studies…By adjusting this estimate for current CT use this estimate might now be in the range of 1.5 to 2.0%.”
Computed Tomography — An Increasing Source of Radiation ExposureDavid J. Brenner, Ph.D., D.Sc., and Eric J. Hall, D.Phil., D.Sc.
New England Journal of Medicine, 2007

CT Causes Cancer?In the United States, of approximately
600,000 abdominal and head CT examinations annually performed in children under the age of 15 years, a rough estimate is that 500 of these individuals might ultimately die from cancer attributable to the CT radiation.
Estimated Risks of Radiation-Induced Fatal Cancer from Pediatric CT;Brenner, Elliston, Hall, & Berdon; AJR-176 Feb. 2001

Other ModalitiesUltrasound
No known biological effects as used clinicallyGreatest concerns
Fetus Temperature elevation
MRINo known biological effects as used clinically