radiation damage at softer x-rays€¦ · radiation damage at softer x-rays . outline basis of...
TRANSCRIPT

Kristina Djinović Carugo
Dept. for Structural and Computational BiologyMax F. Perutz Laboratories
University of Vienna Austria
Radiation damage at softer X-rays

Outline
Basis of X-ray induced Radiation Damage
Radiation damage – physics, chemistry and biological aspects
How to prevent it
Energy dependent radiation damage effects

History
First reported study on radiation damage at room temperature on myoglobin crystals by Blake and Phillips was in 1962 Blake C, Phillips DC: Effects of X-irradiaton on single
crystals of myoglobin. In Proceedings of the Symposium on the Biological Effects of Ionisingradiation at the Molecular Level, Vienna 1962: 183–191.
Quotes: Damage is proportional to dose and might be
structurally specific.
Each absorbed 8 keV photon disrupted 70 molecules and disordered another 90.

History
Data collection at 100 K prolongs the crystal lifetime by a factor of 70, on in-house X-ray sources
Cryo-cooling becomes a routinely used in 90s
Advent of third generation synchrotron beamlines in late 1990s: radiation damage to cryocooled crystals increases
Pertinent problem/fenomenon in modern macromolecular crystallography

Interaction of X-rays with matter
Nuclearinteractions
Coherent scattering
Comptonscattering
Photoelectriceffect
Pairproduction
hincident
hSecondary photons
Secondary ionisation
Comptonelectron
Photoelectron
Augerelectron
and Z dependent
h h
h

Interaction of X-rays with matter
Coherent/Elastic/Rayleigh Scattering
Compton/Inelastic Scattering
Photoelectric Effect

Coherent/Elastic/Thompson Scattering
…this is the interaction exploited in diffraction methods…
in = out Rayleigh Scattering by particles much smaller than the wavelength
of the light Coherent/elastic scattering arises from the interaction of the X-rays
with the atom

Compton/Inelastic Scattering
Incoming photon is scattered incoherently on electrons, passing a small amount of energy to the electron (which is ejected).
Atom becomes ionised.
Compton shift:
in < out
Compton/Incoherent/ Inelastic Scattering

Emission of electrons from matter upon absorption of electromagnetic radiation (such as UV or X-rays).
Frequency of radiation must be above a certain threshold (specific to the type of material)
The X-ray photon is totally absorbed and a lower level core electron is ejected from the atom.
The excited atom or ion might release part of its extra potential energy through a complex cascade, in which the absorbing atom could become multiply ionized; emission of Auger electrons
Photoelectric effect
Photoelectric effect

Contribution of various processes
0
10
20
30
40
50
60
70
80
90
100
0 20 40 60 80 100 120 140 160 180 200
CoherentComptonPhotelectric
Incident photon energy (keV)
% o
f ev
ents
for
wat
er
keV=12.398/(Å) E h hc/
Each photoelectron can result in the production of up to 500 secondary lower energy electrons, which then cause further damage
8%, 8%, 84% @ 12.4 keV

Interaction of X-rays with matter
X-rays are ionizing radiation
Generation of electrons, ions, secondary ionization events and free radicals

Radiation damage Result of interaction of matter and electromagnetic
radiation in X-ray regime via: Photoelectric effect (84%) Compton/inelastic scattering (8%)
Photoelectron scatters inelastically off surrounding atoms, creating several hundred secondary electrons and positively charged centers
Secondary electrons are mobile at 100K and directed to high affinity, electron-deficient functional groups causing specific secondary damage

Primary and secondarydamage
Radiation damage initiated by ‘primary’ interactions between the molecules in the crystal and the beam (Photoelectric Effect and Compton Scattering).
Dose dependentnot uniformly distributed within the sample,
deposited in regions called spurs
‘Secondary’ damage: comes from the secondary ionisation events and reactive radicals generated from the polypeptide chain or water molecules by the primary events. The radicals diffuse through the crystal causing a cascade of further damage.
Time and temperature dependent

AT ROOM TEMPERATURE:Primary damage/event: femtoseconds
after exposure
Breakage of S-H, O-H, N-H and C-H bonds, formation of reactive species such as solvated electrons, hydroxyl and hydrogen radicals within the spurs: picosecond timescale
Secondary damage: breakage of bonds within the macromolecule and generation of other radicals: microsecond to millisecond
How fast does damage occur?

How fast does damage occur?
AT 100K:
Reactive species are formed, hydroxyl radicals are still mobile. Diffusion is limited → secondary damage is slowed down, but also occurs in frozen crystals on brilliant beamlines at synchrotron sources.
Primary damage is inherent to the use of ionizing radiation and will eventually damage every sample. But secondary damage leads to specific structural effects, and should be minimized…

Radiation damage indicators/symptoms
Global radiation damage indicators Loss of diffraction quality, and of high resolution
reflections Increase of Rmeas
Increased sample mosaicity Increase of Wilson B factor Increase in unit cell volume Colour changes in the irradiated volume of the
crystal Non-isomorphism for MAD data sets (the molecule
might undergo small rotations and/or translations) Upon warming cryocooled crystals invariably
‘bubble’, releasing trapped gas: H2, CO2
(after Elspeth Garman’s website)
Time

Radiation damage indicators
Specific structural effects: secondary lower energy electrons are mobile at cryotemperatures and can migrate to the sites of highest affinity
Breakage of disulfide bonds Metal centers reduction Decarboxylation of acidic residues (Asp and Glu) Loss of electron density for hydroxyl groups of
tyrosines and methylthio groups of methionines
Solvent accessibility: is some studies correlation between SSA of residue and RD susceptibility – not conclusive
Active site residues and metal centers are among the most radiation-sensitive
Time

Specific damage
AcetylcholinesteraseWeik et al. PNAS, 97 (2), 623-628(2000)
Owen R et al., PNAS, 103 (13), 4912-4917 (2006)

Dose: deposited energy/mass [J/kg; Gy]
Depends on Beam parameters (size, flux and profile) Crystal size Crystal constituents
Can be calculated e.g. by RADDOSE
D=dose λ=wavelengthV=volume of crystalμ = abs. coefficientt = path length in beam Io = incident beam intensity
N - number of atoms per unit V– total absorption cross section = 2 f’’

Dose limits for protein crystals
There is a maximum amount of photons/cell volume that a crystal can handle before the crystalline diffraction is lost.
Dose at which the diffracted intensity of a cryocooledprotein crystal drops to half (proposed from electron diffraction experiments):
Henderson's limit 2x10⁷ Gray (JKg-1) Henderson, R. (1990) Proc. R. Soc. London Ser. B 241,
6–8.
At a 3rd synchrotron generation source this limit can be reached with 200-400 seconds exposure….

Dose limit for protein crystals: experimental determination
Experimental dose evaluation E. Garman PNAS (2006), 134912-4917
Dose limit: 4.3x10⁷ Gy Considering a number of data quality indicators, an intensity reduction to
Iln2 = ln2 x I0 (=0.7 x I0)
Dose limit recommended for typical protein crystallography experiments : 3x10⁷ Gy
Does it make a difference if a certain dose is delivered over a short or long time interval? At 100K: no correlation of dose versus dose-rate At RT: faster dose rate, better tolerance: Garman at el. 2011

Metrics ID/I1 where ID is the summed mean intensity
(Imean) of a complete data set (or equivalent sections of data) after a dose D and I1 is the mean intensity of the first data set
V Volume of the unit cell

Metrics Rd
the pairwise R factor between identical and symmetry-related reflections occurring on different diffraction images, plotted against the difference in dose, D (Diederichs, 2006)

Metrics B factor
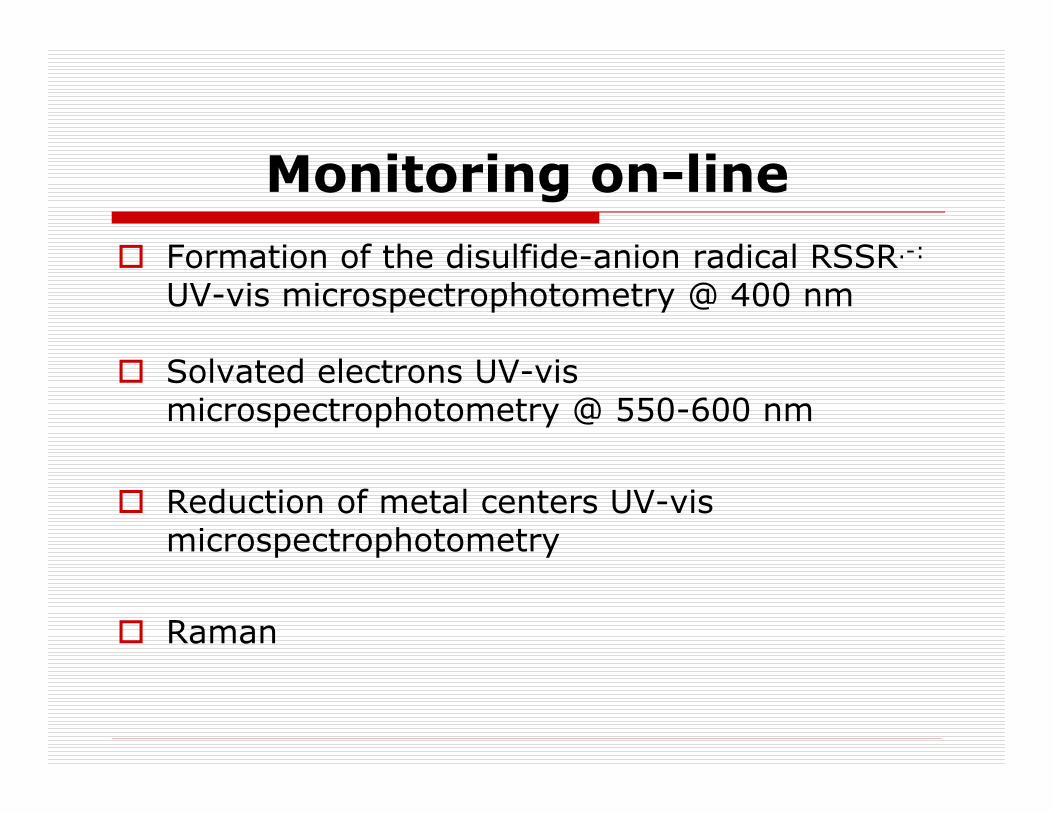
Monitoring on-line Formation of the disulfide-anion radical RSSR.-:
UV-vis microspectrophotometry @ 400 nm
Solvated electrons UV-vismicrospectrophotometry @ 550-600 nm
Reduction of metal centers UV-vismicrospectrophotometry
Raman

Alleviating Radiation Damage
Addition (soak into crystals) of radio-protectants (electron and radical scavengers) Ascorbate, nicotinic acid, 5,5'-dithio-bis-(2-
nitrobenzoic acid) (DTNB), NaNO3,… Not a standard approach
Cooling X-tals at 100 K during data collection Reduce diffusion of free radicals
Act on secondary damage effects Standard since beginning of 90s T lower than 100 K
Energy of radiation

Cooling crystals to 100 K or lower?
Diffusion is limited → secondary damage is slowed
Cooling from RT to 100 K improves dose tolerance by a factor of 70
Crystal heating by the beam is NOT responsible for radiation damage at cryotemperatures.
Some improvement at 50 K observed with EXAFS/XANES on metals reduction (Grabolle, JBC 2005; Corbett, ActaD 2007)
At 50 K, specific radiation damage to disulfide bridges is reduced by a factor of 4 compared to 100 K and dose toleration increased by a factor 2.6-3.9 (Meents, PNAS 2009)
No compelling evidence that helium cooling gives significant improvement in crystal lifetime (Meents, PNAS 2009)

T lower than 50 K ? Damage to the crystal lattice at temperatures of 50 K
(left) are higher at 30 K (right)
50–160 K, the hydrogen formed inside the sample as a result of x-ray irradiation can diffuse inside the crystal. Accumulates at lattice imperfections macromosaicity
At 30K it is trapped micro-cracs and loss of loss of short range order

Effects of different X-ray energies
Is there and optimal energy for MX experiments?
Is there an optimal energy to minimize RD?
Experimental and theoretical approaches

Is there and optimal energy for MX experiment?
The Ultimate Wavelength for Protein Crystallography? (Polikarpov, ActaD 1997)
No optimal energy, it depends on the crystal size
Aim of experiment design to: Increase integrated diffraction I and decrease
absorption
Optimize ratio between integrated diffraction I and energy of absorbed X-ray photons (diffraction efficiency)

Is there and optimal energy for MX experiment?

Is there and optimal energy for MX experiment?
0.9 Å shall be is sufficiently short to minimize radiation damage
1.3-1.6 Å for smaller crystals
Soft X-rays (2.5 Å) combined with microcrystals (20 µm) – factor 8.8 gain in diff. beam E

Optimal wavelength (in the absence of RD)
On the Choice of an Optimal Wavelength in Macromolecular Crystallography. Tepliakov ActaD 1998
Integrated diffraction intensity depends on:

Optimal wavelength (in the absence of RD)
A series of experiments at 0.9 and 1.3 Å, crystal dimensions (0.4x0.4x0.2mm, 0.5x0.5x0.25 mm, 0.2x0.2x0.2 mm)
Higher quality of the data can be achieved by using the wavelengths of 1.1- 1.3 Å or even 1.5 Å as compared with 0.8 Å - 0.9 Å
λ > 1.1 Å particularly advantageous for small X-tals – small absorption

Effect of λ on specific RD effects
On the influence of the incident photon energy on the radiation damage in crystalline biological samples. Weiss JSR 2005
Series of datasets collected at 1.0 and 2.0 Å on Cd derivative of porcine pancreatic elastase (PPE)
Assessment: Based on difference Fourier syntheses between
datasets with increased absorbed dose – neg. el. density shows RD susceptible sites: Cys, Cd, Met

Effect of λ on specific RD effects
2 Å 1 Å
Effect of λ on specific RD effects
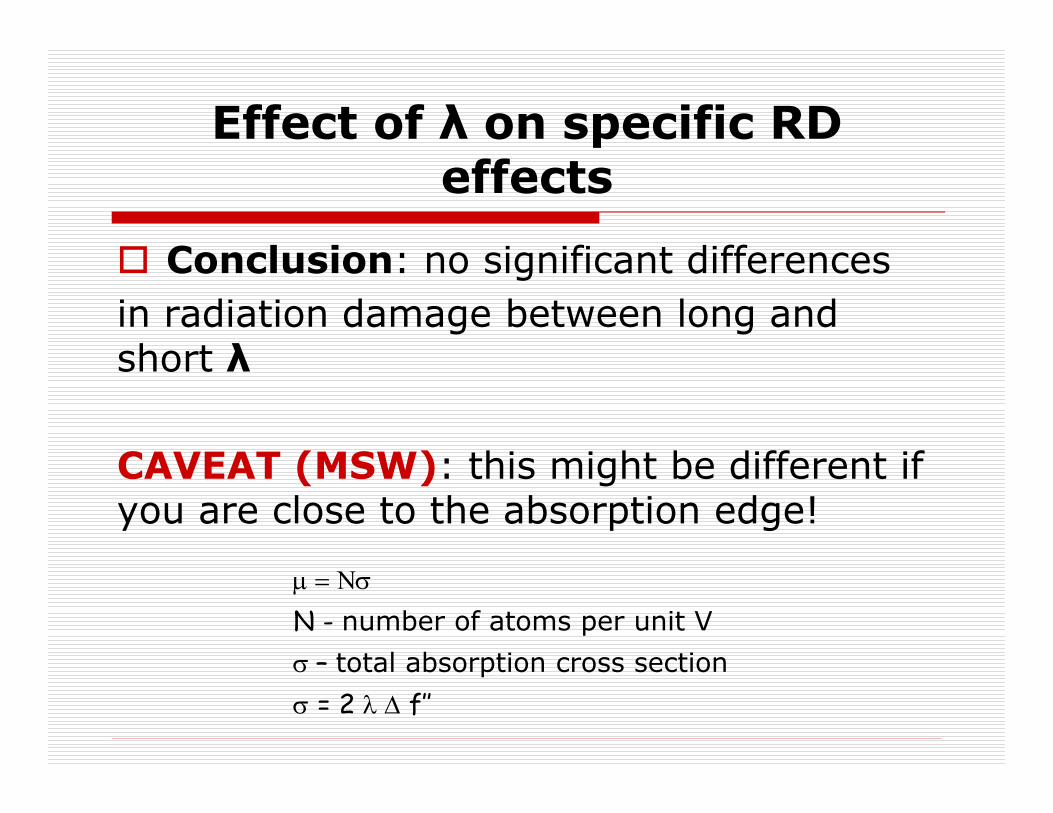
Conclusion: no significant differencesin radiation damage between long and short λ
CAVEAT (MSW): this might be different if you are close to the absorption edge!
N - number of atoms per unit V– total absorption cross section = 2 f’’

Effect of λ on global RD effects
Dose dependence of radiation damage for protein crystals studied at various X-ray energies. Shimizu, JSR 2007 X-ray energies (6.5, 7.1, 8.3, 9.9, 12.4, 16.5, 20.0, 24.8
and 33.0 keV

Effect of λ on global RD effects
Using global indicators (Rmerge, B-factors, I/σ(I):
Conclusion: RD NOT depended on photon E, but only on absorbed dose

Optimal wavelength for best anomalous signal-to-noise ratio On the routine use of soft X-rays in
macromolecular Crystallography P-II. Mueller-Dieckmann, ActaD 2005
10 different systems (protein, DNA)
Range 0.80 and 2.65 Å
Monitor: magnitude of the anomalous signal-to-noise ratio
Assessment: quotient Ranom/Rr.i.m.

Optimal wavelength for best anomalous signal-to-noise ratio
Estimated anomalous diffraction ratio ∆F/F as a function of the wavelength:
||2
21
"max,
T
A
FfN
FF i
∆F/F used in experiments

Optimal wavelength for best anomalous signal-to-noise ratio Assessment: quotient Ranom/Rr.i.m.

Optimal wavelength for best anomalous signal-to-noise ratio
Almost independent of the nature of the anomalously scattering substructure and provided that no elemental X-ray absorption edge is nearby:
Conclusion: Optimal wavelength is2.1 Å

Effect of λ on rate of specific RD effects
Energy dependence of site-specific radiation damage in protein crystals. Homer, JSR, 2011
Lysozyme, 9 keV or 14 keV, 3-26 MGy of cumulative X-ray dose
Assessment: electron density surrounding S

Effect of λ on rate of specific RD effects
Conclusion: Rate of electron density decrease per cubic Å per MGy was determined to be greater at 14 keV than at 9 keV for cysteine sulfurs involved in S-S bridges, Met much less affected

What to do with λ? Optimised anomalous signal-to-noise:
2.1 Å
As RD does not depend critically on λ, but integrated diffraction intensity does regime 1.1 – 1.5 Å

What to do with/against RD Do not fry crystals Strategy programs, e.g. BEST for determination
of the best data-collection strategy
Use of electron and radical scavengers: “quick soak for a long life of the crystal” (MSW) Ascorbic acid 5,50- dithio-bis-2-nitrobenzoic acid [DTNB] Nicotinic acid…. NaNO3 …will NOT prevent metal reduction

What to do with/against RD
Liquid helium based cooling at 50K which can drastically reduce the metal reduction rate – XAS exp. And reduced global RD effects
Correction of intensities of reflections using data by Zero-dose extrapolation (in xscale/XDS) K. Diederichs et al. Acta Cryst. (2003). D59, 903-909
Composite/multi-crystal data-collection One crystal one shot (at random orientation)

What to do Composite/multicrystal data-collection
Complete datasets are collected from multiple (shots of) crystals starting at different oscillation angles. Composite datasets represent structures that received different X-ray doses.

What to do Careful monitoring and analysis of data
during and after data-collection Global indicators Decay R-factor Xdsstat
K. Diederichs Acta Cryst. (2006). D62, 96–101

Make it work for you RIP on S and Se
Inform reaction mechanism

“X-ray titrations” of horseradish peroxidase
Nature 417, 463-468