radiation characteristics and effective optical properties ...pilon/publications/jqsrt2016... ·...
TRANSCRIPT

Contents lists available at ScienceDirect
Journal of Quantitative Spectroscopy &Radiative Transfer
Journal of Quantitative Spectroscopy & Radiative Transfer 174 (2016) 65–78
http://d0022-40
n CorrE-m
journal homepage: www.elsevier.com/locate/jqsrt
Radiation characteristics and effective optical propertiesof dumbbell-shaped cyanobacterium Synechocystis sp.
Ri-Liang Heng, Laurent Pilon n
Mechanical and Aerospace Engineering Department, Henry Samueli School of Engineering and Applied Science, University of California,420 Westwood Plaza, Eng. IV 37-132, Los Angeles, CA 90095, USA
a r t i c l e i n f o
Article history:Received 30 July 2015Accepted 19 January 2016Available online 25 January 2016
Keywords:Radiative transferScattering measurementsTurbid mediaInverse scatteringOptical constants
x.doi.org/10.1016/j.jqsrt.2016.01.02373/& 2016 Elsevier Ltd. All rights reserved.
esponding author. Tel.: þ1 310 206 5598; faail address: [email protected] (L. Pilon).
a b s t r a c t
This study presents experimental measurements of the radiation characteristics of uni-cellular freshwater cyanobacterium Synechocystis sp. during their exponential growth in Fmedium. Their scattering phase function at 633 nm average spectral absorption andscattering cross-sections between 400 and 750 nmwere measured. In addition, an inversemethod was used for retrieving the spectral effective complex index of refraction ofoverlapping or touching bispheres and quadspheres from their absorption and scatteringcross-sections. The inverse method combines a genetic algorithm and a forward modelbased on Lorenz–Mie theory, treating bispheres and quadspheres as projected area andvolume-equivalent coated spheres. The inverse method was successfully validated withnumerically predicted average absorption and scattering cross-sections of suspensionsconsisting of bispheres and quadspheres, with realistic size distributions, using the T-matrix method. It was able to retrieve the monomers' complex index of refraction withsize parameter up to 11, relative refraction index less than 1.3, and absorption index lessthan 0.1. Then, the inverse method was applied to retrieve the effective spectral complexindex of refraction of Synechocystis sp. approximated as randomly oriented aggregatesconsisting of two overlapping homogeneous spheres. Both the measured absorptioncross-section and the retrieved absorption index featured peaks at 435 and 676 nm cor-responding to chlorophyll a, a peak at 625 nm corresponding to phycocyanin, and ashoulder around 485 nm corresponding to carotenoids. These results can be used tooptimize and control light transfer in photobioreactors. The inverse method and theequivalent coated sphere model could be applied to other optically soft particles of similarmorphologies.
& 2016 Elsevier Ltd. All rights reserved.
1. Introduction
Photosynthetic microorganisms use sunlight as theirenergy source and carbon dioxide as their carbon source.They can be cultivated to produce a variety of valuableproducts such as nutritional supplements, natural dyes,
x: þ1 310 206 2302.
cosmetics, biofuels, and fertilizers [1,2]. In addition, theycan be used to treat wastewater [2] and to reduce carbondioxide emissions from industrial exhaust gases [3].However, key advances in cultivation systems and biomassharvesting methods are required to improve productivityand make the technology cost effective [4].
The unicellular freshwater cyanobacterium Synecho-cystis sp. PCC 6803 has been considered for biofuel pro-duction [5]. It was the first photosynthetic organismwhose entire genome was sequenced due to the

Fig. 1. Micrographs of (a) a free floating dumbbell-shaped Synechocystissp. cell with two lobes of radius rs;1 and rs;2 of about 1 μm and (b)Synechocystis sp. immediately after cell division. Reproduced with per-mission from Prof. Yuuji Tsukii (Hosei University, http://protist.i.hosei.ac.jp/).
R.-L. Heng, L. Pilon / Journal of Quantitative Spectroscopy & Radiative Transfer 174 (2016) 65–7866
similarities between its photosynthetic apparatus and thatof higher plants [6]. It is widely used as a standard instudies involving photosynthesis, environmental stressresponse, pigment synthesis, lipid production, and othermetabolic processes [6–9]. Synechocystis sp. contain dif-ferent photosynthetic pigments including Chlorophyll a(Chl a), phycocyanin (PCCN), as well as photosynthetic(PSC) and photoprotective (PPC) carotenoids [10]. Eachtype of pigments possesses its own absorption spectraenabling the microorganisms to absorb photons in thephotosynthetically active radiation (PAR) region rangingfrom 400 to 700 nm [11]. This species has also beengenetically engineered with reduced light harvesting pig-ments (particularly PCCN), to increase their energetic yield
per cell [5]. Fig. 1a shows a micrograph of dumbbell-shaped Synechocystis sp. cells approximately 2 μm inlength and resembling overlapping bispheres. Fig. 1bshows a micrograph of Synechocystis sp. immediately afterfission when the cell divides into two identical daughtercells and resembling quadspheres [12].
Photosynthetic microorganisms are typically cultivatedin open or closed photobioreactor (PBR) systems. Theproductivity of these systems is severely hampered by lowlight energy conversion efficiencies [13]. Indeed, incidentlight is rapidly attenuated in the culture due to lightabsorption and scattering by the microorganisms, result-ing in inhomogeneous light distribution. In regions of thePBRs directly exposed to sunlight, the light intensity maybe excessively high causing photoinhibition [14]. On theother hand, deeper in the PBR, light intensity may be toosmall to drive photosynthesis or even respiration. Bothphenomena result in low photosynthetic efficiency and ina significant decrease in the overall PBR productivity.Therefore, PBR design and control must be improved sothat light can be utilized as efficiently as possible. In orderto do so, analytical tools modeling coupled light transfer,hydrodynamics, and growth kinetics have been developed[15–17]. In all these models, the spectral radiation char-acteristics of the photosynthetic microorganisms areessential input parameters.
The present study aims to measure the radiation char-acteristics of Synechocystis sp. during exponential growth.It also aims to develop an inverse method able to retrievethe effective spectral complex index of refraction of Syne-chocystis sp. and other particles with complex touching oroverlapping bisphere and quadsphere morphologies fromtheir absorption and scattering cross-sections.
2. Background
2.1. Light transfer
The spectral radiation intensity Iλðr; sÞ (in W/m2 sr nm)along the direction s at location r and wavelength λ inhomogeneous, absorbing, scattering, and non-emittingmicroorganism suspensions satisfies the radiative trans-fer equation (RTE) expressed as [18]
s �∇Iλ r; s� �¼ �κλIλ r; s
� ��σs;λIλ r; s� �
þσs;λ
4π
Z4πIλ r; s i� �
ΦT ;λ s i; s� �
dΩi ð1Þ
where κλ and σs;λ are the effective spectral absorption andscattering coefficients of the suspension (in m�1),respectively. In addition, the extinction coefficient isdefined as βλ ¼ κλþσs;λ. The scattering phase functionΦT ;λðs i; sÞ represents the probability that light propagatingin the solid angle dΩi along direction s i be scattered intothe solid angle dΩ along direction s. It is normalized suchthat
14π
Z4πΦT ;λ s i; s
� �dΩi ¼ 1: ð2Þ
In addition, the asymmetry factor gλ for an axisymmetric

R.-L. Heng, L. Pilon / Journal of Quantitative Spectroscopy & Radiative Transfer 174 (2016) 65–78 67
phase function is defined as [18]
gλ ¼12
Z π
0ΦT ;λ θ
� �cos θ sin θ dθ ð3Þ
where θ is the scattering angle between directions s i ands.
The average absorption Cabs;λ and scattering Csca;λ cross-sections (in m2) of a suspension of polydisperse micro-organism cells can be related to the spectral absorption κλand scattering σs;λ coefficients according to [18]
Cabs;λ ¼κλNT
and Csca;λ ¼σs;λ
NTð4Þ
where NT is the cell number density defined as the numberof cells per m3 of suspension.
2.2. Radiation characteristics of photosyntheticmicroorganisms
The absorption and scattering cross-sections and thescattering phase function of photosynthetic microorgan-isms in the PAR region depend onwavelength as well as ontheir morphologies, size, and composition. They can bedetermined either experimentally or numerically. Previousexperimental studies have focused on randomly orientedquasi-spherical microalgae [18,19] and filamentous cya-nobacteria [20,21]. However, the experimental methodpreviously used by Pilon and co-workers [21–23] for var-ious microalgae and cyanobacteria species is not limited toany specific shape and can also be used for Synechocystissp., as discussed later in this paper.
Numerical predictions of the radiation characteristics ofphotosynthetic microorganisms have typically treatedthem as homogeneous spheres [19,24–31]. They predictedtheir radiation characteristics based on their size dis-tribution and a model or experimental estimate of theireffective complex index of refraction. Then, their radiationcharacteristics can be calculated using fast analyticalsolutions such as the Lorenz–Mie theory [32] or theanomalous diffraction approximation [33]. Numericalmethods, such as the T-matrix method [34], can alsocompute the radiation characteristics of scatterers withcomplex shapes such as (i) unicellular photosyntheticmicroorganisms with non-spherical shapes (e.g., spher-oidal [35] and bisphere [36]), (ii) multicellular micro-organisms (e.g., filamentous cyanobacteria [21]), and (iii)fractal colonies of unicellular spherical microalgae [37].However, these methods can be time-consuming, com-putationally intensive, and limited to a certain range ofsize parameters [36]. Alternatively, photosynthetic micro-organisms of complex morphology, including many cya-nobacteria, could be treated as equivalent scattering par-ticles with simpler shape including infinitely long cylin-ders and coated spheres [24,25,31,35,36] whose radiationcharacteristics can be computed relatively simply [38–40].For example, Lee and Pilon [41] reported that randomlyoriented filamentous cyanobacteria consisting of linearchains of optically soft spheres could be modeled as ran-domly oriented volume-equivalent infinitely long cylin-ders for the purpose of predicting their integral radiationcharacteristics, namely κλ, σs;λ, and gλ. Similarly, Heng
et al. [36] demonstrated that the integral radiation char-acteristics of randomly oriented multicellular cyano-bacteria with morphologies of bispheres, quadspheres, andrings of spheres could be approximated as those ofequivalent coated spheres with identical volume andaverage projected area. Kandilian et al. [37] demonstratedthat this approximation was also valid for randomlyoriented fractal colonies of spherical unicellular micro-algae. This approximation leads to significant savings incomputational time and resources compared withnumerical predictions using the T-matrix method.
Regardless of the numerical method or approximateformulation, the effective complex index of refraction ofmicroorganisms is essential to compute the radiationcharacteristics. Although the cells were actually hetero-geneous in nature, most studies have treated photo-synthetic microorganisms as homogeneous spheres withsome effective optical properties [19,24–31,35–37,41]. Aas[28] estimated the effective refractive index (real part) ofphytoplankton cells from their metabolite composition byusing a volume-weighted average of the refractive indicesof the various constituents including proteins, carbohy-drates, water, and lipids. Pottier et al. [29] predicted thespectral absorption index (imaginary part) of Chlamydo-monas reinhardtii as a weighted sum of the absorptionindices of the major algal pigments and assumed theirrefractive index to be constant and equal to 1.527. Morerecently, Dauchet [42] used the same method as Pottieret al. [29] to estimate kλ but predicted nλ, on a spectralbasis, using subtractive Kramers–Kronig relationshiprelating nλ to kλ.
Alternatively, the effective complex index of refractionof microorganisms has been retrieved from experimentalmeasurements of their absorption and scattering cross-sections using inverse methods [21,26,31,43]. Here also,treating the microorganism cells as simple equivalentscattering particles, in order to compute their radiationcharacteristics, is essential since the forward problem hasto be solved numerous times. For example, Bricaud andMorel [26] predicted the effective complex index ofrefraction of phytoplanktonic cells by treating them ashomogeneous spheres, based on the anomalous diffractionapproximation. The absorption coefficient was describedas a continuous and monotonic function of the effectiveabsorption index for given wavelength and particle sizedistribution. Then, the spectral absorption index of thecells was determined by iteration until the computedspectral absorption coefficient agreed with the experi-mentally measured value. The retrieved refractive andabsorption indices were used as input parameters into theLorenz–Mie theory. Subsequently, the spectral refractiveindex of the cells was obtained by iteration until thecomputed spectral extinction coefficient matched theexperimentally measured value. On the other hand, Leeet al. [31] developed an inverse method combining geneticalgorithm (GA) [44] and the Lorenz–Mie theory [32] toretrieve simultaneously the refractive and absorptionindices of various quasi-spherical microalgae. Similarly,Heng et al. [21] combined GA with electromagnetic wavetheory for randomly oriented and infinitely long cylinders[45,46] to retrieve the effective complex index of refraction
R.-L. Heng, L. Pilon / Journal of Quantitative Spectroscopy & Radiative Transfer 174 (2016) 65–7868
of filamentous cyanobacteria Anabaena cylindrica fromtheir experimentally measured absorption and scatteringcross-sections.
The objective of the present study is to experimentallymeasure the absorption Cabs;λ and scattering Csca;λ cross-sections as well as the phase function ΦT ;λðs i; sÞ of ran-domly oriented Synechocystis sp. under exponentialgrowth. It also aims to develop an inverse method toretrieve the effective spectral complex index of refractionof photosynthetic microorganisms with complex bisphereand quadsphere shapes. The feasibility of the inversemethod was demonstrated using numerically predictedabsorption and scattering cross-sections of polydispersebispheres and quadspheres obtained by the T-matrixmethod for different cell size distributions and complexindex of refraction. Then, it was applied to the measuredabsorption and scattering cross-sections and size dis-tribution of Synechocystis sp. cells approximated as twooverlapping and homogeneous spherical monomers.
3. Experimental methods
3.1. Cultivation and sample preparation
The unicellular cyanobacterium Synechocystis sp. PCC6803 was cultivated in F medium [47] in 250 ml culturebottles fitted with vented caps and illuminated from oneside by a continuous photosynthetic photon flux density of91 μmolhν m�2 s�1 provided by fluorescent light bulbs(GroLux by Sylvania, USA). The culture was maintained at30 °C throughout the growth and the cell number densityNT (in /m3) was measured daily using an automatic cellcounter (Nexcelom Cellometer Auto M10). To do so, 20 μLsamples were pipetted from the cultures into disposablehaemocytometers (Nexcelom CHT4-SD100). The devicecounted the number of cells per unit volume NT using 2Dmicrographs. Prior to taking a sample, the culture wasshaken manually to ensure that it was well-mixed and thatthe sample was representative of the entire culturevolume.
Six days after inoculation, the cultures were observedto be in their exponential growth phase based on celldensity measurements. Then, the suspension was thor-oughly shaken and samples of 3 ml were collected tomeasure their radiation characteristic measurements. Toprevent possible absorption and scattering by F medium,the samples were centrifuged at 2000 rpm (1300 g) for8 min. Then, the supernatant was replaced with non-absorbing phosphate buffer saline (PBS) solution and thesamples were lightly vortexed to resuspend the Synecho-cystis sp. cells.
3.2. Size distribution
In order to characterize the size distribution of Syne-chocystis sp., micrographs of the cells were captured usinga 100� Leica inverted microscope connected to a CCDcamera. We considered Nsp¼252 cells and manuallymeasured (i) the radii rs;1 and rs;2 of the two lobes in eachcell and (ii) the distance dsp separating the lobes' centers
using the image analysis software ImageJ, as illustrated inFig. 1a. Only the cells whose dumbbell shape could beeasily discerned were selected for measurements. Themorphology of the cells was simplified to that of bispheresconsisting of two identical overlapping spherical mono-mers of radius rs ¼ ðrs;1þrs;2Þ=2 (Fig. 3a). These measure-ments led to the frequency distributions f b;expðrsÞ andf d;expðdspÞ of the bisphere approximating Synechocystis sp.
3.3. Radiation characteristics measurements
The following assumptions were made in measuringthe scattering phase function and the average spectralabsorption and scattering cross-sections of Synechocystissp.: (1) the suspension in the samples were well mixedand the cells were randomly oriented. Thus, the suspen-sion had azimuthally symmetric phase function dependingonly on polar angle θ. (2) Single scattering prevailed due tothe low cell number densities considered. (3) The scatter-ing phase function of Synechocystis sp. cells was assumedto be constant over the PAR region [22], and (4) largelyforward scattering because of their large size parametersin the PAR region.
The experimental setup, data analysis, and validationwith latex microspheres were reported in detail by Pilonand co-workers [18,20,22,48] and need not be repeated. Inbrief, the scattering phase function ΦT ;λðθÞ of the Syne-chocystis sp. suspension was measured with a polarnephelometer equipped with a laser at 633 nm. Due toobstruction by the probe, the scattering phase function forscattering angles θ beyond 160° in the backward directionwas not reported. Normal–normal transmittance of themicroorganism suspension, denoted by Tn;λ, was measuredin cuvettes of pathlength t¼1 cm using a UV–VIS spec-trophotometer (Shimadzu, USA, Model UV-3103PC) from400 to 750 nm with 1 nm spectral resolution [48]. Thesemeasurements were calibrated using the transmittance ofthe reference medium (i.e., PBS), denoted by Tn;λ;ref , inorder to correct for reflection and refraction by the cuvette.These measurements were used to determine the extinc-tion coefficient βλ of the suspension. The data analysiscorrected for the fact that a fraction of the light scatteredin the forward direction was captured by the detector dueto its finite acceptance angle. Similarly, normal–hemi-spherical transmittance Th;λ was measured with an inte-grating sphere (ISR-3100 by Shimadzu, USA) and theabove-mentioned spectrophotometer. Here also, the mea-surements were calibrated with the normal–hemisphericaltransmittance of the reference medium Th;λ;ref . They wereused to determine the absorption coefficient κλ of thesuspension. The data analysis corrected for imperfectreflections in the inner surface of the integrating sphereand the geometry of the setup resulting in a fraction of thescattered and transmitted light being unable to reach thedetector.
Prior to all transmission measurements, the sampleswere manually shaken to ensure a well-mixed suspensionwith randomly oriented Synechocystis sp. cells. In addition,the measurements were performed for two different cellnumber densities by diluting the samples with PBS. Foreach sample, the normal–normal and normal–

Bisphere Quadsphere
ms,
Equivalent coated sphere
nm,
nm,
nm,
rs
rs
ms,
ms,
nm,
req,i
req,o
λ
λ
λ
λ
λ
λ
λ
Fig. 2. Schematics of (a) a bisphere, (b) a quadsphere, and (c) an averageprojected area and volume-equivalent coated sphere with inner radiusreq;i and outer radius req;o . The monomers and the coating of the coatedsphere had the same complex index of refraction ms;λ . The surroundingmedium and the core of the coated sphere were non-absorbing withrefractive index nm;λ .
R.-L. Heng, L. Pilon / Journal of Quantitative Spectroscopy & Radiative Transfer 174 (2016) 65–78 69
hemispherical transmittances were measured three timesand the results were averaged. Absorption κλ and scatter-ing σs;λ coefficients were normalized by the measured cellnumber density NT according to Eq. (4) to obtain theaverage absorption Cabs;λ and scattering Csca;λ cross-sections of the microorganisms. It was established thatsingle and independent scattering prevailed by verifyingthat the cross-sections Cabs;λ and Csca;λ for different valuesof cell densities NT collapsed onto a single line [33].
Finally, note that radiation characteristics of micro-organisms may vary with time in response to changes inlight and nutrient availability [23,48]. However, it wasestablished that light transfer in PBRs can be accuratelypredicted throughout the PBR operation, except undernutrient limitations, based on the radiation characteristicsmeasured during the exponential growth phase [48].
4. Analysis
4.1. Aggregates and their equivalent coated spheres
Figs. 2a and 2b show schematics of a bisphere and aquadsphere, respectively. The number of spherical mono-mers in each aggregate was denoted by Ns, e.g., Ns¼2 forbispheres and Ns¼4 for quadspheres. In addition, theradius of the monomers was denoted by rs and themonomer size parameter was defined as χs ¼ 2πrs=λ. The
monomers had effective spectral complex index ofrefraction ms;λ¼ns;λ þ iks;λ where ns;λ and ks;λ denote thespectral refractive and absorption indices, respectively. Thesurrounding medium was non-absorbing and had spectralrefractive index nm;λ. Then, the relative refractive nλ andabsorption kλ indices of the monomers can be defined as
nλ ¼ns;λ
nm;λand kλ ¼
ks;λnm;λ
: ð5Þ
Fig. 2c shows a schematic of the average projected areaand volume-equivalent coated sphere whose coating hasthe same complex index of refraction ms;λ as the mono-mers while its core consists of the surrounding medium ofrefractive index nm;λ. Its equivalent inner req;i and outerreq;o radii are expressed as [36]
req;i ¼
ffiffiffiffiffiffiffiffiffiffiffiffiffiffiffiffiffiffiffiffiffiffiffiffiffiffiffiffiffiffiAp
π
!3=2
�3V4π
3
vuut and req;o ¼ffiffiffiffiffiffiAp
π
sð6Þ
where V and Ap are the volume and average projected areaof the monomer aggregates, respectively. In particular, thevolume of bisphere Vb and of quadsphere Vq can beexpressed as
Vb=q ¼ 43 πNsr3s : ð7Þ
The average projected area of bispheres Ap;b and quad-spheres Ap;q can be computed numerically and have beenrelated to the monomer radius rs according to [36]
Ap;b ¼ 5:35r2s and Ap;q ¼ 9:70r2s : ð8ÞFig. 3a shows a schematic of two overlapping spheres of
radius rs whose centers are separated by a distance dspsuch that rsrdspr2rs. This morphology is analogous toactual Synechocystis cells (Fig. 1). Its volume can beexpressed as [49]
Vsyn ¼83πr3s �
π12
4rsþdsp� �ð2rs�dspÞ2 ð9Þ
Fig. 3b shows the ratio of the computed average projectedarea Ap;syn of randomly oriented overlapping bispheres tothe projected area πr2s of a monomer as a function ofdsp=2rs for different monomer radius rs ranging from 1 to9 μm. The results were obtained using the numericalmethod described in Ref. [36]. It is interesting to note thatthe plots of Ap;syn=πr2s vs. dsp=2rs collapsed on a single linefor all values of rs considered. Least square fitting of thedata yielded
Ap;syn
πr2s¼ 1þ0:872
dsp2rs
� ��0:169
dsp2rs
� �2
ð10Þ
Note that the expression Ap;syn gives the projected area of(i) a single sphere when dsp ¼ 0 μm and (ii) Ap;b given byEq. (8) for bispheres when dsp ¼ 2rs. Also, the averageprojected area of Synechocystis can be measured from two-dimensional micrographs of randomly oriented cells [50].
4.2. Inverse method algorithm
4.2.1. MethodologyFig. 4 shows the block diagram of the inverse method
used to retrieve the refractive ns;λ and absorption ks;λ

0.0 0.2 0.4 0.6 0.8 1.01.0
1.2
1.4
1.6
1.8
1 3 5 7 9
Radius of sphere, rs m)
2,2s
A d d0.169 0.872 1
r 2r 2rp syn sp sp
s s
Fig. 3. (a) Schematic of overlapping spheres of radius rs whose centersare separated by a distance dsp, (b) ratio of the average projected areaAp;syn and the project area πr2s of a single sphere as a function of dsp=2rsfor different values of rs.
λ, nm,λ
Lorenz-Mie theory
(coated sphere)
P individuals in generation
(ns,λ , ks,λ)1 i P
Genetic algorithm
Generatenew generation
No
Input
OOut
Inverse method
< <
Fig. 4. Block diagram of the procedure used to retrieve the refractive index ns;λ
and scattering cross-sections Cabs;λ and C sca;λ and the volume and average proP¼100 individuals per generation for a maximum of 500 generations. The object
R.-L. Heng, L. Pilon / Journal of Quantitative Spectroscopy & Radiative Transfer 174 (2016) 65–7870
indices of the monomers of polydisperse bispheres andquadspheres at each wavelength λ from (i) the spectralrefractive index nm;λ of the medium, (ii) the equivalentcoated sphere radii distributions f iðreq;iÞ and f oðreq;oÞ, and(iii) the measured average spectral absorption Cabs;λ and(iv) scattering Csca;λ cross-sections. The Lorenz–Mie theoryfor coated spheres [38,46] was used in the forward modelto calculate the predicted average absorption Cabs;λ;pred andscattering Csca;λ;pred cross-sections. Then, the general pur-pose genetic algorithm PIKAIA [44] was used to simulta-neously retrieve the values of (ns;λ, ks;λ) or (nλ, kλ) thatminimized the difference between the measured averageabsorption Cabs;λ and scattering Csca;λ cross-sections of theaggregates and those predicted using the equivalentcoated sphere approximation Cabs;λ;pred and Csca;λ;pred. Thechoice of genetic algorithm was arbitrary and other opti-mization methods could have been used. However, itprovides a reliable method for minimizing the objectivefunction δλ defined, at each wavelength λ, as
δλ ¼Cabs;λ;pred�Cabs;λ
Cabs;λ
!2
þ Csca;λ;pred�Csca;λ
Csca;λ
!2
: ð11Þ
The genetic algorithm used a maximum of 500 generationsand a population of 100 individuals per generation. Eachindividual consists of a pair ðns;λ, ks;λÞ. In the case when ageneration featured an individual producing a value of δλsmaller than 10�4, the corresponding values of ns;λ and ks;λwere reported as the retrieved refractive and absorptionindices of the monomer at wavelength λ. Then, this pro-cedure was repeated for another wavelength. The inversemethod was implemented on a single dual core 2.53 GHzCPU with 4.00 GB RAM.
Yes
ptical properties of aggregates
ns,λ, ks,λ
put
Experiments
abs, , predC
sca, , predC
abs, C
sca, C
,i ,o( ), ( )i eq o eqf r f r
δλ < 10−4 ?
λ
λ
λ
λ
and absorption index ks;λ from the measured average spectral absorptionjected area equivalent coated sphere radii distribution f ðreq;i; req;oÞ. Here,ive function δλ to be minimized for each wavelength is defined in Eq. (11).
R.-L. Heng, L. Pilon / Journal of Quantitative Spectroscopy & Radiative Transfer 174 (2016) 65–78 71
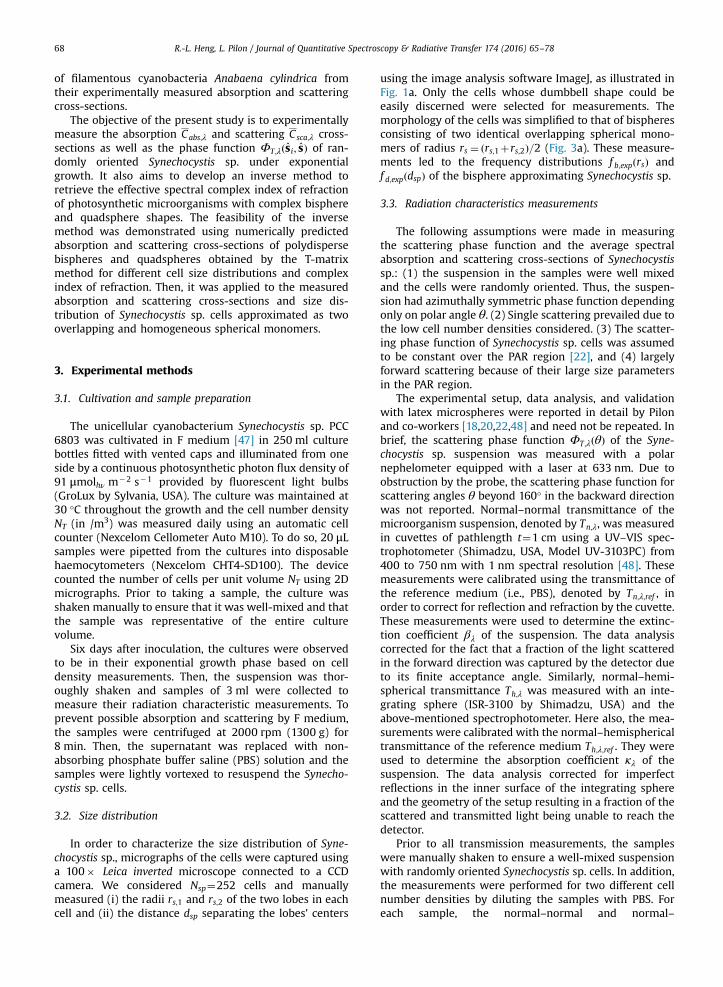
4.2.2. ValidationIn order to assess the validity of the inverse method for
a broad range of suspensions and monomer relativecomplex index of refraction mλ ¼ nλþ ikλ, we consideredtwo different suspensions of bispheres and quadsphereswith various size distributions. The average absorptionCabs;λ and scattering Csca;λ cross-sections of these suspen-sions were computed using the T-matrix method [34].These results were then used in the inverse method toretrieve the relative refractive and absorption indicesdenoted by nλ;pred and kλ;pred, respectively.
Suspension 1 consisted of Nb¼1000 bispheres composedof two identical spherical monomers of radius frequencydistribution f bðrsÞ. Suspension 2 was a mixture of aggregatesconsisting of Nb¼1000 bispheres from Suspension 1 andNq¼200 quadspheres with monodisperse spherical mono-mers of radius frequency distribution f qðrsÞ. The values of Nb
and Nq were chosen arbitrarily as an upper estimate of thenumber of Synechocystis sp. cells undergoing cell division. Inpractice, only a few dividing cells could be observed at anygiven time under a microscope. Fig. 5a and b shows the his-tograms of the monomer radius frequency distributions f bðrsÞand f qðrsÞ used for the bispheres and quadspheres, respec-tively. These distributions were constructed using random
0.5 0.6 0.7 0.8 0.9 1.0 1.1 1.20.000
0.025
0.050
0.075
0.100
0.125
Freq
. dist
ribu
tion,
fb(r
s)
Monomer radius, r s (μm)
Mean = 0.86 μmStd dev = 0.085 μmNb = 1000
0.3 0.6 0.9 1.2 1.5 1.80.000
0.025
0.050
0.075
0.100
0.125
Freq
. dist
ribu
tions
, f1,
i(req
,i), f 1,
o(req
,o)
Equivalent radius, r eq (μm)
eq,oreq,ir Suspension 1fb
f1
Suspension 1
Nb
Nb
Fig. 5. Histograms of the bisphere and quadsphere monomer radius frequency dof Suspensions 1 and 2, respectively.
numbers generated by Matlab from a normal distributionwith specified mean and standard deviation such that thelargest size parameter did not exceed 10, corresponding to theupper limit for using the T-matrix code. They were thenconverted into the equivalent coated sphere radii frequencydistributions f 1;iðreq;iÞ, f 1;oðreq;oÞ and f 2;iðreq;iÞ, f 2;oðreq;oÞ, usingEqs. (6) and (8), as shown in Fig. 5c and d for Suspensions1 and 2, respectively. The wavelength of the incident light wastaken as constant and equal to 676 nm, corresponding to thein vivo absorption peak of Chl a [11]. This resulted in mono-mer size parameters χs of the bispheres and quadspheresranging from 5 to 11. In addition, the monomers wereassigned a relative refractive index nλ ranging from 1.03 to2.0 and a relative absorption index kλ ranging from 0.004to 2.0.
For each combination of nλ and kλ, the absorption Cabs;λ ;j
and scattering Csca;λ ;j cross-sections of an individual ran-domly oriented bisphere or quadsphere “j”were computedusing the T-matrix method [34]. The average absorptionCabs;λ and scattering Csca;λ cross-sections of the entiresuspension were defined as
Cabs=sca;λ ¼1N
XNj ¼ 1
Cabs=sca;λ;j: ð12Þ
0.5 0.6 0.7 0.8 0.9 1.0 1.1 1.20.00
0.05
0.10
0.15
Freq
. dist
ribu
tion,
fq(r
s)
Monomer radius, r s (μm)
Mean = 0.86 μmStd dev = 0.087 μmNq = 200
0.3 0.6 0.9 1.2 1.5 1.8 2.10.000
0.025
0.050
0.075
0.100
Freq
. dist
ribu
tions
, f2,
i(req
,i), f 2,
o(req
,o)
Equivalent radius, r eq (μm)
eq,oreq,ir Suspension 2fb
f2
fq
Suspension 2
Nb
Nq
N
istribution and the equivalent coated sphere radii frequency distributions
1.0 1.1 1.2 1.3 1.4 1.5 1.6 1.7 1.8 1.90
1
2
3
4
5
6
7
8 Relative absorption index, kλ
x10-12A
bsor
ptio
n cr
oss-
sect
ion,
Cab
s,λ (m
2 )
Relative refractive index, nλ
0.01 0.01 0.1 0.1 1 1
2noisnepsuS1noisnepsuS
T-matrix Lorenz-Mietheory
1.0 1.1 1.2 1.3 1.4 1.5 1.6 1.7 1.8 1.90
4
8
12
16 x10-12
Scat
teri
ng c
ross
-sec
tion,
Csc
a,λ (
m2 )
Relative refractive index, nλ
1.0 1.1 1.2 1.3 1.4 1.5 1.6 1.7 1.8 1.90
1
2
3
4
5
6
7
8x10-12
Abs
orpt
ion
cros
s-se
ctio
n,C
abs,λ
(m2 )
Relative refractive index, nλ
1.0 1.1 1.2 1.3 1.4 1.5 1.6 1.7 1.8 1.90
4
8
12
16 x10-12
Scat
teri
ng c
ross
-sec
tion,
Csc
a,λ (
m2 )
Relative refractive index, nλ
− −−−
Fig. 6. (a, b) Average absorption Cabs;λ and (c, d) scattering Csca;λ cross-sections predicted using the T-matrix method and the Lorenz–Mie theory for thecorresponding equivalent coated spheres, as functions of relative refractive index nλ ranging from 1.0 to 1.9 for relative absorption index kλ¼0.01, 0.1, and1 for Suspensions 1 and 2, respectively.
R.-L. Heng, L. Pilon / Journal of Quantitative Spectroscopy & Radiative Transfer 174 (2016) 65–7872
where N is the total number of cells in the suspension, i.e.,N¼Nb for Suspension 1 and N¼NbþNq for Suspension 2.
Finally, the equivalent coated sphere radii frequencydistributions f 1=2;iðreq;iÞ and f 1=2;oðreq;oÞ for suspensions 1 or2 and their average absorption Cabs;λ and scattering Csca;λcross-sections were used in conjunction with the inversemethod to retrieve the relative refractive and absorptionindices. These retrieved values nλ;pred and kλ;pred werecompared with the values originally assigned to themonomers based on the sum of their absolute relativeerrors defined as
ϵλ ¼nλ;pred�nλ
nλ
��������þ kλ;pred�kλ
kλ
��������: ð13Þ
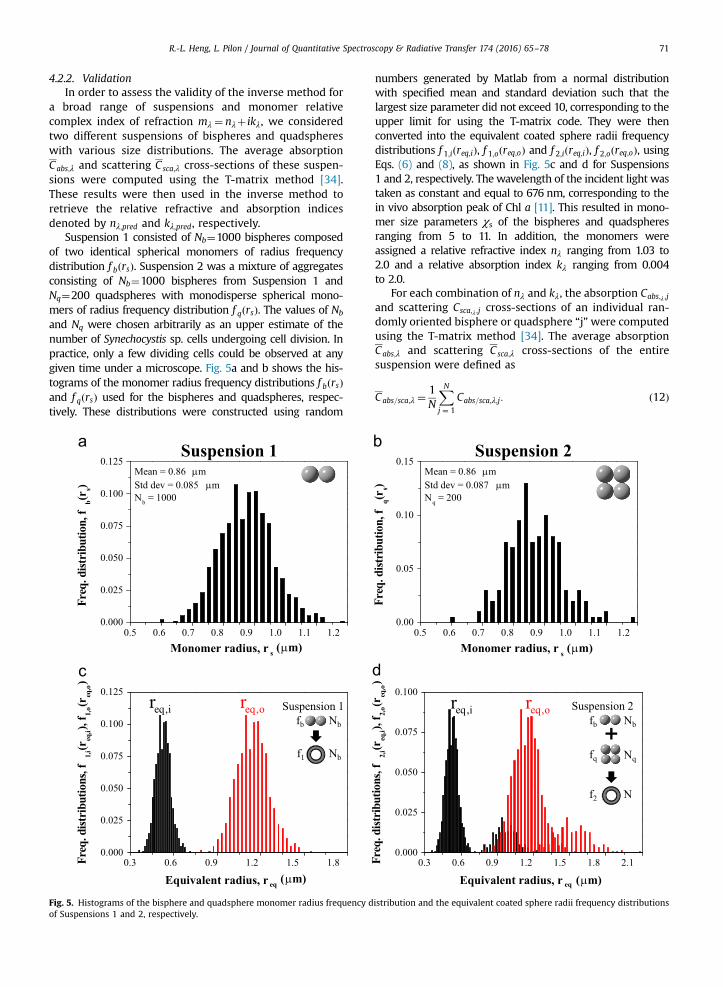
Figs. 6a and 6b plot the average absorption cross-sections Cabs;λ as a function of the relative refractiveindex nλ for absorption index kλ equal to 0.01, 0.1, and 1 forSuspensions 1 and 2, consisting of bispheres and of
bispheres and quadspheres, respectively. Similarly, Figs. 6cand 6d show the average scattering cross-sections Csca;λ ofSuspensions 1 and 2, respectively. These figures comparethe cross-sections predicted by the T-matrix method withthose corresponding to the average projected area andvolume-equivalent coated spheres computed using theLorenz–Mie theory and the size distributions f 1;iðreq;iÞ,f 1;oðreq;oÞ, f 2;iðreq;iÞ, and f 2;iðreq;oÞ. Fig. 6 indicates that, forgiven nλ and kλ, Suspension 2 had slightly larger Cabs;λ andCsca;λ than Suspension 1 due to the fact that quadsphereswere larger than bispheres and were responsible foradditional absorption and scattering. It was also evidentthat Cabs;λ increased as kλ increased from 0.01 to 0.1.However, when kλ increased from 0.1 to 1, Cabs;λ was notsignificantly larger than for smaller values of kλ and waseven smaller for some values of nλ. This can be attributedto the fact that the monomers scattered more strongly forlarge values of kλ, as also observed for aggregates with
R.-L. Heng, L. Pilon / Journal of Quantitative Spectroscopy & Radiative Transfer 174 (2016) 65–78 73
more complex shapes [51]. Then, the incident EM wavewas unable to penetrate the monomers where absorptiontakes place. In addition, for a given value of kλ, increasingnλ led to a slight increase in Cabs;λ. This could be attributedto the fact that the larger index mismatch across theinterface between the monomers and the surroundingmedium caused EM waves entering the monomers to beconfined in the monomers due to total internal reflection.For a given value of kλ, Csca;λ was observed to oscillate withincreasing nλ. These oscillations were caused by inter-ferences and diffraction and are typical of dielectric scat-terers [52,53]. The oscillations in Csca;λ became increas-ingly damped as kλ increased. For both Suspensions 1 and
1.2 1.4 1.6
0.01
0.1
1
Rel
ativ
e ab
sorp
tion
inde
x, k
λ
Relative refractive i
1.2 1.4 1.6
0.01
0.1
1
Rel
ativ
e ab
sorp
tion
inde
x, k
λ
Relative refractive iFig. 7. Contour plots of the cumulative relative errors ϵλ between the input arefractive nλ and absorption kλ indices of the monomers in (a) Suspensions 1 andlocation of the computed data points.
2, the predictions of Cabs;λ and Csca;λ by the equivalentcoated sphere approximation increasingly deviated fromthe predictions by the T-matrix method with increasingvalues of nλ and/or kλ. This was also observed in our pre-vious study [36]. However, it remains unclear how thesediscrepancies affect the values of effective optical proper-ties of bispheres and quadspheres retrieved by the inversemethod based on the equivalent coated sphere model.
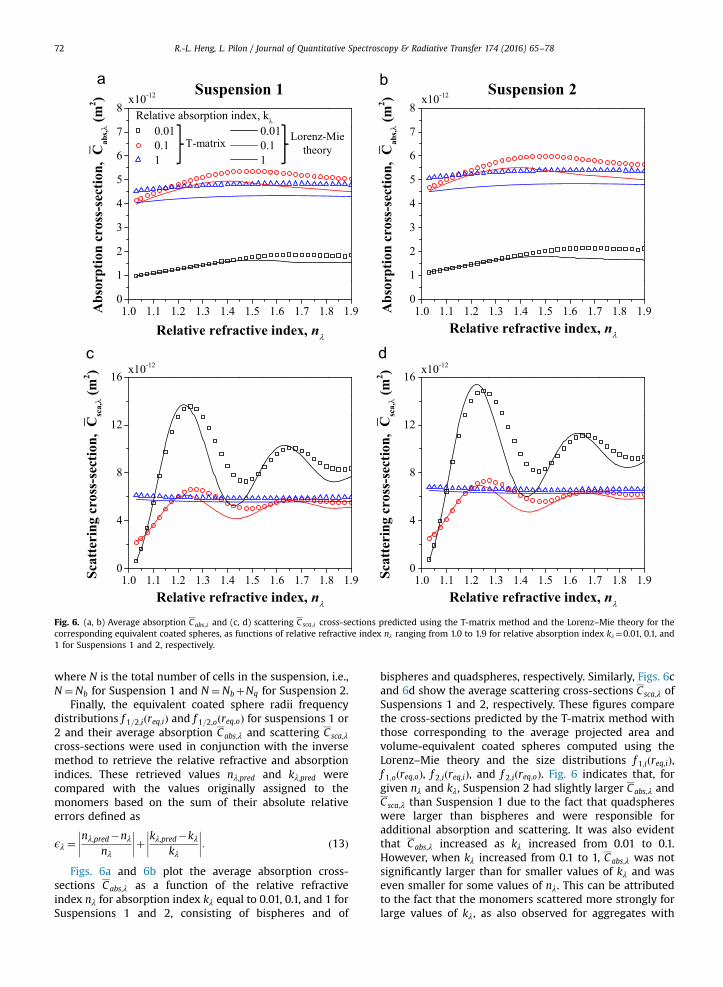
The average absorption Cabs;λ and scattering Csca;λ cross-sections computed by the T-matrix method were used toretrieve nλ;pred and kλ;pred by approximating Suspensions1 and 2 as suspensions of average projected area andvolume-equivalent coated spheres with size distributions
1.8 2.0
ndex, nλ
1.8 2.0
ndex, nλ
Suspension 1
Suspension 2
0 %10 %20 %30 %40 %50 %
Sum of relative errors,
nd retrieved refractive and absorption indices as a function of relative(b) Suspension 2, respectively. The dots on the contour plots represent the

R.-L. Heng, L. Pilon / Journal of Quantitative Spectroscopy & Radiative Transfer 174 (2016) 65–7874
f 1;iðreq;iÞ, f 1;oðreq;oÞ and f 2;iðreq;iÞ, f 2;oðreq;oÞ, respectively(Fig. 5). Figs. 7a and 7b show contour plots of the relativecumulative error ϵλ, defined by Eq. (13), as a function ofthe input relative refractive nλ and absorption kλ indicesfor Suspensions 1 and 2, respectively. In both cases, thecontour plots showed similar trends. The error ϵλ was lessthan 10% for most of the domain defined by 1rnλr1.3 and 0rkλr0:1. More importantly, it was less than 1%in the region relevant to microalgae featuring nλr1:1 andrkλr0:01 [21,23,24,31]. In fact, in this range, for bothsuspensions 1 and 2, the maximum absolute error in nλand kλ was 0.003 and 9 �10�5, respectively. This can beexplained by the fact that, in this region, the coated sphereapproximation gave excellent predictions of the T-matrixresults, as illustrated in Fig. 6. Therefore, using the inversemethod for photosynthetic microorganisms whosemorphologies resemble that of bispheres and quadspheres,such as Synechocystis sp. is appropriate. In addition, theerror ϵλ did not exceed 20% when nλ was between 1.3 and1.4 and kλ was less than 0.1. In this range of nλ and kλ,corresponding to optically soft scatterers, the relativeerrors were considered acceptable and the inverse methodwas valid. Note that these results are consistent with
0.6 0.8 1.0 1.2 1.40.00
0.05
0.10
0.15
0.20
0.25
0.30
Freq
uenc
y di
stri
butio
n, f b,
exp(r
s)
Cell radius, rs (μm)
Mean = 1.01 μmStd dev = 0.101 μmNsp = 231
0.0 0.4 0.8 1.2 1.60.00
0.05
0.10
0.15
0.20
0.25
0.30
Freq
uenc
y di
stri
butio
n, f ex
p,i(r
eq,i)
Inner equivalent radius, req,i (μm)
Mean = 0.551 μmStd dev = 0.218 μmNsp = 231
Fig. 8. Histograms of the measured Synechocystis sp. (a) radius distribution f b;excoated sphere radii distributions (c) f exp;iðreq;iÞ and (d) f exp;oðreq;oÞ.
analysis of the forward problem indicating that approx-imations of bispheres and quadspheres by volume andaverage projected area equivalent coated spheres werevalid for nλr1:2 and kλr0:1 for monomer size para-meters χs ranging from 0.01 to 10 [36].
Finally, note that the complex index of refraction ofcells in Suspensions 1 and 2 was also retrieved for anaverage Synechocystis cell with average radius determinedfrom the size distribution and approximated as a singlecoated sphere. The error in the retrieved values of nλ andkλ increased only slightly compared with those retrievedusing the actual size distribution. This suggests that thelatter did not have a significant effect on the retrievedvalues of nλ and kλ.
5. Results and discussions
5.1. Radiation characteristics of Synechocystis sp.
5.1.1. Size distributionFig. 8a shows the histogram of the radius frequency
distribution f b;expðrsÞ measured experimentally, with bin
0.8 1.2 1.6 2.0 2.4 2.8 3.2 3.60.00
0.05
0.10
0.15
0.20
0.25
0.30
Freq
uenc
y di
stri
butio
n, f d.
exp(d
sp)
Separation distrance, dsp (μm)
Mean = 1.911 μmStd dev = 0.445 μmNsp = 231
0.8 1.0 1.2 1.4 1.6 1.80.0
0.1
0.2
0.3
0.4
Freq
uenc
y di
stri
butio
n, f ex
p,o(r
eq,o)
Outer equivalent radius, req,o (μm)
Mean = 1.303 μmStd dev = 0.124 μmNsp = 231
pðrsÞ, (b) separation distance distribution f d;expðdspÞ and of the equivalent

0 20 40 60 80 100 120 140 160 18010
10
10
10
10
10
10
10
10
Scat
teri
ng P
hase
Fun
ctio
n,Φ
Τ,6
33
Scattering Angle, θ (°)
Fig. 9. Scattering phase function ΦT ;633ðθÞ of Synechocystis sp. measuredexperimentally at 633 nm as a function of scattering angle θ using a polarnephelometer.
400 450 500 550 600 650 700 7500
5
10
15
20
25
30
Abs
orpt
ion
coef
ficie
nt,
(m-1)
Wavelength, (nm)
NT,1=1.89 x 10¹³ cells/m3
NT,2=8.16 x 10¹² cells/m3
400 450 500 550 600 650 700 7500
5
10
15 x10-13
Abs
orpt
ion
cros
s-se
ctio
n,C
abs,
(m2 )
Wavelength, (nm)
-1
Chl a
Chl a
PCCN
PSC+PPC
Chl a
Chl a
PCCN
PSC+PPC
Fig. 10. Measured (a) absorption coefficient κλ , (b) scattering coefficient σs;λ , (c)cross-section C sca;λ ¼ σs;λ=NT of Synechocystis sp. as functions of wavelength λ fromNT ;2 ¼ 8:16� 1012 cells=m3.
R.-L. Heng, L. Pilon / Journal of Quantitative Spectroscopy & Radiative Transfer 174 (2016) 65–78 75
size of 0:05 μm, for Synechocystis sp. grown according tothe experimental procedure previously described andfeaturing mean radius of 1:02 μm. For each of these cells,the radii rs;1 and rs;2 of the two lobes were found to fallwithin 20% of each other. Hence, treating the cells asbispheres with identical monomers of radius rs taken asthe average of rs;1 and rs;2 was reasonably accurate. Here,the monomer size parameter ranged from 6.3 to 18.8 overthe PAR region. Fig. 6b shows the measured distributionf d;expðdspÞ for the distance dsp separating the centers of thetwo lobes of Synechocystis cells treated as overlappingspheres (see Fig. 3a). Finally, Figs. 8c and 8d show histo-grams of the equivalent coated sphere radii distributionsf exp;iðreq;iÞ and f exp;oðreq;oÞ converted from f b;expðrsÞ andf d;expðdspÞ using Eqs. (9) and (10).
5.1.2. Scattering phase functionFig. 9 shows the scattering phase function ΦT ;633ðθÞ of
Synechocystis sp. measured at 633 nm. As expected,
400 450 500 550 600 650 700 7500
40
80
120
160
Scat
teri
ng c
oeffi
cien
t, s,
(m)
Wavelength, (nm)
400 450 500 550 600 650 700 7500
20
40
60
80
100 x10-13
Scat
teri
ng c
ross
-sec
tion,
Csc
a, (m
2 )
Wavelength, (nm)average absorption cross-section Cabs;λ ¼ κλ=NT , and (d) average scattering400 to 750 nm for cell number densities NT ;1 ¼ 1:89� 1013 cells=m3 and

Fig. 11. Retrieved effective (a) refractive ns;λ and (b) absorption ks;λindices of Synechocystis sp. as functions of wavelength λ from 400 to750 nm using (i) the inverse method (Fig. 4) with (ii) distributionsf exp;iðreq;iÞ and f exp;oðreq;oÞ (Fig. 8), and (iii) the cross-sections Cabs;λ andC sca;λ (Fig. 10).
R.-L. Heng, L. Pilon / Journal of Quantitative Spectroscopy & Radiative Transfer 174 (2016) 65–7876
scattering was strongly in the forward direction due to thelarge size parameters of the cells. In addition, the asym-metry factor g633 at wavelength of 633 nm was estimatedto be 0.993.
5.1.3. Spectral absorption and scattering cross-sectionsFigs. 10a and 10b, respectively, show the spectral
absorption κλ and scattering σs;λ coefficients measured inthe spectral range from 400 to 750 nm for randomly orien-ted Synechocystis sp. collected after 6 days during the expo-nential growth phase for cell number densities NT ;1 ¼ 1:89�1013 cells=m3 and NT ;2 ¼ 8:16� 1012 cells=m3. Each datapoint represents the arithmetic mean of κλ and σs;λ mea-sured three times for each cell number density while theerror bars correspond to 95% confidence interval. It is evi-dent that the sample with the largest cell number densityNT ;1 had the largest absorption and scattering coefficients κλand σs;λ.
Fig. 10c and d shows the average absorption Cabs;λ andscattering Csca;λ cross-sections in the spectral range from400 to 750 nm after normalizing κλ and σs;λ [Fig. 10a andb] by their respective cell number density NT, according toEq. (4). Both datasets collapse on a single line confirmingthat single and independent scattering prevailed and thatthe absorption and scattering coefficients were directlyproportional to the cell number density. Moreover, boththe absorption coefficient κλ and the cross-section Cabs;λ ofSynechocystis sp. featured (i) peaks at 435 and 676 nmcorresponding to the absorption peaks of Chl a [11], (ii) apeak at 625 nm corresponding to PCCN [54], and (iii) ashoulder around 485 nm corresponding to absorption byPSC and PPC [11]. The scattering coefficient σs;λ and thescattering cross-section Csca;λ featured resonance peaksand dips around wavelengths corresponding to theabsorption peaks.
5.2. Effective spectral optical properties of Synechocystis sp.
Synechocystis sp. cells were approximated as overlappingand homogeneous bispheres with some effective complexindex of refraction. In addition, the spectral optical prop-erties of Synechocystis sp. were retrieved using the inversemethod illustrated in Fig. 4 from (i) the equivalent coatedsphere radii distributions f exp;iðreq;iÞ and f exp;oðreq;oÞ, (ii) theexperimentally measured average absorption and scatteringcross-sections Cabs;λ and Csca;λ, and (iii) the spectral refrac-tive index of PBS reported as [55]
nm;λ ¼ 1:32711þ0:0026
λ2þ0:00005
λ4ð14Þ
where the wavelength λ is expressed in μm.Fig. 11 shows the average effective (a) refractive index
ns;λ and (b) the effective absorption index ks;λ of Synecho-cystis sp. between 400 and 750 nm retrieved by the pre-viously validated inverse method from six differentexperimental measurements of the absorption and scat-tering cross-sections. The error bars were estimated as twotimes the standard deviation of the retrieved values of ns;λand ks;λ corresponding to 95% confidence interval. Theywere relatively small since the cross-section measure-ments featured small experimental uncertainty and the
inverse method was able to accurately and repeatedlyretrieve these effective optical properties. Although eachpair (ns;λ, ks;λ) was retrieved independently for each indi-vidual wavelength, the inverse method resulted in ns;λ andks;λ being continuous functions of wavelength. In addition,the absorption index ks;λ featured the same absorptionpeaks as those observed in κλ and Cabs;λ corresponding toChl a, PCCN, and carotenoids, as previously discussed. Therefractive index ns;λ featured resonance peaks and dipsaround wavelengths corresponding to the peaks in ks;λ.The values of the retrieved absorption index ks;λ wereconsistent with those found for other photosyntheticmicroorganisms [21,31] and was such that kλ ¼ ks;λ=nm;λ
was less than 0.011. The retrieved refractive index ns;λ
ranged between 1.4 and 1.44, corresponding to a relativerefractive index nλ ¼ ns;λ=nm;λ between 1.04 and 1.08.These values fell within the range of validity of the inversemethod established earlier.

R.-L. Heng, L. Pilon / Journal of Quantitative Spectroscopy & Radiative Transfer 174 (2016) 65–78 77
Moreover, ns;λ was slightly larger than those reportedfor cyanobacteria [21,56] and several hydrogen and lipidproducing microalgae [31] ranging between 1.35 and 1.39.By contrast, it was smaller than the reported refractiveindex of coccolithophonds [28] ranging between 1.53 and1.56. The difference in ns;λ can be attributed to the differ-ence in cell composition among these microorganisms. Forexample, cells with higher water content would featurelower values of ns;λ while those with large lipid, protein,calcium, and/or carbohydrate contents would result inlarger effective refractive index [28].
6. Conclusion
This paper reported, for the first time, the scatteringphase function, the average spectral absorption and scat-tering cross-sections of randomly oriented dumbbell-shaped Synechocystis sp. measured experimentally from400 to 750 nm during the exponential growth phase in Fmedium. Moreover, an inverse method was developed toretrieve the spectral refractive and absorption indices fromthe spectral absorption and scattering cross-sections. Itwas first validated using the average absorption andscattering cross-sections computed by the T-matrixmethod for two different suspensions of polydisperserandomly oriented bispheres and quadspheres. Theinverse method was able to accurately retrieve themonomer complex index of refraction for relative refrac-tive index less than 1.3 and relative absorption index lessthan 0.1. Then, it was used to retrieve spectral effectivecomplex index of refraction of Synechocystis sp. cellsapproximated as equivalent coated spheres with identicalaverage projected area and volume. Both the absorptioncross-section and the absorption index featured distinctpeaks corresponding to chlorophyll a and phycocyanin anda shoulder around 485 nm corresponding to carotenoids.These results can be used for predicting light distributionin photobioreactors cultivating Synechocystis sp. underoptimal conditions. In addition, the inverse method can beapplied to other optically soft absorbing and scatteringparticles of similar morphologies.
Acknowledgements
The authors would like to thank Prof. Brian Palenik, fromthe Scripps Institution of Oceanography of the University ofCalifornia, San Diego, for providing the microorganisms. Thecomputation for this study was performed on the Hoffman2cluster hosted by the Academic Technology Services (ATS)at the University of California, Los Angeles.
References
[1] Pulz O, Gross W. Valuable products from biotechnology of micro-algae. Appl Microbiol Biotechnol 2004;65(6):635–48.
[2] Richmond A. Handbook of microalgal culture: biotechnology andapplied phycology. Oxford, UK: Blackwell Science Ltd; 2004.
[3] Wang B, Li Y, Wu N, Lan CQ. CO2 bio-mitigation using microalgae.Appl Microbiol Biotechnol 2008;79(5):707–18.
[4] Chen CY, Yeh KL, Aisyah R, Lee DJ, Chang JS. Cultivation, photo-bioreactor design and harvesting of microalgae for biodiesel pro-duction: a critical review. Bioresour Technol 2011;102(1):71–81.
[5] Nakajima Y, Ueda R. Improvement of photosynthesis in densemicroalgal suspension by reduction of light harvesting pigments. JAppl Phycol 1997;9(6):503–10.
[6] Kaneko T, Sato S, Kotani H, Tanaka A, Asamizu E, Nakamura Y, et al.Sequence analysis of the genome of the unicellular cyanobacteriumSynechocystis sp. strain PCC6803 II. Sequence determination of theentire genome and assignment of potential protein-coding regions.DNA Res 1996;3(3):109–36.
[7] Hihara Y, Sonoike K, Kanehisa M, Ikeuchi M. DNA microarray ana-lysis of redox-responsive genes in the genome of the cyanobacter-ium Synechocystis sp. strain PCC 6803. J Bacteriol 2003;185(5):1719–25.
[8] Lagarde D, Beuf L, Vermaas W. Increased production of zeaxanthinand other pigments by application of genetic engineering techni-ques to Synechocystis sp. strain PCC 6803. Appl Environ Microbiol2000;66(1):64–72.
[9] Vega-Palas MA, Madueño F, Herrero A, Flores E. Identification andcloning of a regulatory gene for nitrogen assimilation in the cya-nobacterium Synechocystis sp. strain PCC 7942. J Bacteriol 1990;172(2):643–7.
[10] Scott M, McCollum C, Vasil'ev S, Crozier C, Espie GS, Krol M, et al.Mechanism of the down regulation of photosynthesis by blue lightin the cyanobacterium Synechocystis sp. PCC 6803. Biochemistry2006;45(29):8952–8.
[11] Bidigare R, Ondrusek M, Morrow J, Kiefer D. In vivo, absorptionproperties of algal pigments. In: Proceedings of the society of photo-optical instrumentation, vol. 1302, Ocean optics X; 1990. p. 290–301.
[12] Pinho MG, Kjos M, Veening JW. How to get (a) round: mechanismscontrolling growth and division of coccoid bacteria. Nat RevMicrobiol 2013;11(9):601–14.
[13] Grobbelaar JU. Physiological and technological considerations foroptimising mass algal cultures. J Appl Phycol 2000;12(3–5):201–6.
[14] Eriksen NT. The technology of microalgal culturing. Biotechnol Lett2008;30(9):1525–36.
[15] Pruvost J, Cornet J-F. Knowledge models for engineering and opti-mization of photobioreactors. In: Posten C, Walter C, editors.Microalgal biotechnology. Berlin, Germany: Walter De Gruyter;2012. p. 181–224 (Chapter 10).
[16] Pruvost J, Cornet J-F, Pilon L. Large scale production of algal biomass:photobioreactors. In: Chisti Y, Bux F, editors. Algae biotechnology:products and processes. UK: Springer; 2015.
[17] Olivieri G, Salatino P, Marzocchella A. Advances in photobioreactorsfor intensive microalgal production: configurations, operating stra-tegies and applications. J Chem Technol Biotechnol 2014;89(20):178–95.
[18] Pilon L, Berberoğlu H, Kandilian R. Radiation transfer in photo-biological carbon dioxide fixation and fuel production by micro-algae. J Quant Spectrosc Radiat Transf 2011;112(17):2639–60.
[19] Jonasz M, Fournier G. Light scattering by particles in water: theo-retical and experimental foundations. San Diego, CA: AcademicPress; 2007.
[20] Berberoğlu H, Pilon L. Experimental measurement of the radiationcharacteristics of Anabaena variabilis ATCC 29413-U and Rhodobactersphaeroides ATCC 49419. Int J Hydrogen Energy 2007;32(18):4772–85.
[21] Heng RL, Lee E, Pilon L. Radiation characteristics and optical prop-erties of filamentous cyanobacterium Anabaena cylindrica. J Opt SocAm A 2014;31(4):836–45.
[22] Berberoğlu H, Pilon L, Melis A. Radiation characteristics of Chlamy-domonas reinhardtii CC125 and its truncated chlorophyll antennatransformants tla1, tlaX and tla1-CWþ . Int J Hydrogen Energy2008;33(22):6467–83.
[23] Kandilian R, Lee E, Pilon L. Radiation and optical properties ofNannochloropsis oculata grown under different irradiances andspectra. Bioresour Technol 2013;137:63–73.
[24] Morel A, Bricaud A. Inherent optical properties of algal cellsincluding picoplankton: theoretical and experimental results. CanBull Fish Aquat Sci 1986;214:521–59.
[25] Stramski D, Rosenberg G, Legendre L. Photosynthetic and opticalproperties of the marine chlorophyte Dunaliella tertiolecta grownunder fluctuating light caused by surface-wave focusing. Mar Biol1993;115(3):363–72.
[26] Bricaud A, Morel A. Light attenuation and scattering by phyto-planktonic cells: a theoretical modeling. Appl Opt 1986;25(4):571–80.

R.-L. Heng, L. Pilon / Journal of Quantitative Spectroscopy & Radiative Transfer 174 (2016) 65–7878
[27] Stramski D, Morel A. Optical properties of photosynthetic pico-plankton in different physiological states as affected by growthirradiance. Deep Sea Res Part A. Oceanogr Res Pap 1990;37(2):245–66.
[28] Aas E. Refractive index of phytoplankton derived from its metabolitecomposition. J Plankton Res 1996;18(12):2223–49.
[29] Pottier L, Pruvost J, Deremetz J, Cornet J-F, Legrand J, Dussap C-G. Afully predictive model for one-dimensional light attenuation byChlamydomonas reinhardtii in a torus photobioreactor. BiotechnolBioeng 2005;91(5):569–82.
[30] Gordon HR. Light scattering and absorption by randomly-orientedcylinders: dependence on aspect ratio for refractive indices applic-able for marine particles. Opt Express 2011;19(5):4673–91.
[31] Lee E, Heng RL, Pilon L. Spectral optical properties of selected pho-tosynthetic microalgae producing biofuels. J Quant SpectroscRadiative Transf 2013;114:122–35.
[32] Mie G. Beiträge zur Optik trüber Medien, speziell kolloidalerMetallsungen. Ann Phys 1908;25(30):377–445.
[33] van de Hulst HC. Light scattering by small particles. Mineola, NY:Courier Dover Publications; 2012.
[34] Mackowski DW, Mishchenko MI. A multiple sphere T-matrix Fortrancode for use on parallel computer clusters. J Quant Spectros RadiatTransf 2011;112(13):2182–92.
[35] Quirantes A, Bernard S. Light scattering by marine algae: two-layerspherical and nonspherical models. J Quant Spectrosc Radiat Transf2004;89(1):311–21.
[36] Heng RL, Sy KC, Pilon L. Absorption and scattering by bispheres,quadspheres, and circular rings of spheres and their equivalentcoated spheres. J Opt Soc Am A 2015;32(1):46–60.
[37] Kandilian R, Heng RL, Pilon L. Absorption and scattering by fractalaggregates and by their equivalent coated spheres. J Quant SpectroscRadiat Transf 2015;151:310–26.
[38] Aden AL, Kerker M. Scattering of electromagnetic waves from twoconcentric spheres. J Appl Phys 1951;22(10):1242–6.
[39] Lee SC. Radiative transfer through a fibrous medium: allowance forfiber orientation. J Quant Spectrosc Radiat Transf 1986;36:253–63.
[40] Lee SC. Radiation heat-transfer model for fibers oriented parallel todiffuse boundaries. J Thermophys Heat Transf 1988;2:303–8.
[41] Lee E, Pilon L. Absorption and scattering by long and randomlyoriented linear chains of spheres. J Opt Soc Am A 2013;30(9):1892–900.
[42] Dauchet J. Analyse Radiative des Photobioréacteurs [Ph.D. thesis].France: Université Blaise Pascal, Clermont Ferrand II; 2012.
[43] Quirantes A, Bernard S. Light-scattering methods for modelling algalparticles as a collection of coated and/or nonspherical scatterers. JQuant Spectrosc Radiat Transf 2006;100(1):315–24.
[44] Charbonneau P, Knapp B. A User's guide to PIKAIA 1.0. Technicalreport. NCAR technical note 418þ IA. National Center for Atmo-spheric Research; 1995.
[45] Kerker M. The scattering of light, and other electromagnetic radia-tion. New York, NY: Academic Press; 1969.
[46] Bohren CF, Huffman DR. Absorption and scattering of light by smallparticles. New York, NY: John Wiley & Sons; 1998.
[47] Guillard RRL, Ryther JH. Studies of marine planktonic diatoms: I.Cyclotella nana Hustedt, and Detonula confervacea (Cleve) Gran.. CanJ Microbiol 1962;8(2):229–39.
[48] Heng RL, Pilon L. Time-dependent radiation characteristics of Nan-nochloropsis oculata during batch culture. J Quant Spectrosc RadiatTransf 2014;144:154–63.
[49] Weisstein EW. Sphere–sphere intersection. In: Eric Weisstein'sworld of mathematics ⟨http://mathworld.wolfram.com/⟩; 2002.
[50] Brown DJ, Vickers GT. The use of projected area distribution func-tions in particle shape measurement. Powder Technol 1998;98(3):250–7.
[51] Zubko E, Kimura H, Shkuratov Y, Muinonen K, Yamamoto T, Oka-moto H, et al. Effect of absorption on light scattering by agglom-erated debris particles. J Quant Spectrosc Radiat Transf 2009;110(14–16):1741–9.
[52] Modest M. Radiative heat transfer. 3rd editionOxford, UK: Elsevier;2013.
[53] Jones AR. Light scattering for particle characterization. Prog EnergyCombust Sci 1999;25(1):1–53.
[54] Su X, Fraenkel PG, Bogorad L. Excitation energy transfer from phy-cocyanin to chlorophyll in an apcA-defective mutant of Synecho-cystis sp. PCC 6803. J Biol Chem 1992;267(32):22944–50.
[55] Zhernovaya O, Sydoruk O, Tuchin V, Douplik A. The refractive indexof human hemoglobin in the visible range. Phys Med Biol 2011;56:4013–21.
[56] Bricaud A, Bédhomme AL, Morel A. Optical properties of diversephytoplanktonic species: experimental results and theoreticalinterpretation. J Plankton Res 1988;10(5):851–73.