radial glial lineage progression and differential ... · 4 superimposed upon striosome-matrix...
TRANSCRIPT

1
Radial glial lineage progression and differential intermediate progenitor amplification underlie
striatal compartments and circuit organization
Sean M. Kelly1,2, Ricardo Raudales1,3, Miao He1, #, Jannifer Lee4, Yongsoo Kim1,α, Leif G. Gibb4,
Priscilla Wu1, Katie Matho1, Pavel Osten1, Ann M. Graybiel4*, Z. Josh Huang1*
1Cold Spring Harbor Laboratory, Cold Spring Harbor, New York 11724, USA
2Program in Neuroscience and Medical Scientist Training Program, Stony Brook University, New
York 11790, USA 3Program in Neuroscience, Stony Brook University, New York 11790, USA
4McGovern Institute for Brain Research and Department of Brain and Cognitive Science,
Massachusetts Institute of Technology, Cambridge, MA 02139, USA
*Corresponding author: [email protected]; [email protected]
Current address: α College of Medicine, Penn State University, Hershey, PA 17036 USA
#Institute of Brain Sciences, State Key Laboratory of Medical Neurobiology, Collaborative Innovation
Center for Brain Science, Fudan University, Shanghai 200032, China
peer-reviewed) is the author/funder. All rights reserved. No reuse allowed without permission. The copyright holder for this preprint (which was not. http://dx.doi.org/10.1101/244327doi: bioRxiv preprint first posted online Jan. 8, 2018;
(which was not peer-reviewed) is the author/funder. All rights reserved. No reuse allowed without permission. The copyright holder for this preprint. http://dx.doi.org/10.1101/244327doi: bioRxiv preprint first posted online Jan. 8, 2018;

2
SUMMARY
The circuitry of the striatum is characterized by two organizational plans: the division into
striosome and matrix compartments, thought to mediate evaluation and action, and the direct and
indirect pathways, thought to promote or suppress behavior. The developmental origins of and
relationships between these organizations are unknown, leaving a conceptual gap in understanding
the cortico-basal ganglia system. Through genetic fate mapping, we demonstrate that striosome-
matrix compartmentalization arises from a lineage program embedded in lateral ganglionic
eminence radial glial progenitors mediating neurogenesis through two distinct types of intermediate
progenitors (IPs). The early phase of this program produces striosomal spiny projection neurons
(SPNs) through fate-restricted apical IPs (aIPSs) with limited capacity; the late phase produces
matrix SPNs through fate-restricted basal IPs (bIPMs) with expanded capacity. Remarkably, direct
and indirect pathway SPNs arise within both aIPS and bIPM pools, suggesting that striosome-matrix
architecture is the fundamental organizational plan of basal ganglia circuitry organization.
peer-reviewed) is the author/funder. All rights reserved. No reuse allowed without permission. The copyright holder for this preprint (which was not. http://dx.doi.org/10.1101/244327doi: bioRxiv preprint first posted online Jan. 8, 2018;
(which was not peer-reviewed) is the author/funder. All rights reserved. No reuse allowed without permission. The copyright holder for this preprint. http://dx.doi.org/10.1101/244327doi: bioRxiv preprint first posted online Jan. 8, 2018;

3
INTRODUCTION
The striatum, the gateway and largest nucleus of the basal ganglia, receives massive inputs from all
areas of the cerebral cortex and gives rise to the largest output circuits of the basal ganglia by way of
multi-synaptic pathways leading to the brainstem and thalamus. Neural activity in the striatum itself is
influenced by dopamine-containing afferents from the substantia nigra, serotonergic afferents from
raphe nuclei, cholinergic inputs from the brainstem, and other neuromodulatory circuits. The striatum
thus constitutes a key neural substrate through which diverse functionally specialized regions of the
neocortex converge to modulate not only downstream motor programs for the initiation of voluntary
behaviors, but also neural systems underpinning emotion, motivation, evaluation and learning (Graybiel,
2008; Grillner and Robertson, 2015; Hikosaka et al., 2014).
The majority of neurons in the striatum are output spiny projection neurons (SPNs). These are known to
follow two fundamental organizational schemes. First, the striatum has a striking compartmental
organization by which labyrinthine neurochemically specialized zones called striosomes (‘striatal
bodies’) lie embedded within the much larger matrix compartment (Graybiel and Ragsdale, 1978). This
striosome-matrix architecture contributes to the functional input and output connectivity of the striatum
(Crittenden and Graybiel, 2011; Grillner and Robertson, 2015). The SPNs of striosomes receive
preferential input from particular limbic regions and have privileged output to the dopamine-containing
neurons of the substantia nigra and indirectly to the lateral habenula, thus engaging crucial dopamine-
and serotonin-related neuromodulatory systems (Fujiyama et al., 2011; Jiménez-Castellanos and
Graybiel, 1989; Watabe-Uchida et al., 2012; Crittenden et al., 2016; Eblen and Graybiel, 1995;
Brimblecombe and Cragg, 2017). By contrast, SPNs of the much larger matrix compartment receive
inputs from sensorimotor and associative cortical regions and in turn project to the main pallidonigral
output nuclei of the basal ganglia that target downstream premotor regions and thalamocortical circuits
(Donoghue and Herkenham, 1986; Flaherty and Graybiel, 1994; Graybiel, 2008; Hikosaka et al., 2014).
Functionally, striosomal circuits have been implicated in evaluative functions related to affective
control, cost-benefit decision-making, and reinforcement-based behaviors. By contrast, the matrix
appears to be involved in the translation of cortical action plans and strategies to basal ganglia circuits
involved in action execution (Amemori et al., 2011; Cui et al., 2014; Friedman et al., 2015; Fujiyama et
al., 2011; Gerfen, 1992; Lopez-Huerta et al., 2015; White and Hiroi, 1998; Parthasarathy et al., 1992;
Giménez-Amaya and Graybiel, 1991; Graybiel et al., 1994). The developmental basis of this striosome
and matrix segregation is not well understood.
peer-reviewed) is the author/funder. All rights reserved. No reuse allowed without permission. The copyright holder for this preprint (which was not. http://dx.doi.org/10.1101/244327doi: bioRxiv preprint first posted online Jan. 8, 2018;
(which was not peer-reviewed) is the author/funder. All rights reserved. No reuse allowed without permission. The copyright holder for this preprint. http://dx.doi.org/10.1101/244327doi: bioRxiv preprint first posted online Jan. 8, 2018;

4
Superimposed upon striosome-matrix compartmentalization is a split between the projections of SPNs to
the main basal ganglia output nuclei, the pallidum and the substantial nigra pars reticulata (SNr)
(Gerfen, 1992; Kim and Hikosaka, 2015). SPNs projecting to the internal pallidum and SNr constitute
the so-called direct pathway SPNs (dSPNs), conventionally considered to release basal ganglia-mediated
inhibition or inhibition-excitation sequences and to promote action. By contrast, the SPNs projecting to
the external pallidum give rise to the indirect pathway (iSPNs), considered to inhibit actions, potentially
those with unwanted characteristics (Freeze et al., 2013; Albin et al., 1995). The direct-indirect pathway
dichotomy has been elegantly formulated as a center-surround system in which wanted movements are
promoted by the direct pathway and competing, interfering motor programs are inhibited (Mink, 1996)).
By virtue of its large size and output organization, the matrix compartment is the main source of the
direct and indirect pathways, but striosomes as well as matrix contain both dSPNs and iSPNs, at least as
categorized by the expression of dopamine D1 (in dSPNs) and D2 (in iSPNs) receptors (Crittenden and
Graybiel, 2011; Fujiyama et al., 2011; Brimblecombe and Cragg, 2017; Salinas et al., 2016).
Despite strong evidence for the coexistence of the striosome and matrix compartments and the direct and
indirect pathways, remarkably little is known about the relationship between these two fundamental axes
of striatal organization. A clue to the potential importance of developmental mechanisms underlying the
compartmental divisions first came from studies demonstrating that SPNs making up striosomes and
matrix have different birthdates , with striosomal SPNs being generated earlier than those within the
matrix (Newman et al., 2015; van der Kooy and Fishell, 1987). Here we sought to link this evidence to
neural progenitors and lineage mechanisms known to be crucial in striatal developmental cascades
(Rubenstein and Campbell, 2013). The neuroepithelium of the lateral ganglionic eminence (LGE) of the
embryonic ventral telencephalon consists of diverse types of progenitors that emerge and differentiate
across different stages of striatal neurogenesis (Turrero García and Harwell, 2017). These include
regenerative radial glial progenitors (RGs), which give rise to apical intermediate progenitors (aIPs)
such as short neural progenitors (SNPs) and subapical progenitors (SAPs), and basal intermediate
progenitors (bIPs) (Pilz et al., 2013). Although certain lineage relationships and neurogenic capacity of
some of these progenitor types have been characterized by live imaging at mid-gestation (e.g., Pilz et al.,
2013), their developmental trajectory through the course of LGE neurogenesis and especially their link
to different SPN types and striatal circuit organization remain unknown. Tapping into the molecular
mechanisms and transcription factors expressed in different progenitor types, we performed systematic
genetic fate mapping to resolve different progenitor types and trace their developmental trajectories
from early lineage progression to the distinct SPN types that they give rise to.
peer-reviewed) is the author/funder. All rights reserved. No reuse allowed without permission. The copyright holder for this preprint (which was not. http://dx.doi.org/10.1101/244327doi: bioRxiv preprint first posted online Jan. 8, 2018;
(which was not peer-reviewed) is the author/funder. All rights reserved. No reuse allowed without permission. The copyright holder for this preprint. http://dx.doi.org/10.1101/244327doi: bioRxiv preprint first posted online Jan. 8, 2018;

5
Here, we demonstrate that striosomal and matrix SPNs are sequentially generated from a RG lineage
program through sequential allocation of distinct types of IPs with different amplification capacities.
Whereas the early phase of this program produces striosomal SPNs through fate-restricted Ascl1+ aIPSs
with limited neurogenic capacity, the late phase amplifies matrix SPN production through the additional
deployment and amplification of fate-restricted Ascl1+/ Dlx1+ bIPMs with expanded neurogenic capacity.
During the final phase, Dlx1/2+ bIPs specifically generate projection neurons of the annular
compartment adjoining striosomes (A cells). Remarkably, a similar temporal and progenitor type split of
striosomal and matrix SPN production was not observed for the genesis of D1- and D2-receptor bearing
direct and indirect pathway SPNs. We found that each of these pathways is derived from both aIPSs and
bIPMs throughout the course of RG lineage progression. These findings suggest that a primary lineage
program within the LGE gives rise to striosome-matrix compartmentalization, and superimposed upon
this organization, a secondary and different mechanism gives rise to direct and indirect pathway SPNs
within each compartment. Thus the major components of striatal architecture are rooted in a radial glia
lineage program differentiating future striosome and matrix compartments at the inception of striatal
development, and they originate from sequential phases of lineage progression and from distinct
intermediate progenitor types. These findings establish a novel framework for exploring the assembly of
cortico-basal ganglia circuitry and should provide new clues to the differential vulnerabilities of the
striosome-matrix and direct-indirect pathways in human disease states.
RESULTS
Early LGE Radial Glial Cells Sequentially Give Rise to Both Apical and Basal Intermediate
Progenitors and to Both Striosomal and Matrix SPNs
The initial formation of LGE around embryonic day (E) 9.5 along the subpallium is followed
shortly by the onset of neurogenesis, when proliferative neuroepithelial cells (NEs) begin to
transform into neurogenic radial glial cells (RGs) (Sousa and Fishell, 2010). Although all striatal
SPNs are thought ultimately to be generated from LGE RGs, recent studies indicate the existence of
multiple types of progenitors with distinct molecular and morphological characteristics that are
derived from RGs at different embryonic times (Pilz et al., 2013; Turrero García and Harwell,
2017). These include aIPs such as SNPs and SAPs), and also bIPs. How these different progenitor
types relate to distinct striatal SPN types remains largely unknown. We used several inducible
CreER drivers to carry out comprehensive genetic fate mapping of multiple LGE progenitor types.
peer-reviewed) is the author/funder. All rights reserved. No reuse allowed without permission. The copyright holder for this preprint (which was not. http://dx.doi.org/10.1101/244327doi: bioRxiv preprint first posted online Jan. 8, 2018;
(which was not peer-reviewed) is the author/funder. All rights reserved. No reuse allowed without permission. The copyright holder for this preprint. http://dx.doi.org/10.1101/244327doi: bioRxiv preprint first posted online Jan. 8, 2018;

6
Among the markers expressed in telencephalic progenitors (i.e., pallium and subpallium), the anti-
proliferative protein TIS21 is unique in its specific expression in all progenitors undergoing
neurogenic divisions, including subsets of RGs, aIPs, and bIPs (Attardo et al., 2008). To fate map
different types of neurogenic progenitors, especially self-renewing RGs in the process of
neurogenesis, we generated a knock-in Tis21-CreER driver and demonstrated that TM-induced
activation of the Ai14 reporter reliably and efficiently captured neuron-producing progenitors
(Figures 1 and S1). The Tis21-CreER driver thus provided a unique and powerful fate-mapping tool
for LGE neurogenic RGs starting from the very onset of neurogenesis. This enabled tracing of the
RG lineage progression through sets of embryonic IPs to their SPN progenies in the postnatal
striatum (Figures 1A and 1B). At the early onset of neurogenesis ~E10, 8-hour pulse-chase of
Tis21+ progenitors labeled both RGs and aIPs (Figures 1C, 1F and 1G). We could not strictly
distinguish between SNPs and SAPs, as these aIP subtypes are defined by their cell division
patterns best captured by live imaging experiments (Pilz et al., 2013). Importantly, 48 hours after
E10 TM induction (i.e., at E12), RFP+ RGs and aIPs remained abundant in the ventricular zone
(VZ), indicating that RGs self-renewed and continued to generate aIPs. Sparse labeling allowed
identification of elongated cell clusters, which likely represented clonal descendants from an initial
neurogenic RG (Figure 1D, H, I; Figure S1D). Remarkably, even 96 hours after E10 TM induction
(i.e., at E14), RFP+ RGs still remained in VZ, indicating persistent self-renewal (Figures 1E, 1J-1L,
S1E, and S1F). Particularly large cell clones were frequent, which consisted of a “founder RG”,
multiple Ascl1+ IPs, and larger number of postmitotic neurons likely engaged in migration along
the RG radial fiber (Figures 1L and S1F, Supplemental Movie 1). Whereas E10-labeled RGs gave
rise to aIPs from E10- E12 (Figures 1D, 1H and 1I), they made a transition to generating mainly
bIPs in the subventricular zone (SVZ) by E14 (Figures 1E and 1J-1L).
To determine the identity of SPNs derived from early Tis21+ RGs, we assayed the striatum on
postnatal day (P) 28 (Figures 1M-1O). Both striosomal (S) and matrix (M) SPNs were generated,
roughly in a 1:4 ratio (Figure 1O). To further probe the lineage relationship between S and M cells,
we combined genetic fate mapping of RGs at E10 and consecutive birth dating by EdU at E11 and
BrdU at E14. We found that RFP+ S cells were predominantly double-labeled by EdU at E11,
whereas RFP+ M cells were predominantly double-labeled by BrdU at E14 (Figures 1P-1W).
Together, these results suggest that along the lineage progression, the same early Tis21+ RG
population first generates S cells and then M cells, likely via producing several types of IPs.
peer-reviewed) is the author/funder. All rights reserved. No reuse allowed without permission. The copyright holder for this preprint (which was not. http://dx.doi.org/10.1101/244327doi: bioRxiv preprint first posted online Jan. 8, 2018;
(which was not peer-reviewed) is the author/funder. All rights reserved. No reuse allowed without permission. The copyright holder for this preprint. http://dx.doi.org/10.1101/244327doi: bioRxiv preprint first posted online Jan. 8, 2018;

7
A Set of Early Apical Intermediate Progenitors Are Fate-Restricted to Generate Striosomal SPNs
The proneural protein ASCL1 is restricted to more differentiated neurogenic progenitors rather than self-
renewing RGs and is important in coordinating the balance between neural progenitor proliferation and
cell cycle exit toward neurogenesis (Casarosa et al., 1999; Guillemot and Hassan, 2017). ASCL1
expression exhibits two distinct dynamic patterns: an oscillatory pattern of relatively low ASCL1 levels
correlating with cell-cycle progression and proliferation, versus a sustained expression at higher levels
driving neurogenic cell division and neuronal differentiation (Imayoshi et al., 2013; Imayoshi and
Kageyama, 2014). Thus the Ascl1-CreER driver is an effective tool for selectively labeling progenitors
biased towards adopting a neurogenic path (Sudarov et al., 2011; Figures 2A-2D). Indeed, throughout
E10 LGE, we detected both low and high levels of ASCL1 immunoreactivity in cells within the VZ,
suggesting intermingling of cells in various proliferative (oscillatory expression) and neurogenic
(sustained expression) states (Figures 2G, 2H, S2A and S2B). We used relatively low-dose TM
induction to achieve sparse labeling and to target progenitors with high-level Ascl1 expression, which
we verified by co-labeling with anti-ASCL1 antibody (Figure 2H). A brief 8-hour pulse-chase labeling
with TM induction in E10.5 Ascl1-CreER;Ai14 embryos reliably labeled aIPs with end-feet at the
ventricle surface, with or without basal radial fibers (Figure 2D). Importantly, 18 and 24 hours following
induction at E10.5, few or no RFP+ progenitors remained in the VZ, in sharp contrast to Tis21+ RGs
(Figure 1D), indicating that E10 Ascl1+ progenitors are aIPs, as opposed to RGs endowed with extensive
capacity for self-renewal. Ascl1+ aIPs did not express multi-potency markers such as Sox2 (Figure S2C)
or the postmitotic neuron marker BIII-tubulin 1(TuJ1; Figures S2C and S2D). It is possible that a lower
level of Ascl1 might have been expressed in RGs as well as in aIPs, which may not have been captured
by low-dose TM induction. Newly postmitotic RFP+ cells expressed typical SPN markers such as CTIP2
as they reached the striatum, but not Nkx2.1, a marker of GABAergic interneurons derived from the
medial ganglionic eminence (MGE), suggesting that all fate-mapped cells were SPNs (Figures S2E-
S2H).
We then examined the types of mature SPNs in P28 striatum derived from E10.5-labeled Ascl1+ aIPs
(Figures 2J-2N). Strikingly, early Ascl1+ aIPs gave rise almost exclusively to SPNs located within
striosomes. These neurons exhibited spiny dendrites and clustered into relatively discrete, widely
distributed zones that were positive for the striosome marker mu opioid receptor 1 (MOR1) and negative
for the matrix marker CalDAG-GEFI (CDGI) (Figures 2J-2L; Supplemental Movies 2 and 3) (Kawasaki
et al., 1998). Both confocal microscopy (Figures 4A and 4C) and serial two-photon tomography (STP;
peer-reviewed) is the author/funder. All rights reserved. No reuse allowed without permission. The copyright holder for this preprint (which was not. http://dx.doi.org/10.1101/244327doi: bioRxiv preprint first posted online Jan. 8, 2018;
(which was not peer-reviewed) is the author/funder. All rights reserved. No reuse allowed without permission. The copyright holder for this preprint. http://dx.doi.org/10.1101/244327doi: bioRxiv preprint first posted online Jan. 8, 2018;

8
Figure S7; Supplemental Movies 2-4) of the labeled brains demonstrated their morphology and showed
that these early aIP-derived SPNs (herein designated as S cells) projected their axons to the dopamine-
containing domain of the substantia nigra pars compacta (SNc), a defining feature of striosomal SPNs
(Gerfen, 1984; Jiménez-Castellanos and Graybiel, 1989; Crittenden et al 2016). The small fraction of
SPNs located in matrix might correspond to the cells described as “exo-patch SPNs” (Smith et al.,
2016), long seen in most strisomal preparations (Graybiel and Hickey, 1982; Newman et al., 2015;
Graybiel, 1984), likely cells that have not fully completed migration to striosomes but are S cell in type,
as the axons of labeled SPNs formed dense projections to SNc, characteristic of S cells. Indeed,
throughout the period from E9.5 to E12.5, these Ascl1+ aIPs almost exclusively generated S cells and not
M cells (Figures 2P, 2Q, 5 and S4B).
To further verify that S cells were indeed born from Ascl1+ aIPs within this time-window, we combined
TM induction at E10.5 followed with BrdU birth dating of their neuronal progeny at several time points
(in different litters), including at 4, 24, and 48 hours after TM induction (Figure 2R). These experiments
demonstrated that the peak of S cell production from E10.5 aIPs was between E10.5 and E11.5,
followed by a sharp decline before E13.5 (Figure 2R). Together, these findings suggest that the early
cohorts of Ascl1+ aIPs were fate-restricted to produce striosomal SPNs from E10 to ~E12, and
confirmed that early Ascl1+ aIPs do not linger in the VZ for >24 hours.
As the homeobox gene Dlx1/2 is also implicated in LGE neurogenesis and striatal development
(Anderson et al., 1997), we performed similar fate mapping using the Dlx1-CreER driver (Taniguchi et
al., 2011). Surprisingly, we found that during the early phase of LGE neurogenesis (E10.5), Dlx1 was
not expressed in progenitors in VZ but almost exclusively confined to postmitotic neurons in the mantle
zone (MZ; Figures 2E and 2F). Fate mapping of these early-born (E9.5-E12.5) Dlx1+ neurons to the
mature brain showed that they were almost exclusively S cells, similar to those deriving from Ascl1+
aIPs during the same embryonic time (also see Figure 5). This result suggests that Dlx1 likely acts
down-stream and/or subsequent to Ascl1 during this early phase, possibly in regulating the migration
and maturation of postmitotic SPNs.
A Set of Basal Intermediate Progenitors Are Fate-Restricted to Generate Matrix SPNs
The nearly exclusive fate restriction of early aIPs for S cell production prompted us to examine later
phases of LGE neurogenesis from different types of progenitors. At E14.5, 8 hour pulse-chase in Tis21-
CreER;Ai14 embryos continued to label VZ RGs with apical end-feet (Figures 3A and 3E). In addition,
peer-reviewed) is the author/funder. All rights reserved. No reuse allowed without permission. The copyright holder for this preprint (which was not. http://dx.doi.org/10.1101/244327doi: bioRxiv preprint first posted online Jan. 8, 2018;
(which was not peer-reviewed) is the author/funder. All rights reserved. No reuse allowed without permission. The copyright holder for this preprint. http://dx.doi.org/10.1101/244327doi: bioRxiv preprint first posted online Jan. 8, 2018;

9
large numbers of Ascl1+ bIPs were labeled in the SVZ (Figures 3A and 3F), which were frequently
engaged in symmetric cytokinesis (Figure 3G), suggestive of neurogenic cell division. Among the total
RFP labeled cells, ~5% were putative RGs (located in VZ with end-feet and expression of the
proliferation marker Sox2), ~70% were bIPs (Ascl1+ in SVZ with no end-feet); and the remaining ~25%
of Ascl1− cells in SVZ likely represented other types of bIPs (e.g., Dlx1+) as well as new-born
postmitotic neurons (Figures 3H and 3I). Notably, in addition to RGs, 24-hour and 72-hour pulse-chase
showed the generation of almost exclusively bIPs and not of aIPs (Figures 3B-3D and S3A). In
particular, 72-hour pulse-chase demonstrated that Tis21+ RGs continued multiple rounds of self-renewal
during the late stage of embryonic development with ongoing generation of Ascl1+ progenitors in SVZ
(Figures 3C, 3D and S3B). These results suggest that during the late phase of LGE neurogenesis (from
E14.5 on), Tis21+ RGs persist to the end of neurogenesis (Figures S3E and S3F) and begin to
predominantly generate a new population of bIPs, possibly in addition to production of a much smaller
number of aIPs (see below).
For a more detailed analysis of the neuronal output of Ascl1+ bIPs, we further carried out analogous
embryonic fate mapping in E14.5 Ascl1-CreER;Ai14 mice. Eight-hour pulse-chase of Ascl1+ IPs labeled
few aIPs and many bIPs, which were identified as progenitors located in the SVZ without apical end-
feet (Figure 3K). Importantly, some E14.5-labeled bIPs remained in the SVZ at 24 hours post-induction
(Figures 3L S3C and S3D). As the cell-cycle length of LGE IPs at this time is only ~12 hours, this
finding corroborated results from live imaging experiments (Pilz et al., 2013) and suggested that some
bIPs may serve as transit-amplifying progenitors that proliferate in the SVZ before neurogenesis (Figure
3J). To identify the SPN types derived from late-phase Ascl1+ bIPs, we analyzed P28 striatum following
E14.5 induction of Ascl1-CreER;Ai14 mice and detected only M cells (Figures 3Q, 3U and 3V). These
results indicate that late-phase Ascl1+ bIPs are fate-restricted to generate M cells.
As Dlx1 may act downstream and/or in parallel to Ascl1 in the LGE (Long et al., 2009), we also
performed systematic fate mapping using the Dlx1-CreER;Ai14 mice throughout LGE neurogenesis
(Figures 3N-3P and 5). Similar to the early-phase Dlx1+ cells’ positions, late phase (E13.5 to 17.5),
pulse-chase of Dlx1+ cells labeled post-mitotic neurons in the MZ, but excluded RGs and aIPs in the VZ
(Figures 3N-3P and S3G-S3J). In striking contrast to the early-phase pulse-chase results, however, late-
phase pulse-chase did prominently label bIPs with no apical end-feet throughout the SVZ (Figures 3N-
3P). Thus, the recruitment of Dlx1 transcription factor distinguished putative bIPs from aIPs.
Furthermore, when assaying fate-mapped SPNs in the mature striatum, we found that late-phase Dlx1+
peer-reviewed) is the author/funder. All rights reserved. No reuse allowed without permission. The copyright holder for this preprint (which was not. http://dx.doi.org/10.1101/244327doi: bioRxiv preprint first posted online Jan. 8, 2018;
(which was not peer-reviewed) is the author/funder. All rights reserved. No reuse allowed without permission. The copyright holder for this preprint. http://dx.doi.org/10.1101/244327doi: bioRxiv preprint first posted online Jan. 8, 2018;

10
bIPs also specifically produced SPNs of the matrix compartment (Figures 3R-3V). These M cells
formed an expansive and dense field of SPNs within which unlabeled striosomes were embedded
(Figures 3R-3T). Over 98% of these IP progeny were co-labeled with the matrix marker CDGI, but not
with the striosome marker MOR1. These SPNs projected primarily to the non-dopamine-containing SNr,
largely sparing the dopaminergic SNc (Figures 4B, 4D and S4C; Supplemental Movie 5). Together with
evidence from analysis of Ascl1 and Dlx1 mutant mice (Yun et al., 2002), these results suggest that
during the late phase, Dlxl likely acts down-stream and/or in coordination with Ascl1 in bIPs to promote
M cell production, in addition to its role in postmitotic SPNs.
The Sequential Production of Striosomal and Matrix SPNs is Punctuated by a Sharp Transition
Period
As Ascl1 and Dlx1 are expressed in the LGE throughout embryonic neurogenesis and are thought to act
sequentially as well as in parallel in regulating striatal patterning (Long et al., 2009; Wang et al., 2013),
we extended our analyses by performing an extensive set of fate-mapping experiments with Ascl1- and
Dlx1-driver mice in time-steps of 0.5-1.0 day spanning the entire embryonic neurogenic period from
E9.5 to E18.5 (Figures 5 and S4). The results (Figure 5) indicated a surprisingly sharp shift in
neurogenic programs for the generation of striosomal and matrix SPNs, likely driven by largely distinct
S cell-producing aIPs (aIPS) and M cell-producing bIPs (bIPM) pools.
In summary, during an early phase (E9.5-E12.5), Ascl1 is expressed in aIPs and Dlx1 in postmitotic
neurons; TM induction of both drivers predominantly labeled S cells (Figures 5A and 5C). This early
period was followed by a transition phase in which there was a rapid decline of S cell production
starting around E12.5. From E13.5 on, S cell production became negligible, whereas the labeling of M
cells from both drivers was strongly initiated at ~E13.5 and rose sharply within ~24 hours to peak levels.
In the subsequent late phase, Ascl1 expression shifted from aIPs in the VZ to bIPs in the SVZ, whereas
Dlx1 expression emerged specifically in SVZ bIPs in addition to postmitotic SPNs in the MZ. Between
E13.5 and E18.5, the Ascl1 driver initially labeled progenitors producing M cells until ~E16.5, before a
sharp decline that was correlated with a switch to the generation of glial cells from the LGE (Figures 5A
and 5D). By contrast, the Dlx1 driver persisted in marking progenitors in an active phase of M cell
production until the end of neurogenesis at ~E18.5. During both the early and transition phases, the
onset and progression of S cell production and the switch from S to M cell production occurred earlier in
the Ascl1 driver than in the Dlx1 driver, suggesting that Dlx1 might act downstream of Ascl1 in a
transcription cascade that regulates neurogenesis and SPN specification. The MZ expression of Dlx1 in
peer-reviewed) is the author/funder. All rights reserved. No reuse allowed without permission. The copyright holder for this preprint (which was not. http://dx.doi.org/10.1101/244327doi: bioRxiv preprint first posted online Jan. 8, 2018;
(which was not peer-reviewed) is the author/funder. All rights reserved. No reuse allowed without permission. The copyright holder for this preprint. http://dx.doi.org/10.1101/244327doi: bioRxiv preprint first posted online Jan. 8, 2018;

11
the early and late phase neurogenesis is consistent with this notion (Figures 2E and S3G). The
divergence of Ascl1 and Dlx1 cell progeny in the late phase, with Ascl1 driving the production of glia
and Dlx1 driving production of M cells, suggests that Ascl1 and Dlx1 probably also act in parallel
neurogenetic programs during cell type specification.
Collectively, these results support the existence of two distinct and sequential types of LGE IPs that
generate the SPNs of the two major neurochemical compartments of the striatum. An early set of aIPS in
the VZ generate striosomes with limited neurogenic capacity, whereas a late-activated set of bIPM
generate matrix SPNs with expanded capacity. Quantification of the total number of fate-mapped S and
M cells across the embryonic neurogenic period indicated that the proportion of S and M cells produced
was, respectively, approximately 20% and 80% (Figure 5F), matching the approximate ratio of total S
and M cells estimated for the mature striatum (Johnston et al., 1990; Mikula et al., 2009).
Given that both Ascl1 and Dlx1 are expressed not only in the LGE but also in the MGE, which generates
both cortical and striatal interneurons (Marin et al., 2000; Zhao et al., 2003), it was possible that striatal
interneurons were also labeled by TM induction in these driver lines, and that these contributed to, or
obscured, the striosome and matrix patterning that we observed. To address the degree to which MGE-
derived GABAergic interneurons were intermixed with fate-mapped SPNs derived from the LGE, we
devised an intersectional strategy specifically to fate map Ascl1+ or Dlx1+ progenitors within the MGE
(Figure S5). We combined Ascl1-CreER or Dlx1-CreER drivers with a constitutively active Nkx2.1-Flp
driver (which targets all Nkx2.1 positive MGE progenitors; He et al., 2016) and the intersectional Ai65
reporter (Madisen et al., 2015) by crossing the corresponding mouse lines. This approach allowed us to
restrict fate mapping to Ascl1+ and Dlx1+ progenitors in the MGE and preoptic area, yielding only
GABAergic interneurons following TM induction at any given time point (Figure S5). Consistent with
previous reports, the overwhelming majority of MGE-derived GABAergic interneurons were born
during late embryonic days (~90% from E16.5-E18.5), with very few originating during the period of
striosome neurogenesis (Figures S5B-S5D). Similarly, we found parvalbumin-positive and somatostatin-
positive interneurons to be scarce within fate-mapped striosomes, but to be located in the matrix
compartment when labeled (Figure S6). Cholinergic interneurons were also not observed to be part of
Ascl1 and Dlx1 fate-mapped cohorts regardless of induction time, whether from MGE only
(intersection) or MGE/LGE (Ai14) (Figure S6). This result suggests that striatal cholinergic interneurons
have a distinct progenitor origin from SPNs in the LGE, or that they are generated at a time-point or
location not covered by our analysis.
peer-reviewed) is the author/funder. All rights reserved. No reuse allowed without permission. The copyright holder for this preprint (which was not. http://dx.doi.org/10.1101/244327doi: bioRxiv preprint first posted online Jan. 8, 2018;
(which was not peer-reviewed) is the author/funder. All rights reserved. No reuse allowed without permission. The copyright holder for this preprint. http://dx.doi.org/10.1101/244327doi: bioRxiv preprint first posted online Jan. 8, 2018;

12
The Temporal and Spatial Sequence of SPN Settlement in the Striatum Include a Final Cohort
That Constitutes Peri-Striosomal Rings
Consistent with previous studies (Krushel et al., 1993; van der Kooy and Fishell, 1987; Newman et al.,
2015)Hagimoto et al., 2017; we observed strong spatial gradients in the settling of SPNs along both the
lateral-medial and caudal-rostral axes according to the time of Ascl1 and Dlx1expression (Figures 5 and
S7; Supplemental Movie 6). More specifically, the SPNs of the matrix compartment not only follow
such developmental time-dependent gradient distributions, but are further divided into extended mosaics
of cell-clusters (“matrisomes”), which become obvious in tracing experiments demonstrating the input-
output organization of the matrix (Flaherty and Graybiel, 1993, 1994; Giménez-Amaya and Graybiel,
1991). Although tract-tracing (Alloway et al., 1999) and 2-deoxy-glucose (Brown et al., 2002) analyses
suggest that such patchiness occurs in the striatal matrix in rodents, matrisomes are not visible in
conventional histological preparations. Nevertheless, we found a striking non-uniformity in the matrix in
our fate-maps: a gap around striosomes with SPNs labeled from E15-E17 cohorts (Figure 3S) that were
filled in by a peri-striosomal distribution of the last-born E18 cohort of SPNs (Figure 6). These E18-
derived SPNs adhered tightly to the borders striosomes (Figures 6A-6E), and were reminiscent of the
peri-striosomal rings demarcated at maturity by immunochemical markers and interneuron distributions
observed in primates and humans (Faull et al., 1989; Holt et al., 1997; Graybiel and Ragsdale, 1980). It
is thought that these peri-striosomal regions may functionally link striosome and matrix compartments
(Banghart et al., 2015; Brimblecombe and Cragg, 2015; Miura et al., 2007). We found that peri-striosomal
cells were born almost exclusively during the terminal rounds of neurogenesis at E18.5 (Figure 6). These cells
accounted for ~65% of total E18.5 fate-mapped SPNs in whole striatum at P28. Regionally they were more
enriched in rostral striatum (~80% of fate-mapped SPNs), reflecting the fact that there were also a significant
number of caudal matrix SPNs still being generated at this late time, which mainly populated the medial
matrisomes bordering the lateral ventricle (Figures 6C-6F). We also noted similar ring-like structures
surrounded MOR1-positive patchy zones in the ventral striatum (Figure 6A). Overall, we conclude that
M cells generated from E15.5-E18.5 were deployed in a distal to proximal sequence in relation to the
striosomes (Figures 6G-6I). As the RFP-labeled axons of the late-born peri-striosomal M cells
innervated both pallidal segments and the SNr, the typical pattern of M cell axons, it is highly likely that
at least part of the peri-striosomal M cells correspond to the annular compartment as originally
designated by Faull et al. (1989).
peer-reviewed) is the author/funder. All rights reserved. No reuse allowed without permission. The copyright holder for this preprint (which was not. http://dx.doi.org/10.1101/244327doi: bioRxiv preprint first posted online Jan. 8, 2018;
(which was not peer-reviewed) is the author/funder. All rights reserved. No reuse allowed without permission. The copyright holder for this preprint. http://dx.doi.org/10.1101/244327doi: bioRxiv preprint first posted online Jan. 8, 2018;

13
Direct and Indirect Pathway SPNs in the Striosomes and Matrix Originate Independently within
Both aIPS and bIPM
How the neurogenic programs producing striosome-matrix architecture relate to the generation of SPNs
of the direct and indirect pathways has long been a major question about basal ganglia organization.
Direct and indirect classes of SPNs are distinguished from one another by multiple molecular markers,
including their differential expression of D1 or D2 variants of the dopamine receptor (Gerfen et al.,
1990; Harrison et al., 1990; Richfield et al., 1989). These markers occur in both striosomes and matrix,
but in sharp contrast to the ~1:5 ratio of spatial compartmentalization of striosomal and matrix SPNs,
dSPNs and iSPNs are intermixed in both compartments (Fujiyama et al., 2011; Gerfen and Scott Young,
1988; Flaherty and Graybiel, 1994; Banghart et al., 2015; Brimblecombe and Cragg, 2017; Salinas et al.,
2016).
To determine whether S- and M-cell fates relate to the acquisition of direct and indirect pathway fates,
we distinguished the dSPNs and iSPNs in our genetic fate mapping of the striosome and matrix
compartments by relying on the tight correlation between dSPN with D1 receptor expression and iSPN
with D2 receptor expression (Gerfen et al., 1990; Harrison et al., 1990; Richfield et al., 1989). We
identified these SPNs by fluorescent mRNA double in situ hybridization with D1 and tdTomato probes
or with D2 and tdTomato probes performed on brain sections in Ascl1-CreER;Ai14 and Dlx1-
CreER;Ai14 mice induced at specific embryonic times. Thus we simultaneously identified neurons of
the striosome and matrix compartments in terms of their D1 and D2 expression levels (Figure 7).
The spatial pattern of tdTomato mRNA-expressing S cell clusters was readily distinguishable from the
M cell distributions. By contrast, D1 and D2 mRNA signals were evenly distributed in apparently equal
numbers intermixed throughout the striatum (Figures 7C and 7D). Among S cells labeled by TM
induction of Ascl1-CreER;Ai14 mice at E10.5 and E12.5, approximately equal ratios of D1 and D2 cells
were detected, with a slight enrichment of D1 cells (Figure 7I). Similarly, among M cells labeled by TM
induction of Ascl1-CreER;Ai14 mice at E15.5, we found equal numbers of D1 and D2 cells (Figure 7I).
Among M cells labeled by TM induction of Dlx1-CreER;Ai14 mice at E17.5, again both D1 and D2
cells were detected, but with a significant enrichment of D2 cells (Figure 7I). Together, these results
indicate that, at least at the population level, the generation of dSPNs vs. iSPNs is not specified by a
program analogous to one that generates striosome vs. matrix compartments. The remarkable conclusion
suggested by these results is that the specification of a direct-indirect pathway fate appears to be mainly
peer-reviewed) is the author/funder. All rights reserved. No reuse allowed without permission. The copyright holder for this preprint (which was not. http://dx.doi.org/10.1101/244327doi: bioRxiv preprint first posted online Jan. 8, 2018;
(which was not peer-reviewed) is the author/funder. All rights reserved. No reuse allowed without permission. The copyright holder for this preprint. http://dx.doi.org/10.1101/244327doi: bioRxiv preprint first posted online Jan. 8, 2018;

14
independent of striosome-matrix fate and manifests within both the aIPS and bIPM progenitor pools,
though with a slightly skewed distribution toward a D1-striosome/D2-matrix bias.
DISCUSSION
Two fundamental categories of vertebrate behaviors that enhance fitness encompass action selection,
involving evaluation of multiple options, and action evaluation, based on behavioral outcome. In
mammals, action selection and evaluation are crucially regulated by basal ganglia circuitry (Amemori et
al., 2011; Graybiel, 2008; Hikosaka et al., 2014), through which the cerebral cortex modulates a wide
range of volitional and habitual behaviors. As the recipient of multi-modal information represented in
different neocortical areas and thalamic nuclei, the striatum is thought to reconfigure and then to forward
the resultant signals to basal ganglia output circuits to initiate and maintain appropriate actions while
suppressing others, and to evaluate their outcomes(Mink, 1996; Graybiel and Grafton, 2015). To support
such sophisticated operations, the circuit architecture of the striatum is subdivided into striosome and
matrix compartments, each further containing direct and indirect pathway subdivisions of SPNs as
defined by their selective expression of dopamine receptor variants. Here, we have discovered that the
basic plan for assembling the striatal circuit architecture has its root in a developmental program
embedded in the LGE RGs and their lineage progression, which generate distinct fate-restricted IPs to
specify SPNs into striosome and matrix types, upon which an independent and secondary mechanism
divides SPNs into the direct and indirect pathways. This set of findings raises the possibility that the
deployment of different progenitor types may reflect an evolutionarily conserved mechanism to
assemble striosomal and matrix circuits that mediate distinct behavioral categories involving action
selection and evaluation (Grillner and Robertson, 2015; Amemori et al., 2011; Graybiel, 1997; Graybiel
and Kimura, 1995; Graybiel, 1997; Houk et al., 1994) while the approximately equal ratio of intermixed
direct and indirect pathway SPNs within the two compartments could represent a mechanism for more
flexible configuration of functional sub-circuits based on specific outcome evaluation and motor
outcome (i.e., experience). This view further raises the intriguing and more general possibility that, as in
invertebrates in which cell lineage and developmental genetic program shape circuits and behavior (e.g.,
Harris et al., 2015), a developmental ground plan in mammalian telencephalic neural progenitors may
direct the assembly of certain basic forebrain circuit organization underlying high-order behaviors.
Lineage Dependent and Independent Production of Different Types of SPNs
peer-reviewed) is the author/funder. All rights reserved. No reuse allowed without permission. The copyright holder for this preprint (which was not. http://dx.doi.org/10.1101/244327doi: bioRxiv preprint first posted online Jan. 8, 2018;
(which was not peer-reviewed) is the author/funder. All rights reserved. No reuse allowed without permission. The copyright holder for this preprint. http://dx.doi.org/10.1101/244327doi: bioRxiv preprint first posted online Jan. 8, 2018;

15
The actions of specific transcription factors, such as Gsx1/2, Ascl1, and Dlx1/2, as well as Notch
signaling, mediate cell autonomous and non-autonomous regulation of neurogenesis in the LGE and
control ordered production of striatal neurons (Mason, 2005; Yun et al., 2002). It has been suggested
that the early LGE contains Gsx1/2+ neuroepithelial (NE) cells that give rise to multiple progenitor
states characterized by Ascl1 and Dlx expression (Martín-Ibáñez et al., 2012; Yun et al., 2002).
Ascl1+/Dlx1/2− and Ascl1+/Dlx1/2+ progenitors are inferred to emerge in a sequence (Martín-Ibáñez et
al., 2012) and to interact through Notch-mediated lateral inhibition to coordinate proliferation and
neurogenesis and to regulate orderly production of early- and late-born SPNs (Mason, 2005). Here, by
combining cellular resolution genetic fate mapping and neuronal birth dating, we were able to identify
distinct progenitor types, to uncover their lineage progression, and to track their neuronal progenies to
SPN types. Based on our findings, we propose a working model of the progenitor and lineage
mechanisms underlying the production of SPN types and their influence on striatal circuit architecture
(Figure 8).
According to this model, a multi-potent radial glial lineage sequentially allocates distinct intermediate
progenitor (IP) types to build striosome-matrix compartmentalization, and the division of direct and
indirect pathways occurs within each IP type secondary to the compartmental divide. More specifically,
the onset of neurogenesis in the VZ of early LGE (~E10) is marked by Tis21 expression in RGs, which
self-renew over multiple rounds to generate several types of IPs and all types of striatal SPNs. In the
early phase of this lineage progression, RGs may generate neurons directly and/or through aIPs
(including SNPs and SAPs) with dynamic ASCL1 expression patterns. Early aIPs (herein termed aIPS
cells) with sustained high ASCL1 levels are committed to produce striosomal SPNs with no or likely no
more than one round of amplification, thus limiting their neurogenic capacity. These aIPSs produce both
striosomal dSPNs and iSPNs in an approximately equal ratio. During a brief transition period starting
~E12.5, RGs undergo a rapid shift from generating aIPs to generating bIPs that are fate-restricted to
produce M cells (i.e., bIPM). Dlx1 is activated downstream and/or in parallel to Ascl1 in bIPM. A
possible rapid depletion of aIPSs may result in a sharp decline of S cell production, while the rapid rise
in the production of bIPMs promotes M cell genesis. In the next phase (E14.5-E17.5), Ascl1+ bIPMs first
promote M cell production and then switch to the generation of glial cells. By contrast, Dlx1+ bIPMs
persist in driving highly prolific M cell production throughout the late phase of LGE neurogenesis.
Many bIPMs may undergo one or more rounds of transit-amplifying proliferations before the final
neurogenic division, thereby increasing their neurogenic capacity, in addition to the prolific generation
of bIPs by RGs through aIPs, and likely proliferation of the RG pool itself. Such mechanisms likely
peer-reviewed) is the author/funder. All rights reserved. No reuse allowed without permission. The copyright holder for this preprint (which was not. http://dx.doi.org/10.1101/244327doi: bioRxiv preprint first posted online Jan. 8, 2018;
(which was not peer-reviewed) is the author/funder. All rights reserved. No reuse allowed without permission. The copyright holder for this preprint. http://dx.doi.org/10.1101/244327doi: bioRxiv preprint first posted online Jan. 8, 2018;

16
account for the significant numerical expansion of the matrix relative to the striosome compartment. At
the final stage (~E18.5), Dlx1+ IPs generate SPNs destined to form peri-striosomal ring structures, of
which some subset likely contribute to the annular compartment. Throughout bIPM-mediated
neurogenesis, as during the aIPS-mediated period that precedes it, a similar ratio of matrix dSPNs and
iSPNs are generated, with a bias toward iSPNs at the end of bIPM neurogenesis.
Our fate-mapping method cannot distinguish direct vs. indirect neurogenesis from Tis21+ RGs.
Additionally, the mechanism underlying the shift of RG state from aIP S to bIPM production is unknown
and might involve RG intrinsic (e.g., tracking cell division number) or extrinsic (e.g., signaling from
increasing number of S cells) processes; transcriptome analysis of early and late RGs may uncover the
molecular basis.
The Relation of Striosome-Matrix to Direct-Indirect Pathway SPN Origins
A remarkable finding from our fate-mapping experiments is that dSPNs and iSPNs appear to derive
from a different developmental process than that giving rise to the striosome and matrix compartments:
both dSPNs and iSPNs derive from both aIPS and bIPM pools and in approximately equal or biased
ratios, depending on the embryonic day, throughout the LGE neurogenic window. How could such a
consistent pathway division be set up within the developmental process giving rise to striosomes and
matrix? One possibility is that when S or M cells are first specified, they are neutral with respect to the
D1-D2 distinction, so that these phenotypes are acquired in response to environmental factors or cell-
cell interactions. An alternative possibility is that the D1 and D2 fates emerge together with the
fundamental distinction into striosome or matrix identities. Thus, it is formally possible that, within the
aIPS and bIPM pools, subsets of IPs are further fate-restricted to generate direct vs. indirect pathway S
cells, and direct vs. indirect pathway M cells. We also note that a stochastic mechanism (Boije et al.,
2014) might be well suited to generate the characteristic ratio of the two pathway SPNs, as stochastic
decisions can produce a mosaic of fates within a population of cells, and they can be integrated into
developmental programs and directed to yield robust and reproducible outcomes (Boije et al., 2014;
Johnston and Desplan, 2010). Such a stochastic mechanism for D1 vs. D2 fate could manifest itself
either at the step of IP generation from RGs or at the final neurogenic division of individual IPs. Nearly
equal or biased ratios of highly intermixed dSPNs and iSPNs generated by stochastic fate choice from
IPs could lay out a template in both striosomes and matrix upon which learning and experience can
shape behaviorally relevant functional sub-circuits.
peer-reviewed) is the author/funder. All rights reserved. No reuse allowed without permission. The copyright holder for this preprint (which was not. http://dx.doi.org/10.1101/244327doi: bioRxiv preprint first posted online Jan. 8, 2018;
(which was not peer-reviewed) is the author/funder. All rights reserved. No reuse allowed without permission. The copyright holder for this preprint. http://dx.doi.org/10.1101/244327doi: bioRxiv preprint first posted online Jan. 8, 2018;

17
The Significance of Distinct IPs and Their Differential Amplification for the Production of
Striosomal and Matrix SPNs
In addition to differences in input-output connectivity and behavioral function, the striosome and matrix
compartments differ substantially in size and maintain an approximately 1:4 ratio that is conserved
across mammalian species. The mechanisms underlying this size difference between the two
compartments is not well understood. Our finding that distinct IP types with different neurogenic
capacities are fate restricted for S vs. M cell production provides plausible mechanisms. First, a larger
number of bIPsM are generated from RGs during a longer late phase and possibly through late-phase
aIPs that further amplify bIPsM numbers. Second, individual bIPsM undergo more rounds of transit
amplification compared to early aIPsS. We suggest that aIPS-mediated generation of SPNs in the early
phase forms an evolutionarily conserved basic template for evaluative circuits. On the other hand, bIPM-
mediated amplification (starting from ~E13) dramatically increases the production of matrix SPNs and
could underlie the development of the much larger matrix compartment with potential further
diversification such the peri-striosomal rings. The greatly expanded matrix SPN population may provide
the basis underlying flexibility for building a large repertoire of basal ganglia circuits contributing to
action selection and motor skill learning in parallel with the expansion of the neocortex.
The recognition of the distinction between the developmental plan for striosome-matrix
compartmentalization and its relation to the direct-indirect pathway subdivision of SPNs opens the way
to a deeper examination of striatal circuitry linking development and behavior. As these two
organizational plans are now known to harbor different disease vulnerabilities, for example, of
striosomes in mood disorders in Huntington’s disease patients and of D2-bearing striatal neurons in
Parkinson’s disease, these findings may have significance for understanding the developmental and
circuitry etiology of these clinical disorders (Crittenden and Graybiel , 2016).
EXPERIMENTAL PROCEDURES
Mice
Mouse lines are described in the Supplemental Experimental Procedures. All experiments and
procedures are performed according to NIH guidelines and approved by the IACUC at Cold Spring
Harbor Laboratory and at Massachusetts Institute of Technology.
Inducible Genetic Fate Mapping
peer-reviewed) is the author/funder. All rights reserved. No reuse allowed without permission. The copyright holder for this preprint (which was not. http://dx.doi.org/10.1101/244327doi: bioRxiv preprint first posted online Jan. 8, 2018;
(which was not peer-reviewed) is the author/funder. All rights reserved. No reuse allowed without permission. The copyright holder for this preprint. http://dx.doi.org/10.1101/244327doi: bioRxiv preprint first posted online Jan. 8, 2018;

18
Inducible genetic fate-mapping methods are described in the Supplemental Experimental Procedures.
Tamoxifen Induction and BrdU Birth Dating
To reduce toxicity to pregnant females and enable sparse cellular labeling, pregnant female mice were
submitted to gavage with low to medium dose tamoxifen (dissolved in corn oil by gentle agitation for 24
hours), using an 18-gauge 50 mm gavage tool. Doses were in the range of 0.15 mg/30 g body weight
(BW) up to 5 mg/30 g BW (5 mg/Kg BW–165 mg/Kg BW), with most experiments performed using
doses below 1.5 mg/30 g BW. For BrdU birth dating, pulses of BrdU were intraperitoneally injected into
pregnant mice at a dose of 5 mg/100 g BW, spaced 4 or 24 hours after TM induction on E10.
Immunohistochemistry and Microscopy
Immunohistochemistry and microscopy are described in the Supplemental Experimental Procedures.
Double Fluorescent in situ Hybridization
Two-probe fluorescent in situ hybridization was performed on fresh frozen 12 µm thick cryosections of
P28 mouse brains using the QuantiGene ViewRNA ISH assay from Affymetrix. Briefly, tissue was
treated with formaldehyde fixation, protease digestion, target and label probe incubation, and buffer
washing according to the QuantiGene Affymetrix protocol. Tissue was then co-labeled with fluorescent
Nissl and imaged using a DeltaVision epifluorescent microscope (details described in Supplemental
Experimental Procedures).
Imaging and Serial Reconstruction of Whole Brains
Imaging and methods for serial reconstruction of whole brains are described in the Supplemental
Experimental Procedures.
Quantification and Data Analysis
Quantification and data analysis are described in the Supplemental Experimental Procedures.
AUTHOR CONTRIBUTIONS
Z.J.H and A.M.G. conceived and organized the study. S.M.K. and Z.J.H. designed the experiments.
S.M.K., P.W. and M.H. designed and generated Tis21-2A-CreER and Nkx2.1-ires-Flp knock-in mouse
lines. S.M.K and R.R. conducted primary genetic fate-mapping experiments and embryonic pulse-chase
peer-reviewed) is the author/funder. All rights reserved. No reuse allowed without permission. The copyright holder for this preprint (which was not. http://dx.doi.org/10.1101/244327doi: bioRxiv preprint first posted online Jan. 8, 2018;
(which was not peer-reviewed) is the author/funder. All rights reserved. No reuse allowed without permission. The copyright holder for this preprint. http://dx.doi.org/10.1101/244327doi: bioRxiv preprint first posted online Jan. 8, 2018;

19
experiments. J.L., L.G.G. and A.M.G. performed comprehensive tamoxifen inductions and histology for
each half-day fate-mapping time point and collected brain samples for in situ hybridization experiments.
S.M.K. completed fluorescent double in situ experiments. S.M.K., Y.K. and P.O. performed serial two-
photon imaging experiments. J.L. and K.M. contributed to immunostaining and imaging of striatal
interneuron markers in fate-mapped cells. Z.J.H, A.M.G. and S.M.K. wrote the manuscript.
ACKNOWLEDGMENTS
We are grateful to Sang Yong Kim for help with generation of knock-in mice, to Nour El-Amine for
help with imaging of fluorescent double in situ samples, and to Gord Fishell, Songhai Shi, Marcus
Stepheson-Jones, Bo Li, and Yasuo Kubota for discussions and invaluable comments on early versions
of this manuscript. This work was supported in part by a grant from the Simons Foundation to Z.J.H.
and A.M.G., by CSHL Robertson Neuroscience Fund to Z.J.H., by a grant from the CHDI Foundation
(A-5552) to A.M.G., and by support from the Saks Kavanaugh Foundation to A.M.G. S.M.K. was
supported by NRSA F30 Medical Scientist Predoctoral Fellowship 5F30MH102002-03, and L.G.G. was
supported in part by a Postdoctoral Fellowship from the William N. & Bernice E. Bumpus Foundation.
REFERENCES Albin, R.L., Young, A.B., and Penney, J.B. (1995). The functional anatomy of disorders of the basal
ganglia. Trends Neurosci. 18, 63–64.
Alloway, K.D., Crist, J., Mutic, J.J., and Roy, S.A. (1999). Corticostriatal projections from rat barrel
cortex have an anisotropic organization that correlates with vibrissal whisking behavior. J. Neurosci. 19,
10908–10922.
Amemori, K., Gibb, L.G., and Graybiel, A.M. (2011). Shifting responsibly: the importance of striatal
modularity to reinforcement learning in uncertain environments. Frontiers in Human Neuroscience 5,
47.
Anderson, S.A., Eisenstat, D.D., Shi, L., and Rubenstein, J.L. (1997a). Interneuron migration from basal
forebrain to neocortex: dependence on Dlx genes. Science 278, 474–476.
Anderson, S.A., Qiu, M., Bulfone, A., Eisenstat, D.D., Meneses, J., Pedersen, R., and Rubenstein, J.L.
peer-reviewed) is the author/funder. All rights reserved. No reuse allowed without permission. The copyright holder for this preprint (which was not. http://dx.doi.org/10.1101/244327doi: bioRxiv preprint first posted online Jan. 8, 2018;
Work is also Supported also by NIMH grant 1S10OD021759-01
(which was not peer-reviewed) is the author/funder. All rights reserved. No reuse allowed without permission. The copyright holder for this preprint. http://dx.doi.org/10.1101/244327doi: bioRxiv preprint first posted online Jan. 8, 2018;

20
(1997b). Mutations of the homeobox genes Dlx-1 and Dlx-2 disrupt the striatal subventricular zone and
differentiation of late born striatal neurons. Neuron 19, 27–37.
Attardo, A., Calegari, F., Haubensak, W., Wilsch-Bräuninger, M., and Huttner, W.B. (2008). Live
imaging at the onset of cortical neurogenesis reveals differential appearance of the neuronal phenotype
in apical versus basal progenitor progeny. PLoS ONE 3, e2388.
Banghart, M.R., Neufeld, S.Q., Wong, N.C., and Sabatini, B.L. (2015a). Enkephalin Disinhibits Mu
Opioid Receptor-Rich Striatal Patches via Delta Opioid Receptors. Neuron 88, 1227–1239.
Banghart, M.R., Neufeld, S.Q., Wong, N.C., and Sabatini, B.L. (2015b). Enkephalin Disinhibits Mu
Opioid Receptor-Rich Striatal Patches via Delta Opioid Receptors. Neuron 88, 1227–1239.
Boije, H., MacDonald, R.B., and Harris, W.A. (2014). Reconciling competence and transcriptional
hierarchies with stochasticity in retinal lineages. Curr. Opin. Neurobiol. 27, 68–74.
Brimblecombe, K.R., and Cragg, S.J. (2015). Substance P Weights Striatal Dopamine Transmission
Differently within the Striosome-Matrix Axis. J. Neurosci. 35, 9017–9023.
Brimblecombe, K.R., and Cragg, S.J. (2017). The Striosome and Matrix Compartments of the Striatum:
A Path through the Labyrinth from Neurochemistry toward Function. ACS Chem Neurosci 8, 235–242.
Brown, K.N., Chen, S., Han, Z., Lu, C.-H., Tan, X., Zhang, X.-J., Ding, L., Lopez-Cruz, A., Saur, D.,
Anderson, S.A., et al. (2011). Clonal production and organization of inhibitory interneurons in the
neocortex. Science 334, 480–486.
Brown, L.L., Feldman, S.M., Smith, D.M., Cavanaugh, J.R., Ackermann, R.F., and Graybiel, A.M.
(2002). Differential metabolic activity in the striosome and matrix compartments of the rat striatum
during natural behaviors. J. Neurosci. 22, 305–314.
Casarosa, S., Fode, C., and Guillemot, F. (1999). Mash1 regulates neurogenesis in the ventral
telencephalon. Development 126, 525–534.
Crittenden, J.R., and Graybiel, A.M. (2011). Basal Ganglia disorders associated with imbalances in the
striatal striosome and matrix compartments. Front Neuroanat 5, 59.
peer-reviewed) is the author/funder. All rights reserved. No reuse allowed without permission. The copyright holder for this preprint (which was not. http://dx.doi.org/10.1101/244327doi: bioRxiv preprint first posted online Jan. 8, 2018;
(which was not peer-reviewed) is the author/funder. All rights reserved. No reuse allowed without permission. The copyright holder for this preprint. http://dx.doi.org/10.1101/244327doi: bioRxiv preprint first posted online Jan. 8, 2018;

21
Crittenden, J. R. and Graybiel, A. M. (2016). Disease-associated changes in the striosome and matrix
compartments of the dorsal striatum. Chapter for Handbook of Basal Ganglia Structure and Function,
2e, edited by H. Steiner and K-Y Tseng
Crittenden, J.R., Tillberg, P.W., Riad, M.H., Shima, Y., Gerfen, C.R., Curry, J., Housman, D.E., Nelson,
S.B., Boyden, E.S., and Graybiel, A.M. (2016). Striosome-dendron bouquets highlight a unique
striatonigral circuit targeting dopamine-containing neurons. Proc. Natl. Acad. Sci. U.S.A. 113, 11318–
11323.
Cui, Y., Ostlund, S.B., James, A.S., Park, C.S., Ge, W., Roberts, K.W., Mittal, N., Murphy, N.P.,
Cepeda, C., Kieffer, B.L., et al. (2014). Targeted expression of µ-opioid receptors in a subset of striatal
direct-pathway neurons restores opiate reward. Nat. Neurosci. 17, 254–261.
Donoghue, J.P., and Herkenham, M. (1986). Neostriatal projections from individual cortical fields
conform to histochemically distinct striatal compartments in the rat. Brain Res. 365, 397–403.
Eblen, F., and Graybiel, A.M. (1995). Highly restricted origin of prefrontal cortical inputs to striosomes
in the macaque monkey. J. Neurosci. 15, 5999–6013.
Faull, R.L., Dragunow, M., and Villiger, J.W. (1989). The distribution of neurotensin receptors and
acetylcholinesterase in the human caudate nucleus: evidence for the existence of a third neurochemical
compartment. Brain Res. 488, 381–386.
Flaherty, A.W., and Graybiel, A.M. (1993). Output architecture of the primate putamen. J. Neurosci. 13,
3222–3237.
Flaherty, A.W., and Graybiel, A.M. (1994). Input-output organization of the sensorimotor striatum in
the squirrel monkey. J. Neurosci. 14, 599–610.
Florio, M., and Huttner, W.B. (2014). Neural progenitors, neurogenesis and the evolution of the
neocortex. Development 141, 2182–2194.
Franco, S.J., Gil-Sanz, C., Martinez-Garay, I., Espinosa, A., Harkins-Perry, S.R., Ramos, C., and Müller,
U. (2012). Fate-restricted neural progenitors in the mammalian cerebral cortex. Science 337, 746–749.
Freeze, B.S., Kravitz, A.V., Hammack, N., Berke, J.D., and Kreitzer, A.C. (2013). Control of basal
ganglia output by direct and indirect pathway projection neurons. J. Neurosci. 33, 18531–18539.
peer-reviewed) is the author/funder. All rights reserved. No reuse allowed without permission. The copyright holder for this preprint (which was not. http://dx.doi.org/10.1101/244327doi: bioRxiv preprint first posted online Jan. 8, 2018;
(which was not peer-reviewed) is the author/funder. All rights reserved. No reuse allowed without permission. The copyright holder for this preprint. http://dx.doi.org/10.1101/244327doi: bioRxiv preprint first posted online Jan. 8, 2018;

22
Friedman, A., Homma, D., Gibb, L.G., Amemori, K.-I., Rubin, S.J., Hood, A.S., Riad, M.H., and
Graybiel, A.M. (2015). A Corticostriatal Path Targeting Striosomes Controls Decision-Making under
Conflict. Cell 161, 1320–1333.
Fujiyama, F., Sohn, J., Nakano, T., Furuta, T., Nakamura, K.C., Matsuda, W., and Kaneko, T. (2011).
Exclusive and common targets of neostriatofugal projections of rat striosome neurons: a single neuron-
tracing study using a viral vector. Eur. J. Neurosci. 33, 668–677.
Gerfen, C.R. (1984). The neostriatal mosaic: compartmentalization of corticostriatal input and
striatonigral output systems. Nature 311, 461–464.
Gerfen, C.R. (1992). The neostriatal mosaic: multiple levels of compartmental organization in the basal
ganglia. Annu. Rev. Neurosci. 15, 285–320.
Gerfen, C.R., and Young, W.S. (1988). Distribution of striatonigral and striatopallidal peptidergic
neurons in both patch and matrix compartments: an in situ hybridization histochemistry and fluorescent
retrograde tracing study. Brain Res. 460, 161–167.
Gerfen, C.R., Engber, T.M., Mahan, L.C., Susel, Z., Chase, T.N., Monsma, F.J., and Sibley, D.R.
(1990). D1 and D2 dopamine receptor-regulated gene expression of striatonigral and striatopallidal
neurons. Science 250, 1429–1432.
Giménez-Amaya, J.M., and Graybiel, A.M. (1991). Modular organization of projection neurons in the
matrix compartment of the primate striatum. J. Neurosci. 11, 779–791.
Graybiel, A.M. (1984). Correspondence between the dopamine islands and striosomes of the
mammalian striatum. Neuroscience 13, 1157–1187.
Graybiel, A.M. (1997). The basal ganglia and cognitive pattern generators. Schizophr Bull 23, 459–469.
Graybiel, A.M. (2008). Habits, rituals, and the evaluative brain. Annu. Rev. Neurosci. 31, 359–387.
Graybiel, A.M., and Grafton, S.T. (2015). The striatum: where skills and habits meet. Cold Spring Harb
Perspect Biol 7, a021691.
Graybiel, A.M., and Hickey, T.L. (1982). Chemospecificity of ontogenetic units in the striatum:
demonstration by combining [3H]thymidine neuronography and histochemical staining. Proc. Natl.
Acad. Sci. U.S.A. 79, 198–202.
peer-reviewed) is the author/funder. All rights reserved. No reuse allowed without permission. The copyright holder for this preprint (which was not. http://dx.doi.org/10.1101/244327doi: bioRxiv preprint first posted online Jan. 8, 2018;
(which was not peer-reviewed) is the author/funder. All rights reserved. No reuse allowed without permission. The copyright holder for this preprint. http://dx.doi.org/10.1101/244327doi: bioRxiv preprint first posted online Jan. 8, 2018;

23
Graybiel, A.M., and Ragsdale, C.W. (1978). Histochemically distinct compartments in the striatum of
human, monkeys, and cat demonstrated by acetylthiocholinesterase staining. Proc. Natl. Acad. Sci.
U.S.A. 75, 5723–5726.
Graybiel, A.M., and Ragsdale, C.W. (1980). Clumping of acetylcholinesterase activity in the developing
striatum of the human fetus and young infant. Proc. Natl. Acad. Sci. U.S.A. 77, 1214–1218.
Graybiel, A.M., Aosaki, T., Flaherty, A.W., and Kimura, M. (1994). The basal ganglia and adaptive
motor control. Science 265, 1826–1831.
Grillner, S., and Robertson, B. (2015). The basal ganglia downstream control of brainstem motor
centres--an evolutionarily conserved strategy. Curr. Opin. Neurobiol. 33, 47–52.
Grillner, S., Hellgren, J., Ménard, A., Saitoh, K., and Wikström, M.A. (2005). Mechanisms for selection
of basic motor programs--roles for the striatum and pallidum. Trends Neurosci. 28, 364–370.
Guillemot, F., and Hassan, B.A. (2017). Beyond proneural: emerging functions and regulations of
proneural proteins. Curr. Opin. Neurobiol. 42, 93–101.
Hagimoto, K., Takami, S., Murakami, F., and Tanabe, Y. (2017). Distinct migratory behaviors of
striosome and matrix cells underlying the mosaic formation in the developing striatum. J. Comp. Neurol.
525, 794–817.
Hansen, D.V., Lui, J.H., Flandin, P., Yoshikawa, K., Rubenstein, J.L., Alvarez-Buylla, A., and
Kriegstein, A.R. (2013). Non-epithelial stem cells and cortical interneuron production in the human
ganglionic eminences. Nat. Neurosci. 16, 1576–1587.
Harris, R.M., Pfeiffer, B.D., Rubin, G.M., and Truman, J.W. (2015). Neuron hemilineages provide the
functional ground plan for the Drosophila ventral nervous system. Elife 4.
Harrison, M.B., Wiley, R.G., and Wooten, G.F. (1990). Selective localization of striatal D1 receptors to
striatonigral neurons. Brain Res. 528, 317–322.
Harwell, C.C., Fuentealba, L.C., Gonzalez-Cerrillo, A., Parker, P.R.L., Gertz, C.C., Mazzola, E., Garcia,
M.T., Alvarez-Buylla, A., Cepko, C.L., and Kriegstein, A.R. (2015). Wide Dispersion and Diversity of
Clonally Related Inhibitory Interneurons. Neuron 87, 999–1007.
Haubensak, W., Attardo, A., Denk, W., and Huttner, W.B. (2004). Neurons arise in the basal
peer-reviewed) is the author/funder. All rights reserved. No reuse allowed without permission. The copyright holder for this preprint (which was not. http://dx.doi.org/10.1101/244327doi: bioRxiv preprint first posted online Jan. 8, 2018;
(which was not peer-reviewed) is the author/funder. All rights reserved. No reuse allowed without permission. The copyright holder for this preprint. http://dx.doi.org/10.1101/244327doi: bioRxiv preprint first posted online Jan. 8, 2018;

24
neuroepithelium of the early mammalian telencephalon: a major site of neurogenesis. Proc. Natl. Acad.
Sci. U.S.A. 101, 3196–3201.
He, M., Tucciarone, J., Lee, S., Nigro, M.J., Kim, Y., Levine, J.M., Kelly, S.M., Krugikov, I., Wu, P.,
Chen, Y., et al. (2016). Strategies and Tools for Combinatorial Targeting of GABAergic Neurons in
Mouse Cerebral Cortex. Neuron 91, 1228–1243.
Hikosaka, O., Kim, H.F., Yasuda, M., and Yamamoto, S. (2014). Basal ganglia circuits for reward
value-guided behavior. Annu. Rev. Neurosci. 37, 289–306.
Holt, D.J., Graybiel, A.M., and Saper, C.B. (1997). Neurochemical architecture of the human striatum. J.
Comp. Neurol. 384, 1–25.
Houk, J.C., Davis, J.L., and Beiser, D.G. (1994). Models of information processing in the basal ganglia
(Cambridge, Mass.: MIT Press).
Iacopetti, P., Michelini, M., Stuckmann, I., Oback, B., Aaku-Saraste, E., and Huttner, W.B. (1999).
Expression of the antiproliferative gene TIS21 at the onset of neurogenesis identifies single
neuroepithelial cells that switch from proliferative to neuron-generating division. Proc. Natl. Acad. Sci.
U.S.A. 96, 4639–4644.
Imayoshi, I., and Kageyama, R. (2014). bHLH factors in self-renewal, multipotency, and fate choice of
neural progenitor cells. Neuron 82, 9–23.
Imayoshi, I., Isomura, A., Harima, Y., Kawaguchi, K., Kori, H., Miyachi, H., Fujiwara, T., Ishidate, F.,
and Kageyama, R. (2013). Oscillatory control of factors determining multipotency and fate in mouse
neural progenitors. Science 342, 1203–1208.
Jiménez-Castellanos, J., and Graybiel, A.M. (1989). Compartmental origins of striatal efferent
projections in the cat. Neuroscience 32, 297–321.
Johnston, R.J., and Desplan, C. (2010). Stochastic mechanisms of cell fate specification that yield
random or robust outcomes. Annu. Rev. Cell Dev. Biol. 26, 689–719.
Johnston, J.G., Gerfen, C.R., Haber, S.N., and van der Kooy, D. (1990). Mechanisms of striatal pattern
formation: conservation of mammalian compartmentalization. Brain Res. Dev. Brain Res. 57, 93–102.
Kawasaki, H., Springett, G.M., Toki, S., Canales, J.J., Harlan, P., Blumenstiel, J.P., Chen, E.J., Bany,
peer-reviewed) is the author/funder. All rights reserved. No reuse allowed without permission. The copyright holder for this preprint (which was not. http://dx.doi.org/10.1101/244327doi: bioRxiv preprint first posted online Jan. 8, 2018;
(which was not peer-reviewed) is the author/funder. All rights reserved. No reuse allowed without permission. The copyright holder for this preprint. http://dx.doi.org/10.1101/244327doi: bioRxiv preprint first posted online Jan. 8, 2018;

25
I.A., Mochizuki, N., Ashbacher, A., et al. (1998). A Rap guanine nucleotide exchange factor enriched
highly in the basal ganglia. Proc. Natl. Acad. Sci. U.S.A. 95, 13278–13283.
Kim, H.F., and Hikosaka, O. (2015). Parallel basal ganglia circuits for voluntary and automatic
behaviour to reach rewards. Brain 138, 1776–1800.
Kim, E.J., Ables, J.L., Dickel, L.K., Eisch, A.J., and Johnson, J.E. (2011). Ascl1 (Mash1) defines cells
with long-term neurogenic potential in subgranular and subventricular zones in adult mouse brain. PLoS
ONE 6, e18472.
van der Kooy, D., and Fishell, G. (1987). Neuronal birthdate underlies the development of striatal
compartments. Brain Res. 401, 155–161.
Kriegstein, A., Noctor, S., and Martínez-Cerdeño, V. (2006). Patterns of neural stem and progenitor cell
division may underlie evolutionary cortical expansion. Nat. Rev. Neurosci. 7, 883–890.
Krushel, L.A., Johnston, J.G., Fishell, G., Tibshirani, R., and van der Kooy, D. (1993). Spatially
localized neuronal cell lineages in the developing mammalian forebrain. Neuroscience 53, 1035–1047.
Long, J.E., Swan, C., Liang, W.S., Cobos, I., Potter, G.B., and Rubenstein, J.L.R. (2009). Dlx1&2 and
Mash1 transcription factors control striatal patterning and differentiation through parallel and
overlapping pathways. J. Comp. Neurol. 512, 556–572.
Lopez-Huerta, V.G., Nakano, Y., Bausenwein, J., Jaidar, O., Lazarus, M., Cherassse, Y., Garcia-Munoz,
M., and Arbuthnott, G. (2016). The neostriatum: two entities, one structure? Brain Struct Funct 221,
1737–1749.
Lui, J.H., Hansen, D.V., and Kriegstein, A.R. (2011). Development and evolution of the human
neocortex. Cell 146, 18–36.
Madisen, L., Garner, A.R., Shimaoka, D., Chuong, A.S., Klapoetke, N.C., Li, L., van der Bourg, A.,
Niino, Y., Egolf, L., Monetti, C., et al. (2015). Transgenic mice for intersectional targeting of neural
sensors and effectors with high specificity and performance. Neuron 85, 942–958.
Marin, O., Anderson, S.A., and Rubenstein, J.L. (2000). Origin and molecular specification of striatal
interneurons. J. Neurosci. 20, 6063–6076.
Martín-Ibáñez, R., Crespo, E., Esgleas, M., Urban, N., Wang, B., Waclaw, R., Georgopoulos, K.,
peer-reviewed) is the author/funder. All rights reserved. No reuse allowed without permission. The copyright holder for this preprint (which was not. http://dx.doi.org/10.1101/244327doi: bioRxiv preprint first posted online Jan. 8, 2018;
(which was not peer-reviewed) is the author/funder. All rights reserved. No reuse allowed without permission. The copyright holder for this preprint. http://dx.doi.org/10.1101/244327doi: bioRxiv preprint first posted online Jan. 8, 2018;
26
Martínez, S., Campbell, K., Vicario-Abejón, C., et al. (2012). Helios transcription factor expression
depends on Gsx2 and Dlx1&2 function in developing striatal matrix neurons. Stem Cells Dev. 21, 2239–
2251.
Martynoga, B., Drechsel, D., and Guillemot, F. (2012). Molecular control of neurogenesis: a view from
the mammalian cerebral cortex. Cold Spring Harb Perspect Biol 4.
Mason, H.A., Rakowiecki, S.M., Raftopoulou, M., Nery, S., Huang, Y., Gridley, T., and Fishell, G.
(2005). Notch signaling coordinates the patterning of striatal compartments. Development 132, 4247–
4258.
Mink, J.W. (1996). The basal ganglia: focused selection and inhibition of competing motor programs.
Prog. Neurobiol. 50, 381–425.
Miura, M., Saino-Saito, S., Masuda, M., Kobayashi, K., and Aosaki, T. (2007). Compartment-specific
modulation of GABAergic synaptic transmission by mu-opioid receptor in the mouse striatum with
green fluorescent protein-expressing dopamine islands. J. Neurosci. 27, 9721–9728.
Newman, H., Liu, F.-C., and Graybiel, A.M. (2015). Dynamic ordering of early generated striatal cells
destined to form the striosomal compartment of the striatum. J. Comp. Neurol. 523, 943–962.
Noctor, S.C., Martínez-Cerdeño, V., Ivic, L., and Kriegstein, A.R. (2004). Cortical neurons arise in
symmetric and asymmetric division zones and migrate through specific phases. Nat. Neurosci. 7, 136–
144.
Parthasarathy, H.B., Schall, J.D., and Graybiel, A.M. (1992). Distributed but convergent ordering of
corticostriatal projections: analysis of the frontal eye field and the supplementary eye field in the
macaque monkey. J. Neurosci. 12, 4468–4488.
Pilz, G.-A., Shitamukai, A., Reillo, I., Pacary, E., Schwausch, J., Stahl, R., Ninkovic, J., Snippert, H.J.,
Clevers, H., Godinho, L., et al. (2013). Amplification of progenitors in the mammalian telencephalon
includes a new radial glial cell type. Nat Commun 4, 2125.
Richfield, E.K., Penney, J.B., and Young, A.B. (1989). Anatomical and affinity state comparisons
between dopamine D1 and D2 receptors in the rat central nervous system. Neuroscience 30, 767–777.
Rubenstein, J.L.R., and Campbell, K. (2013). Chapter 24 - Neurogenesis in the Basal Ganglia. In
peer-reviewed) is the author/funder. All rights reserved. No reuse allowed without permission. The copyright holder for this preprint (which was not. http://dx.doi.org/10.1101/244327doi: bioRxiv preprint first posted online Jan. 8, 2018;
(which was not peer-reviewed) is the author/funder. All rights reserved. No reuse allowed without permission. The copyright holder for this preprint. http://dx.doi.org/10.1101/244327doi: bioRxiv preprint first posted online Jan. 8, 2018;

27
Patterning and Cell Type Specification in the Developing CNS and PNS, (Oxford: Academic Press), pp.
455–473.
Salinas, A.G., Davis, M.I., Lovinger, D.M., and Mateo, Y. (2016). Dopamine dynamics and cocaine
sensitivity differ between striosome and matrix compartments of the striatum. Neuropharmacology 108,
275–283.
Smith, J.B., Klug, J.R., Ross, D.L., Howard, C.D., Hollon, N.G., Ko, V.I., Hoffman, H., Callaway, E.M.,
Gerfen, C.R., and Jin, X. (2016). Genetic-Based Dissection Unveils the Inputs and Outputs of Striatal
Patch and Matrix Compartments. Neuron 91, 1069–1084.
Sousa, V.H., and Fishell, G. (2010). Sonic hedgehog functions through dynamic changes in temporal
competence in the developing forebrain. Curr. Opin. Genet. Dev. 20, 391–399.
Steiner, H., and Tseng, K.Y. (2010). Handbook of Basal Ganglia Structure and Function (Academic
Press).
Sudarov, A., Turnbull, R.K., Kim, E.J., Lebel-Potter, M., Guillemot, F., and Joyner, A.L. (2011). Ascl1
genetics reveals insights into cerebellum local circuit assembly. J. Neurosci. 31, 11055–11069.
Taniguchi, H., He, M., Wu, P., Kim, S., Paik, R., Sugino, K., Kvitsiani, D., Kvitsani, D., Fu, Y., Lu, J.,
et al. (2011). A resource of Cre driver lines for genetic targeting of GABAergic neurons in cerebral
cortex. Neuron 71, 995–1013.
Turrero García, M., and Harwell, C.C. (2017). Radial glia in the ventral telencephalon. FEBS Lett.
Wang, B., Long, J.E., Flandin, P., Pla, R., Waclaw, R.R., Campbell, K., and Rubenstein, J.L.R. (2013).
Loss of Gsx1 and Gsx2 function rescues distinct phenotypes in Dlx1/2 mutants. J. Comp. Neurol. 521,
1561–1584.
Watabe-Uchida, M., Zhu, L., Ogawa, S.K., Vamanrao, A., and Uchida, N. (2012). Whole-brain mapping
of direct inputs to midbrain dopamine neurons. Neuron 74, 858–873.
White, N.M., and Hiroi, N. (1998). Preferential localization of self-stimulation sites in
striosomes/patches in the rat striatum. Proc. Natl. Acad. Sci. U.S.A. 95, 6486–6491.
Yun, K., Fischman, S., Johnson, J., Hrabe de Angelis, M., Weinmaster, G., and Rubenstein, J.L.R.
(2002). Modulation of the notch signaling by Mash1 and Dlx1/2 regulates sequential specification and
peer-reviewed) is the author/funder. All rights reserved. No reuse allowed without permission. The copyright holder for this preprint (which was not. http://dx.doi.org/10.1101/244327doi: bioRxiv preprint first posted online Jan. 8, 2018;
(which was not peer-reviewed) is the author/funder. All rights reserved. No reuse allowed without permission. The copyright holder for this preprint. http://dx.doi.org/10.1101/244327doi: bioRxiv preprint first posted online Jan. 8, 2018;

28
differentiation of progenitor cell types in the subcortical telencephalon. Development 129, 5029–5040.
FIGURE LEGENDS
Figure 1. A Radial Glial Cell Lineage in LGE Generates Both Striosomal and Matrix SPNs
(A) Left, schematic representation of LGE progenitor types, including proliferating neuroepithelial cells
(NE), self-renewing and neurogenic radial glial cells (RGS), apical intermediate progenitors (aIPs), and
basal intermediate progenitors (bIPs). aIPs further include short neural precursors (SNP) and sub-apical
progenitors (SAP). These progenitor types are marked by Gsx1/2, Tis21, Ascl1 expression as indicated.
Tis21 marks neurogenic RGs, aIPs and bIPs. IPs co-express Ascl1. VZ: ventricular zone. SVZ:
subventricular zone. MZ: mantle zone.
(B) Scheme of genetic fate mapping using Tis21-CreER;Ai14 mice (box). Upon TM induction, Tis21+
progenitors are marked throughout the telencephalic VZ as they undergo neurogenesis (E10, schematic).
Newborn neurons subsequently migrate to the striatum and self-renewing RGs remain in the VZ (E12-
E14, schematic). Fate-mapped SPNs populate both the striosome (red patches) and matrix (surrounding
red dots) compartments of striatum (P28, schematic).
(C) Eight-hour pulse-chase analysis of Tis21+ progenitors (RFP, arrows in upper panel) in LGE (boxed
region in B) by TM induction at E10.5 with co-immunostaining for Ascl1 (green) and DAPI
counterstain (blue). Bottom panels depict RGs (Ascl1-, arrowhead) with radial processes, aIPs (putative
SNP/SAPs) with soma located away from the lateral ventricle (Ascl1+, yellow arrow), and postmitotic
neurons in the emerging MZ (open arrowhead).
(D) Forty-eight-hour pulse-chase of Tis21+ progenitors (arrows) labeled by TM induction at E10.5 with
co-immunostaining for Ascl1. Bottom panels show that self-renewing RGs (Ascl1−, arrowhead) remain
in VZ at E12.5. aIPs (including a putative Ascl1+ SNP; yellow arrows), and postmitotic neurons
migrating to the MZ (open arrowhead).
(E) Ninety-six-hour pulse-chase analysis of Tis21+ progenitors (arrows) labeled by TM induction at
E10.5, showing isolated columnar clusters of progenitors and newborn neurons in the LGE proliferative
zones at E14. Bottom panels show a RG at the ventricle surface with a long radial fiber and associated
Ascl1+ bIP in the SVZ (blue arrows). Postmitotic neurons reaching the developing striatum are marked
with an open arrowhead.
(F, H and J) Percentage of fate-mapped RGs (Ascl1-) versus aIPs (Ascl1+) at 8, 48 and 96 hours
following E10.5 TM induction. “Other” represents cells that could not be readily discerned as RG or
peer-reviewed) is the author/funder. All rights reserved. No reuse allowed without permission. The copyright holder for this preprint (which was not. http://dx.doi.org/10.1101/244327doi: bioRxiv preprint first posted online Jan. 8, 2018;
(which was not peer-reviewed) is the author/funder. All rights reserved. No reuse allowed without permission. The copyright holder for this preprint. http://dx.doi.org/10.1101/244327doi: bioRxiv preprint first posted online Jan. 8, 2018;

29
aIP. Note that at 96 hours, Ascl1+ cells were exclusively localized to the SVZ and thus were scored as
bIPs.
(G, I and K) Distribution of Ascl1+RFP+ progenitors within the LGE germinal zone at 8, 48 and 96
hours following E10.5 TM induction. Apical progenitors (soma at ventricle surface), SAPs (soma away
from ventricle surface but having apical end-feet), and basal progenitors were scored.
(L) Two examples of E10.5 fate-mapped isolated proliferative clusters shown at E14.5 consisting of a
putative RG with a radial process running through intermingled Ascl1+ bIPs and migrating postmitotic
neurons (N) in the SVZ. Top cluster correlates with the dashed box in (E).
(M and N) RFP-labeled SPNs fate-mapped from E10.5 Tis21+ RGs distribute broadly to both the
striosome (arrow; co-labeling with MOR1 in M) and matrix (co-labeled with CDGI in N) compartments.
(O) Number (left Y axis) and percentage (right Y axis) of fate-mapped SPNs localized to striosomes and
matrix at P28 following TM induction of Tis21-CreER;Ai14 mice at E10.5. Dots represent individual 50
µm sections selected at 6 representative rostral caudal levels of 6 brains. Error bars = standard error of
measurement (SEM).
(P) Scheme of combined fate-mapping and birth dating in Tis21-CreER;Ai14 mice using sequential
nucleotide injections of EdU (E11.5, green), followed by BrdU (E14.5, magenta) after E10.5 TM
induction. Brains were harvested at P28 to identify co-labeling of RFP with either EdU or BrdU.
(Q) Distribution of EdU+ cells in P28 striatum following E11 injection; arrows mark clusters of SPNs in
striosomes. Inset shows fate-mapped neurons (RFP+) co-labeled by E11 EdU injection (green).
(R) Distribution of BrdU+ cells in P28 striatum following E14 injection, showing broad distribution of
labeled cells throughout striatum. Inset shows fate-mapped SPNs (RFP+) co-labeled by E14 BrdU
injection (magenta).
(S, T) Quantification of the numbers of fate-mapped cells per section that incorporated E11 EdU or
E14.5 BrdU within striosomes (S) and matrix (M), respectively. The vast majority of E11 EdU+ fate-
mapped SPNs adopt S cell fate, while the vast majority of E14.5 BrdU+ fate-mapped SPNs adopt M cell
fate (n = 3 brains from 2 litters). Scale bar: 50 µm
(U) Percentage of fate-mapped S versus M cells that co-incorporated E11.5 EdU and E14.5 BrdU,
respectively.
(V) E10.5 fate-mapped (RFP +) and E11 born (EdU-labeled, green) SPNs distribute to striosomes
marked by MOR1 (magenta, dotted line boundary).
(W) E10.5 fate-mapped (RFP+) and E14 born SPNs (BrdU+ pseudocolored green) distribute to matrix
(arrows) outside of striosomes marked by MOR1 (magenta, dotted line boundary).
Scale bars: 100 µm (top), 20 µm (bottom) in C, D, E; 300 µm in M, Q; 50 µm in V.
peer-reviewed) is the author/funder. All rights reserved. No reuse allowed without permission. The copyright holder for this preprint (which was not. http://dx.doi.org/10.1101/244327doi: bioRxiv preprint first posted online Jan. 8, 2018;
(which was not peer-reviewed) is the author/funder. All rights reserved. No reuse allowed without permission. The copyright holder for this preprint. http://dx.doi.org/10.1101/244327doi: bioRxiv preprint first posted online Jan. 8, 2018;

30
Figure 2. Early Ascl1+ aIPs Have Limited Proliferation and Are Fate-Restricted to Produce
Striosomal SPNs
(A) Scheme of short- and long-pulse genetic fate mapping by TM induction in Ascl1-CreER;Ai14 or
Dlx1-CreER;Ai14 mice. Ascl1 (red) and Dlx1 expression (darker red) in LGE are depicted in a
schematic E10.5 coronal section. Striosomes in the striatum (red patches) are depicted in a schematic
P28 coronal brain section.
(B) Scheme of fate mapping aIPs (SNP, SAP) with E10.5 TM induction followed by birth dating with
BrdU pulse at E10.5, E11.5, or E13.5 in Ascl1-CreER;Ai14 mice. The distribution of BrdU+ and RFP+
cells was assayed in P28 striatum. Differential expression of ASCL1 and DLX1 in RG, aIPs and
postmitotic neurons are depicted in the lower panel.
(C) Eight-hour pulse-chase of Ascl1+ progenitors (arrows) labeled by TM induction at E10.5, arrows
indicate aIP with end-feet on the lateral ventricle. Image was taken from the boxed region of the LGE in
(A).
(D) High magnification view of E10.5 aIPs extending end-feet (arrow) to the ventricle surface (dashed
line) with short (putative SAP) or no (putative SNP) vertical radial fibers (arrowheads).
(E and F) 8 hour pulse-chase of Dlx1+ cells (arrows) labeled by E10.5 TM induction in Dlx1-
CreER;Ai14 embryo. No progenitors in VZ were labeled; instead, postmitotic neurons in MZ were
prominently labeled.
(G) Ascl1+ cells are distributed in a salt and pepper pattern throughout the E10 LGE VZ, with pairs of
neighboring progenitors exhibiting high and low levels suggestive of oscillatory expression (inset, white
circles), including pairs bordering the lateral ventricle (arrows) and in the VZ but not in the MZ. Scale
bars: 20 µm (left), 10 µm (right). See also Figure S2.
(H) Eight-hour pulse-chase in Ascl1-CreER;Ai14 embryo at E10.5 selectively captures cells with high-
level ASCL1 in LGE. Many RFP+ progenitors in the VZ are actively neurogenic (yellow arrows), while
postmitotic neurons (RFP+, arrowheads) cease Ascl1 expression and migrate to the MZ.
(I) Eighteen-hour pulse-chase shows that most Ascl1+ aIPs completed their neurogenic cycles in less
than 18 hours, with their postmitotic progenies moving out of the VZ. Only a very small number of
Ascl1+ RFP+ aIPs remain in VZ (arrows).
(J and K) SPNs fate-mapped from E10.5 Ascl1+ aIPs are destined for striosomes (arrow) in the P28
striatum (dendritic spines in inset). These SPNs are co-labeled by the striosome marker MOR1 (green in
J) but not the matrix marker CDGI (green in K).
peer-reviewed) is the author/funder. All rights reserved. No reuse allowed without permission. The copyright holder for this preprint (which was not. http://dx.doi.org/10.1101/244327doi: bioRxiv preprint first posted online Jan. 8, 2018;
(which was not peer-reviewed) is the author/funder. All rights reserved. No reuse allowed without permission. The copyright holder for this preprint. http://dx.doi.org/10.1101/244327doi: bioRxiv preprint first posted online Jan. 8, 2018;

31
(M and N) SPNs fate-mapped from E10.5 Ascl1+ aIPs birth-dated by BrdU injection (green) on E10.5
(M) or E11.5 (N). In each panel, images show BrdU/RFP co-labeling of striosome SPNs at low
magnification (arrows, top), BrdU only (middle), and high magnification of co-labeled S cells (bottom
left) versus RFP+/BrdU− M cells (bottom right).
(O) SPNs fate-mapped and birth dated from E13.5 Ascl1+ progenitors. Images show BrdU/RFP co-
labeling in striatum (top), BrdU only (middle), and high magnification of co-labeled RFP+/BrdU+ M
cells and S cells.
(P) Percentage of fate-mapped SPNs localized in striosomes following TM induction at indicated
embryonic days. Dots represent individual mice, and their numbers are in parentheses. Error bars, SEM.
(Q) Average cell density within the striosome versus the matrix compartment (# of cells/percent
compartment area) following E11.5 TM induction. ***p < 0.0001.
(R) Quantification of BrdU birth dating in fate-mapped striosome and matrix population, showing the
rate of BrdU incorporation at E10.5, E11.5 or E13.5 in S cells (red bars, labeled by E10.5 TM), relative
to incorporation of BrdU in M cells at E10.5 or E13.5 (blue bars). Error bars, SEM; **p < 0.001; ***p <
0.0001. Note the absence of S cell production by E13.5.
Scale bars: 50 µm in C, E; 20 µm (left), 10 µm (right) in G, I; 300 µm in J, top of M; 100 µm in bottom
of M, K.
Figure 3. LGE RGs during the Late Phase of Lineage Progression Give Rise to Ascl1+/Dlx1+ bIPs
Committed to the Generation of Matrix SPNs
(A-C) Pulse-chase of E14.5 Tis21+ LGE RGs and IPs at 8 (A), 24 (B), and 72 (C) hours in Tis21-
CreER;Ai14 embryos. While post-mitotic SPNs migrate into the striatum, self-renewing RGs
(arrowheads) remain in the VZ for at least 72 hours following E14.5 TM induction (bottom panels).
(D) Example of a continually self-renewing RG in the VZ (arrowhead) 72 hours following fate-mapping
from E14.5 Tis21+ RGs. Note the Ascl1+ bIP likely derived from the RG (yellow arrow) and the
postmitotic progeny neuron migrating to striatum (open arrowhead).
(E) Eight-hour TM pulse-chase of Tis21+ RGs at E14.5. These RGs were Sox2+, Ascl1−, and extended
end-feet to ventricle surface and radial processes (arrowheads).
(F and G) In the same sample as in (E), a large number of bIPs in the SVZ are Ascl1+ (F; yellow arrow),
many of them in active phases of mitosis (G; dashed lines show plane of cytokinesis), generating
putative post-mitotic progenies (arrows).
peer-reviewed) is the author/funder. All rights reserved. No reuse allowed without permission. The copyright holder for this preprint (which was not. http://dx.doi.org/10.1101/244327doi: bioRxiv preprint first posted online Jan. 8, 2018;
(which was not peer-reviewed) is the author/funder. All rights reserved. No reuse allowed without permission. The copyright holder for this preprint. http://dx.doi.org/10.1101/244327doi: bioRxiv preprint first posted online Jan. 8, 2018;

32
(H) Distribution of Ascl1+ IPs in VZ and SVZ following 8-hour pulse-chase in Tis21-CreER;Ai14
embryo, showing that the vast majority of Tis21+, Ascl1+ Tis21+ and Ascl1+ progenitors reside in SVZ at
E14, in contrast to the distribution pattern of the same pulse-chase at E10.5 (compare with Figure 1C).
(I) Pie chart depicting the percentage of Sox2+ RGs, Ascl1+ IPs, and Ascl1- SVZ cells among the total
population of fate-mapped Tis21+ progenitors at E14.
(J) A summary schematic showing that during the late phase of LGE neurogenesis RGs mostly generate
bIPs, which may proliferate further and amplify before completing the neurogenic divisions that
generate SPNs. Tis21 expression is generally activated in progenitors entering such a neurogenic phase,
whether in RG or bIP.
(K-M) Pulse-chase of E14.5 Ascl1+ IPs at 8 (K), 24 (L), and 72 (M) hours in Ascl1-CreER;Ai14
embryos. Fate-mapped IPs were completely depleted from VZ by 24 hours after TM induction, and have
differentiated into young neurons by 72 hours. Lower panels show magnified view of the boxed areas
with VZ and SVZ labeled.
(N-P) Eight-hour pulse-chase of Dlx1+ IPs at E13 (N), E15 (O) and E17 (P). Lower panels show that
Dlx1+ IPs did not extend apical or basal processes at any of these stages and thus were exclusively bIPs.
Dlx1 is also expressed in postmitotic neurons during this period.
(Q) SPNs fate-mapped from E14.5 Ascl1+ IPs localized to matrix (double arrows), but not striosomes
(arrows) in P28 striatum.
(R-T) SPNs fate-mapped from E17.5 Dlx1+ IPs localized to matrix (double arrows) but not striosomes
(arrows) in P28 striatum (R). These SPNs surround MOR1+ striosomes (S) and were co-labeled by the
matrix marker CDGI (T), with arrowheads indicating a void in the immediate region surrounding
striosomes.
(U) Percentage of fate-mapped SPNs that localize to matrix following TM induction to map the output
from Dlx1+ IPs at indicated embryonic times.
(V) Average cell density within the striosome versus the matrix compartment (# of cells/percent
compartment area) following E17.5 TM induction in Dlx1+ IPs. ***p< 0.0001.
Scale bars: 300 µm in top of A, B, C, K, L, M, N, O, P; 20 µm in bottom of A, B, C, E, F K, L, M, N, O,
P; 5 µm in G; 300 µm in Q, R; 100 µm in S, T.
Figure 4. Confirmation of Early Ascl1 Fate-Mapped Striosomal SPNs and Late Dlx1 Fate-Mapped
Matrix SPNs by Projection Pattern
(A) Sagittal section showing axon projections from fate-mapped striosomes to substantia nigra following
E10.5 TM induction in Ascl1-CreER;Ai14 mice, terminating densely in the dopaminergic SNc.
peer-reviewed) is the author/funder. All rights reserved. No reuse allowed without permission. The copyright holder for this preprint (which was not. http://dx.doi.org/10.1101/244327doi: bioRxiv preprint first posted online Jan. 8, 2018;
(which was not peer-reviewed) is the author/funder. All rights reserved. No reuse allowed without permission. The copyright holder for this preprint. http://dx.doi.org/10.1101/244327doi: bioRxiv preprint first posted online Jan. 8, 2018;

33
(B) Sagittal section showing axon projections from fate-mapped matrisomes to substantia nigra
following E17.5 TM induction in Dlx1-CreER;Ai14 mice, primarily terminating in SNr.
(C) Coronal section showing axon terminations in substantia nigra from fate-mapped striosomes (E10.5
TM induction in Ascl1-CreER;Ai14 mice), co-labeled with anti-tyrosine hydroxylase (TH, green) to
label dopamine containing neurons in SNc, Middle panels show distribution of striosomal fibers
terminating in SNc and SNr (red: tdTomato, green: anti-TH, blue: Nissl), and right panel shows high
magnification micrograph of border between SNc and SNr.
(D) Coronal section showing axon terminations in substantia nigra from fate-mapped matrix (E17.5 TM
induction in Dlx1-CreER;Ai14 mice), co-labeled with anti- TH (green) to label dopaminergic neurons in
the SNc. Middle panels show projections terminate broadly throughout SNr and avoid SNc (red:
tdTomato, green: anti-TH, blue: Nissl), and right panel shows high magnification micrograph of border
between SNc and SNr.
Scale bars: 500 µm in A, C (left); 100 µm C (middle), 10 µm C (right).
Figure 5. Comprehensive Time-Course of IP-Mediated Neurogenesis Reveals a Rapid Transition
from Striosome to Matrix SPN Production
(A) Representative striatum panels of TM induction time points in Ascl1-CreER;Ai14 mice, including
examples of anti-MOR1 co-labeling at peak striosome (E10.5) versus peak matrix (E14.5) cell birth
times from Ascl1+ progenitors.
(B) Representative striatum panels of TM induction time points in Dlx1-CreER;Ai14 mice, including
examples of anti-CDGI co-labeling at peak striosome (E10.5) versus matrix (E17.5) cell birth times
from Dlx1+ precursors.
(C) Normalized histogram of striosomal SPN production from Ascl1+ (red) and Dlx1+ (blue) progenitors
from E9.5 to E18.5.
(D) Normalized histogram of matrix SPN production from Ascl1+ (red) and Dlx1+ (blue) progenitors
from E9.5 to E18.5.
(E) Total relative production of striosomes and matrix from Dlx1+ and Ascl1+ progenitors pooled from
E9.5 to E18.5.
(F) Absolute numbers (cells/section) of striosomal or matrix SPNs produced from Dlx1 and Ascl1
progenitors (pooled) from E9.5 to E18.5. (n=6-15 sections in 3 mice from 2 litters).
Scale bars: 300 µm.
peer-reviewed) is the author/funder. All rights reserved. No reuse allowed without permission. The copyright holder for this preprint (which was not. http://dx.doi.org/10.1101/244327doi: bioRxiv preprint first posted online Jan. 8, 2018;
(which was not peer-reviewed) is the author/funder. All rights reserved. No reuse allowed without permission. The copyright holder for this preprint. http://dx.doi.org/10.1101/244327doi: bioRxiv preprint first posted online Jan. 8, 2018;

34
Figure 6. The Annular Sub-Compartment Is Generated through Intermediate Progenitors at the
End of the RGM Lineage
(A) Sagittal section of P28 Dlx1-CreER;Ai14 mouse brain following E18.5 TM induction, showing fate-
mapped peri-striosomal M cells (arrows) bordering striosomes devoid of CDGI expression (green).
(B-D) Rings of peri-striosomal M cells express the matrix markers CDGI (B, rectangle in A) and
calbindin D28K (CB28K, D), and adhere tightly to the borders of MOR1+ striosomes (C). S: striosomes.
(E) Both the neurites and somata of fate-mapped peri-striosomal M cells form dense lattice-like
structures (arrowheads) at the interface between striosomes (S) and matrix (M).
(F) Fate-mapped SPNs throughout striatum following E18.5 TM induction in Dlx1-CreER;Ai14 mice.
peri-striosomal M cells represent 60-80% of labeled neurons, especially enriched in rostral areas, in
addition to a dense band of matrix bordering the lateral ventricle in the medial striatum and sparsely
distributed matrix cells throughout the lateral striatum. Error bars, SEM; ***p < 0.0001.
(G) Distribution of fate-mapped matrix neurons following E15.5, E16.5 and E18.5 TM induction in
Dlx1-CreER;Ai14 mice, during the onset, peak or closing phase of matrix production, respectively. Cells
were grouped into ten 20-µm concentric bins moving radially out from the nearest perpendicular point
of a traced MOR1+ striosome (red shades closer to and blue shades farther from striosome surface), and
the distribution was plotted as a bar graph. n = 4 striosomes from 2 mice per time point.
(H) The proportion of total fate-mapped cells in each 20-µm radial bin following E15.5 (purple), E17.5
(blue) or E18.5 (red) TM inductions was plotted for all regions of interest, showing a significant
enrichment in cells closer than 40 µm to the striosome border in the E18.5 cohort and a significant
enrichment in cells between 120 and 180 µm from striosome borders for both the E15.5 and E17.5
cohorts. n = 4 striosomes from 2 mice per time point. *p < 0.05.
(I) Distribution of cells based on distance from striosome borders following E15.5 (purple), E17.5 (blue)
or E18.5 (red) TM inductions. Dots represent individual cells, and mean and SEM are indicated in black
for each group.
Scale bars: 300 µm in A, C (top panel); 100 µm in B, C (bottom panel), and E.
Figure 7. Production and Integration of Direct and Indirect Pathway SPNs within the Striosome-
Matrix System
(A) Fluorescent in situ hybridization (FISH) signal from a branched-chain DNA (bDNA) probe targeting
the mRNA of tdTomato expressed in P28 SPNs following E10.5 TM in Ascl1-CreER;Ai14 mice
matches the signature expression pattern (arrows) of striosome cells along the lateral border of striatum
Red: tdTomato mRNA, Blue: Nissl. Scale bars: 300 µm in left panel, 100 µm in right panel.
peer-reviewed) is the author/funder. All rights reserved. No reuse allowed without permission. The copyright holder for this preprint (which was not. http://dx.doi.org/10.1101/244327doi: bioRxiv preprint first posted online Jan. 8, 2018;
(which was not peer-reviewed) is the author/funder. All rights reserved. No reuse allowed without permission. The copyright holder for this preprint. http://dx.doi.org/10.1101/244327doi: bioRxiv preprint first posted online Jan. 8, 2018;

35
(B) FISH signal for a bDNA probe targeting the mRNA of tdTomato expressed in P28 SPNs following
E17.5 TM in Dlx1-CreER;Ai14 mice matches the signature matrix pattern (arrows) in medial striatum.
(C) FISH signal for a bDNA probe targeting the mRNA of the dopamine D1 receptor (D1R) is
distributed throughout about 50% of Nissl positive cells in striatum (Green: D1R mRNA, Blue: Nissl,
inset: Arrows: positive cell, arrowhead: negative cell). Scale bars: 300 µm,10 µm in inset.
(D) FISH signal for a bDNA probe targeting the mRNA of the dopamine D2 receptor (D2R) is
distributed throughout about 50% of Nissl positive cells in striatum (Green: D2R mRNA, Blue: Nissl,
inset: Arrows: positive cell, arrowhead: negative cell)
(E) Representative panels of double in situ hybridization marking either D1 or D2 expressing cells in
striosomes born at E10.5 (top group) or E12.5 (bottom group). Arrows: co-labeled cells, arrowheads:
tdTomato-only cells. Scale bar: 10 µm. (F) Representative panels of double in situ hybridization marking either D1 or D2 expressing cells in
matrix born at E15.5 (top group) or E17.5 (bottom group). Arrows: co-labeled cells, arrowheads:
tdTomato-only cells.
(G and H) Differential expression of the D1R or D2R in fate-mapped striosomal (G) and matrix (H)
SPNs. Arrows: co-labeled cells, arrowheads: tdTomato-only cells.. Scale bar: 10 µm.
(I) Proportions of dSPNs and iSPNs within fate-mapped striosome cohorts following E10.5 or E12.5 TM
induction and within fate-mapped matrix cohorts following E15.5 or E17.5 TM induction. Error bar:
SEM; *p < 0.05, **p < 0.001.
(J) Number of dSPNs and iSPNs within fate-mapped striosome cohorts and matrix cohorts (dots
represent individual sections, bars project mean values, error bar: SEM). Grey brackets display the range
of the number of total RFP+ cells per section detected by in situ probe in samples pooled from both high
and low TM dose litters.
Figure 8. A Model on the Progenitor and Lineage Basis of SPNs that Constitute the Striosome and
Matrix Compartments, and Direct and Indirect Pathways
(A) A schematic of the organization of striatal compartments and pathways that mediate different
behaviors (GPe: globus pallidus externus, GPi: globus pallidus internus, GPh: globus pallidus habenula,
Sd: striosome direct pathway, Si: striosome indirect pathway, Md: matrix direct pathway, Mi: marix
indirect pathway).
(B) At the onset of LGE neurogenesis marked by Tis21 expression in radial glial progenitors (RG)
~E10, RGs initiate a lineage program that sequentially generates all striatal projection neurons (SPNs).
During an early phase (E10-E12), RGs generate a set of Ascl1+ aIPSs (including SNP and SAPs), which
peer-reviewed) is the author/funder. All rights reserved. No reuse allowed without permission. The copyright holder for this preprint (which was not. http://dx.doi.org/10.1101/244327doi: bioRxiv preprint first posted online Jan. 8, 2018;
(which was not peer-reviewed) is the author/funder. All rights reserved. No reuse allowed without permission. The copyright holder for this preprint. http://dx.doi.org/10.1101/244327doi: bioRxiv preprint first posted online Jan. 8, 2018;
36
are fate-restricted to generate striosomal SPNs. It is possible that RGs also generate SPNs via direct
neurogenesis (dashed line). Both direct (Sd, light red) and indirect (Si, dark red) pathway SPNs are
generated from aIPSs, though we cannot distinguish whether a single aIPS generates either or both Sd and
Si. S cells populate the striatum in a lateral to medial spatial sequence by birth time (top panel).
Following a rapid transition period around E13, RGs generate a set of Ascl1+ and Dlx1+ bIPMs, which
are fate-restricted to generate matrix SPNs. Throughout this late phase (E15-E17), M cells are produced
from mostly Dlx1+ bIPs, while Ascl1+ bIPs taper M cell production and switch to gliogenesis. Again,
both direct (Md, light blue light = D1R+) and indirect (Mi, dark blue = D2R+) pathway SPNs are
generated from bIPMs; and we cannot distinguish whether a single bIPM generates either or both Md and
Mi. M cells populate the striatum in a caudal to rostral and lateral to medial sequence by birth time (top
panel). During the final phase, Dlx1+ bIPs produce projection neurons of the peri-striosomal annular
compartment (A cells). Thus, M cell generation further manifests a distal to proximal sequence in
relation to the striosome. Thus along the RG lineage progression, different progenitor types and cell
birth time specify distinct types of striosome and matrix SPNs (S, M and A cells) and shape the
spatiotemporal construction of striatal compartments and likely their input-output connectivity.
peer-reviewed) is the author/funder. All rights reserved. No reuse allowed without permission. The copyright holder for this preprint (which was not. http://dx.doi.org/10.1101/244327doi: bioRxiv preprint first posted online Jan. 8, 2018;
(which was not peer-reviewed) is the author/funder. All rights reserved. No reuse allowed without permission. The copyright holder for this preprint. http://dx.doi.org/10.1101/244327doi: bioRxiv preprint first posted online Jan. 8, 2018;

E0.5 E10 P28
TM FIXPlug
CreERTis21 Rosa26STOP RFP
FIX+ 8, 48, 96 hrs
OR
P28E10
Tis21
LGE
MGE
E12 - E14
E10 TM + 48 hr E10 TM + 96 hr
LGE
MGE
LGE
LV
VZ
E10 TM + 8 hr
LGE
MGE
Apical Subapical0
10
20
30
40
0
10
20
30
40
Apical Basal0
10
20
30
40
RG aIPOther0
20
40
60
80
100
% o
f fat
e-m
appe
d ce
lls
RG aIPOther0
20
40
60
80
% o
f fat
e-m
appe
d ce
lls
RG bIP Other0
20
40
60
80
100%
of f
ate-
map
ped
cellsTM + 8 hr TM + 48 hr TM + 96 hrTM + 8 hr TM + 48 hr TM + 96 hr
Str Str
LV
VZ
E11.5 EdUTis21-CreER
MOR1
C D
F G H I J
L
V W
Ascl1Tis21-CreER
DAPI
% M
ash1
+ R
FP+
% M
ash1
+RFP
+
% M
ash1
+ R
FP+
E14.5 BrdUTis21-CreER
MOR1
E11.5 EdU E14.5 BrdUQ R
E11 EdU
E14 BrdU
0
1
2
3
4
5
Cel
ls/s
ectio
n
Striosome
0
5
10
15
20
Cel
ls/s
ectio
n Matrix
S M S M 0
5
10
15
20
25
Perc
enta
ge (%
)
E11 EdU
E14 BrdU
Tis21-CreERMOR1 CDGI
Tis21-CreER
DAPIS cells M cells Striosome Matrix
020
80
140
200
260
020
40
60
80
100
Cel
ls/s
ectio
n P
ercentag
e (%)
n = 6 brainsOM
P
S T U
B
E
K
N
RGS
MZ
VZ
SVZ
NE SNPSAP
bIP
Gsx1/2Tis21 Ascl1
aIP
A
RG
bIP
N
RG
bIP
N
E0.5 E10.5 E14.5E11.5TM:
EdU BrdU: OROR
Tis21
S S M
Fix
P28
bIP
bIP
bIP
bIP
N
Apical Subapical
+ + + + ++ + + +
+ + +
RG
---
peer-reviewed) is the author/funder. All rights reserved. No reuse allowed without permission. The copyright holder for this preprint (which was not. http://dx.doi.org/10.1101/244327doi: bioRxiv preprint first posted online Jan. 8, 2018;
Figure 1(which was not peer-reviewed) is the author/funder. All rights reserved. No reuse allowed without permission.
The copyright holder for this preprint. http://dx.doi.org/10.1101/244327doi: bioRxiv preprint first posted online Jan. 8, 2018;
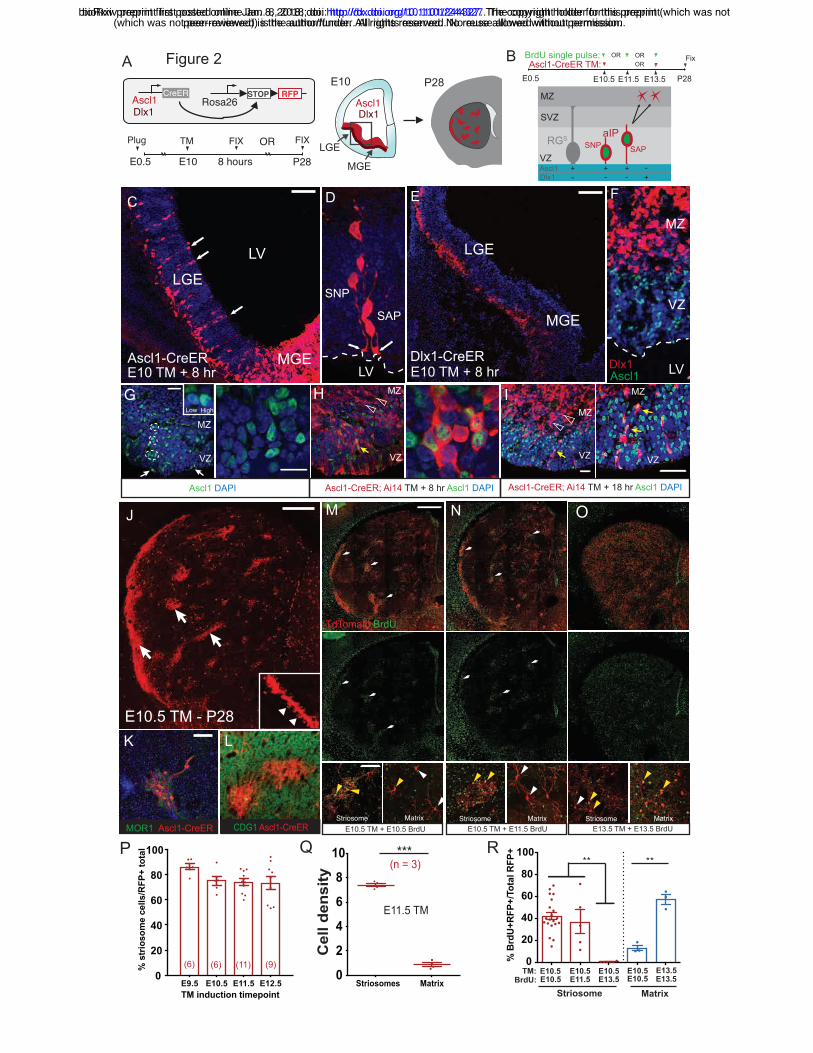
E10 P28
E0.5 E10 P28
TM FIX
Ascl1
Plug
CreERAscl1 Rosa26STOP RFP
FIX
8 hours
OR LGE
MGE
A
VZ
MZ
HighLow
VZ
MZ
Ascl1 DAPI
VZ
MZ
E10.5 TM - P28
LGE
MGEE10 TM + 8 hrAscl1-CreER
MOR1 Ascl1-CreER CDG1 Ascl1-CreER
C
LV
LV
TdTomato BrdU
E10.5 TM + E10.5 BrdU
N
E10.5 TM + E11.5 BrdU E13.5 TM + E13.5 BrdUStriosome Matrix Striosome Matrix Striosome Matrix
M
G H I
J
K L
O
D
RGS
MZ
VZ
SVZ
SNP SAP
aIP
E0.5 E10.5 E13.5E11.5
Ascl1-CreER TM: BrdU single pulse: OR OR
ORFix
P28
Ascl1-CreER; Ai14 TM + 8 hr Ascl1 DAPI Ascl1-CreER; Ai14 TM + 18 hr Ascl1 DAPI
LGE
MGE
E
Dlx1-CreERE10 TM + 8 hr
B
Striosome Matrix
0
20
40
60
80
100
% B
rdU
+RF
P+/
Tota
l RF
P+
TM:BrdU:
E10.5 E10.5 E10.5 E13.5E10.5 E11.5 E10.5 E13.5
E10.5E13.5
** **
Striosomes Matrix0
2
4
6
8
10
Cell d
en
sit
y (n = 3)
***
E11.5 TM
P Q R
Dlx1Dlx1
LV
VZ
MZ
F
Dlx1Ascl1
Ascl1 + + +- +Dlx1 -
-
SNP
SAP
MZ
VZ
E9.5 E10.5 E11.5 E12.50
20
40
60
80
100
TM induction timepoint
% s
trio
som
e ce
lls/R
FP
+ to
tal
(6) (6) (11) (9)
-
Figure 2
peer-reviewed) is the author/funder. All rights reserved. No reuse allowed without permission. The copyright holder for this preprint (which was not. http://dx.doi.org/10.1101/244327doi: bioRxiv preprint first posted online Jan. 8, 2018;
(which was not peer-reviewed) is the author/funder. All rights reserved. No reuse allowed without permission. The copyright holder for this preprint. http://dx.doi.org/10.1101/244327doi: bioRxiv preprint first posted online Jan. 8, 2018;

E17.5 TM - P28
MOR1 Dlx1-CreER
CDG1 Dlx1-CreER
Distribution of E14 Tis21+ cells in LGE
5.08% Sox2+ RGs
70.31% Ascl1+ IPs
24.61% Ascl1- SVZ cells
VZ SVZ VZ SVZ VZ SVZ0
20406080
100120140160180200220
Cel
ls/s
ectio
n
Tis21+ Ascl1+ progenitors
Total Ascl1+ progenitors Total Tis21+ progenitors
*** **
***Tis21-CreER E14 TM + 8 hr Ascl1 DAPI
VZ
SVZ
F
VZ
SVZ
G
H I
D
U
V
Dlx1-CreER
VZ
SVZ
VZ
SVZ VZ
SVZ
E14 TM + 72 hrsE14 TM + 24 hrsE14 TM + 8 hrs
E14 TM + 8 hrs
A B C
K L M
E
E13 TM + 8 hrs E15 TM + 8 hrs
VZ
SVZ
VZ
SVZ SVZ
VZ
E17 TM + 8 hrs
VZ
SVZVZ
SVZ
E14 TM + 24 hrs E14 TM + 72 hrs
E14.5 TM - P28Ascl1-CreER
N O P
Q R S
T
MZ
VZ
RGM
bIP1 bIP2SVZ
Tis21-CreER;Ai14
Tis21-CreER E14 TM + 8 hr Sox2 DAPI
Ascl1Tis21-CreER
Ascl1-CreER;Ai14 Dlx1-CreER;Ai14
VZ
SVZ
E15.5 E16.5 E17.5 E18.50
25
50
75
100
TM induction timepoint
% M
atrix
cel
ls/R
FP+
tota
l
(6) (4) (3) (6)
Striosome Matrix0
2
4
6
8
10
Cel
l den
sity
(n = 3)***
E17.5 TM
Tis21 Ascl1
-+ + ++ + +
+
Dlx1 +--
-- +
+-- +
RGM
J
peer-reviewed) is the author/funder. All rights reserved. No reuse allowed without permission. The copyright holder for this preprint (which was not. http://dx.doi.org/10.1101/244327doi: bioRxiv preprint first posted online Jan. 8, 2018;
Figure 3
(which was not peer-reviewed) is the author/funder. All rights reserved. No reuse allowed without permission. The copyright holder for this preprint. http://dx.doi.org/10.1101/244327doi: bioRxiv preprint first posted online Jan. 8, 2018;

SNr
SNc
SNrSNc
SNrSNc
A B
C
D
Ascl1-CreER;Ai14 E10.5 TM Dlx1-CreER;Ai14 E17.5 TM
Ascl1-CreER;Ai14 E10.5 TM tdTomato Tyrosine Hydroxylase Nissl
Dlx1-CreER;Ai14 E17.5 TM tdTomato Tyrosine Hydroxylase Nissl
SNr
SNc
Figure 4
peer-reviewed) is the author/funder. All rights reserved. No reuse allowed without permission. The copyright holder for this preprint (which was not. http://dx.doi.org/10.1101/244327doi: bioRxiv preprint first posted online Jan. 8, 2018;
(which was not peer-reviewed) is the author/funder. All rights reserved. No reuse allowed without permission. The copyright holder for this preprint. http://dx.doi.org/10.1101/244327doi: bioRxiv preprint first posted online Jan. 8, 2018;

E10 E11 E12
E13 E15
E18
E16
E10 E11 E12
E13 E15
E18
E16
A B
MOR1 TdTomatoREPLACE
Ascl1 Dlx1
E10 E14 E10 E17
E9.5 E10.5 E11.5 E12.5 E13.5 E14.5 E15.5 E16.5 E17.5 E18.50
500
1000
1500
2000
2500
Cells
/sec
tion Striosomes
Matrix
E9.5 E10.5 E11.5 E12.5 E13.5 E14.5 E15.5 E16.5 E17.5 E18.50
25
50
75
100
MatrixStriosomes
E9.5 E10.5 E11.5 E12.5 E13.5 E14.5 E15.5 E16.5 E17.5 E18.50
25
50
75
100
% s
trios
ome
cells
/RFP
tota
l
Ascl1-CreERDlx1 -CreER
E9.5 E10.5 E11.5 E12.5 E13.5 E14.5 E15.5 E16.5 E17.5 E18.50
25
50
75
100
% M
atrix
cel
ls/R
FP to
tal
Ascl1-CreERDlx1 -CreER
C D
Etransition period
F
*** *** ***
CDG1 TdTomato
% o
f tot
al fa
te-m
appe
d ce
lls
peer-reviewed) is the author/funder. All rights reserved. No reuse allowed without permission. The copyright holder for this preprint (which was not. http://dx.doi.org/10.1101/244327doi: bioRxiv preprint first posted online Jan. 8, 2018;
Figure 5
(which was not peer-reviewed) is the author/funder. All rights reserved. No reuse allowed without permission. The copyright holder for this preprint. http://dx.doi.org/10.1101/244327doi: bioRxiv preprint first posted online Jan. 8, 2018;

anti-CDGI
S
S
anti-MOR1
Coronal
SS S
S
S
anti-CB28K
Coronal
A B C
0 1 2 3 4 5 6 7 8 9 100
5
10
15
Distance from striosome border (um)
Num
ber o
f cel
ls
0 1 2 3 4 5 6 7 8 9 100
10
20
30
40
Num
ber o
f cel
ls
0 1 2 3 4 5 6 7 8 9 1002468
10
Num
ber o
f cel
ls
E15.5
E17.5
E18.5
0 50 100 150 200 250
E18.5
E17.5
E15.5
Microns from striosome border
0 1 2 3 4 5 6 7 8 9 100
10
20
30
40
50
Radial bins
Perc
enta
ge (%
) E15.5E17.5E18.5
G H *
** * * *
Sagittal
A
Dlx1-CreER TM E18
0 20 40 60 80 100
Annular
Matrix
Annular
Lateral matrix
Medial matrix
Percent of fate mapped cells (%)
Who
le s
tria
tum
Ros
tal s
tria
tum
F
***
***
D
E
I
CDGI
S
M
S S
M S
S
M
Distance from striosome border (um)
Distance from striosome border (um)
peer-reviewed) is the author/funder. All rights reserved. No reuse allowed without permission. The copyright holder for this preprint (which was not. http://dx.doi.org/10.1101/244327doi: bioRxiv preprint first posted online Jan. 8, 2018;
Figure 6
(which was not peer-reviewed) is the author/funder. All rights reserved. No reuse allowed without permission. The copyright holder for this preprint. http://dx.doi.org/10.1101/244327doi: bioRxiv preprint first posted online Jan. 8, 2018;

C
D1R
D
D2R
M cell (tdTomato)
B
M cell D1R
M cell D2RS cell D2R
S cell D1R
Cx
Str
LV
Str
G H
E F
E10.5 S cell D1R E10.5 S cell D2R E15.5 M cell D1R E15.5 M cell D2R
E12.5 S cell D1R E12.5 S cell D2R E17.5 M cell D1R E17.5 M cell D2R
S cell (tdTomato)
A
Str
Cx
Str
Cx
Str
Cx
Str
Cx
E10.5 E12.5 E15.5 E17.50
20
40
60
80
100
% d
SPN
s or
iSPN
s dSPNsiSPNs
**
I
***
E10.5 E12.5 E15.5 E17.50
100
200
300
400
500
Cel
ls/s
ectio
n
J
peer-reviewed) is the author/funder. All rights reserved. No reuse allowed without permission. The copyright holder for this preprint (which was not. http://dx.doi.org/10.1101/244327doi: bioRxiv preprint first posted online Jan. 8, 2018;
Figure 7
(which was not peer-reviewed) is the author/funder. All rights reserved. No reuse allowed without permission. The copyright holder for this preprint. http://dx.doi.org/10.1101/244327doi: bioRxiv preprint first posted online Jan. 8, 2018;

LGE
striatum
R
D
V
LM
C
Cerebral cortex
Striatum
GPe
GPh
GPi/SNrSNc
outcomeevaluation
GABA
S M
SiSd MdMi
DA
action selection
A
RG
MZ
VZ
SVZ
NE
LV
E10 - E12 E13 - E14
aIPS
bIPM
Ascl1+
Md
bIPA
MA
Dlx1+
MAMiSd
E18E15 - E17
Ascl1+
Tis21+
Dlx1+
Dlx1+ Dlx1+
Dlx1+ Dlx1+Dlx1+
Tis21+ Tis21+ Tis21+
Ascl1+
Ascl1+/-
RG
bIPM
RG RG
Si Md Mi
aIPS aIPS aIPS
B
peer-reviewed) is the author/funder. All rights reserved. No reuse allowed without permission. The copyright holder for this preprint (which was not. http://dx.doi.org/10.1101/244327doi: bioRxiv preprint first posted online Jan. 8, 2018;
Figure 8
(which was not peer-reviewed) is the author/funder. All rights reserved. No reuse allowed without permission. The copyright holder for this preprint. http://dx.doi.org/10.1101/244327doi: bioRxiv preprint first posted online Jan. 8, 2018;

1
SUPPLEMENTAL EXPERIMENTAL PROCEDURES
Mice
All mouse colonies at Cold Spring Harbor Laboratory (CSHL) were maintained in accordance with
protocols approved by the IACUC at CSHL. The following mouse strains were used for fate-mapping
experiments: Ascl1-CreER (Kim et al., 2011), Dlx1-CreER (Taniguchi et al., 2011), Nkx2.1-ires-FLP-O
(He et al., 2016), Ai14 (Madisen et al., 2010), Ai65 (Madisen et al., 2015), and Tis21-2A-CreER
(unpublished). A gene targeting vector for Tis21-2A-CreER was generated using a PCR-based cloning
approach as described before (Taniguchi et al., 2011) to insert a 2A-CreER construct immediately after
the STOP codon of the Tis21 gene. The targeting vector was linearized and transfected into a
129SVj/B6 F1 hybrid ES cell line (V6.5, Open Biosystems). G418-resistant ES clones were first
screened by PCR and then confirmed by Southern blotting using probes against the 5’ and 3’ homology
arms of the targeted site. The loxP-Neo-loxP cassette in the founder line was removed by breeding with
CMV-cre transgenic mice (JAX 006054).
Once generated at CSHL, Ascl1-CreER and Dlx1-CreER mice were sent to the Massachusetts Institute
of Technology (MIT), rederived and maintained under a standard light/dark cycle with free access to
food and water in MIT housing facilities. All experimental procedures were approved by the Committee
on Animal Care at MIT and were carried out in accordance with the U.S. National Research Council
Guide for the Care and Use of Laboratory Animals.
Inducible Genetic Fate Mapping
Genetic fate-mapping experiments were carried out in parallel at CSHL and MIT. Inducible fate-
mapping experiments were conducted by crossing either Dlx1-CreER or Ascl1-CreER mice to the Cre-
dependent Ai14 reporter. Intersectional inducible fate-mapping experiments were conducted by crossing
Nkx2.1-ires-FLP-O;Ai65 double transgenic mice to a CreER driver line (backcrossed 6 generations to
Swiss-Webster background). Upon observing a vaginal plug, with the noon of that day counted as E0.5,
tamoxifen was administered by gavage to the pregnant female at a desired embryonic time point
(Taniguchi et al., 2011). Adult progeny mice with appropriate genotypes were anesthetized with 2.5%
avertin before transcardial perfusion with 4% paraformaldehyde (PFA) onP28. Brains were post-fixed in
4% PFA for 12 hours. In 8-hour pulse-chase experiments, E10–E13 embryos were lightly fixed by
immersion in 4% PFA starting 8 hours after TM induction and frozen for cryosectioning after overnight
cryoprotection in 30% sucrose. Later stage embryos (E14–E18) were perfused with 4% PFA using a 30-
peer-reviewed) is the author/funder. All rights reserved. No reuse allowed without permission. The copyright holder for this preprint (which was not. http://dx.doi.org/10.1101/244327doi: bioRxiv preprint first posted online Jan. 8, 2018;
(which was not peer-reviewed) is the author/funder. All rights reserved. No reuse allowed without permission. The copyright holder for this preprint. http://dx.doi.org/10.1101/244327doi: bioRxiv preprint first posted online Jan. 8, 2018;

2
gauge needle and syringe before being post-fixing brains for 6 hours and embedding in 1.8% agarose for
vibratome sectioning (Taniguchi et al., 2011).
Tamoxifen Induction and BrdU Birth-Dating
To reduce toxicity to pregnant females and enable sparse cellular labeling, pregnant female mice were
gavaged with low to medium dose tamoxifen (dissolved in corn oil by gentle agitation for 24 hours),
using an 18-gauge 50-mm gavage tool. Doses were in the range of 0.15 mg/30 g BW up to 5 mg/30 g
BW (5 mg/Kg BW–165 mg/Kg BW), with most experiments at CSHL performed using doses below 1.5
mg/30 g BW and all experiments at MIT performed using doses of 3 mg/30 g BW. For BrdU birth-
dating, pulses of BrdU were intraperitoneally injected into pregnant mice at a dose of 5 mg/100 g BW,
spaced 4 hours or 24 hours after TM induction on E10, similar to previously described (Taniguchi et al.,
2011).
Immunohistochemistry and Microscopy
Fixed adult brains were serially sectioned at 55 µm using a vibratome and collected into well plates.
Sections were blocked in 10% normal goat serum and 0.1% triton-X100 in 1XPBS, then incubated in
primary antibodies (diluted in blocking solution) at 4°C overnight: anti-RFP (rabbit polyclonal antibody,
Rockland Pharmaceuticals), anti-MOR1 (rabbit polyclonal, immunostar), anti-Calbindin 28K (rabbit
polyclonal, Millipore), anti-CDG1 (rabbit polyclonal, Crittenden et al., 2009), anti-Tyrosine
Hydroxylase (rabbit polyclonal, Millipore), anti-Ascl1/Mash1 (mouse monoclonal, BD biosciences),
anti-BrdU (rat monoclonal Accurate Chemical), anti-TuJ1 (mouse monoclonal, Covance), anti-
Parvalbumin (mouse monoclonal, Sigma), anti-Somatostatin (rabbit polyclonal, Millipore), anti-ChAT
(rabbit polyclonal, Santa Cruz biotechnology). Sections were then rinsed and incubated with appropriate
Alexa Fluor dye-conjugated IgG secondary antibodies (1:800 goat anti-rabbit/mouse/rat, Life
Technologies) and mounted in Fluoromount-G (SouthernBiotech). Sections were counterstained with
NeuroTrace Nissl Stain (Molecular Probes) or DAPI. For BrdU immunostaining, sections were
denatured in HCl (2 N) at 37°C for 45 min, then neutralized in sodium borohydrate buffer (0.1 M pH
8.5) twice for 10 min at room temperature before the normal staining protocol.
At MIT, 40-um thick coronal frozen sections through the striatum were cut with a sliding microtome and
were stored in a solution of 0.1M NaKPO4 and 0.4% Na azide until use. For immunofluorescence
immunohistochemistry, sections were rinsed in 3x2 min in 0.01M phosphate buffered saline (PBS)
containing 0.2% Triton-X-1000 (Tx) and were blocked in tyramide signal amplification (TSA) blocking
peer-reviewed) is the author/funder. All rights reserved. No reuse allowed without permission. The copyright holder for this preprint (which was not. http://dx.doi.org/10.1101/244327doi: bioRxiv preprint first posted online Jan. 8, 2018;
(which was not peer-reviewed) is the author/funder. All rights reserved. No reuse allowed without permission. The copyright holder for this preprint. http://dx.doi.org/10.1101/244327doi: bioRxiv preprint first posted online Jan. 8, 2018;

3
reagent (Perkin Elmer) for 20 min. The sections were then incubated with primary antibodies in TSA
blocking reagent in PBS-Tx for 24 hours at 4°C with gentle shaking: anti-RFP (rabbit/mouse
polyclonal/monoclonal, Rockland Pharmaceuticals), anti-MOR1 (rabbit polyclonal,
Immunostar/Abcam), anti-CDG1 (rabbit polyclonal, Graybiel laboratory), anti-parvalbumin (mouse
monoclonal, Millipore), anti-somatostatin (rabbit polyclonal, Millpore), and anti-ChAT (rabbit
polyclonal, Millipore). After 24-hour incubation, sections were rinsed 3x2 min in PBS-Tx and incubated
for 2 hours in secondary antibody solution with the appropriate Alexa Fluor dye-conjugated IgG
secondary antibodies (1:300 goat anti-rabbit/mouse, ThermoFisher Scientific). Following incubation,
sections were rinsed 3x2 min in 0.1M PBS, mounted onto subbed glass slides, and were coverslipped
using ProLong Antifade Reagent containing DAPI (ThermoFisher Scientific).
Double Fluorescent in situ Hybridization
To obtain fresh frozen tissue for in situ hybridization, several Dlx1-CreER:Ai14 and Ascl1-CreER:Ai14
mice were selected following different time points of tamoxifen induction. Fresh tissue was harvested,
rinsed in 0.9% saline, and submerged in Tissue-Tek O.C.T embedding media (VWR) in a cryomold
container. This mold was quickly placed in 2-methyl butane (Sigma), which then was placed in liquid
nitrogen until the OCT block was frozen solid. The resulting frozen tissue was stored in −80°C freezer
before cryoosectioning.
Two-probe fluorescent in situ hybridization was performed on fresh frozen 12-µm thick cryosections of
P28 mouse brains using the QuantiGene ViewRNA ISH assay from Affymetrix. Briefly, tissue was
treated with formaldehyde fixation, protease digestion, target and label probe incubation, and buffer
washing according to the QuantiGene Affymetrix protocol. Tissue was then co-labeled with fluorescent
Nissl and imaged using a DeltaVision epifluorescent microscope (details below).
Imaging and Serial Reconstruction of Whole Brains
Fate-mapped neurons were imaged from serially mounted sections on a Zeiss LSM 780 confocal
microscope (CSHL St. Giles Advanced Microscopy Center) and Zeiss LSM 510 confocal microscope
with ZEN software (Ragon Institute of MGH, MIT and Harvard), including all featured images with
immunostaining. Volumetric whole brain imaging of native fluorescent signal was completed with a 5-
µm Z-step using previously described methods for serial two-photon tomography (Kim et al., 2015,
Ragan et al., 2012). Briefly brains were embedded in oxidized agarose and placed in a motorized stage
in a TissueCye 1000 (Tissuevision). Whole brains were then imaged as 12 (X) x 16 (y) tiles with 1 µm x
peer-reviewed) is the author/funder. All rights reserved. No reuse allowed without permission. The copyright holder for this preprint (which was not. http://dx.doi.org/10.1101/244327doi: bioRxiv preprint first posted online Jan. 8, 2018;
(which was not peer-reviewed) is the author/funder. All rights reserved. No reuse allowed without permission. The copyright holder for this preprint. http://dx.doi.org/10.1101/244327doi: bioRxiv preprint first posted online Jan. 8, 2018;

4
1 µm resolution for 270 Z sections (50-µm interval) or 1500 Z sections (5-µm interval). Image datasets
were stitched and reassembled by custom built software and viewed as stacks or 3D volumes. Image
processing was completed using ImageJ/FIJI software with all alterations applied only to entire images.
Three-dimensional image stacks of striatal cells from in situ data were acquired at room temperature
with a DeltaVision restoration microscope system consisting of an Olympus IX71 inverted microscope
equipped with Olympus 20X/0.75 U Apo 340 dry objectives and a Photometrics coolsnap HQ2 camera
configured at 0.1122 µm/pixel. Filters used were 430/24 ex/470/24 em and 645/30 ex/705/72 em. Z-
stack images of cells of cells were subjected to deconvolution by using Deltavision softworx 6.5.1
software (Applied Precision). The maximum projection or the middle optical section of the de-
convolved sections was exported to TIFF format and then processed by FIJI/ImageJ for the final images.
Quantification and Data Analysis
Manual scoring and counting of SPN cell types in striatal compartments was completed using
Neurolucida 11 software either directly from slides on an Olympus Bx51 microscope or from serially
collected Z-stack tile scan images (confocal or epifluorescent). Specifically, striosomes were identified
positively as groups of clustered cells with thick spinous dendrites co-localizing to MOR1-positive
zones and in negative by the absence of both Calbindin 28K (CB) and CDG1 co-localization, which are
specifically expressed in the matrix compartment of the striatum. Unless otherwise indicated, each
quantified sample consists of cell counts from 6 representative rostral-caudal coronal sections of
striatum per hemisphere, with multiple (2–10) brains from at least two litters sampled in all cases. Cell
densities in striosome and matrix compartments were calculated in two in areas bounded by drawing
contours around the Mor1+ striosomes or CDG1+ matrix and counting the number of RFP+ cells within
each compartment, averaging the cell density from replicate sections as done for all other cell counts.
Comparisons of striosome content in rostral (Bregma 1.54–0.5 mm) versus caudal (Bregma 0.45–0.82
mm) sections through the striatum at E12.5 TM (Ascl1-CreER) and E13.5 TM (Dlx1-CreER) were
quantified in counts in serial sections (on average 42 sections of 55-µm thickness). Rostral/caudal levels
were defined according to the 4th edition of the Mouse Brain in Stereotaxic Coordinates atlas (Paxinos
and Franklin, 2001). Finally, to quantify the co-localization of BrdU with RFP+ cells, the ratio of
BrdU+RFP+ cells in striosomes to total RFP+ cells in striosomes was determined for a minimum of three
different brains of two different litters in all cases. Unpaired or paired Student’s t-tests were used to
analyze data with two groups (see each figure legend for details), and one-way ANOVA and Tukey’s
honest difference significance tests were used for unbiased comparisons of multiple time-points within a
series. Results were displayed graphically and statistics completed using Graphpad Prism software.
peer-reviewed) is the author/funder. All rights reserved. No reuse allowed without permission. The copyright holder for this preprint (which was not. http://dx.doi.org/10.1101/244327doi: bioRxiv preprint first posted online Jan. 8, 2018;
(which was not peer-reviewed) is the author/funder. All rights reserved. No reuse allowed without permission. The copyright holder for this preprint. http://dx.doi.org/10.1101/244327doi: bioRxiv preprint first posted online Jan. 8, 2018;

5
SUPPLEMENTAL REFERENCES Crittenden, J.R., Cantuti-Castelvetri, I., Saka, E., Keller-McGandy, C.E., Hernandez, L.F., Kett, L.R., Young, A.B., Standaert, D.G., and Graybiel, A.M. (2009). Dysregulation of CalDAG-GEFI and CalDAG-GEFII predicts the severity of motor side-effects induced by anti-parkinsonian therapy. Proc Natl Acad Sci U A 106, 2892–2896.
He, M., Tucciarone, J., Lee, S., Nigro, M.J., Kim, Y., Levine, J.M., Kelly, S.M., Krugikov, I., Wu, P., Chen, Y., et al. (2016). Strategies and Tools for Combinatorial Targeting of GABAergic Neurons in Mouse Cerebral Cortex. Neuron 91, 1228–1243.
Kim, E.J., Ables, J.L., Dickel, L.K., Eisch, A.J., and Johnson, J.E. (2011). Ascl1 (Mash1) defines cells with long-term neurogenic potential in subgranular and subventricular zones in adult mouse brain. PloS One 6, e18472.
Kim, Y., Venkataraju, K.U., Pradhan, K., Mende, C., Taranda, J., Turaga, S.C., Arganda-Carreras, I., Ng, L., Hawrylycz, M.J., Rockland, K.S., et al. (2015). Mapping social behavior-induced brain activation at cellular resolution in the mouse. Cell Rep. 10, 292–305.
Madisen, L., Zwingman, T.A., Sunkin, S.M., Oh, S.W., Zariwala, H.A., Gu, H., Ng, L.L., Palmiter, R.D., Hawrylycz, M.J., Jones, A.R., et al. (2010). A robust and high-throughput Cre reporting and characterization system for the whole mouse brain. Nat. Neurosci. 13, 133–140.
Paxinos, G., and Franklin, K.B.J. (2001). The Mouse Brain in Stereotaxic Coordinates (Academic Press).
Ragan, T., Kadiri, L.R., Venkataraju, K.U., Bahlmann, K., Sutin, J., Taranda, J., Arganda-Carreras, I., Kim, Y., Seung, H.S., and Osten, P. (2012). Serial two-photon tomography for automated ex vivo mouse brain imaging. Nat. Methods 9, 255–258.
peer-reviewed) is the author/funder. All rights reserved. No reuse allowed without permission. The copyright holder for this preprint (which was not. http://dx.doi.org/10.1101/244327doi: bioRxiv preprint first posted online Jan. 8, 2018;
(which was not peer-reviewed) is the author/funder. All rights reserved. No reuse allowed without permission. The copyright holder for this preprint. http://dx.doi.org/10.1101/244327doi: bioRxiv preprint first posted online Jan. 8, 2018;

6
SUPPLEMENTAL FIGURE LEGENDS
Figure S1. The Tis21-CreER Driver Allows Genetic Fate Mapping of Neurogenic RGs and IPs
throughout LGE Neurogenesis, Related to Figure 1
(A) Gene targeting strategy and southern blot confirmation of a targeted Tis21-2A-CreER ES cell clone.
A 2A-CreER-polyA cassette was inserted in-frame before the stop codon of the Tis21 gene. Frt-neo-frt
cassette was removed by breeding with Flp transgenic mice. Red bar: southern probe fragment.
(B) E10 TM Pulse-chase of 8 hours in Tis21-2A-CreER;Ai14 embryos labels neurogenic progenitors
throughout the neural tube, including all germinal domains from rostral (R) regions such as the
telencephalon (*) down to the caudal (C) regions of spinal cord (arrows).
(C-E) E10 TM pulse-chase in Tis21-2A-CreER;Ai14 embryo labels a sparse assortment of RGs and aIPs
in the LGE, visible at 8 hours (C). These progenitors subsequently produce neurons that migrate into the
developing striatum, seen at 48 hours (D) and 96 hours (E) post-induction. Bottom panels depict
examples of RGs, aIPs, bIPs and postmitotic neurons (N) during this period of LGE neurogenesis.
(F) The left most panel shows the projected image of a particular large clone at 96 hours following
E10.5 TM induction. Remaining panels show a montage of individual optical sections across this
isolated cluster. The RG maintains end-feet at ventricle surface (arrow) and has generated multiple
Ascl1+ bIP (asterisks) throughout its vertical axis along the expanded SVZ by E14.5, suggesting
multiple rounds of RG division and significant proliferation of bIPs during the 96 hour period.
Scale bars: 1 mm in A; 100 µm in top of C, D, E; 20 µm in bottom of C, D, E;
Figure S2. The Ascl1-CreER Driver Targets Early aIPs and Late bIPs in the LGE, Related to
Figure 2
(A) High magnification images showing ASCL1 immunoreactivity (green) in LGE progenitors at E10,
E12, E14, and E16. Note the progressive shift of Ascl1 expression from VZ to SVZ starting at E12 and
restriction to SVZ by or before E14. Arrowheads indicate putative aIPs with somas at the ventricular
surface at E10. Blue: DAPI.
(B) Low (top) and high (bottom) magnification images showing ASCL1 immunoreactivity (green) in
progenitors marked by Ascl1-CreER;Ai14 E10 TM induction (red, yellow arrows) with 8 hour interval
before harvesting. Blue: DAPI.
(C) Low (top) and high (bottom) magnification images showing expression of the multipotency factor
Sox2 (green) in progenitors marked by Ascl1-CreER;Ai14 E10 TM induction (red, arrowheads). Blue:
DAPI; yellow: merge of red and green.
peer-reviewed) is the author/funder. All rights reserved. No reuse allowed without permission. The copyright holder for this preprint (which was not. http://dx.doi.org/10.1101/244327doi: bioRxiv preprint first posted online Jan. 8, 2018;
(which was not peer-reviewed) is the author/funder. All rights reserved. No reuse allowed without permission. The copyright holder for this preprint. http://dx.doi.org/10.1101/244327doi: bioRxiv preprint first posted online Jan. 8, 2018;
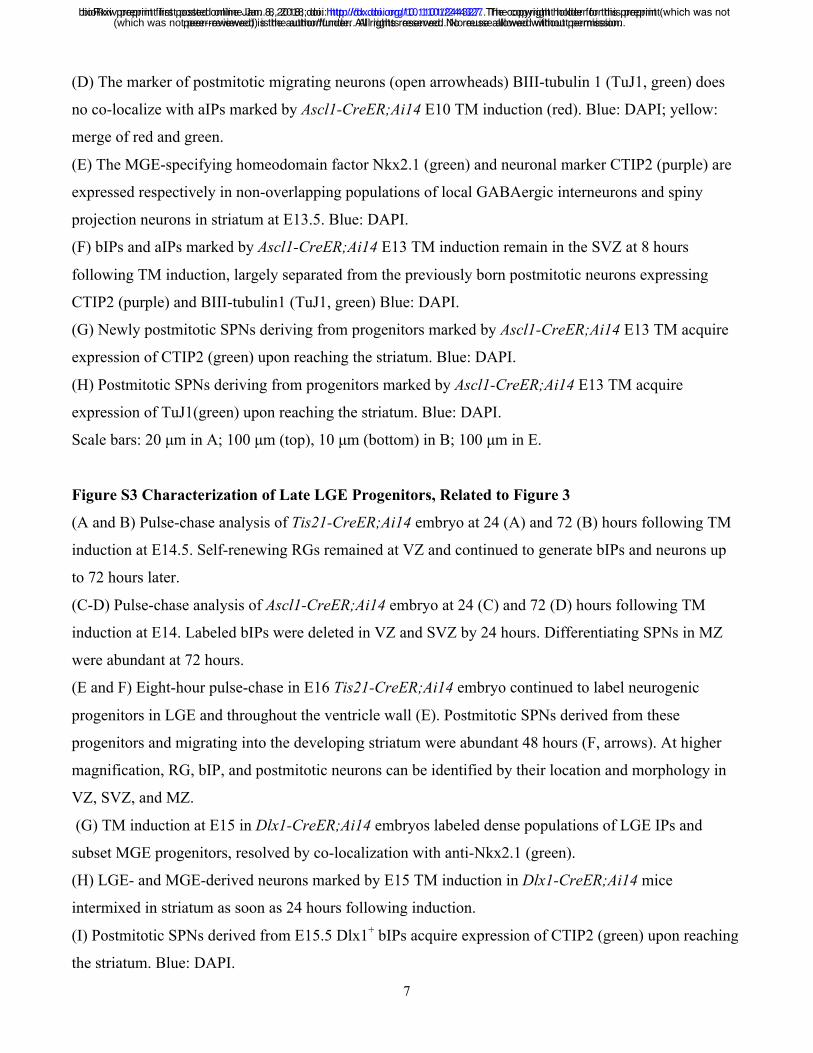
7
(D) The marker of postmitotic migrating neurons (open arrowheads) BIII-tubulin 1 (TuJ1, green) does
no co-localize with aIPs marked by Ascl1-CreER;Ai14 E10 TM induction (red). Blue: DAPI; yellow:
merge of red and green.
(E) The MGE-specifying homeodomain factor Nkx2.1 (green) and neuronal marker CTIP2 (purple) are
expressed respectively in non-overlapping populations of local GABAergic interneurons and spiny
projection neurons in striatum at E13.5. Blue: DAPI.
(F) bIPs and aIPs marked by Ascl1-CreER;Ai14 E13 TM induction remain in the SVZ at 8 hours
following TM induction, largely separated from the previously born postmitotic neurons expressing
CTIP2 (purple) and BIII-tubulin1 (TuJ1, green) Blue: DAPI.
(G) Newly postmitotic SPNs deriving from progenitors marked by Ascl1-CreER;Ai14 E13 TM acquire
expression of CTIP2 (green) upon reaching the striatum. Blue: DAPI.
(H) Postmitotic SPNs deriving from progenitors marked by Ascl1-CreER;Ai14 E13 TM acquire
expression of TuJ1(green) upon reaching the striatum. Blue: DAPI.
Scale bars: 20 µm in A; 100 µm (top), 10 µm (bottom) in B; 100 µm in E.
Figure S3 Characterization of Late LGE Progenitors, Related to Figure 3
(A and B) Pulse-chase analysis of Tis21-CreER;Ai14 embryo at 24 (A) and 72 (B) hours following TM
induction at E14.5. Self-renewing RGs remained at VZ and continued to generate bIPs and neurons up
to 72 hours later.
(C-D) Pulse-chase analysis of Ascl1-CreER;Ai14 embryo at 24 (C) and 72 (D) hours following TM
induction at E14. Labeled bIPs were deleted in VZ and SVZ by 24 hours. Differentiating SPNs in MZ
were abundant at 72 hours.
(E and F) Eight-hour pulse-chase in E16 Tis21-CreER;Ai14 embryo continued to label neurogenic
progenitors in LGE and throughout the ventricle wall (E). Postmitotic SPNs derived from these
progenitors and migrating into the developing striatum were abundant 48 hours (F, arrows). At higher
magnification, RG, bIP, and postmitotic neurons can be identified by their location and morphology in
VZ, SVZ, and MZ.
(G) TM induction at E15 in Dlx1-CreER;Ai14 embryos labeled dense populations of LGE IPs and
subset MGE progenitors, resolved by co-localization with anti-Nkx2.1 (green).
(H) LGE- and MGE-derived neurons marked by E15 TM induction in Dlx1-CreER;Ai14 mice
intermixed in striatum as soon as 24 hours following induction.
(I) Postmitotic SPNs derived from E15.5 Dlx1+ bIPs acquire expression of CTIP2 (green) upon reaching
the striatum. Blue: DAPI.
peer-reviewed) is the author/funder. All rights reserved. No reuse allowed without permission. The copyright holder for this preprint (which was not. http://dx.doi.org/10.1101/244327doi: bioRxiv preprint first posted online Jan. 8, 2018;
(which was not peer-reviewed) is the author/funder. All rights reserved. No reuse allowed without permission. The copyright holder for this preprint. http://dx.doi.org/10.1101/244327doi: bioRxiv preprint first posted online Jan. 8, 2018;

8
(J) Postmitotic SPNs derived from E15.5 Dlx1+ bIPs acquire expression of TuJ1 (green) upon reaching
the striatum. Blue: DAPI.
Scale bars: 300 µm in A-D, E (left); 20 µm in E (right); 100 µm in G.
Figure S4. Co-Labeling of Fate-Mapped SPNs with Striatal Compartment Markers, Related to
Figures 2, 3, and 5
(A) Examples of MOR1 immunostaining (left) as the striosomal marker and CDGI (middle) and
Calbindin 28K (right) immunostaining as the matrix markers.
(B) Co-labeling of striosomes (red) following E10.5 TM induction in Ascl1-CreER;Ai14 mice with,
from left to right, anti-MOR1, anti-CDGI, and anti-CB28K immunostaining, respectively (green).
(C) Co-labeling of matrix following E17.5 TM induction in Dlx1-CreER;Ai14 mice with, from left to
right, anti-MOR1, anti-CDGI, and anti-CB28K immunostaining, respectively (green).
Scale bars: 300 µm.
Figure S5. Striatal GABAergic Interneurons Arise from Progenitors Distinct from Those That
Give Rise to SPNs, Related to Figure 5
(A) Inducible intersectional genetic fate-mapping strategy for fate mapping the striatal interneurons
deriving from MGE and preoptic area based on the targeting of progenitors that express both Ascl1 and
Nkx2.1, either simultaneously or sequentially.
(B) Representative striatum panels of TM inductions in Ascl1-CreER;Nkx2.1-ires-Flp-O;Ai65 mice,
showing a sparse assortment of interneurons in cohorts captured by TM inductions from E10.5 to E15.5
(red) and denser populations from E16.5 to E18.5. Green: parvalbumin. blue: Nissl. Right column:
parvalbumin-positive cells (arrows) at E10.5, E13.5, and E17.5. Scale bars: 300 µm (left), 50 µm (right).
(C) Histogram of striatal interneuron production from intersectional fate mapping of MGE progenitors
from E10.5 to E18.5. Eighty-five percent of all interneurons derive from progenitors captured by TM
inductions E15-E18, whereas only 5% (aggregate) come from TM inductions E10-E12. Error bars,
SEM.
(D) Proportional histogram of parvalbumin immunoreactive interneuron content in intersectional fate
mapping of MGE progenitors from E10.5 to E18.5.
(E) Dlx1+ SVZ progenitors are arranged in a dorsally focused gradient in the E17 LGE, and give rise to
a dense population of matrix SPNs.
(F) Ascl1+ SVZ progenitors are arranged in an opposing ventrally focused gradient to that of Dlx1+
peer-reviewed) is the author/funder. All rights reserved. No reuse allowed without permission. The copyright holder for this preprint (which was not. http://dx.doi.org/10.1101/244327doi: bioRxiv preprint first posted online Jan. 8, 2018;
(which was not peer-reviewed) is the author/funder. All rights reserved. No reuse allowed without permission. The copyright holder for this preprint. http://dx.doi.org/10.1101/244327doi: bioRxiv preprint first posted online Jan. 8, 2018;

9
progenitors in the E17 LGE, giving rise to glia cells and presumably MGE-derived local striatal
interneurons in preference to SPNs.
Scale bars: 100 µm in E, F.
Figure S6. Cholinergic Interneuron Content in Striosome Fate Mapping, Related to Figure 5
(A) Immunolabeling of parvalbumin (PV, green) and somatostatin (SOM, blue in subpanel) does not
overlap with fate-mapped striosomes following E10.5 TM induction in Ascl1-CreER mice.
(B) Immunolabeling of somatostatin (SOM, green) and parvalbumin (PV, blue in subpanel) does not
overlap with fate-mapped striosomes following E10.5 TM induction in Ascl1-CreER mice.
(C-E) Immunolabeling of choline acetyltransferase (ChAT) expression in cholinergic interneurons
(ChAT, green) does not overlap with fate-mapped striosome or matrix deriving from the Ascl1 lineage
following TM inductions at E10.5 (C), E13.5 (D), or E15.5 (E) in Ascl1-CreER mice (Ascl1-
CreER;Ai14, red).
Scale bars: 100 µm.
Figure S7. Temporal Order of Neurogenesis in LGE Translates into a Spatial Sequence of SPN
Settlement in Striatum, Related to Figure 5 and 6
(A and B) Distribution of fate-mapped SPNs in rostral (A) and caudal (B) striatum following E12.5 TM
induction in Ascl1-CreER;Ai14 mice. Arrow: lateral infiltration of the earliest matrix SPNs to populate
rostral striatum. Scale bar: 300 µm.
(C and D) Co-labeling of striosomes in rostral (C) and caudal (D) striatum by anti-MOR1.
(E and F) Co-labeling of matrix in rostral (E) and caudal (F) striatum by anti-CDGI.
(G) Decline in S cell production from E12.5 to E14.5 in Ascl1-CreER;Ai14 mice. Error bars, SEM.
(H) Pooled quantification of S cell content in rostral versus caudal striatum following E12.5 TM
induction in Ascl1-CreER;Ai14 mice or E13.5 TM induction in Dlx1-CreER;Ai14 mice. ***p < 0.0001.
(I) Serial two-photon tomography of a P28 brain following E10.5 TM induction in a Ascl1-CreER;Ai14
mouse revealed a dense shell of S cells encapsulating the lateral border of striatum and sparsely
distributed striosomes throughout both the caudal and rostral extent of the striatum (red circle), with
axon projection to the SNc (arrows). Dorsal-ventral (V-D), lateral-medial (L-M) and rostral-caudal (R-
C) axes are indicated.
(J) Serial two-photon tomography of a P28 brain following E13.5 TM in a Dlx1-CreER;Ai14 mouse
shows a sharp transition from matrix (blue circle) to striosomes (red circle) in caudal compared to rostral
regions of striatum. The birth date-dependent lateral to medial settling occurred in two staggered waves
peer-reviewed) is the author/funder. All rights reserved. No reuse allowed without permission. The copyright holder for this preprint (which was not. http://dx.doi.org/10.1101/244327doi: bioRxiv preprint first posted online Jan. 8, 2018;
(which was not peer-reviewed) is the author/funder. All rights reserved. No reuse allowed without permission. The copyright holder for this preprint. http://dx.doi.org/10.1101/244327doi: bioRxiv preprint first posted online Jan. 8, 2018;

10
visualized in both Ascl1 and Dlxl1drivers – the first for S cells between E10-E13 and the second more
prominent gradient for M cells between E13-E17 (see Figure 5).
peer-reviewed) is the author/funder. All rights reserved. No reuse allowed without permission. The copyright holder for this preprint (which was not. http://dx.doi.org/10.1101/244327doi: bioRxiv preprint first posted online Jan. 8, 2018;
(which was not peer-reviewed) is the author/funder. All rights reserved. No reuse allowed without permission. The copyright holder for this preprint. http://dx.doi.org/10.1101/244327doi: bioRxiv preprint first posted online Jan. 8, 2018;

ATG
EcoRI EcoRI
STOP
9.7kb
Tis21 WT
ATG
EcoRI EcoRI
STOP
7.7kb
2A-CreER pA Neofrt frt
EcoRI EcoRI
Tis21-2A-CreER9.7 kb WT
7.7 kb KI 7.7 kb KI
3’ neo probe5’ KI` probe *LGE
Tis21-CreER
E10 TM + 8 hr
A B
C
R
E10 TM + 48 hr
D
LGE
MGEStr
* *
*
**
*
Z-projection Z= 1 Z= 2 Z= 3 Z= 4F
Z= 5 Z= 6 Z= 7 Z= 8 Z= 9 Z= 10 Z= 11 Z= 12
E10 TM + 96 hr
E
*
*
* **
*
*
*
*
E10 TM + 8 hrTis21-CreER; Ai14DAPI
C
MGE
LGE
LGE
aIP
N
aIPaIP
aIP
N
RG RGRGaIP
bIP bIP
RGaIP
peer-reviewed) is the author/funder. All rights reserved. No reuse allowed without permission. The copyright holder for this preprint (which was not. http://dx.doi.org/10.1101/244327doi: bioRxiv preprint first posted online Jan. 8, 2018;
Figure S1
(which was not peer-reviewed) is the author/funder. All rights reserved. No reuse allowed without permission. The copyright holder for this preprint. http://dx.doi.org/10.1101/244327doi: bioRxiv preprint first posted online Jan. 8, 2018;

TdTomatoAscl1DAPI
TdTomatoSox2 DAPI
TdTomatoTuJ1 DAPI
Ascl1-CreER; Ai14 E10.0 TM + 8 hr
LGE
MGE
LGE
MGE
LGE
MGE
LV LVVZ
VZ
MZ
LV
VZ
MZ
Ascl1-CreER; Ai14 E13.0 TM + 8 hr
CTIP2 TdTomatoTuJ1
CTIP2 TdTomatoCTIP2 TuJ1
TdTomatoDAPI
DAPI DAPI DAPILGE
MGE
Nkx2.1
Striatum
LVVZ
SVZ
LVVZ
SVZ
LVVZ
SVZ
B C
E F G
E10 E12 E14
LV
VZ
LV
VZ
LV
VZ
SVZ
Ascl1
E16
SVZ
VZ
DAPI
A
D
H
LV
Figure S2peer-reviewed) is the author/funder. All rights reserved. No reuse allowed without permission.
The copyright holder for this preprint (which was not. http://dx.doi.org/10.1101/244327doi: bioRxiv preprint first posted online Jan. 8, 2018; (which was not peer-reviewed) is the author/funder. All rights reserved. No reuse allowed without permission.
The copyright holder for this preprint. http://dx.doi.org/10.1101/244327doi: bioRxiv preprint first posted online Jan. 8, 2018;

Str
MGE
LGE
E16 TM + 8 hr
E16 TM + 48 hr
E
F
VZ
SVZ
SVZVZ
Str
Str
MGE
LGE
TdTomatoNkx2.1
TdTomato
Nkx2.1CTIP2 TdTomato
CTIP2 TuJ1TdTomatoDAPI
DAPIDAPI DAPI
Dlx1-CreER;Ai14 E15 TM + 24 hr
LVVZ
SVZ
LGE
MGE
Tis21-CreER;Ai14 E14 TM
Ascl1-CreER;Ai14 E14 TM
Tis21-CreER;Ai14 E16 TMA B
C D
RG
bIP
N
N
RG
N
bIP
N N
RG
bIP
bIP
N
G H I J
E14 TM + 24 hrs E14 TM + 72 hrs
E14 TM + 72 hrsE14 TM + 24 hrs
Figure S3
peer-reviewed) is the author/funder. All rights reserved. No reuse allowed without permission. The copyright holder for this preprint (which was not. http://dx.doi.org/10.1101/244327doi: bioRxiv preprint first posted online Jan. 8, 2018;
(which was not peer-reviewed) is the author/funder. All rights reserved. No reuse allowed without permission. The copyright holder for this preprint. http://dx.doi.org/10.1101/244327doi: bioRxiv preprint first posted online Jan. 8, 2018;
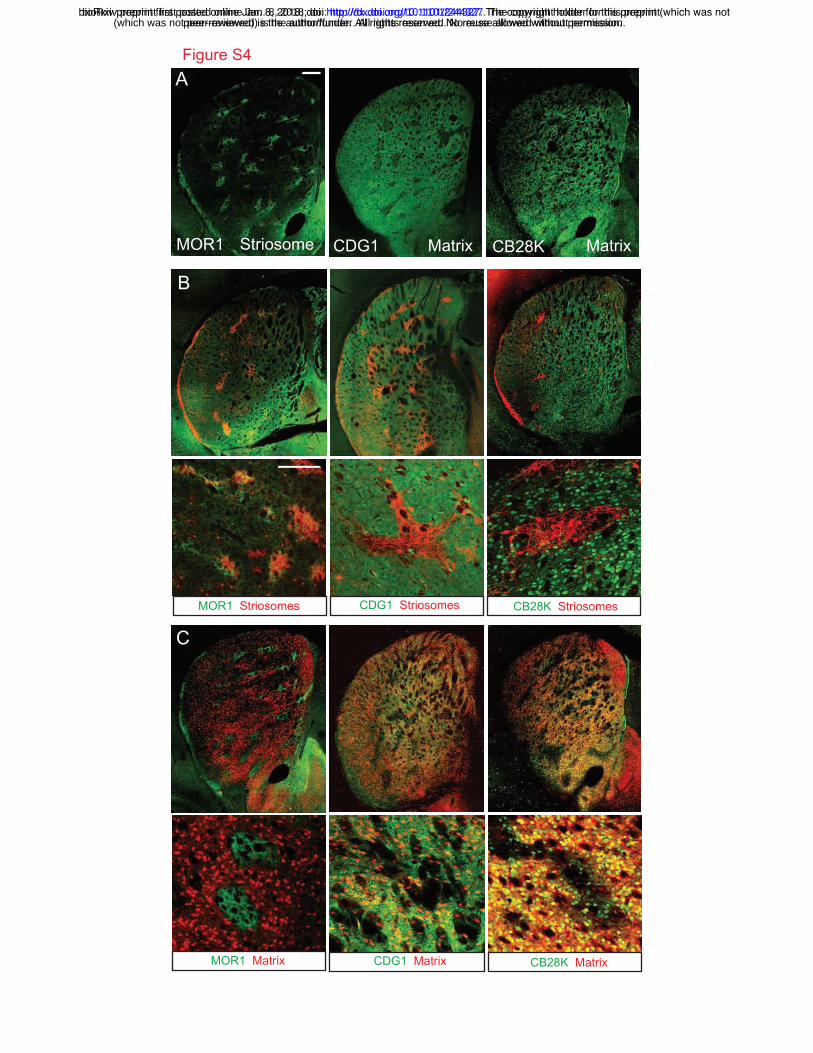
MOR1 CDG1 CB28K
MOR1 Striosomes
A
MatrixStriosome Matrix
CDG1 Striosomes
MOR1 Matrix CDG1 Matrix CB28K Matrix
CB28K Striosomes
B
C
peer-reviewed) is the author/funder. All rights reserved. No reuse allowed without permission. The copyright holder for this preprint (which was not. http://dx.doi.org/10.1101/244327doi: bioRxiv preprint first posted online Jan. 8, 2018;
Figure S4
(which was not peer-reviewed) is the author/funder. All rights reserved. No reuse allowed without permission. The copyright holder for this preprint. http://dx.doi.org/10.1101/244327doi: bioRxiv preprint first posted online Jan. 8, 2018;

E12.5
E15.5
CreER
Rosa 26STOP RFPSTOP
FRT FRT
FLP-ONkx2.1
Ascl1-CreERA B E10.5 E11.5
E13.5 E14.5
E16.5 E17.5 E18.5
Ascl1-CreER; Ai14 E17.5 TM - P28
VZ
SVZ
LGE
VZSVZ
LGE
MGE
VZ
MGE
Ascl1-CreER; Ai14 E17.5 TM + 8 hrsDlx1-CreER; Ai14 E17.5 TM - P28
Dlx1-CreER; Ai14 E17.5 TM + 8 hrs
E10.5
E13.5
E17.5
E F
E10.5 E11.5 E12.5 E13.5 E14.5 E15.5 E16.5 E17.5 E18.50
10
20
30
40
50
Cel
ls/s
ectio
n
E10.5 E11.5 E12.5 E13.5 E14.5 E15.5 E16.5 E17.5 E18.50
10
20
30
40
50
% P
V+ o
f fat
e m
appe
d IN
s
D
C
PV NISSLAscl1/Nkx2.1
peer-reviewed) is the author/funder. All rights reserved. No reuse allowed without permission. The copyright holder for this preprint (which was not. http://dx.doi.org/10.1101/244327doi: bioRxiv preprint first posted online Jan. 8, 2018;
Figure S5
(which was not peer-reviewed) is the author/funder. All rights reserved. No reuse allowed without permission. The copyright holder for this preprint. http://dx.doi.org/10.1101/244327doi: bioRxiv preprint first posted online Jan. 8, 2018;

D E
SOM Ascl1-CreER PVPV Ascl1-CreER SOM
E10.5 E10.5
E10.5 E13.5 E15.5ChAT Ascl1-CreER
A B
C D E
peer-reviewed) is the author/funder. All rights reserved. No reuse allowed without permission. The copyright holder for this preprint (which was not. http://dx.doi.org/10.1101/244327doi: bioRxiv preprint first posted online Jan. 8, 2018;
Figure S6
(which was not peer-reviewed) is the author/funder. All rights reserved. No reuse allowed without permission. The copyright holder for this preprint. http://dx.doi.org/10.1101/244327doi: bioRxiv preprint first posted online Jan. 8, 2018;

D
LV
M
DL
VM
R
C
R
C
SN
E10.5 TMI
Ascl1-CreER
DL
VM
DL
VM
R
C
R
C
SN
E12.5 TM
Dlx1-CreER
A C E
B D
J
Rostral
Caud
al
E12 E13 E140
25
50
75
100
TM induction timepoint
% s
trio
som
e ce
lls
Rostral Caudal Total0
25
50
75
100
Striatum region
% s
trio
som
e ce
lls
G
H
***
FMOR1
MOR1 CDGI
CDGI
peer-reviewed) is the author/funder. All rights reserved. No reuse allowed without permission. The copyright holder for this preprint (which was not. http://dx.doi.org/10.1101/244327doi: bioRxiv preprint first posted online Jan. 8, 2018;
Figure S7
(which was not peer-reviewed) is the author/funder. All rights reserved. No reuse allowed without permission. The copyright holder for this preprint. http://dx.doi.org/10.1101/244327doi: bioRxiv preprint first posted online Jan. 8, 2018;