radar observations and shape model of asteroid 16 …radar observations and shape model of asteroid...
TRANSCRIPT
Icarus 281 (2017) 388–403
Contents lists available at ScienceDirect
Icarus
journal homepage: www.elsevier.com/locate/icarus
Radar observations and shape model of asteroid 16 Psyche
Michael K. Shepard
a , ∗, James Richardson
b , Patrick A. Taylor b , Linda A. Rodriguez-Ford
b , Al Conrad
c , Imke de Pater d , Mate Adamkovics d , Katherine de Kleer d , Jared R. Males e , Katie M. Morzinski e , Laird M. Close
e , Mikko Kaasalainen
f , Matti Viikinkoski f , Bradley Timerson
g , Vishnu Reddy
h , Christopher Magri i , Michael C. Nolan
j , Ellen S. Howell j , Lance A.M. Benner k , Jon D. Giorgini k , Brian D. Warner l , Alan W. Harris m
a Bloomsburg University, 400 E. Second St., Bloomsburg, PA 17815 USA b Arecibo Observatory, USRA Arecibo, PR 00612 USA c University of Arizona, Large Binocular Telescope Obs., Tucson, AZ 85721 USA d University of California Berkeley, Berkeley, CA 94720, USA e Steward Observatory, University of Arizona, Tucson, AZ 85721, USA f Tampere University of Technology, 33101 Tampere, Finland g International Occultation Timing Assoc., 623 Bell Rd., Newark, NY 14513,USA h Lunar and Planetary Laboratory, University of Arizona, Tucson, AZ, 85721, USA i University of Maine Farmington, Farmington, ME, 04938 USA j Lunar and Planetary Laboratory, University of Arizona, Tucson AZ, 85721 USA k Jet Propulsion Laboratory, Pasadena, CA, 91109, USA l More Data! Inc. Eaton, CO, 80615, USA m More Data! Inc. La Cañada, CA, 91011, USA
a r t i c l e i n f o
Article history:
Available online 12 August 2016
Keywords:
Asteroids
Asteroids Composition
Surfaces Asteroids
Radar
a b s t r a c t
Using the S-band radar at Arecibo Observatory, we observed 16 Psyche, the largest M-class asteroid in
the main belt. We obtained 18 radar imaging and 6 continuous wave runs in November and December
2015, and combined these with 16 continuous wave runs from 2005 and 6 recent adaptive-optics (AO)
images ( Drummond et al., 2016 ) to generate a three-dimensional shape model of Psyche. Our model is
consistent with a previously published AO image (Hanus et al., 2013) and three multi-chord occultations.
Our shape model has dimensions 279 × 232 × 189 km ( ± 10%), D eff = 226 ± 23 km, and is 6% larger than,
but within the uncertainties of, the most recently published size and shape model generated from the
inversion of lightcurves (Hanus et al., 2013). Psyche is roughly ellipsoidal but displays a mass-deficit over
a region spanning 90 ° of longitude. There is also evidence for two ∼50–70 km wide depressions near its
south pole. Our size and published masses lead to an overall bulk density estimate of 4500 ± 1400 kgm
−3 .
Psyche’s mean radar albedo of 0.37 ± 0.09 is consistent with a near-surface regolith composed largely of
iron-nickel and ∼40% porosity. Its radar reflectivity varies by a factor of 1.6 as the asteroid rotates, sug-
gesting global variations in metal abundance or bulk density in the near surface. The variations in radar
albedo appear to correlate with large and small-scale shape features. Our size and Psyche’s published
absolute magnitude lead to an optical albedo of p v = 0.15 ± 0.03, and there is evidence for albedo varie-
gations that correlate with shape features.
© 2016 Elsevier Inc. All rights reserved.
p
a
(
r
m
n
fl
1. Introduction
Asteroid 16 Psyche is the largest Tholen (1984) M-class aster-
oid and a potential spacecraft target ( Elkins-Tanton et al., 2014 ).
The red-slope and generally featureless visible/near-infrared (VISIR)
spectra of the M-class were similar to that of meteoritic iron-nickel
(Fe-Ni) observed in the laboratory, so the early and canonical inter-
∗ Corresponding author.
E-mail address: [email protected] (M.K. Shepard).
c
f
http://dx.doi.org/10.1016/j.icarus.2016.08.011
0019-1035/© 2016 Elsevier Inc. All rights reserved.
retation of M-class asteroids is that they are the remnant cores of
ncient planetesimals, stripped as a result of cataclysmic collisions
Chapman and Salisbury, 1973; Bell et al., 1989 ). Additional labo-
atory work showed that enstatite chondrites are also a possible
atch ( Gaffey, 1976; Gaffey and McCord, 1979 ) and offers an alter-
ative interpretation which was recently supported by the Rosetta
yby of the M-class asteroid 21 Lutetia ( Vernazza et al., 2011 ).
Because the visible/near-infrared spectral data for the M-
lass is subtle or ambiguous, radar is a better tool for identi-
ying metallic content in the upper meter or so of the regolith

M.K. Shepard et al. / Icarus 281 (2017) 388–403 389
(
e
t
i
e
c
p
2
a
(
A
f
a
S
c
d
2
2
d
p
t
o
m
r
o
s
r
o
T
s
g
t
r
σ
l
m
U
u
a
q
a
a
B
w
r
r
t
t
μ
t
s
t
w
u
c
a
i
e
o
t
(
a
s
a
a
t
r
2
2
t
“
s
t
2
v
d
b
d
s
f
3
e
t
M
a
t
P
s
2
P
s
t
e
t
p
w
w
b
s
m
o
e
o
s
A
2
1
Cloutis et al., 1990 ). The first radar observations of Psyche ( Ostro
t al., 1985 ) showed it to have a significantly higher radar albedo
han other main-belt asteroids, consistent with the metallic-core
nterpretation. Subsequent radar observations and analysis ( Magri
t al., 2007a; Shepard et al., 2008 ) confirm these findings.
In this paper, we report new radar observations of Psy-
he using the Arecibo S-band radar (2380 MHz). We use these,
revious Arecibo radar observations from 2005 ( Shepard et al.,
008 ), new adaptive-optics (AO) images ( Drummond et al., 2016 ),
nd constraints from previous lightcurve shape model inversions
Kaasalainen et al., 2002 ), occultations ( Durech et al., 2011 ), and
O images ( Hanus et al., 2013 ) to generate a new shape model
or Psyche. In Section 2 , we briefly discuss our methods of radar
nalysis and examine what was previously known of Psyche. In
ection 3 , we describe the new radar data sets and inversion pro-
ess. In Section 4 , we examine the results, and in Section 5 , we
iscuss future prospects for additional observations.
. Background
.1. Radar analysis
In this section we review the conventions and equations that
escribe the relationship between radar measurements and the
hysical properties of an asteroid. A more thorough description of
hese conventions can be found in Ostro et al. (2002) .
For our continuous wave radar observations (also known as CW
r Doppler-only), each observing cycle or “run” consisted of trans-
ission of a circularly polarized 2380 MHz (12.6 cm) signal for the
ound-trip light travel time to the target, followed by the reception
f echoes for a similar duration in the opposite (OC) and same (SC)
enses of circular polarization as transmitted. We integrated the
eceived echo power spectra to measure the radar cross-sections
f Psyche (in km
2 ) for each sense of polarization, σ OC and σ SC .
he radar cross-section is defined as the cross-sectional area of a
mooth, metallic sphere (a perfect isotropic reflector) that would
enerate the observed echo power when viewed at the same dis-
ance.
The OC radar albedo, ˆ σOC , of an asteroid is defined to be the
atio of its OC radar cross section ( σ OC ) to its cross-sectional area
ˆ OC =
4 σOC
πD
2 e f f
. (1)
Published main-belt asteroid (MBA) radar albedos vary from a
ow of 0.039 for the CP-class 247 Eukrate ( Magri et al., 2007a ) to a
aximum of 0.6 for the M-class 216 Kleopatra ( Ostro et al., 20 0 0 ).
ncertainties in our estimates of absolute radar cross-section are
sually ± 25% and are based on estimates of pointing and system-
tic uncertainties in calibration.
The frequency of the echo is smeared about the transmitted fre-
uency because of the asteroid’s rotation. The echo bandwidth at
particular rotation phase, B ( φ), is a function of the asteroid’s di-
meter, aspect angle, and rotation period, and is given by
( φ) = k D ( φ) cos δ
P (2)
here the bandwidth is in Hz, D is the apparent width (km) at a
otation phase angle φ, P is the rotation period (h), δ is the sub-
adar latitude, and k is a constant particular to the wavelength and
he units used; for the 12.6 cm wavelength of Arecibo, k = 27.7.
The circular polarization ratio, μc , is defined to be the ratio of
he SC and OC echo cross-sections:
c =
σSC
σOC
. (3)
For rocky and metallic objects, values larger than zero are
hought to be caused by wavelength-scale roughness in the near-
urface ( ∼1 m depth for 12 cm wavelength) and multiple scat-
ering. Smooth surfaces have polarization ratios approaching 0.0,
hile some extremely rough surfaces have values at or even above
nity ( Ostro et al., 2002; Benner et al., 2008 ).
For delay-Doppler radar imaging observations, we transmitted a
oded signal with 100 μs time resolution (15 km range resolution)
nd sampled it twice per baud (giving correlated 7.5 km pixels) us-
ng the “long-code” method of Harmon (2002) , and measured the
cho as a function of Doppler frequency and delay in both senses
f polarization. For Psyche, the delay-Doppler SC signal is so weak
hat we do not use it further in our analysis.
Our delay-Doppler images are plotted with Doppler frequency
Hz) along the x-axis and delay (μs) along the y-axis. The images
re a superposition of echoes from both hemispheres onto a plane,
o they are north-south ambiguous. A convenient way of thinking
bout these images is to imagine looking down on the pole of the
steroid which is illuminated by a light from the equator (at the
op of the image), which leaves the back side of the asteroid in a
adar shadow.
.2. What is known about Psyche
.2.1. Composition
Psyche is the largest known Tholen (1984) M-class asteroid. Al-
hough M-class asteroid VISIR spectra were originally described as
featureless,” more recent high resolution spectra have revealed
ubtle features consistent with silicates on nearly every M-class as-
eroid, including Psyche ( Hardersen et al., 2005; Ockert-Bell et al.,
008 , 2011 ; Fornasier et al., 2011 ). Additionally, a number of in-
estigators have observed the 3-micron absorption signature of hy-
rated minerals on roughly half of the M-class observed in that
and ( Jones et al., 1990; Rivkin et al., 1995, 20 0 0 ). Since hy-
rated minerals are thought to be inconsistent with the origin of a
tripped metallic core, this observation led to other interpretations
or many of this class. Rivkin et al. (20 0 0 ) looked but did not see a
-micron feature in Psyche spectra, but new observations by Takir
t al. (2016) suggest one is present.
In an attempt to resolve some of the ambiguity in the composi-
ion of the M-class, Shepard et al. (2008, 2010, 2015 ) observed 29
-class asteroids using the Arecibo S-band radar. They found that
ll but two of this sample have radar albedos considerably higher
han the mean S- or C-class main-belt asteroid, and that 11 (38%),
syche among them, have radar albedos consistent with a compo-
ition dominated by Fe-Ni.
.2.2. Size and shape
One of the earliest, and still most quoted, size estimates for
syche is an effective diameter (diameter of a sphere with the
ame volume) D eff = 253 ± 4 km and came from the Infrared As-
ronomical Satellite (IRAS) mission ( Tedesco et al., 2002 ). Shepard
t al. (2008 ) summarize the historical size estimates since that
ime which range from ( D eff) 186 ± 30 to 288 ± 43 km. They also
oint out that the IRAS size is almost certainly too large because
e now know that IRAS was looking at Psyche nearly pole-on; it
as only seeing the larger two axes and the hemisphere may have
een warmer than usual because of the nearly continuous expo-
ure to sunlight.
Kaasalainen et al. (2002) generated the first convex shape
odel of Psyche using multiple lightcurves and inversion meth-
ds developed by Kaasalainen and Torppa (2001) and Kaasalainen
t al. (2001) . Their inversion methods have been further devel-
ped, systematized, and made available to the community by re-
earchers at Charles University (Czech Republic) in the Database of
steroid Models from Inversion Techniques (DAMIT) ( Durech et al.,
010 ). Their current convex model for Psyche utilizes more than
00 lightcurves from 1958 to 1992. The size of that model has

390 M.K. Shepard et al. / Icarus 281 (2017) 388–403
Table 1
Psyche delay-Doppler imaging data.
Run Epoch (UT) Lon ( °)
1 2015 Nov 29 04:37:05 302
2 2015 Nov 29 06:19:39 155
3 2015 Nov 30 04:31:32 51
4 2015 Nov 30 06:16:29 261
5 1 2015 Dec 01 04:57:45 114
6 2015 Dec 01 05:54:17 33
7 2015 Dec 02 04:33:13 250
8 2015 Dec 02 05:45:59 146
9 2015 Dec 03 05:49:27 242
10 2015 Dec 04 04:12:09 122
11 2015 Dec 04 05:55:33 334
12 2015 Dec 05 04:18:22 214
13 2015 Dec 05 05:49:59 83
14 2015 Dec 06 04:04:21 335
15 2 2015 Dec 06 05:59:38 180
16 2015 Dec 07 03:57:54 85
17 2015 Dec 07 05:40:13 299
18 2015 Dec 09 05:13:43 178
Earth-Psyche range was 1.70 AU.
All dates and times refer to the midpoint of the receive time.
Lon refers to the sub-radar body-centered longitude at the time
noted (light-time corrected). See the text for information on
smear.
Subradar latitudes for all runs were between −44 ° and −47 °1 This run lost 10 of 28 minutes of integration time. 2 This run lost 13 of 28 minutes of integration time.
Fig. 1. Continuous wave echo power spectra of 16 Psyche in 2015, ordered by
sub-radar longitude. The scale of all plots is the same as indicated in the lower
left panel. Longitudes refer to the sub-radar body-centered longitude of the shape
model at the time each run was acquired.
Fig. 2. Delay-Doppler observations of Psyche, in order of acquisition (left to right,
top to bottom). See Table 1 for dates and times. Resolution is 50 Hz/pixel horizon-
tally (Doppler) and 7.5 km/pixel vertically (delay).
a
c
p
g
s
m
o
t
h
changed slightly over the years, at first being scaled using two
occultations ( Timerson et al., 2011; Durech et al., 2011 ) and later
by incorporating adaptive-optics images from 2009 ( Hanus et al.,
2013 ). It is roughly ellipsoidal with an a -axis of 265 km, axial ratios
of a/b ∼ 1.2, b/c ∼ 1.2, and D eff = 213 ± 15 km. They report a side-
real rotation period P = 4.195948 h (uncertainty on the order of the
last significant figure) and a pole at ecliptic longitude and latitude
( λ, β) = (32 °, −7 °) ± 5 °.
2.2.3. Mass and density
There have been a number of mass estimates for Psyche de-
rived from several independent methods, including perturbations
from other individual asteroids (e.g. Viateau, 20 0 0 ), Mars ( Konopliv
et al., 2011 ), and many asteroids (e.g. ( Baer et al., 2008, 2011 ;
Zielenbach, 2011; Carry, 2012 ). While there are a few outliers, the
consensus mass of Psyche clusters in ∼12 × 10 −12 solar mass range
(see the reviews by Zielenbach (2011) and Carry (2012) ). Following
Carry (2012) , we adopt 2.72 ± 0.75 × 10 19 kg as our nominal mass.
Psyche’s density, of course, depends upon the size used in its
calculation. Using the IRAS size, the adopted mass gives a den-
sity of ρ = 3200 kgm
−3 , while the lower size on the DAMIT model
( D eff = 190 km) leads to an estimate of ρ = 7600 kgm
−3 , essentially
pure Fe-Ni with no porosity.
3. Observations and modeling results
3.1. New radar observations
We observed Psyche at Arecibo on eleven days from 28 Novem-
ber 2015 to 9 December 2015. Our primary focus was delay-
Doppler imaging and calibrated echo power spectra (Doppler-
only) were taken as the opportunity presented. In total, we ob-
tained 18 delay-Doppler images and 6 echo power spectra. De-
tails of the observations are in Tables 1 and 2 . Our combined
calibrated echo power spectra give a total OC radar cross-section
of σ OC =13,700 ± 3500 km
2 and a circular polarization ratio of
μc = 0.11 ± 0.02, suggesting a relatively smooth surface ( Fig. 1 ).
From the 2005 radar observations, Shepard et al. (2008 ) reported
total OC radar cross-section of σ OC = 15,800 ± 4000 km
2 and a
ircular polarization ratio of μc = 0.06 ± 0.02. Although our circular
olarization is slightly higher than theirs, our measurements are
enerally consistent to within uncertainties.
Our delay-Doppler observations used a code with a 100 μs baud,
ampled twice per baud (cf. Appendix A of Ostro et al. (2010) for
ore detailed explanation of this process), giving a resolution
f 50 μs or 7.5 km of depth per pixel. Our images cover all ro-
ational aspects of Psyche and had signal-to-noise ratios (SNRs)
igh enough for shape modeling ( Figs. 2 and 3 ) . In addition, we
M.K. Shepard et al. / Icarus 281 (2017) 388–403 391
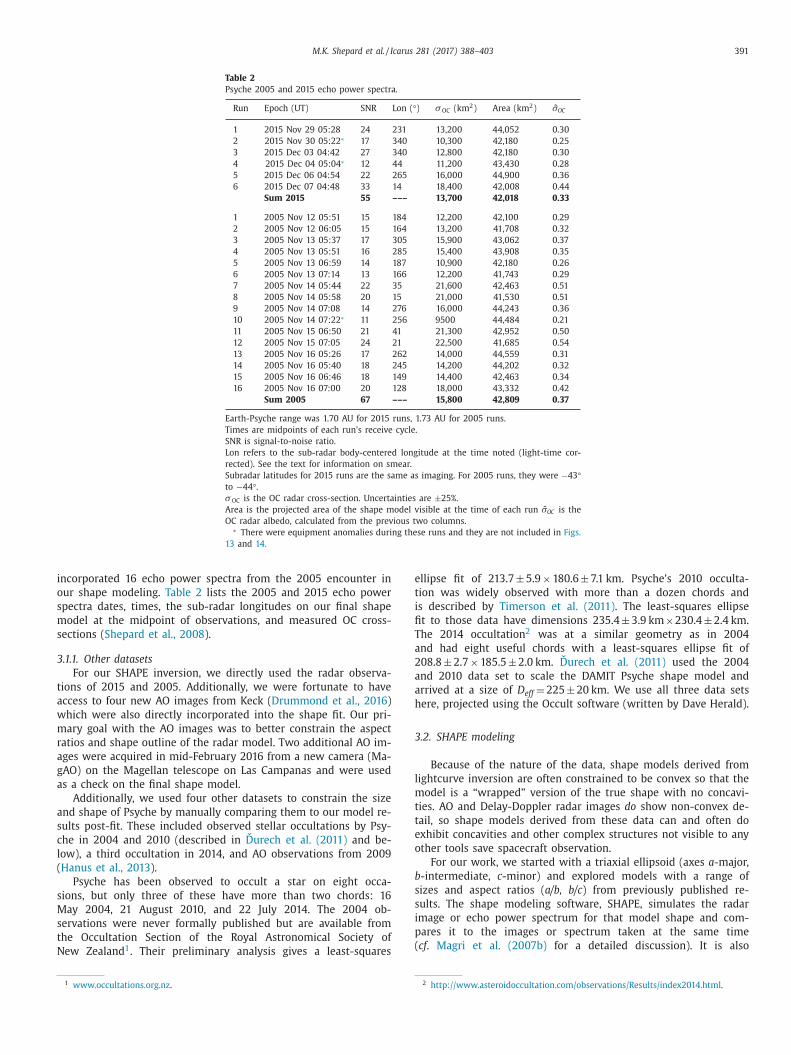
Table 2
Psyche 2005 and 2015 echo power spectra.
Run Epoch (UT) SNR Lon ( °) σ OC (km
2 ) Area (km
2 ) ˆ σOC
1 2015 Nov 29 05:28 24 231 13 ,200 44 ,052 0 .30
2 2015 Nov 30 05 :22 ∗ 17 340 10 ,300 42 ,180 0 .25
3 2015 Dec 03 04:42 27 340 12 ,800 42 ,180 0 .30
4 2015 Dec 04 05 :04 ∗ 12 44 11 ,200 43 ,430 0 .28
5 2015 Dec 06 04:54 22 265 16 ,0 0 0 44 ,900 0 .36
6 2015 Dec 07 04:48 33 14 18 ,400 42 ,008 0 .44
Sum 2015 55 ––– 13 ,700 42 ,018 0 .33
1 2005 Nov 12 05:51 15 184 12 ,200 42 ,100 0 .29
2 2005 Nov 12 06:05 15 164 13 ,200 41 ,708 0 .32
3 2005 Nov 13 05:37 17 305 15 ,900 43 ,062 0 .37
4 2005 Nov 13 05:51 16 285 15 ,400 43 ,908 0 .35
5 2005 Nov 13 06:59 14 187 10 ,900 42 ,180 0 .26
6 2005 Nov 13 07:14 13 166 12 ,200 41 ,743 0 .29
7 2005 Nov 14 05:44 22 35 21 ,600 42 ,463 0 .51
8 2005 Nov 14 05:58 20 15 21 ,0 0 0 41 ,530 0 .51
9 2005 Nov 14 07:08 14 276 16 ,0 0 0 44 ,243 0 .36
10 2005 Nov 14 07 :22 ∗ 11 256 9500 44 ,484 0 .21
11 2005 Nov 15 06:50 21 41 21 ,300 42 ,952 0 .50
12 2005 Nov 15 07:05 24 21 22 ,500 41 ,685 0 .54
13 2005 Nov 16 05:26 17 262 14 ,0 0 0 44 ,559 0 .31
14 2005 Nov 16 05:40 18 245 14 ,200 44 ,202 0 .32
15 2005 Nov 16 06:46 18 149 14 ,400 42 ,463 0 .34
16 2005 Nov 16 07:00 20 128 18 ,0 0 0 43 ,332 0 .42
Sum 2005 67 ––– 15 ,800 42 ,809 0 .37
Earth-Psyche range was 1.70 AU for 2015 runs, 1.73 AU for 2005 runs.
Times are midpoints of each run’s receive cycle.
SNR is signal-to-noise ratio.
Lon refers to the sub-radar body-centered longitude at the time noted (light-time cor-
rected). See the text for information on smear.
Subradar latitudes for 2015 runs are the same as imaging. For 2005 runs, they were −43 °to −44 °. σ OC is the OC radar cross-section. Uncertainties are ±25%.
Area is the projected area of the shape model visible at the time of each run ˆ σOC is the
OC radar albedo, calculated from the previous two columns. ∗ There were equipment anomalies during these runs and they are not included in Figs.
13 and 14.
i
o
s
m
s
3
t
a
w
m
r
a
g
a
a
s
c
l
(
s
M
s
t
N
e
t
i
fi
T
a
2
a
a
h
3
l
m
t
t
e
o
b
s
s
i
p
(
ncorporated 16 echo power spectra from the 2005 encounter in
ur shape modeling. Table 2 lists the 2005 and 2015 echo power
pectra dates, times, the sub-radar longitudes on our final shape
odel at the midpoint of observations, and measured OC cross-
ections ( Shepard et al., 2008 ).
.1.1. Other datasets
For our SHAPE inversion, we directly used the radar observa-
ions of 2015 and 2005. Additionally, we were fortunate to have
ccess to four new AO images from Keck ( Drummond et al., 2016 )
hich were also directly incorporated into the shape fit. Our pri-
ary goal with the AO images was to better constrain the aspect
atios and shape outline of the radar model. Two additional AO im-
ges were acquired in mid-February 2016 from a new camera (Ma-
AO) on the Magellan telescope on Las Campanas and were used
s a check on the final shape model.
Additionally, we used four other datasets to constrain the size
nd shape of Psyche by manually comparing them to our model re-
ults post-fit. These included observed stellar occultations by Psy-
he in 2004 and 2010 (described in Durech et al. (2011) and be-
ow), a third occultation in 2014, and AO observations from 2009
Hanus et al., 2013 ).
Psyche has been observed to occult a star on eight occa-
ions, but only three of these have more than two chords: 16
ay 2004, 21 August 2010, and 22 July 2014. The 2004 ob-
ervations were never formally published but are available from
he Occultation Section of the Royal Astronomical Society of
ew Zealand
1 . Their preliminary analysis gives a least-squares
1 www.occultations.org.nz .
llipse fit of 213.7 ± 5.9 × 180.6 ± 7.1 km. Psyche’s 2010 occulta-
ion was widely observed with more than a dozen chords and
s described by Timerson et al. (2011) . The least-squares ellipse
t to those data have dimensions 235.4 ± 3.9 km ×230.4 ± 2.4 km.
he 2014 occultation
2 was at a similar geometry as in 2004
nd had eight useful chords with a least-squares ellipse fit of
08.8 ± 2.7 × 185.5 ± 2.0 km. Durech et al. (2011) used the 2004
nd 2010 data set to scale the DAMIT Psyche shape model and
rrived at a size of D eff = 225 ± 20 km. We use all three data sets
ere, projected using the Occult software (written by Dave Herald).
.2. SHAPE modeling
Because of the nature of the data, shape models derived from
ightcurve inversion are often constrained to be convex so that the
odel is a “wrapped” version of the true shape with no concavi-
ies. AO and Delay-Doppler radar images do show non-convex de-
ail, so shape models derived from these data can and often do
xhibit concavities and other complex structures not visible to any
ther tools save spacecraft observation.
For our work, we started with a triaxial ellipsoid (axes a -major,
-intermediate, c -minor) and explored models with a range of
izes and aspect ratios ( a/b, b/c ) from previously published re-
ults. The shape modeling software, SHAPE, simulates the radar
mage or echo power spectrum for that model shape and com-
ares it to the images or spectrum taken at the same time
cf . Magri et al. (2007b) for a detailed discussion). It is also
2 http://www.asteroidoccultation.com/observations/Results/index2014.html .
392 M.K. Shepard et al. / Icarus 281 (2017) 388–403
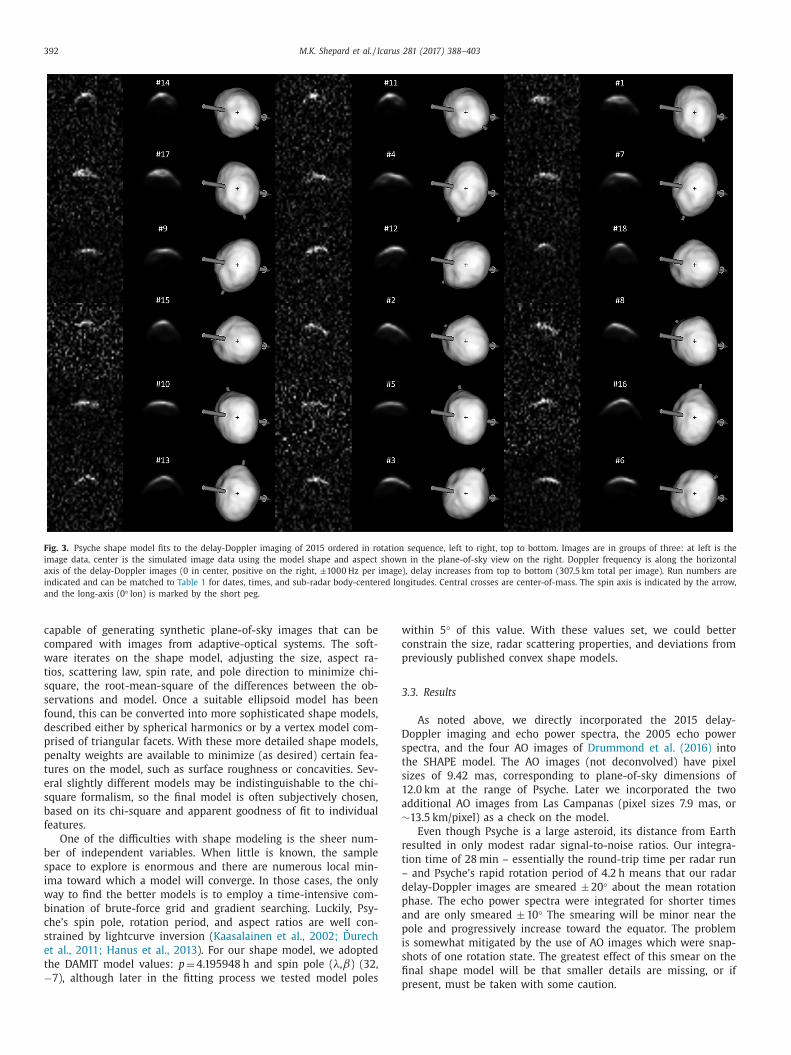
Fig. 3. Psyche shape model fits to the delay-Doppler imaging of 2015 ordered in rotation sequence, left to right, top to bottom. Images are in groups of three: at left is the
image data, center is the simulated image data using the model shape and aspect shown in the plane-of-sky view on the right. Doppler frequency is along the horizontal
axis of the delay-Doppler images (0 in center, positive on the right, ±10 0 0 Hz per image), delay increases from top to bottom (307.5 km total per image). Run numbers are
indicated and can be matched to Table 1 for dates, times, and sub-radar body-centered longitudes. Central crosses are center-of-mass. The spin axis is indicated by the arrow,
and the long-axis (0 ° lon) is marked by the short peg.
w
c
p
3
D
s
t
s
1
a
∼
r
t
–
d
p
a
p
i
s
fi
capable of generating synthetic plane-of-sky images that can be
compared with images from adaptive-optical systems. The soft-
ware iterates on the shape model, adjusting the size, aspect ra-
tios, scattering law, spin rate, and pole direction to minimize chi-
square, the root-mean-square of the differences between the ob-
servations and model. Once a suitable ellipsoid model has been
found, this can be converted into more sophisticated shape models,
described either by spherical harmonics or by a vertex model com-
prised of triangular facets. With these more detailed shape models,
penalty weights are available to minimize (as desired) certain fea-
tures on the model, such as surface roughness or concavities. Sev-
eral slightly different models may be indistinguishable to the chi-
square formalism, so the final model is often subjectively chosen,
based on its chi-square and apparent goodness of fit to individual
features.
One of the difficulties with shape modeling is the sheer num-
ber of independent variables. When little is known, the sample
space to explore is enormous and there are numerous local min-
ima toward which a model will converge. In those cases, the only
way to find the better models is to employ a time-intensive com-
bination of brute-force grid and gradient searching. Luckily, Psy-
che’s spin pole, rotation period, and aspect ratios are well con-
strained by lightcurve inversion ( Kaasalainen et al., 2002; Durech
et al., 2011; Hanus et al., 2013 ). For our shape model, we adopted
the DAMIT model values: p = 4.195948 h and spin pole ( λ, β) (32,
−7), although later in the fitting process we tested model poles
pithin 5 ° of this value. With these values set, we could better
onstrain the size, radar scattering properties, and deviations from
reviously published convex shape models.
.3. Results
As noted above, we directly incorporated the 2015 delay-
oppler imaging and echo power spectra, the 2005 echo power
pectra, and the four AO images of Drummond et al. (2016) into
he SHAPE model. The AO images (not deconvolved) have pixel
izes of 9.42 mas, corresponding to plane-of-sky dimensions of
2.0 km at the range of Psyche. Later we incorporated the two
dditional AO images from Las Campanas (pixel sizes 7.9 mas, or
13.5 km/pixel) as a check on the model.
Even though Psyche is a large asteroid, its distance from Earth
esulted in only modest radar signal-to-noise ratios. Our integra-
ion time of 28 min – essentially the round-trip time per radar run
and Psyche’s rapid rotation period of 4.2 h means that our radar
elay-Doppler images are smeared ± 20 ° about the mean rotation
hase. The echo power spectra were integrated for shorter times
nd are only smeared ± 10 ° The smearing will be minor near the
ole and progressively increase toward the equator. The problem
s somewhat mitigated by the use of AO images which were snap-
hots of one rotation state. The greatest effect of this smear on the
nal shape model will be that smaller details are missing, or if
resent, must be taken with some caution.
M.K. Shepard et al. / Icarus 281 (2017) 388–403 393
r
s
r
a
t
b
i
(
c
F
n
s
a
h
c
g
w
p
w
o
e
c
m
a
e
m
v
l
n
i
A
f
s
n
c
a
t
t
g
a
o
p
t
n
P
w
i
t
m
n
o
t
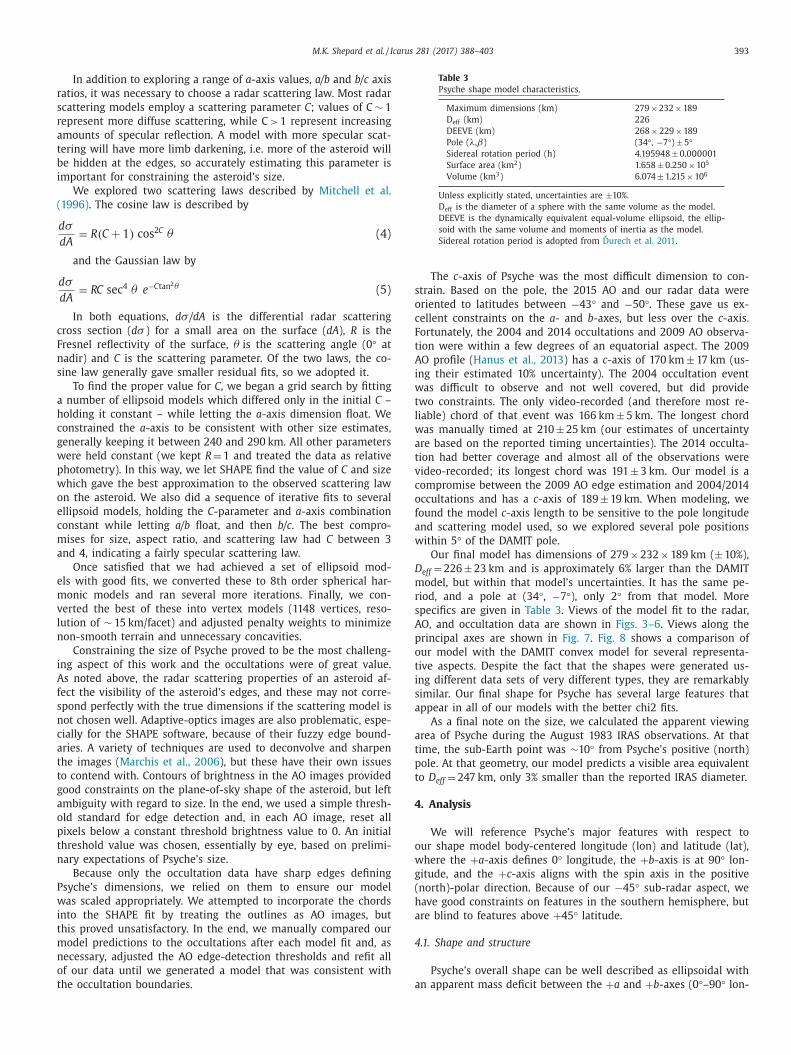
Table 3
Psyche shape model characteristics .
Maximum dimensions (km) 279 × 232 × 189
D eff (km) 226
DEEVE (km) 268 × 229 × 189
Pole ( λ, β) (34 °, −7 °) ± 5 °Sidereal rotation period (h) 4.195948 ± 0.0 0 0 0 01
Surface area (km
2 ) 1.658 ± 0.250 × 10 5
Volume (km
3 ) 6.074 ± 1.215 × 10 6
Unless explicitly stated, uncertainties are ±10%.
D eff is the diameter of a sphere with the same volume as the model.
DEEVE is the dynamically equivalent equal-volume ellipsoid, the ellip-
soid with the same volume and moments of inertia as the model.
Sidereal rotation period is adopted from Durech et al. 2011 .
s
o
c
F
t
A
i
w
t
l
w
a
t
v
c
o
f
a
w
D
m
r
s
A
p
o
t
i
s
a
a
t
p
t
4
o
w
g
(
h
a
4
a
In addition to exploring a range of a -axis values, a/b and b/c axis
atios, it was necessary to choose a radar scattering law. Most radar
cattering models employ a scattering parameter C ; values of C ∼ 1
epresent more diffuse scattering, while C > 1 represent increasing
mounts of specular reflection. A model with more specular scat-
ering will have more limb darkening, i.e. more of the asteroid will
e hidden at the edges, so accurately estimating this parameter is
mportant for constraining the asteroid’s size.
We explored two scattering laws described by Mitchell et al.
1996) . The cosine law is described by
dσ
dA
= R ( C + 1 ) cos 2 C θ (4)
and the Gaussian law by
dσ
dA
= RC sec 4 θ e −C tan 2 θ (5)
In both equations, d σ /dA is the differential radar scattering
ross section ( d σ ) for a small area on the surface ( dA ), R is the
resnel reflectivity of the surface, θ is the scattering angle (0 ° at
adir) and C is the scattering parameter. Of the two laws, the co-
ine law generally gave smaller residual fits, so we adopted it.
To find the proper value for C , we began a grid search by fitting
number of ellipsoid models which differed only in the initial C –
olding it constant – while letting the a -axis dimension float. We
onstrained the a -axis to be consistent with other size estimates,
enerally keeping it between 240 and 290 km. All other parameters
ere held constant (we kept R = 1 and treated the data as relative
hotometry). In this way, we let SHAPE find the value of C and size
hich gave the best approximation to the observed scattering law
n the asteroid. We also did a sequence of iterative fits to several
llipsoid models, holding the C- parameter and a -axis combination
onstant while letting a/b float, and then b/c . The best compro-
ises for size, aspect ratio, and scattering law had C between 3
nd 4, indicating a fairly specular scattering law.
Once satisfied that we had achieved a set of ellipsoid mod-
ls with good fits, we converted these to 8th order spherical har-
onic models and ran several more iterations. Finally, we con-
erted the best of these into vertex models (1148 vertices, reso-
ution of ∼ 15 km/facet) and adjusted penalty weights to minimize
on-smooth terrain and unnecessary concavities.
Constraining the size of Psyche proved to be the most challeng-
ng aspect of this work and the occultations were of great value.
s noted above, the radar scattering properties of an asteroid af-
ect the visibility of the asteroid’s edges, and these may not corre-
pond perfectly with the true dimensions if the scattering model is
ot chosen well. Adaptive-optics images are also problematic, espe-
ially for the SHAPE software, because of their fuzzy edge bound-
ries. A variety of techniques are used to deconvolve and sharpen
he images ( Marchis et al., 2006 ), but these have their own issues
o contend with. Contours of brightness in the AO images provided
ood constraints on the plane-of-sky shape of the asteroid, but left
mbiguity with regard to size. In the end, we used a simple thresh-
ld standard for edge detection and, in each AO image, reset all
ixels below a constant threshold brightness value to 0. An initial
hreshold value was chosen, essentially by eye, based on prelimi-
ary expectations of Psyche’s size.
Because only the occultation data have sharp edges defining
syche’s dimensions, we relied on them to ensure our model
as scaled appropriately. We attempted to incorporate the chords
nto the SHAPE fit by treating the outlines as AO images, but
his proved unsatisfactory. In the end, we manually compared our
odel predictions to the occultations after each model fit and, as
ecessary, adjusted the AO edge-detection thresholds and refit all
f our data until we generated a model that was consistent with
he occultation boundaries.
The c -axis of Psyche was the most difficult dimension to con-
train. Based on the pole, the 2015 AO and our radar data were
riented to latitudes between −43 ° and −50 °. These gave us ex-
ellent constraints on the a - and b -axes, but less over the c -axis.
ortunately, the 2004 and 2014 occultations and 2009 AO observa-
ion were within a few degrees of an equatorial aspect. The 2009
O profile ( Hanus et al., 2013 ) has a c -axis of 170 km ± 17 km (us-
ng their estimated 10% uncertainty). The 2004 occultation event
as difficult to observe and not well covered, but did provide
wo constraints. The only video-recorded (and therefore most re-
iable) chord of that event was 166 km ± 5 km. The longest chord
as manually timed at 210 ± 25 km (our estimates of uncertainty
re based on the reported timing uncertainties). The 2014 occulta-
ion had better coverage and almost all of the observations were
ideo-recorded; its longest chord was 191 ± 3 km. Our model is a
ompromise between the 2009 AO edge estimation and 2004/2014
ccultations and has a c -axis of 189 ± 19 km. When modeling, we
ound the model c -axis length to be sensitive to the pole longitude
nd scattering model used, so we explored several pole positions
ithin 5 ° of the DAMIT pole.
Our final model has dimensions of 279 × 232 × 189 km ( ± 10%),
eff = 226 ± 23 km and is approximately 6% larger than the DAMIT
odel, but within that model’s uncertainties. It has the same pe-
iod, and a pole at (34 °, −7 °), only 2 ° from that model. More
pecifics are given in Table 3 . Views of the model fit to the radar,
O, and occultation data are shown in Figs. 3–6 . Views along the
rincipal axes are shown in Fig. 7 . Fig. 8 shows a comparison of
ur model with the DAMIT convex model for several representa-
ive aspects. Despite the fact that the shapes were generated us-
ng different data sets of very different types, they are remarkably
imilar. Our final shape for Psyche has several large features that
ppear in all of our models with the better chi2 fits.
As a final note on the size, we calculated the apparent viewing
rea of Psyche during the August 1983 IRAS observations. At that
ime, the sub-Earth point was ∼10 ° from Psyche’s positive (north)
ole. At that geometry, our model predicts a visible area equivalent
o D eff = 247 km, only 3% smaller than the reported IRAS diameter.
. Analysis
We will reference Psyche’s major features with respect to
ur shape model body-centered longitude (lon) and latitude (lat),
here the + a -axis defines 0 ° longitude, the + b -axis is at 90 ° lon-
itude, and the + c -axis aligns with the spin axis in the positive
north)-polar direction. Because of our −45 ° sub-radar aspect, we
ave good constraints on features in the southern hemisphere, but
re blind to features above + 45 ° latitude.
.1. Shape and structure
Psyche’s overall shape can be well described as ellipsoidal with
n apparent mass deficit between the + a and + b -axes (0 °–90 ° lon-

394 M.K. Shepard et al. / Icarus 281 (2017) 388–403
Fig. 4. Psyche shape model fits to the OC echo power spectra. Each spectrum is 20 0 0 Hz wide and at the same vertical scale for signal-to-noise ratio (shown in lower left
plot). Sub-radar body-centered longitudes are indicated for each plot. The solid line is the observed spectrum and the dashed line is the model fit.
p
n
s
4
l
w
p
C
t
w
i
c
t
gitude) at the equator ( Fig. 9 ). The resolution of our radar imagery
and shape model is not sufficient for a detailed view or analysis
of this deficit, but we are reminded of the appearance of Vesta’s
Rheasilvia basin in Hubble Space Telescope imagery prior to the
arrival of Dawn ( Li et al., 2010 ).
There is good evidence for two crater-like depressions in the
southern hemisphere ( Fig. 10 ). The broader and shallower de-
pression (D1) is centered at longitude 90 °, latitude -80 ° and is
67 ± 15 km in diameter. This depression overlaps the south pole,
and there are intriguing hints in the dynamic elevation model ( Fig
10 ; see Section 4.3 for a description) of large trough-like features
running from either side of this depression toward the equator. The
smaller and deeper of the two depressions (D2) is centered at lon-
gitude 304 °, latitude -52 ° and is 53 ± 15 km wide. It is visible in
the delay-Doppler images and can be seen in the + a and –b axis
views of Fig. 7.
The SHAPE program accounts for apparent motion and rota-
tion of an asteroid, computes the center-of-figure (COF), and com-
hares it to the model center-of-mass (COM) assuming a homoge-
ous density. In our model, the COF and COM differed by < 0.2 km,
uggesting that Psyche is relatively homogenous.
.2. Bulk density and composition
Given the adopted mass of 2.72 ± 0.75 × 10 19 kg, our model
eads to a bulk density of ρ = 4500 ± 1400 kgm
−3 . This is consistent
ith an Fe-Ni composition ( ρ =7800 kgm
−3 ) and ∼40% macro-
orosity, or any of the stony-irons ( ρ ∼ 4500 kg m
−3 ) ( Britt and
onsolmagno, 2001 ) and essentially no macro-porosity. According
o a study of asteroid bulk densities by Carry (2012) , asteroids
ith masses up to ∼10 19 kg appear to have macroporosities rang-
ng from 0% to 60%. A threshold of 10 20 kg seems necessary to
ompress the interior to macroporosities ∼0%. Psyche’s mass es-
imate is near this boundary, and we cannot rule out either model.
The M-class asteroids, if metallic, are likely contenders for the
ighest bulk density in the main-belt. Carry (2012) lists bulk

M.K. Shepard et al. / Icarus 281 (2017) 388–403 395
Fig. 5. Psyche shape model views generated for the date and time of the Drummond et al. (2016) AO images. Spin axis (arrow), a -axis (short red peg), and b -axis (longer
green peg) are shown on the shape model for reference. The images acquired in December 2015 at Keck (scale 9.42 mas/pixel or 12 km/pixel) were near opposition at phase
angle 7 °, sub-observer latitude −50 °, and 1.76 AU from Earth, only 3% farther than when the radar data were acquired. Additional images were acquired in February 2016
from the Magellan MagAO camera (scale 7.9 mas/pixel or ∼13.5 km/pixel) at phase angle 20 °, sub-observer latitude −51, ° and 2.34 AU from the Earth. (For interpretation of
the references to colour in this figure legend, the reader is referred to the web version of this article.)
d
t
l
t
t
fl
a
m
a
a
c
t
c
2
f
b
(
s
m
h
4
g
B
t
a
e
e
b
h
w
t
p
c
c
o
a
ensity estimates for a number of M-class asteroids, but only
hree have mass estimates based on spacecraft or orbiting moon-
et data and would be considered highly reliable. Asteroid 21 Lute-
ia ( D eff ∼ 100 km) has a bulk density of ρ = 3400 ± 300 kgm
−3 es-
imated from the deflection of the Rosetta spacecraft during its
yby ( Patzold et al., 2011 ). Asteroid 22 Kalliope ( D eff ∼ 166 km) has
similar estimate of ρ = 3080 ± 520 kg m
−3 based on the orbital
otion of a moon ( Descamps et al., 2008; Carry, 2012 ). Kalliope
nd Lutetia have radar albedos higher than typical S- or C-class
steroids ( Shepard et al., 2015 ), but not consistent with regolith
onsisting chiefly of Fe-Ni. Their relatively high bulk densities may
herefore be indicative of partial differentiation or modest metal
ontents more consistent with enstatite chondrites ( Patzold et al.,
011; Descamps et al., 2008 ).
The mass of 216 Kleopatra ( D eff ∼ 128 km) is well established
rom the orbital motion of two moons ( Descamps et al., 2011 ),
ut size estimates still vary considerably ( Carry, 2012 ). Carry
2012) gives a bulk density estimate of ρ = 4270 ± 860 kg m
−3 ,
imilar to our estimate for Psyche. Kleopatra is widely regarded as
etallic and has a measured OC radar albedo of 0.6, one of the
ighest measured ( Ostro et al., 20 0 0 ).
v.3. Gravitational properties
Given the final vertex shape model (1148 vertices, 2292 trian-
ular facets), we used the methods described in Richardson and
owling (2014) to compute the combined gravitational and rota-
ional potential, local acceleration, and surface slope experienced
t the center of each facet on the surface, from which the dynamic
levation may be computed relative to other facets. The dynamic
levation h dyn on a small solar-system body was initially defined
y Thomas (1993) as:
dyn =
U local − U mean
a local
, (6)
here U mean is the mean combined (gravitational + rotational) po-
ential over the entire surface of the body, U local is the combined
otential at the center of the polygon in question, and a local is the
ombined acceleration at the center of the polygon in question.
Gravitational potential and acceleration at each polygon were
omputed using the surface-polyhedron gravity technique devel-
ped by Werner (1994) , which takes advantage of Gauss’s Law
pplied to a shape whose surface has been divided into indi-
idual polyhedron elements. This technique has been successfully

396 M.K. Shepard et al. / Icarus 281 (2017) 388–403
Fig. 6. Comparison of Psyche SHAPE model and previous occultations and AO ob-
servations. In all figures, the central cross is the model center-of-mass, the spin axis
is shown by the arrow, the short red peg is the major axis (0 ° lon) and the longer
green peg is the intermediate axis (90 ° lon). (a). Psyche shape model generated for
the date and time of the 2009 AO observation (after Hanus et al. (2013) ). Dotted
line is their AO edge and the solid line is the outline of their light-curve based con-
vex model. Axes are in km. The sub-observer latitude was −7 ° and the viewer is
looking down the major axis. (b). 16 Psyche shape model compared with the 2004
occultation. Although the chord gaps are consistent in size with our model, no ef-
fort was made to correct for possible timing offsets evident in some of them. The
sub-observer latitude was −11 ° and the viewer is looking down the intermediate
axis. ( c ) Psyche shape model compared with the 2010 occultation. The sub-observer
latitude was -51 °. (d) Psyche shape model compared with the 2014 occultation. The
sub-observer latitude was −13 ° and the viewer is looking down the major axis. (For
interpretation of the references to colour in this figure legend, the reader is referred
to the web version of this article.)
Fig. 7. Principal axis views of the Psyche shape model. Axes and body-centered lon-
gitudes refer to the axis facing the viewer. Yellow regions were not visible to the
radar in both 2015 and 2005. (For interpretation of the references to colour in this
figure legend, the reader is referred to the web version of this article.)
Table 4
16 Psyche surface gravitational properties (as-
sumed bulk density ρ = 4500 kg m
−3 ).
Mean surface gravity = −0.144 m/sec 2
Max surface gravity = −0.145 m/sec 2
Min surface gravity = −0.106 m/sec 2
Mean escape velocity = 180 m/sec
Mean surface potential = −16.9 kJ/kg
Potential Std Dev = 0.298 kJ/kg
Topographic Variation = 1 .77%
Mean global elevation = 100 m
Maximum elevation = 8570 m
Minimum elevation = -6390 m
Elevation Std Dev = 2440 m
Mean global slope = 6 .6 °Slope Std Dev = 3 .3 °
a
(
r
c
p
s
a
t
a
o
b
s
u
t
a
l
s
s
a
s
l
(
s
b
b
e
pplied in a number of previous studies, including Richardson et al.
2007) and Richardson and Bowling (2014) .
Assuming a bulk density of ρ = 4500 kgm
−3 ( Section 4.2 ) and a
otation period of 4.1959 h, Fig. 11 shows the shape model of Psy-
he color-coded according to dynamic elevation (left image in each
air) and surface slope (right image in each pair). The normalized
urface distribution for these parameters are shown in Fig. 12 (left
nd middle panels). Statistics for the gravitational surface proper-
ies of this body are listed in Table 4 . Dynamic elevation on the
steroid (with axial dimensions 279 × 232 × 189 km) covers a range
f values from -6.4 km to 8.6 km (a span of 15 km) with the distri-
ution peaked at values between −2.5 and 1.5 km.
Regional surface slopes, on the ∼13 km length scale of the
hape-model’s individual polygon elements, cover a range of val-
es from 0.2 ° to 20.7 ° with a sharply peaked distribution around
he low value of 6.6 °, with all polygon-scale regions of the surface
t slopes less than typical values of the angle-of-repose for geo-
ogic materials (about 30 °–35 °). With the important caveat that the
mall-scale slopes may be systematically reduced as a result of the
hape-fitting penalties ( Section 3.3 ), this suggests the presence of
loose, relatively cohesionless regolith material covering most the
urface of the body, which is capable of gradually flowing downs-
ope in response to such stimuli as impact-induced seismic shaking
Richardson et al., 2004 , 2005 ).
Because body size, shape, and spin properties are, relatively
peaking, easier to determine than mass and density (unless the
ody is part of a multi-component system), we generally use the
ody’s bulk density, ρ , as a free parameter in our surface prop-
rty computations, and either assume a value based upon other

M.K. Shepard et al. / Icarus 281 (2017) 388–403 397
Fig. 8. Comparison of our radar model inversion with the convex model derived
from the inversion of lightcurves ( Kaasalainen et al., 2002; Durech et al., 2011;
Hanus et al., 2013 ). On the left are four representative views of our model as it
rotates at sub-radar longitudes (top to bottom) of 335 ° (run 14), 271 ° (run 4), 178 °(run 18), and 85 ° (run 16). On the right are the DAMIT website predictions for the
same time. The models are shown at the same scale. The spin axis is shown in the
radar shape model with the arrow; the short peg is at body-centered longitude of
0 ° and the longer peg is at 90 °.
m
s
e
c
l
u
s
m
Fig. 9. 16 Psyche shape model seen from above the south-pole. Angles indicate the
body-centered longitudes around the equator at those positions. The dashed line is
the outline of the ellipsoid with the same volume and moment of inertia as the
model (DEEVE), 268 × 229 km (see Table 3 ). There appears to be a mass-deficit be-
tween 0 ° and 90 ° longitude.
t
m
i
a
t
i
i
r
d
v
t
σ
w
U
c
e
t
t
s
c
t
w
t
w
t
5
ρ
S
P
s
t
n
i
t
ethods ( Section 4.2 ), or attempt to find the ’optimum’ bulk den-
ity that corresponds to the most eroded state (lowest elevation
xtremes and lowest slope distribution) for the object, given its
urrent shape and spin state. This equates to a minimization prob-
em, in which there are three measures that can potentially be
sed: total potential variation, dynamic elevation variation, and
urface slopes. In practice, however, we have found that mini-
izing the fractional, combined (gravitational + rotational) poten-
ial variation across the surface of the body is the most efficient
eans for locating the optimum bulk density wherein the body is
n its most eroded state for its current shape and spin. For many
steroids this optimum bulk density will be near to the body’s ac-
ual bulk density ( Richardson and Bowling, 2014 ).
Mathematically, the net potential U i at a given surface element
s the sum of the rotational and gravitational potentials, where U i
s thus a function of bulk density ρ and rotation rate ω. Since the
otation rate is independently constrained, the net potential is re-
uced to having one free parameter ρ . This allows us to define a
ariance which we can search in the bulk density domain to find
he ‘most eroded’ state for the body:
2 norm
( ρ) =
1
N − 1
∑ A i (
U i ( ρ) U o ( ρ)
− 1
)2
∑ A i (7)
here
o =
1
N
∑
A i U i ∑
A i
, (8)
U i is the combined potential of the i -th element, U o is the mean
ombined potential over the entire surface, and we weight each el-
ment in proportion to its surface area A i . In Eq. (7 ), we must also
ake into account a systematic increase in potential variance across
he whole surface as a function of bulk density, in that as the den-
ity of the body increases, the gravitational forces experienced in-
rease uniformly as well. As such, the variance of potentials across
he whole body also increase linearly as a function of density, and
e thus normalize the variance against the mean potential U o such
hat it becomes a fractional or normalized variance parameter, that
e term the ‘topographic variation’ of the body, σ 2 norm
.
For Psyche, with a rotation period of 4.1959 hours, the op-
imum bulk density occurs at a value of ρ = 3200 (2200–
500) kgm
−3 (minimum in right panel of Fig. 12 ), or 71% of the
= 4500 ± 1400 kgm
−3 value determined for the bulk density in
ection 4.2 (dot in right panel of Fig. 12 ). The implication is that
syche currently resides in a slightly slower-than-optimum spin
tate with respect to its shape and bulk density, although dynamic
opography, surface slopes, and erosion rates on the body are still
ear minimum levels. This slightly slower-than-optimum spin state
s evident in the (top row) topography images of Fig. 11 , in that the
wo elongated ends of the body represent (pink-red) topographic

398 M.K. Shepard et al. / Icarus 281 (2017) 388–403
Fig. 10. Illustration of two depressions on Psyche. The topography has been color coded to show the dynamic elevation (see text); values > 0 km are saturated in pink to
emphasize the depressions. The views are centered on the longitude and latitude given at the top of each figure, and these approximate the position of each feature. The left
figure shows the wider and shallower depression (D1); the dashed circle is 67 km wide. The right figure is centered on the smaller but deeper depression (D2); the circle is
53 km in diameter. We assign uncertainties of ± 15 km (approximately one triangular facet) for each diameter estimate.
i
A
o
r
r
m
i
t
(
σ
w
a
1
g
a
r
S
o
t
o
g
r
t
s
r
r
S
ρ
highs, such that the downslope flow of loose regolith will generally
move away from these areas and towards the poles and orthog-
onal longitudes. On an asteroid one or two orders-of-magnitude
smaller than Psyche, this increased erosion on the ends of the
body would gradually shorten it, thus causing an increase in the
body’s rotation rate (to conserve angular momentum) and push-
ing it closer to its “optimum” state with respect to topography,
slopes, and erosion rates. On a body the size of Psyche, however,
it is highly unlikely that this mechanism will occur on a timescale
short enough to have any significant effect. The occasional large
impact will have a much more significant effect on changing the
asteroids shape and moving regolith over the surface in the form
of ejecta ( Richardson and Bowling, 2014 ). Nonetheless, it is notable
that despite this, Psyche is still relatively close to its optimum spin
state for its shape and density.
4.4. Radar albedo, reflectivity, and composition
Using the calibrated echo power spectra from 2005 and 2015,
we estimate Psyche’s mean OC radar albedo to be ˆ σOC = 0.37 ± 0.09.
This is nearly three times higher than the mean MBA S- and
C- class radar albedos of 0.14 ± 0.04 and 0.13 ± 0.05, respectively
( Magri et al., 2007a ), and suggests that the near-surface of Psyche
has a high bulk density, probably as a result of an enrichment in
Fe-Ni. Using our model, we can calculate the radar cross-section of
Psyche at each observation epoch and determine the radar albedo
as a function of longitude ( Fig. 13 ). Although there are gaps, the
plot shows that Psyche’s radar albedo is generally between 0.3 and
0.4. However, at longitudes between 0 ° and 40 ° corresponding to
the mass-deficit region, there is a significant jump in radar albedo
to ∼0.5. There also appears to be a radar albedo minima at the an-
tipode of the bright region, between longitudes of 180 °-230 °. Be-
cause we have corrected for the projected area of Psyche at each
point, these changes are not due to a simple increase or decrease
in the available reflective surface area.
The radar albedo is a relatively blunt assessment of reflectiv-
ty because it does not account for variations in surface structure.
s an example, consider two asteroids of identical material and
verall visible area, but one smooth and spherical and the other
oughened and irregular. Intrinsically, the two have the same radar
eflectivity, but the roughened asteroid will look brighter because
ore energy will be reflected back to the receiver as a result of
ts roughened and/or irregular shape. The relationship between in-
rinsic Fresnel reflectivity, R , and radar albedo, ˆ σOC , is given by
Mitchell et al., 1996 )
ˆ OC = gR (9)
here g ≥ 1 is the gain factor. For the cosine scattering model we
dopted for Psyche, the gain can be estimated from ( Mitchell et al.,
996 )
=
2 ( C + 1 )
2 C + 1
(10)
We found C = 3.5 to work well, giving g = 1.125.
This may be a good approximation to the overall gain of an
steroid, but it is almost certain that gain varies as the asteroid
otates and presents different aspects to the radar. Because the
HAPE software internally calculates the reflectance for each facet
f the model (and thus the overall gain), we allowed it to rescale
he strength of each spectrum separately to estimate a best value
f R for each run.
A plot of R versus longitude is shown in Fig. 14 , and the earlier
lobal pattern in radar reflectivity is still evident: Psyche is more
adar reflective between longitudes 15 ° and 40 °. The decrease at
he antipode is not as dramatic as in the radar albedo plot, but
till suggestive. Psyche’s mean reflectivity is R = 0.32 ± 0.06, with a
ange of R = 0.27 to 0.44.
Ostro et al. (1985) provides an empirical relationship between
adar reflectivity and bulk density (see also the discussion in
hepard et al. (2010) ) given by
= 8330 ( R + 0 . 13 ) (11)

M.K. Shepard et al. / Icarus 281 (2017) 388–403 399
Fig. 11. The shape-model of 16 Psyche color-coded according to dynamic elevation ( left image in each pair ) and surface slope ( right image in each pair ). The top row shows the
two ends of the major, a -axis; the middle row shows the two ends of the intermediate b -axis; and the bottom row shows the two ends of the minor, c -axis (polar views).
The maximum elevation point is located at 353 ° longitude, −4 ° latitude (top left image), while the minimum elevation point is located at 304 °longitude, −52 ° latitude
(depression D2).
Fig. 12. ( left panel ) The normalized distribution of elevations over the surface of the Psyche shape-model, showing a broad peak at between −2.5 km and 1.5 km. ( middle
panel ) The normalized distribution of slopes over the surface of the shape-model, at a resolution of one triangular polygon facet ( ∼13 km). The low slope distribution is
indicative of loose, non-cohesive materials. ( right panel ) Elevation extremes, surface slopes, and surface erosion rates are minimized at an ‘optimum bulk density’ of ρ = 3200
(220 0–550 0) kgm
−3 , or 71% of the ρ = 4500 ± 1400 kgm
−3 value determined in Section 4.2 ( shown as a dot ).
400 M.K. Shepard et al. / Icarus 281 (2017) 388–403
Fig. 13. 16 Psyche OC radar albedo as a function of body-centered longitude from
calibrated continuous wave runs in 2005 and 2015. Error bars show uncertainty in
radar albedo ( ±25%) and the range of rotation during each run ( ±10 °). Two data
points in Table 2 are not shown because of anomalies during data-taking.
Fig. 14. 16 Psyche near-surface Fresnel reflectivity as a function of body-centered
longitude from calibrated echo power spectra in 2005 and 2015. Error bars show
uncertainty in radar reflectivity ( ±25%) and the range of rotation during each run
( ±10 °).
Fig. 15. Dynamic elevation plane-of-sky view of Psyche for the bifurcated echo
power spectrum shown in Fig. 1 (run 5). The view has been rotated in the plane
of sky so that the spin vector points straight upward and into the figure; thus con-
tours of constant Doppler are straight vertical lines, parallel to the projected spin
axis. The power contributing to the twin peaks come from the regions outlined by
dashed rectangles.
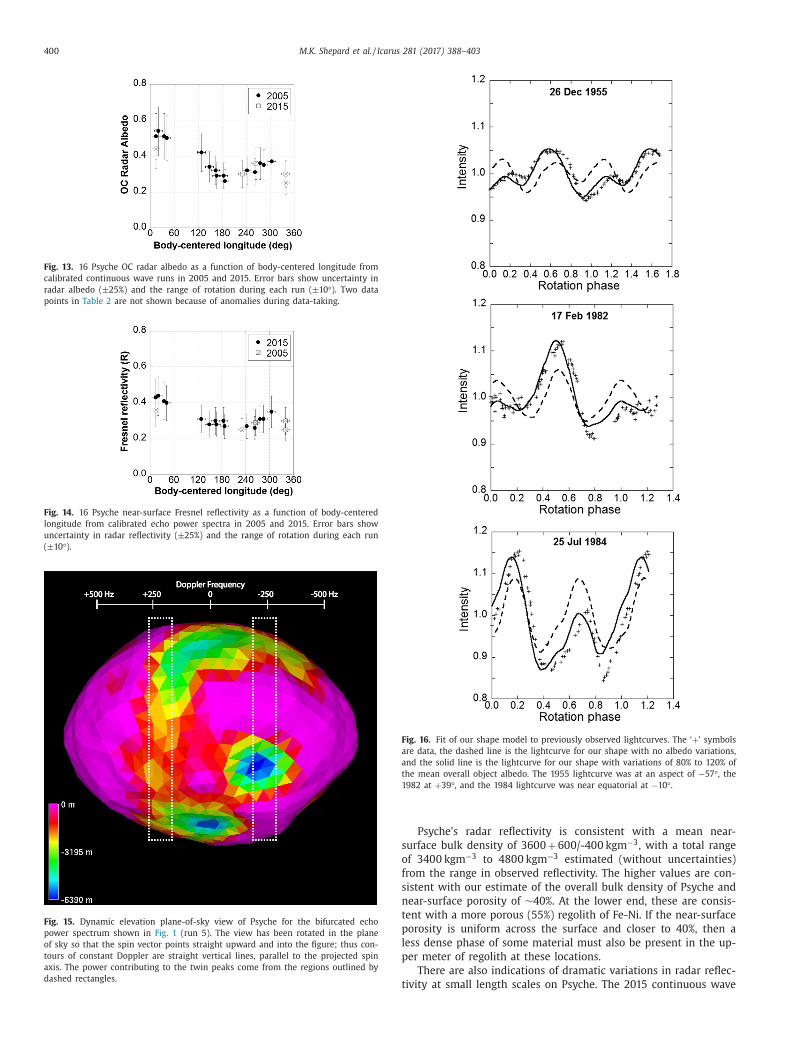
Fig. 16. Fit of our shape model to previously observed lightcurves. The ‘ + ’ symbols
are data, the dashed line is the lightcurve for our shape with no albedo variations,
and the solid line is the lightcurve for our shape with variations of 80% to 120% of
the mean overall object albedo. The 1955 lightcurve was at an aspect of −57 °, the
1982 at + 39 °, and the 1984 lightcurve was near equatorial at −10 °.
s
o
f
s
n
t
p
l
p
t
Psyche’s radar reflectivity is consistent with a mean near-
urface bulk density of 3600 + 600/-400 kgm
−3 , with a total range
f 3400 kgm
−3 to 4800 kgm
−3 estimated (without uncertainties)
rom the range in observed reflectivity. The higher values are con-
istent with our estimate of the overall bulk density of Psyche and
ear-surface porosity of ∼40%. At the lower end, these are consis-
ent with a more porous (55%) regolith of Fe-Ni. If the near-surface
orosity is uniform across the surface and closer to 40%, then a
ess dense phase of some material must also be present in the up-
er meter of regolith at these locations.
There are also indications of dramatic variations in radar reflec-
ivity at small length scales on Psyche. The 2015 continuous wave

M.K. Shepard et al. / Icarus 281 (2017) 388–403 401
Fig. 17. Psyche SHAPE model draped with an albedo map required to fit lightcurves. All lightcurves used relative photometry, and the albedo was allowed to vary from 80%
to 120% from the mean. These images have been stretched to illustrate the deviations: albedos 80% of the mean are black, 120% of the mean are white. Note the darkest
region is coincident with the mass-deficit region, while the brightest region coincides with depression D2. Orientations are the same as Fig. 7.
r
o
S
l
b
m
T
r
a
s
o
p
r
h
t
s
4
2
p
s
w
t
a
d
b
d
t
i
fi
o
s
w
a
a
v
a
t
s
c
j
r
c
m
d
e
c
v
5
m
l
i
o
F
c
s
r
t
m
s
d
r
p
c
s
r
t
y
T
2
r
l
d
p
a
un in Fig. 1 (Run #5, lon 265 °) shows a bifurcated echo, a sign
f two radar bright areas separated by a more modest reflectivity.
imilarly bifurcated echoes appear in the 2005 data at this general
ongitude (2005 runs #4, 9, 13 in our Table 2 , echo power spectra
etween 262 ° and 285 ° in Fig. 4 ). Sometimes bifurcated echoes can
ean a bimodal shape, as with 216 Kleopatra ( Ostro et al., 20 0 0 ).
hat does not appear to be the case here. The geometry for this
un is essentially the same as imaging runs #4, 7, and 17 ( Fig. 3 ),
nd there is no hint of a bimodal shape. However, this echo power
pectrum does include returns from the depression D2 and covers
ne of the two major “troughs” that appear to emanate from de-
ression D1 ( Fig. 15 ).
Other images ( Fig. 2 ) show evidence for a variety of pixel-scale
adar bright and dark spots. Shepard et al. (2015) saw similar be-
avior from another high-radar-albedo M-asteroid, 779 Nina. It is
empting to speculate that these bright spots represent smaller-
cale enrichments in Fe-Ni, but there may be other explanations.
.5. Optical albedo and variations
Given Psyche’s absolute magnitude H = 5.90 ( Tedesco et al.,
002 ) and our effective diameter, we find its visual albedo to be
v = 0.15 ± 0.03. This is typical for the Tholen M-class asteroids.
Kaasalainen et al. (2002) completed the first lightcurve inver-
ion of Psyche to create a convex shape model and noted that there
as good evidence for a spot some 30% brighter than the rest of
he surface. While they noted that they could place the location
nd relative strength of the spot, they declined to include a ren-
ering of the variegation stating that “any rendering would proba-
ly be misleading.” However, with our shape model generated in-
ependently of the lightcurve inversion process, we re-examined
he issue by forward modeling the expected lightcurves and not-
ng where surface albedo variegations had to be added in order to
t the observed lightcurves.
Because nearly all of the lightcurves are relative photometry,
ne must constrain the range of albedo variations allowed on the
urface. At one end – no variation – the lightcurves cannot be fit
ith our shape model ( Fig. 16 ). At the other end – unlimited vari-
tion – the model becomes spotted as any noise is fitted as an
lbedo change. We explored three variations of constrained albedo
ariation from the mean: 90%–110%, 80%–120%, and 70%–130%. Our
nalysis utilized both Hapke and the simpler Lunar-Lambert scat-
ering models ( Hapke, 2012 ) and found little difference in the re-
ults.
Fig. 17 shows the results of the 80%-120% model which was
hosen based on both minimizing the allowed variations and sub-
ective appearance. There are two albedo features that appear to be
eal. The brightest spot on the surface (120% of the mean, p v = 0.18)
oincides with depression D2, while the darkest spot (80% of the
ean, p v = 0.12) coincides with the mass-deficit region. Inverting
ata in this way to identify regions of albedo variation is an inher-
ntly unstable problem and relies heavily upon assumptions and
onstraints; however, all of our solutions appear to match albedo
ariations with these shape features of interest.
. Conclusions and future opportunities
We have convincing evidence that 16 Psyche is the largest
etal-rich asteroid in the main-belt. Our shape model is slightly
arger but generally consistent with a convex model based primar-
ly on lightcurve inversion ( Hanus et al., 2013 ). Mass estimates and
ur model suggest that Psyche has a dense interior consistent with
e-Ni and ∼40% bulk porosity, but we cannot rule out a stony-iron
omposition and little or no macroporosity. The overall bulk den-
ity is similar to the near-surface bulk density estimated from the
adar albedo. Our shape model shows evidence for large-scale fea-
ures not readily evident in convex models, including a deficit of
aterial between 0 ° and 90 ° longitude at the equator, and depres-
ions of ∼50 km and ∼70 km diameter near the south-pole. Our
ata also show evidence of global and small-scale variations in
adar albedo, and by inference, near-surface bulk density – a likely
roxy for Fe-Ni content. The region of highest radar albedo is coin-
ident with the mass-deficit region. Our model also suggests large-
cale variations in visual albedo; it is darkest in the mass-deficit
egion and brightest in the region surrounding the smaller of the
wo depressions.
Psyche repeats this encounter geometry at Arecibo every five
ears, and the next encounters occur in December 2020 and 2025.
here are weaker encounters at 25% of the present SNR in March
017 and 2022. The weaker encounters are 90 ° away from the cur-
ent one and would have sub-radar points in the northern mid-
atitudes. While the anticipated Arecibo SNR is not suitable for
elay-Doppler imaging, continuous wave echo power spectra may
rovide additional information on the shape, pole, and the radar
lbedo of the northern latitudes of Psyche.

402 M.K. Shepard et al. / Icarus 281 (2017) 388–403
G
H
H
H
H
J
K
K
K
L
M
M
M
O
O
O
O
O
P
R
R
R
R
S
S
S
T
Acknowledgments
The Arecibo Observatory is operated by SRI International un-
der a cooperative agreement with the National Science Foun-
dation ( AST-1100968 ), and in alliance with Ana G. Méndez-
Universidad Metropolitana, and the Universities Space Research As-
sociation. The Arecibo Planetary Radar Program is supported by the
National Aeronautics and Space Administration under Grant No.
NNX12AF24G issued through the Near Earth Object Observations
program. We thank the Arecibo operators and staff for their help in
observing. Some of this work was performed at the Jet Propulsion
Laboratory, California Institute of Technology, under contract with
the National Aeronautics and Space Administration. This material
is based in part upon work supported by the National Aeronautics
and Space Administration (NASA) under the Science Mission Direc-
torate Research and Analysis Programs. Some of the data presented
herein were obtained at the W.M. Keck Observatory, which is op-
erated as a scientific partnership among the California Institute of
Technology, the University of California and the National Aeronau-
tics and Space Administration. The Observatory was made possible
by the generous financial support of the W.M. Keck Foundation.
The authors wish to recognize and acknowledge the very signif-
icant cultural role and reverence that the summit of Mauna Kea
has always had within the indigenous Hawaiian community. We
are most fortunate to have the opportunity to conduct observations
from this mountain. This paper also includes data gathered with
the 6.5 m Magellan Telescopes located at Las Campanas Observa-
tory, Chile. Funding for PDS observations, analysis, and publication
was provided by NASA grant NNX13AP56G . Work on the asteroid
lightcurve database (LCDB) was also funded in part by National Sci-
ence Foundation grant AST-1507535 .
References
Baer, J. , Chesley, S.R. , 2008. Astrometric masses of 21 asteroids, and an integrated
asteroid ephemeris. Celest. Mech. Dyn. Astr. 100, 27–42 . Baer, J. , Chesley, S.R. , Matson, R.D. , 2011. Astrometric masses of 26 asteroids and
observations on asteroid porosity. Astron. J. 141, 143 (12 pp) . Bell, J.F. , Davis, D.R. , Hartmann, W.K. , Gaffey, M.J. , 1989. Asteroids: the big picture.
In: Binzel, R.P, Gehrels, T., Matthews, M.S. (Eds.), Asteroids II. Univ. of Arizona,
Tucson, pp. 921–948 . Benner, L.A.M. , Ostro, S.J. , Magri, C. , Nolan, M.C. , Howell, E.S. , Giorgini, J.D. ,
Jurgens, R.F. , Margot, J.L. , Taylor, P.A. , Busch, M.W. , Shepard, M.K. , 2008.Near-Earth asteroid surface roughness depends on compositional class. Icarus
198, 294–304 . Britt, D.T. , Consolmagno, G.J. , 2001. Stony meteorite porosities and densities: a re-
view of the data through 2001. Meteor. Planet. Sci. 38, 1161–1180 .
Carry, B. , 2012. Density of asteroids. Planet. Space Sci. 73, 98–118 . Chapman, C.R. , Salisbury, J.W. , 1973. Comparisons of meteorite and asteroid spectral
reflectivities. Icarus 19, 507–522 . Cloutis, E.A. , Gaffey, M.J. , Smith, D.G.W. , Lambert, R.St.J , 1990. Metal silicate mix-
tures: spectral properties and applications to asteroid taxonomy. J. Geophys. Res.95, 8323–8338 .
Drummond, J.D. , Conrad, A. , Reddy, V. , de Kleer, K. R. , Adamkovics, M. , de Pater, I. ,
Merline, W. J. , Tamblyn, P. , 2016. Asteroid (16) Psyche: Triaxial ellipsoid dimen-sions and rotational pole from Keck II NIRC2 AO images and Keck I OSIRIS
images. 48th Division for Planetary Sciences Meeting, Pasadena, CA. Abstract#325.23 .
Descamps, P. coauthors, 2008. New determination of the size and bulk density of thebinary Asteroid 22 Kalliope from observations of mutual eclipses. Icarus 196,
578–600 .
Descamps, P. coauthors, 2011. Triplicity and physical characteristics of Asteroid (216)Kleopatra. Icarus 211, 1022–1033 .
Durech, J., Sidorin, V., Kaasalainen, M., 2010. DAMIT: a database of asteroid models.Astron. Astrophys 513. doi: 10.1051/0 0 04-6361/20 0912693 .
Durech, J , Kaasalainen, M , Herald, D. , Dunham, D. , Timerson, B. , Hanuš, J. , Frappa, E. ,Talbot, J. , Hayamizu, T. , Warner, B.D. , Pilcher, F. , Galád, A. , 2011. Combining as-
teroid models derived by lightcurve inversion with asteroidal occultation sil-houettes. Icarus 214, 652 .
Elkins-Tanton , coauthors , 2014. Journey to a metal world: concept for a discovery
mission to Psyche. In: 45th LPSC Meeting . The Woodlands, TX2014, Abs. #1253.Fornasier, S. , Clark, B.E. , Dotto, E. , 2011. Spectroscopic survey of X-type asteroids.
Icarus 214, 131–146 . Gaffey, M.J. , 1976. Spectral reflectance characteristics of the meteorite classes. J.
Geophys. Res 81, 905–920 .
affey, M.J. , McCord, T.B. , 1979. Mineralogical and petrological characterizations ofasteroid surface materials. In: Gehrels, T. (Ed.), Asteroids. Univ. of Arizona Press,
Tucson, pp. 688–723 . anus, J. , Marchis, F. , Durech, J. , 2013. Sizes of main-belt asteroids by combin-
ing shape models and Keck adaptive optics observations. Icarus 226, 1045–1057 .
apke, B. , 2012. Theory of Reflectance and Emittance Spectroscopy, second ed. Cam-bridge University Press, Cambridge, UK .
ardersen, P.S. , Gaffey, M.J. , Abell, P.A. , 2005. Near-IR spectral evidence for the pres-
ence of iron-poor orthopyroxenes on the surfaces of six M-type asteroids. Icarus175, 141–158 .
armon, J.K., 2002. Planetary delay-Doppler radar and the long-code method. IEEETrans. Geosci. Remote Sens 40, 904. doi: 10.1109/TGRS.2002.803731 .
ones, T.D. , Lebofsky, L.A. , Lewis, J.S. , Marley, M.S. , 1990. The composition and originof the C, P, and D asteroids: water as a tracer of thermal evolution in the outer
belt. Icarus 88, 172–192 .
aasalainen, M. , Torppa, J. , 2001. Optimization methods for asteroid lightcurve in-version. I. Shape determination. Icarus 153, 24–36 .
Kaasalainen, M. , Torppa, J. , Muinonen, K. , 2001. Optimization methods for asteroidlightcurve inversion. II. The complete inverse problem. Icarus 153, 37–51 .
aasalainen, M. , Torppa, J. , Piironen, J. , 2002. Models of twenty asteroids from pho-tometric data. Icarus 159, 369–395 .
onopliv, A.S. , Asmar, S.W. , Folkner, W.M. , Karatekin, O. , Nunes, D.C. , Smrekar, S.E. ,
Yoder, C.F. , Zuber, M.T. , 2011. Mars high resolution gravity fields from MRO, Marsseasonal gravity, and other dynamical parameters. Icarus 211, 401–428 .
i, J-Y. , McFadden, L.A. , Thomas, P.C. , Mutchler, M.J. , Parker, J.W. , Young, E.F. , Rus-sell, C.T. , Sykes, M.V. , Schmidt, B.E. , 2010. Photometric mapping of Asteroid (4)
Vesta’s southern hemisphere with hubble space telescope. Icarus 208, 238–251 .agri, C. , Nolan, M.C. , Ostro, S.J. , Giorgini, S.J. , 2007a. A radar survey of main–
belt asteroids: arecibo observations of 55 objects during 1999–2003. Icarus 186,
126–151 . agri, C. , Ostro, S.J. , Scheeres, D.J. , Nolan, M.C. , Giorgini, J.D. , Benner, L.A.M. , Mar-
got, J.L. , 2007b. Radar observations and a physical model of Asteroid 1580 Betu-lia. Icarus 186, 152–177 .
Marchis, F. , Kaasalainen, M. , Hom, E.F.Y. , Berthier, J. , Enriquez, J. , Hestroffer, D. , LeMignant, D. , de Pater, I. , 2006. Shape, size and multiplicity of main-belt aster-
oids. I. Keck adaptive optics survey. Icarus 185, 39–63 .
itchell, D.L. , Ostro, S.J. , Hudson, R.S. , Rosema, K.D. , Campbell, D.B. , Velez, R. , Chan-dler, J.F. , Shapiro, I.I. , Giorgini, J.D. , Yeomans, D.K. , 1996. Radar observations of
Asteroids 1 Ceres, 2 Pallas, and 4 vesta. Icarus 124, 113–133 . ckert-Bell, M.E. , Clark, B.E. , Shepard, M.K. , Rivkin, A. , Binzel, R. , Thomas, C.A. , De-
Meo, F.E. , Bus, S.J. , Shah, S. , 2008. Observations of X/M asteroids across multiplewavelengths. Icarus 195, 206–219 .
ckert-Bell, M.E. , Clark, B.E. , Shepard, M.K. , Isaacs, R.A. , Cloutis, E. , Fornasier, S. ,
Bus, S.J. , 2010. The composition of M-type asteroids: synthesis of spectroscopicand radar observations. Icarus 210, 674–692 .
stro, S.J. , Campbell, D.B. , Shapiro, I.I. , 1985. Mainbelt asteroids: dual polarizationradar observations. Science 229, 4 42–4 46 .
stro, S.J. , Hudson, R.S. , Nolan, M.C. , Margot, J-L. , Scheeres, D.J. , Campbell, D.B. , Ma-gri, C. , Giorgini, J.D. , Yeomans, D.K. , 20 0 0. Radar observations of Asteroid 216
Kleopatra. Science 288, 836–839 . stro, S.J. , Hudson, R.S. , Benner, L.A.M. , Giorgini, J.D. , Magri, C. , Margot, J.L. ,
Nolan, M.C. , 2002. Asteroid radar astronomy. In: Bottke, Jr., W.F., Cellino, A.,
Paolicchi, P., Binzel, R.P. (Eds.), Asteroids III. University of Arizona, Tucson,pp. 151–168 .
atzold, M., Andert, T.P., Asmar, S.W., Anderson, J.D., Barriot, J-P., Bird, M.K.,Hausler, B., Hahn, M., Tellmann, S., Sierks, H., Lamy, P., Weiss, B.P., 2011. Asteroid
21 Lutetia: low mass, high density. Science 334. doi: 10.1126/science.1209389 ,491- .
Richardson, J.E. , Melosh, H.J. , Greenberg, R. , 2004. Impact-induced seismic activity
on Asteroid 433 Eros: a surface modification process. Science 306, 1526–1529 . Richardson, J.E. , Melosh, H.J. , Greenberg, R.J. , O’Brien, D.P. , 2005. The global effects
of impact-induced seismic activity on fractured asteroid surface morphology.Icarus 179, 325–349 .
ichardson, J.E. , Melosh, H.J. , Lisse, C.M. , Carcich, B. , 2007. A ballistics analysis ofthe deep impact ejecta plume: determining comet tempel 1 ′ s gravity, mass, and
density. Icarus 190, 357–390 .
ichardson, J.E. , Bowling, T.J. , 2014. Investigating the combined effects of shape, den-sity, and rotation on small body surface slopes and erosion rates. Icarus 234,
53–65 . ivkin, A.S. , Howell, E.S. , Britt, D.T. , Lebofsky, L.A. , Nolan, M.C. , Branston, D.D. , 1995.
3- μm spectrophotometric survey of M and E-class asteroids. Icarus 117, 90–100 .ivkin, A.S. , Howell, E.S. , Lebofsky, L.A. , Clark, B.E. , Britt, D.T. , 20 0 0. The nature of
M-class asteroids from 3-μm observations. Icarus 145, 351–368 .
hepard, M.K. coauthors, 2008. A radar survey of M- and X-class asteroids. Icarus195, 184–205 .
hepard, M.K. , Clark, B.E. , Ockert-Bell, M. , Nolan, M.C. , Howell, E.S. , Magri, C. ,Giorgini, J.D. , Benner, L.A.M , Ostro, S.J. , Harris, A.W. , Warner, B.D. , Stephens, R.D. ,
Mueller, M. , 2010. A radar survey of M- and X-class asteroids II. Summary andsynthesis. Icarus 208, 221–237 .
hepard, M.K. 15 coauthors, 2015. A radar survey of M- and X-class asteroids. III. In-
sights into their composition, hydration state, and structure. Icarus 245, 38–55 . akir, D. , Reddy, V , Sanchez, J. , Shepard, M. , Emery, J. , 2016. Detection of water and
hydroxyl on M-type Asteroid (16) Psyche. Submitted to. Ap. J. . Tedesco, E.F. , Noah, P.V. , Noah, M. , 2002. The supplemental IRAS minor planet sur-
vey. Astron. J 123, 1056–1085 .

M.K. Shepard et al. / Icarus 281 (2017) 388–403 403
T
T
T
V
V
W
Z
holen, D. , 1984. Asteroid Taxonomy from Cluster Analysis of Photometry. Univ. ofArizona, Tucson, p. 150. PhD thesis .
homas, P.C. , 1993. Gravity, tides, and topography on small satellites and asteroids- application to surface features of the Martian satellites. Icarus 105, 326–344 .
imerson, B. coauthors, 2011. Several well observed asteroidal occultations in 2010.Minor Planet Bull. 38, 200–204 .
ernazza, P. , Lamy, P. , Groussin, O. , Hiroi, T. , Jorda, L. , King, P.L. , Izaw, M.R.M. ,Marchis, F. , Birlan, M. , Brunetto, R. , 2011. Asteroid (21) Lutetia as a remnant of
Earth’s precursor planetesimals. Icarus 216, 650–659 .
iateau, B. , 20 0 0. Mass and density of Asteroids (16) Psyche and (121) Hermione.Astron. Astrophys. 354, 725–731 .
erner, R.A. , 1994. The gravitational potential of a homogeneous polyhedron ordon’t cut corners. Celest. Mech. Dyn. Astron. 59, 253–278 .
ielenbach, W., 2011. Mass determination studies of 104 large asteroids. Astron. J.142, 120. doi: 10.1088/0 0 04-6256/142/4/120 , (8pp) .