race, socio-economic status, school level-resources, and
TRANSCRIPT

University of Central Florida University of Central Florida
STARS STARS
Electronic Theses and Dissertations, 2004-2019
2005
Race, Socio-economic Status, School Level-resources, And Race, Socio-economic Status, School Level-resources, And
Parental Influences On Fcat Scores In Florida: A Quantitative Parental Influences On Fcat Scores In Florida: A Quantitative
Study. Study.
Tara King University of Central Florida
Part of the Sociology Commons
Find similar works at: https://stars.library.ucf.edu/etd
University of Central Florida Libraries http://library.ucf.edu
This Masters Thesis (Open Access) is brought to you for free and open access by STARS. It has been accepted for
inclusion in Electronic Theses and Dissertations, 2004-2019 by an authorized administrator of STARS. For more
information, please contact [email protected].
STARS Citation STARS Citation King, Tara, "Race, Socio-economic Status, School Level-resources, And Parental Influences On Fcat Scores In Florida: A Quantitative Study." (2005). Electronic Theses and Dissertations, 2004-2019. 582. https://stars.library.ucf.edu/etd/582

RACE, SOCIO-ECONOMIC STATUS, SCHOOL-LEVEL RESOURCES AND PARENTAL
INFLUENCES ON FCAT SCORES IN FLORIDA: A QUANTITATIVE STUDY.
by
Tara C. King
B.A. University of Central Florida, 2004
A thesis submitted in partial fulfillment of the requirements for the degree of Master of Arts in the Department of Sociology
in the College of Arts and Sciences at the University of Central Florida
Orlando, Florida
Fall term
2005

© 2005 Tara C. King
ii

ABSTRACT
There is an abundance of literature that focuses on the standardized test score difference
between minority and non-minority students. Within this literature, socio-economic factors,
parental influences, and school-level resources have been used to explain the difference in test
scores. The purpose of this study is to identify the variables that are thought to significantly
influence test score achievement. The data come from the Florida Department of Education and
the US Census. Linear regression analyses results are used to examine the relationship between
the independent and the dependent variables. The results showed that overall economic factors
are more closely related to FCAT scores than race. More specifically, the percent of students
receiving free lunch was negatively correlated with FCAT scores.
iii

I would like to dedicate this thesis to my husband Terry and my two children, Chloe and
Patrick. Without the support of Terry, I would not have been able to make it through graduate
school while raising a family. Once again, I will always be thankful for his unwavering support.
To my children, I hope that I have showed you that an education is your open door for the future.
iv
ACKNOWLEDGMENTS
I would like to thank Drs. Jana Jasinski, Ida Cook, and Liz Grauerholz for their guidance
with this research and assistance throughout my graduate studies at the University of Central
Florida. They have provided me with knowledge, support, and encouragement. I especially
thank Dr. Jasinski for taking time out of her busy schedule to guide me in the right direction. It
has been my honor to have her as the Chair of my Committee and as my adviser.
v
TABLE OF CONTENTS
TULIST OF TABLES UT ....................................................................................................................... viii
TULIST OF ACRONYMS/ABBREVIATIONS UT ................................................................................ ix
TUCHAPTER ONE: INTRODUCTION UT............................................................................................. 1
TUCHAPTER TWO: LITERATURE REVIEW UT ................................................................................. 3
TUOrigin of Tests: Historical to Modern-DayUT................................................................................. 3
TUExplanations: Test Performance InequalityUT ............................................................................... 5
TURace and EthnicityUT ...................................................................................................................... 6
TUParental Income and Socio-economic StatusUT .............................................................................. 7
TUParental EducationUT ...................................................................................................................... 9
TUFamily Roles and Parental InvolvementUT ................................................................................... 10
TUSchool-level resourcesUT .............................................................................................................. 11
TUConflict TheoryUT ......................................................................................................................... 13
TUHypothesesUT ................................................................................................................................ 15
TUCHAPTER THREE: METHODOLOGY UT ..................................................................................... 17
TUData Analysis StrategyUT.............................................................................................................. 18
TUUnit of AnalysisUT ........................................................................................................................ 19
TUSample UT....................................................................................................................................... 19
TUIndependent Variables: School Level VariablesUT...................................................................... 21
TURace and Ethnicity- The Percentage of White, Black, Hispanic, and “Other” Students in a
SchoolUT ....................................................................................................................................... 21
TUThe Percentage of Students Receiving Free Lunch in a SchoolUT ............................................... 22
vi
TUSchool-Level Resources: Per Pupil Expenditure, Student/Teacher Ratio, and Teacher
Qualification Within a SchoolUT .................................................................................................. 22
TUIndependent Variables: County Level VariablesUT ...................................................................... 23
TUParental Involvement-PTA Involvement UT .................................................................................. 23
TUEducation- The percentage of the population with a BA degree or higherUT .............................. 24
TUMarital Status-Female Headed HouseholdsUT.............................................................................. 24
TURural/ Urban CountiesUT .............................................................................................................. 25
TUDependent Variables: School Level Variables UT ........................................................................ 25
TUMean Math and Reading FCAT Scores UT .................................................................................... 25
TUCHAPTER FOUR: FINDINGS UT .................................................................................................... 27
TUCHAPTER FIVE: CONCLUSION UT............................................................................................... 39
TULIST OF REFERENCES UT .............................................................................................................. 44
vii

LIST OF TABLES
UTTable 1: Descriptives : Sample characteristics for the Dependent and Independent VariablesT 34
TTable 2: Bivariate Correlations – Independent variables affect on mean math FCAT score and
mean reading FCAT scoreT .................................................................................................... 35
TTable 3: Correlation MatrixT .......................................................................................................... 36
TTable 4: Stepwise Regression: Dependent variable- Mean FCAT reading ScoreT ....................... 37
TTable 5: Stepwise Regression: Dependent variable- Mean FCAT Math ScoreT........................... 38
U
viii

LIST OF ACRONYMS/ABBREVIATIONS
FCAT Florida Comprehensive Aptitude
FLDOE Florida Department of Education
AFQT Air Forces Qualifications Test
NEA National Education Association
PBS Public Broadcasting System
ix
CHAPTER ONE: INTRODUCTION
In the last decade, standardized testing has become a common practice in American
schools used to measure student achievement and proficiency in English, math and science
(Linn , 2000). Standardized tests are administered to students as a means of providing school
administrators with a measure of student achievement. Since large numbers of students
throughout the nation take the same tests, they give educators a standard measurement of
achievement and an indication of how well students are performing according to accountability
plans (US Department of Education).
Furthermore, in addition to providing a measure of student performance, test scores have
become determinants of whether schools receive funding, whether students get promoted to
next grade, or if students are able to graduate. According to Linn (2000), it has been long
contended by educators and researchers that statewide standardized tests are not the best
indicators of scholastic aptitude. The test is often not curriculum driven and may be culturally-
biased because it doesn't take into account that some students have recently immigrated to the
country. Because of these hindrances, students with low test scores may be retained in grade or
forced to attend summer school. There have been proposals to start testing as early as
kindergarten (Bracey, 2000).
On the other hand, for people who are concerned with public education, tests may be a
way to hold teachers and students accountable (Jencks & Phillips, 1998). According to the
National Education Association (NEA), “schools, teachers, and students should all be held to
high standards, and NEA believes that accountability should be shared by schools, education
employees, policymakers, and parents---with the ultimate goal of helping students (pg. 6)”.
1
They believe that standardized tests are an important part of the equation for student achievement
(www.nea.org/accountability/index.html).
However, some literature suggests that racial inequality is evident in standardized test
scores. According to the National Assessment of Educational Progress (NAEP, 2000), the
standardized test scores of Black students have trailed behind White students for the past 30
years in reading, vocabulary, and math. Opponents of testing argue that minorities including
immigrants do not have the same opportunities and access to resources as White students needed
for test achievement (Jencks & Phillips, 1998). For example, in one high school in Miami-Dade
County, Fl, with a student body population comprised of 99% minority students, only 41% of
students passed the 10P
thP grade reading portion of the FCAT. In comparison, in a high school in
Seminole County , Fl, with a student population that is 68% White students, 65% percent of the
students passed the same test in question (HTUwww.Greatschools.ne UTHt, 2000).
The purpose of this paper is to examine how race and ethnicity are related to test score
performance. Secondly, how do additional variables such as student demographics, school-level
resources, and family roles affect standardized test performance, specifically the FCAT. This
paper will attempt to answer the question, “does race have an independent effect on FCAT scores
after controlling for other variables”? More specifically, is race still associated with FCAT scores
after controlling for the effects of student demographics, school-level resources, and family
roles.
2
CHAPTER TWO: LITERATURE REVIEW
This research will look at standardized testing in America, specifically the Florida
Comprehensive Assessment Test (FCAT). Additionally, it will examine the variables that are
thought to influence test performance. These variables include race, income, marital status,
education, school-level resources, parental involvement, and population density. Conflict theory,
used as a theoretical framework, attributes variations in family characteristics, especially unequal
access to educational resources, as determinants of test score inequality. This theoretical
perspective suggests that children from low-income families, a large proportion of whom are
minorities, tend to live in poor areas, go to poor schools, and receive inadequate education, and
that children from wealthy families tend to live in more affluent neighborhoods, go to well
funded schools, and have a greater access to educational resources to obtain a good education
(Dittmer, 2004). Arguably, differences in parental socio-economic status are likely to be
strongly correlated with educational achievement (Rothstein, 2004).
Origin of Tests: Historical to Modern-Day
The educational system has used testing as a tool for assessing student performance and
proficiency in English, math, and science for many years. Historically, tests and the practice of
test giving was commonplace in educational systems in America. According to the Public
Broadcasting System (www.pbs.org/kcet/publicschools/), tests and quizzes were commonly used
3

for assessment as far back as 1870. Often, teachers would use these assessments to measure
proficiency in a subject by conducting an oral stand-up quiz at the end of the school day. In the
1870’s, the first standardized test of major significance was introduced. In fact, in order to
attend high school, students of rural schools were required to pass the Eighth Grade Examination
(www.pbs.org/kcet/publicschools/). This exam was two days long and administered at the
county seat. In modern day educational institutions, students are still tested by informal quizzes
and exams as a way of measuring students’ understanding. In addition to informal quizzes, the
standardized test is another type of test that is commonplace in schools today.
According to Kozol (2000)a, testing can be very useful for teachers as a diagnostic tool in
addition to being used a warning sign for communities to compare their schools with those in
other neighborhoods to identify differences. If communities study these differences sharply
enough then they will usually find a close correlation between family income, per-pupil spending
and educational achievement. Kozol (2000)a argues that some students do not have the
preparation and access to resources that other students have. In other words, there exists a
“searing inequality of public education in our society” (Kozol, 1992). Moreover, the inequalities
persist between mostly urban minority schools and mostly rural/ non-urban White schools. As a
result, educational achievement, specifically test achievement, may be negatively affected by
these differences in resources.
4

Explanations: Test Performance Inequality
A wide range of factors have been suggested to explain racial differences in student
achievement test scores, with an emphasis on students’ family background (Brooks-Gunn,
Kiebanov, & Duncan, 1996). Such explanations can range from ethnicity, income levels, family
status, parental involvement and school-level resources. Kozol (1991) argues inequality in access
to educational resources is largely responsible for the inequality in test score achievement of
students in American schools.
According to Jencks and Phillips (1998), the most common explanations for the test score
gap include genes, the culture of poverty, and single-motherhood. However, these explanations
are hard to reconcile based on the available evidence. In fact, Jencks and Phillips (1998) argue
that there is no existing evidence one way or the other with regard to the gap being innate.
Although they believe that the cultural differences in poverty may account for some of the gap,
they cannot accept this as the main explanation because the gap persists even among affluent
children. Further, they assert that there are no concrete data that support single-motherhood as a
determining factor of poor test performance. To further explore this question, this literature
review will focus on student demographics which include race and ethnicity, income, and
parental education. School-level resource literature will be explored as well as family roles
including parental involvement in parental education. Although, some literature offers cultural
practices and genetics as possible explanations for the test score gap this paper will not focus on
such research.
5

Race and Ethnicity
Race and ethnicity may be correlated with low test scores because of differences in
cultural backgrounds, especially language (Bali & Alvarez, 2004). For example, educational
research has shown Black students are at a disadvantage on the SAT, and Blacks who speak in
Vernacular English do poorly on standardized testing (D’Souza, 1995). Researchers examining
schools in Jacksonville, Florida in 2001, found that there were 41 schools with no passing grades
at all over three years. Furthermore, the student body of these schools was comprised of an
average of 55% Black students (Dittmer, 2001). By comparison, there were 50 schools that
passed once with an average student body population of 47% Black while the 12 schools that
passed twice averaged 26% Black population. Dittmer argued that these students in these
schools are disadvantaged due to language barriers or vernacular English and that these
disadvantages result in fewer students passing. Schools were considered to pass if they meet the
state’s requirements for the school’s mean FCAT score.
Differences between minority and non-minority students may be more complex,
however. Research has suggested, for example, that Asians are not as disadvantaged in
academics as other groups, especially Blacks and Hispanics. According to Goyette and Xie
(1999), minority students, with the exception of Asians, fare worse on the standardized tests than
their White counterparts. They offer a few reasons as to why this may be true. First, they
suggest that Asians often view education as the main vehicle for upward mobility, both social
and economic. Also, parental expectations may be higher among Asian groups. Further, they
assert that compared to Whites, most Asian groups have higher educational expectations. For
example, in their study, 84.8% of Japanese and Korean students expected to graduate from
6

college as opposed to 58.3% of Whites. In the existing literature, Asians do not seem to be as
disadvantaged by standardized testing compared to other minority groups in American schools.
Parental Income and Socio-economic Status
Many researchers contest that a family’s socio-economic status is a strong predictor of
educational achievement and test performance (Wesson, 2000; Gamoran, 2001; Cochran &
Malone, 1995). Parental education and family income is probably the best predictor of eventual
academic outcomes for youth (Kao, Tienda, & Schneider, 1996; Warren, 1996). According to
Wesson (2000),
“High scores have had a high correlation to socioeconomic characteristics such as the
parents' occupation or level of education, the family's income bracket, and the location of
students' elementary and secondary schools (the highly predictable "zip code" factor).
Family income plays such a prominent role in test scores that some testing analysts have
facetiously proposed gauging something they call the "Volvo Effect" as a way to save
vast amounts of money on standardized tests. Simply count the number of Volvos, sport
utility vehicles, and comparably priced luxury cars used to transport students to and from
a given school, and use that figure to measure school quality “(Wesson. 2000 pg. 5).
One of the most important findings of examining the relationship between educational
achievement and socio-economic research comes from the Coleman Report (1966). The
Coleman Report was the first piece of research to focus on more than school inputs by also
focusing on school outputs. It suggests that socio-economic differences accounted for the
variances of test achievement scores between White and minority students. More recently, Glick
7
and White (2003) have asserted that child poverty is an important social problem that is
correlated with a number of developmental and schooling problems, including test achievement.
Others, however, have argued, that income inequality between Whites and Blacks appears to
account for some of the test score gaps, but it is quite small (Jencks & Phillips, 1998). They
suggest even though the number of affluent Black parents has grown significantly since the
1960’s, their children’s test scores still shadow behind those of Whites from equally wealthy
parents. In that case, they assert that poverty plays some role but it is very modest.
Alternatively, Gamoran (2001) reports that children whose families have greater income
and wealth usually have resources available to them that facilitate learning and promote higher
test achievement. These resources include books, computers, a study place, tutors, etc. which
ultimately give wealthier students an advantage over poorer students. Researchers, including
Duncan, Yeung et al., have compared children in families with incomes less than one-half of the
poverty threshold with children in families with incomes between 1.5 to 2.0 times the poverty
threshold, and have found the former to score between 6 and 13 points lower on standardized
tests (Duncan, Yeung, & Brooks-Dunn et al., 1998).
Consistent with Gamoran’s theory, Dittmer (2004) concluded that the percentage of free
lunch, or socio-economic status of student body within a school is the most important variable
for modeling the number of “wins”, or passing test scores a school will have. For instance,
“It is widely acknowledged by test-development experts that higher socioeconomic
backgrounds give students a positive boost in standardized-test achievement. When a test
question asks, "What instrument would you use to look closely at the moon?" children
from poor, inner-city environments may never have seen a telescope in school or at
home. Growing up in an environment in which exposure to certain kinds of information
8
is unlikely, thus, penalizes students on these tests. A child from a high-income suburban
environment, on the other hand, has likely seen and used a telescope in his own home, in
a neighbor's home, or at a planetarium, or has learned about telescopes while watching
the Discovery Channel with Mom and Dad, or through a host of other opportunities
largely unavailable to the child from the lower socioeconomic setting” (Wesson , 2000
pg. 35).
Other researchers have also substantiated this link between higher socio-economic backgrounds
and test achievement (Ellinger, Wright III, & Hirlinger, 1995).
Parental Education
Parental Education is also a strong predictor of test achievement for both Black and
White students alike. US Census data suggests that the divergence in poverty between minority
and immigrant children and native children may be strongly correlated with the divergence in
parental education (Van Hook et al., 2002). Whites tend to have higher educational levels,
career and occupational statuses, and income levels than Blacks, and these advantages benefit
educational outcomes (Gamoran, 2001). Moreover, a study conducted on the Air Forces
Qualifications Test (AFQT) showed that parental education and family resources (access to
newspapers, library cards, and family income, etc.) have a significant positive effect on scores on
the AFQT (Cordero-Guzman, 2001). On the opposite side of the spectrum, not having access to
these resources is hypothesized to have a negative effect on test score achievement (Jencks &
Phillips, 1998).
9
Family Roles and Parental Involvement
As mentioned earlier, research suggests that children in poverty are less likely to
perform well on standardized tests (Dittmer, 2004). To better understand this relationship, some
researchers have studied the relationship between parental marital status and test achievement as
parental marital status is closely tied to poverty (McLanahan & Sandefur, 1994). It is speculated
that single-mother families are more prone to poverty because they have only one potential
income earner and are less likely than married parents to be working full –time. Consequently,
children in single-parent homes are exposed to a shortage of resources and are less likely to reach
educational achievement, more specifically high test score achievement. Below, there is a
detailed explanation of the correlation between parental marital status and parental involvement
as well.
It has been suggested that parental marital status is predictive of parental involvement
and that parental involvement is associated with academic achievement. For example, Jencks
and Phillips (1998) found that Black-White differences in parenting practices contribute to the
test –score gap. Other researchers have also found that family parental and environmental
contributions disadvantage minority students in comparison to Whites students as they age (Bali
& Alvarez, 2004). In fact, “it is known that urban, minority parents tend to display very low
levels of parental involvement (Esposito, 1999). Specific to Florida, it has been reported that
“Parents need to be more involved. In Florida, 55% of 8 P
thP graders are in a school where a lack of
parental involvement is reported to be a problem”. In study after study, researchers have
discovered how important it is for parents to be actively involved in their child’s education
( HTUhttp://www.nea.org/parents/index.html)UTH. According to the NEA, when parents are involved in
their child’s education, they do better in school. Additionally, children go farther in school – and
10
the schools that they attend are better. Furthermore, Strickland (2004) found in her study of
home and school influences on reading achievement among low-income children, that the most
positively correlated variable related to literacy was parental involvement in school activities.
This included things such as PTA participation, volunteerism, and attending school activities.
The family makes important contributions to student achievement all the way through high
school.
School-level resources
In addition to socioeconomic status and parental involvement, research shows that
problems in schools are prevalent in urban, low-income districts and are correlated with
problems in student achievement and socialization. Additionally, children who attend urban
schools in low–income areas consistently demonstrate the lowest academic achievement and the
lowest social skills development (Bernstein, 1992).
One reason for inequality in test scores is that low-income, urban schools do not offer the
same quality of courses that prepare students for successful test performance as their more
affluent suburban counterparts. Predominantly White and wealthy schools offer more high-
ability classes, often more than twice that of low-income schools (Kao & Thompson, 2003).
However, Jencks and Phillips (1998) challenge that data by saying that despite the obvious
economic inequalities between wealthy suburbs and nearby urban cities, the average Black child
and White child attend school districts that spend exactly the same amount per pupil. Other
researchers have argued that “school expenditure does not matter” with regard to test score
achievement (Hanusheck, 1986)
11
Alternatively, Childs and Shakeshaft (1986) found that higher levels of instructional
expenditures in fact increase test scores. The results of Ellinger et al.’s (1995) research also
suggest that per-pupil revenue is the only positively correlated variable that influences tests
results. Moreover, the data show that in 1989-90 an increase of $100 per-pupil funding
generated a 0.4 point increase in the test score average of students. Thus, it is likely that
although higher revenues will produce higher test scores, the availability of funding is limited.
Kozol (2000)b offers an example of low school resources,
“Nearly 30 years ago, as student populations in the New York City public schools began
to turn from ethnic Whites to black and brown, the city started to dismantle its school
libraries. A fiscal crisis in the middle 1970’s provided what appeared to be a neutral
rationale for cutting back the funds that paid for books and for the skilled librarians who,
up until that time, had introduced them to young children. Libraries in many elementary
schools were soon reduced to little more than poorly stocked collections of torn, tired-
looking, or outdated books” ( Kozol b, 2000 pg. 47).
Based upon the literature and the theoretical framework of conflict theory it is
hypothesized that White non- minority students will perform better on standardized tests as a
result of higher socio-economic status, parental education, family roles, parental involvement,
and school level resources. The literature suggests that race is a determining factor for
standardized test performance because non-minority students usually hold a higher socio-
economic status compared to minority students. Naturally, higher incomes are correlated with
the availability of resources such as books, computers, and other learning tools. In other words,
higher socio-economic statuses which are more often held by non -minority students affords
them more access to tools that facilitate the learning process. Parental marital status is another
12
determining factor of test achievement because intact families typically have more resources.
Also, higher levels of parental involvement are critical because they help the student stay
focused in school in order to achieve high test scores. Finally, greater levels of school resources
allow students access to higher quality classes to prepare them for standardized tests. In other
words, a gap in test scores persists between wealthy and poor students because of a difference in
availability of resources.
Conflict Theory
This research will be guided by conflict theory, a theoretical framework brought to the
forefront of social theory by Karl Marx. As a German theorist, Marx viewed society and
organizations, including the educational system, as a system that functions so that each
participant and its group struggle to compete for resources. Within society, individuals and
groups benefit from a particular structure, usually the economic structure, and strive to maintain
its equilibrium. The economic structure in society molds the superstructure, which includes
ideologies, social institutions, the state, and the educational system, the main focus of this paper
(Mark & Engels, 1848). According to conflict theory, dominant social institutions serve to
perpetuate and reproduce the economic class structure. Thus, a constant struggle persists
including competition over valuable resources. The competing groups compete over access to
educational resources and access to knowledge furthering the perpetuation of educational
stratification. In one of Marx’s most studied works, Manifesto of the Communist Party, he said
of struggles, “The history of all hitherto existing society is the history of class struggles”.
13
Using the framework of conflict theory, it is argued that wealthy affluent families have
greater access to resources and educational systems resulting in greater educational attainment.
These resources include access to schools with adequate funding that provide computers,
equipment, text books, and advanced classes for the students. Consequently, the wealthier
children have greater life chances than their less advantaged classmates. Poorer students usually
belong to minority groups. As a result, minority students are less prepared for educational
achievement and economic stability in the future. Therefore, there is an existing gap that persists
between White and minority students. Some scholars would argue that it is because of the
structure of the educational system. According to Hammond (2000), most schools are
organized to prepare less than a quarter of the students for future success in the workplace- those
students are placed early in the educational process into gifted classes, advanced placement
programs, and honors classes. These opportunities are least available to Black, Hispanic, and
Native American students. As a consequence of structural inequality, students from racial and
ethnic backgrounds face continuous barriers to educational equality.
Hammond (2000) asserts that the existing conflict persists between poor schools that
serve considerable numbers of Black students and schools that serve predominantly White
students. The poor schools that serve minorities are less likely than predominantly non-minority
schools to offer advanced curricula that are needed to close the educational attainment gap. In
other words, this conflict is exacerbated by minorities’ lack of access to quality teachers, and
high quality materials. She argues that despite the rhetoric of equality in American schools and
the effects of finance reform, the differences between school expenditures between Whites and
minorities continues to be substantially unequal and disparate.
14
In conclusion, the defining characteristic of any society, from a Marxist view, is
inequality. Some argue that the educational system serves as a battle ground for those who hold
the economic power in society and those fighting to gain power. According to conflict theory,
the educational system is used by those in power as a way to maintain a constant equilibrium
within the economic system while dominating those they wish to keep powerless. It is in the
interests of those who have wealth to keep and extend what they own, whereas it is in the
interests of those who have little or no wealth to try to improve their life chances.
Hypotheses
HO 1: It is hypothesized that there is a positive relationship between mean FCAT reading and
math test scores and:
• Percentage of White students in a school
• Socio-economic status
• Percentage of educated adults in a county
• Parental involvement
• School level resources
HO2: It is hypothesized that there is a negative relationship between mean FCAT reading and
math test scores and:
• Greater percentages of minority students in a school
• Greater percentages of female headed-households within a county
15
• Higher percentages of students receiving free lunch within a school
• Urban county
The purpose of this study is to determine whether race has an independent effect on FCAT
scores after other variables are introduced.
16
CHAPTER THREE: METHODOLOGY
The major purpose of this research is to examine factors that influence student test
performance in Florida, specifically the FCAT test. This research will analyze existing statistics
from varied data sets. More specifically, the variables that are hypothesized to affect test
performance were taken from four separate data sets. The data sets are as follows: US Census
Bureau (2000), County and City Data Book, The Florida Department of Education (FLDOE)
(2005), The Parent Teacher Association of Florida (PTA) (2005), and Greatschools.net (2005), a
non-profit organization that publishes school information on elementary, middle, and high
schools.
The US Census deems itself “the official resource for social, demographic, and
economic statistics in the United States” (www.census.gov). Additionally, The Florida
Department of Education represents 3,231 public schools within the state of Florida. They are the
main information source for the public’s use concerning student statistics, teacher qualifications,
student accountability, teacher certification, scholarships, and the like (www.fdoe.org).
According to the PTA website, the Florida PTA is the largest statewide volunteer organization
working exclusively to better the education of children and youth in Florida. “The organization
was founded in 1921 as a branch of the National PTA, Florida PTA is made up of 1,368 local
units with more than 368,361 Florida members seeking to connect home, school and community
for all school children” (www.floridaspta.org). The data from Greatschools.net is a “free
resource available to everyone”. They declare that GreatSchools.net is the objective resource of
information on elementary, middle and high schools. This group works as a nonprofit
17

organization and provides information about public, private and charter schools in all 50 states.
Additionally, this organization releases complete school profiles for HTUCaliforniaUTH, HTUArizona UTH, HTUTexasUTH,
HTUFloridaUTH, HTUColoradoUTH, HTUNew York UTH, HTUWashingtonUTH, HTUPennsylvaniaUTH and HTUNew JerseyUTH. Greatschools.net
obtains their data for the state from the Florida Department of Education and compiles it into an
all-inclusive source that publicly reports student demographics, teacher qualifications, per pupil
expenditure, and the student /teacher ratio, etc. The data for this study will come from the 2004-
2005 data set.
Data Analysis Strategy
This study will use frequencies, bivariate correlations, and stepwise regression in the
analyses to examine the hypotheses. Frequencies will be used to get an overall understanding of
what the sample looks like. Bivariate correlations will be used to get an understanding of the
relationships between the independent variables and the dependent variables. Additionally, a
correlation matrix will be examined to determine if multicollinearity exists between the
independent variables. Lastly, multiple regression, or stepwise regression will be used to
determine the relationships between the independent variables and the two dependent variables,
mean FCAT scores for reading and math. Stepwise regression allows variables to be added into
models one step at a time. This type of analysis was chosen to examine whether or not the
relationship between race and FCAT scores changes once additional variables are added into the
model. The first step will include only the race variables. The second step will add school-level
resource variables to the model and the third step will include county level variables. The
purpose of stepwise regression is to see how each variable affects the others by adding them into
18
the model step by step. The main purpose is to examine if race is still significant after other
variables are added into the equation.
Unit of Analysis
This research project considered individual high schools within counties/ districts in
Florida as the unit of analysis and includes county-level census data, PTA data reported by
county level , and Florida Department of Education data that corresponds to the particular school
districts.
Sample
There are 67 counties in Florida with a total of 3,231 public schools in the state. For the
purposes of this study, the search was first narrowed to include only high schools, 365 in all,
identified by the Florida Department of Education ( HTUwww.fldoe.org/schoolmap/ UTH). This figure
excludes treatment centers, technical schools, and alternative high schools, because they are not
currently required to administer the FCAT test. This data set was obtained using the FDLOE
website. The FDLOE divides the state of Florida into six regions that include school districts.
19
The sample was selected by first identifying the Florida Department of Education’s six named
regions and then identifying the districts that were encompassed by those regions. From there,
the high schools that exist within those districts were identified. It is important to note that the
districts and counties coincide with each other in Florida.
More specifically, listed below are the counties / districts within each region:
Region 1 includes the following counties/school districts: Escambia, Santa Rosa, Okaloosa,
Walton, Holmes, Washington, and Bay. There are a total of 29 schools.
Region 2 includes: Jackson, Calhoun, Gulf, Gadsden, Liberty, Franklin, Wakulla, Leon,
Jefferson, and Madison. There are a total of 19 schools.
Region 3 includes: Hamilton, Suwannee, Taylor, Lafayette, Dixie, Levy, Gilchrist, Columbia,
Baker, Union, Bradford, Alachua, Marion, Nassau, Duval, St. Johns, Clay, and Putnam. There
are a total of 63 schools.
Region 4 includes: Flagler, Volusia, Lake, Sumter, Seminole, Orange, Brevard, Osceola, Indian
River, Okeechobee, St. Lucie, Martin. There are a total of 74 schools.
Region 5 includes: Palm Beach, Collier, Monroe, Broward, and Miami-Dade. There are a total
of 92 schools.
Region 6 includes: Hernando, Pasco, Polk, Hillsborough, Pinellas, Manatee, Sarasota, Hardee,
Desoto, Charlotte, Lee, Highlands, Glades, and Hendry. There are a total of 88 schools.
Within the six districts, there are a total of 365 high schools which was the population of
schools from which the sample for the analysis was selected. A total of 30% of high schools
from each of those 6 regions, for a sample of 131 schools, was selected for analysis. SPSS was
used to select the sample of schools from each district. The number of schools was rounded up
20
to the nearest whole number. For example, if 30 % of region 1 schools equals 8.7, then it was
rounded to 9 schools.
Independent Variables: School Level Variables
Within those schools and counties, there are numerous characteristics of students and
parents that will be the independent variables and used in the analysis. These variables include
race and ethnicity, the percentage of students receiving free lunch, the percentage of county
with a BA degree or higher, the percentage of county that are female –headed households, and
rural/urban counties, school-level resources: per pupil expenditure, student/teacher ratio, and
teacher qualifications.
Race and Ethnicity- The Percentage of White, Black, Hispanic, and “Other” Students in a
School
The first variable will be race and ethnicity, and will be obtained from the
Greatschools.net website. They report the race and ethnicity of the student body that is
comprised within one school. The data includes 6 categories which consists of the % White, %
Hispanic, % African-American, % Multi-racial, % Asian, and % Native American by school.
The % Multi-racial, the % Asian, and the % Native American were collapsed into one variable
named “Other”. The majority of the “Other” category consisted of Asian students.
21

The Percentage of Students Receiving Free Lunch in a School
Greatschools.net will provide the data needed for the second variable, the percentage of
students that are receiving free or reduced lunch.
School-Level Resources: Per Pupil Expenditure, Student/Teacher Ratio, and Teacher
Qualification Within a School
Thirdly, school-level resources will be taken from the Greatschools.net data set and will
encompass three variables. They will be per pupil expenditure, student/teacher ratio, and teacher
qualifications. They will be measured by using the school expenditure per pupil or monies spent
per student, student /teacher ratio, and teacher qualifications. More specifically, teacher
qualifications will measure the percentage of teachers with an advanced degree defined as a
masters or doctorate degree.
22
Independent Variables: County Level Variables
The analysis includes data from the 2000 county level census that coincides with the
school districts/counties for the 131 high schools randomly chosen
( HTUwww.census.gov/prod/www.ccdb.html UTH). More specifically, these data are made available on the
census website in the Statistical Abstracts of the United States, or national data books that
contain a compilation of statistics concerning social and economic information in the US.
Within these abstracts, data for all counties and cities with a population of more than 25,000
people are published. Additionally, the county level data book was used to obtain needed
information. This county level data was used to identify demographics which include
education, and marital status (family roles) and rural/urban counties that is not made available
from the Florida Department of Education or Greatschools.net website. An explanation of each
measurement will follow.
Parental Involvement-PTA Involvement
Additionally, parental involvement will be measured by Parent-Teacher Organization
(PTA) membership within each region in Florida. The membership data are available via the
PTA website (www. Floridapta.org/membership) by county only. The PTA’s county level data
will be used to determine the membership of parents in the organization to measure parental
involvement. The data are reported by county /district to report the parental membership totals.
This data does not correspond with my unit of analysis, individual high schools. Yet, I will
23

collect this data to measure parental involvement. It is important to note that this particular data
has limitations because it is only available for county level and not school level.
Education- The percentage of the population with a BA degree or higher
Furthermore, the US Census data were accessed as mentioned earlier, to get an overall
understanding of educational attainment of the parents within the counties that coincide with the
schools. Yet, it is important to note that these data have limitations, too, because it is only a
percentage of the population 25 years and older that has a bachelor’s degree or higher in 2000
(www.quickfacts.census/gov). This does not necessarily reflect the percentage of parents with a
college degree but rather an overall understanding of the education levels within a given district.
Nonetheless, it was used to get an overall description of the population within a certain county.
This data will be taken form Table B-5 (named Education, Income, and Poverty) which reports
on education, income, and poverty to measure education levels within a particular county.
Marital Status-Female Headed Households
Also, the Census data will be used to determine the marital status or female-headed
households with their own children within those areas. This was measured by the percentage of
female headed households with their own children within a particular county. Table B-3 (named
24
Group Quarters population and Households) will be used to obtain data on households for
measurement of the proportion of female headed-households with their own children in a
county.
Rural/ Urban Counties
Lastly, the Florida Statute 3.C.1 will be used as an indicator of rural counties which is
defined by the State of Florida as counties that have a population density of less than 100 people
per square mile. Next, the dependent variables will be discussed as well as their measurement.
This data will be taken from Chapter 381.0406 Section 2a Florida Statute 3.C.1, reported by the
State of Florida (HTUwww.doh.state.fl.us UTH).
Dependent Variables: School Level Variables
Mean Math and Reading FCAT Scores
In order to understand how the independent variables affect test performance, mean
FCAT test scores were examined for each school in the sample. The dependent variable will be
the schools’ test scores. These data were taken from the Florida Department of Education
25

website (HTUhttp://fcat.fldoe.org/UTH), which comes directly from The State Report and District Results
Report. From that report, I will use the mean scale score which ranges from 100-500 for each
school chosen for the sample to determine test performance to describe the overall test
performance for each school.
In summary, the variables are derived from school-level and county level data. The
county level variables will be taken from the US Census website (HTUwww.quickfacts.census/govUTH)
and The Parent Teacher Association (PTA) website (www.Floridapta.org/memebership).
Additionally, the school level data will be taken from Greatschools.net, which uses the Florida
Department of Education as the main source of information.
26
CHAPTER FOUR: FINDINGS
First, frequencies (Table 1) were calculated to get an overall understanding of the sample
characteristics. Among the 131 schools chosen for the sample, the mean percent of White
students was 58.5, mean percent Black was 24.1, mean percent Hispanic was 15.9, and the mean
for the “Other” category was 3.2. The ranges for these categories were 1-98, 0-94, 0-93, and 0-9,
respectively. Additionally, the mean percentage of students that receive free or reduced lunch
was 37.62, the percentage of teachers with an advanced degree was 35.85, the mean ratio of
students to teachers was 17.62, and the mean per pupil expenditure was $5,017.30. On a county
level, the mean percentage of people with a BA degree or higher was 16.51, the mean percentage
of female headed-households was 58.36, and the mean PTA membership was 20,133 people. As
far as FCAT scores, the mean math FCAT score was 321, while the mean reading score was 295.
Bivariate correlations (Table 2) were conducted to examine the associations between
the independent variables and the 2 dependent variables. There was a positive relationship
between percent White in a school and math (.393**) and reading (.418**) FCAT scores. The
relationship between percent Black in a school and math and reading scores were significant, but
negative (-.394**) and (-.391**) respectively indicating that as the percent of the student
population included a greater proportion of Black students, the mean FCAT scores were lower.
The percent of students receiving free lunch was negatively correlated with math (-.665*) and
reading (-.705*) FCAT scores. In other words, as the independent variable, percent of students
receiving free lunch increases the mean FCAT score decreases.
These finding are supportive of the theoretical framework, conflict theory, that guides
this research. The resources needed for test achievement are more abundant in the
27

predominantly White non-minority schools. Hence, the higher proportions of White students
equates to higher mean FCAT scores as predicted. In contrast, higher proportions of minority
students within a school are generally associated with lower levels of educational resources
needed for test achievement. Additionally, teacher qualifications were significantly correlated
with math and reading scores with coefficients of (.292**) and (.313**). In other words, schools
in which a greater percentage of teachers held an advanced degree had higher FCAT scores.
Again, higher teacher qualifications are usually present within schools that are populated with
children of higher socio-economic statuses. Also, the county level education rate was
positively correlated with math and reading FCAT scores with coefficients of (.302**) and
(.253**) respectively. This is also consistent with the literature suggesting that parental
education is a strong predictor of children's educational achievement, including standardized test
achievement. It is also consistent with research finding that parental education and family
income is probably the best predictor of eventual academic outcomes for youth (Kao, Tienda, &
Schneider , 1996; Warren, 1996).
Lastly, there was one finding that was contrary to the original hypothesis that female
headed households would be associated with lower test scores. The variable female-headed
households was positively correlated with reading FCAT scores (.211**). Initially this seems
counterintuitive, however, Jencks and Phillips assert that there are no concrete data that support
single-motherhood as a determining factor of poor test performance. Additionally, the data in
this study that were used to measure female-headed household were an indicator of the percent
of female-headed households with own children under 18 and no husband present with a county.
As a result, the data are not directly related to the schools that were used in the analyses. In other
words, the data are not a direct measure of how many students in a school are living in a female-
28
headed household. Secondly, the census uses the definition of female-headed household to
include all children under 18. It may be that there is a difference between the children under 18
in female-headed households and the high school population of students used in the analysis.
There may be a greater percentage of children in these homes below the high school level which
is not representative of the high school population used. Third, the measure defines a female
headed household as having "no husband present" which does not take into account that women
may have a fiancé, long-time boyfriend, or other means of financial assistance. Lastly, these
female- headed households may be headed by women who are financially able to provide for
themselves and their children without a male figure. In sum, this positive correlation may be a
result of limited data, unreliable measures, difference in unit of analyses, or social phenomena
not explored in this research.
Table 3 represents a correlation matrix of the independent variables. The correlation
matrix displayed the interrelationships of several variables with the purpose of finding if any
independent variable is too highly correlated with any other independent variables. Within the
entire matrix, there were 5 correlation coefficients, or Pearson’s R, that were above .50 and
significant. The percent White and the Percent Black was fairly strong but negative (-.653).
Likewise, the percent White was strongly but negatively correlated with the percent Hispanic at
(-.653). Also, the percent White was negatively correlated with the parental involvement
variable, or PTA involvement. The next variable, percent Black, was negatively correlated with
the percent White at (-.653). The percent Hispanic was strongly but negatively correlated with
the percent White at ( -.651) and positively correlated with parental involvement with a Pearson
Correlation of (.526). Rural county status was strongly correlated to the county level education
variable, with a coefficient of (-.615) indicating a negative correlation. Furthermore, the
29

parental involvement variable was correlated with the percent White and the percent Hispanic,
the coefficients were (-.599) and (.526) respectively. The last significant correlation to be
reported in the matrix was between per pupil expenditure and teacher/ student ratio at (-.507). It
is important to note that the tolerance and the VIF (variance-inflation factor) was checked also
and multicollinearity was not present in the analysis. VIF is the simply the reciprocal of
tolerance. The common cut-off criterion for deciding when a variable displays too much
collinearly is 4.00. The tolerance statistics were above .41 which is higher than the .20 which is
used to determine if multicollinearity is present. In addition, all VIF were low, with values of
under 1.4, indicating that multicollinearity was not a problem.
Lastly, Stepwise Regression (Table 4) was used determine the relationships between
the independent variables and the dependent variables by adding three sets of variables in steps.
SPSS allows you to enter variables into a regression in blocks, and it allows stepwise regression.
It allows the researcher to identify the best predictor from several of other possible predictors
(www.spss.com). It allows the researcher to build a custom model depending on the original
hypotheses and purpose of the study. Additionally, this method, stepwise regression, was used to
test the effects of the independent (predictor) variables on a single dependent variable.
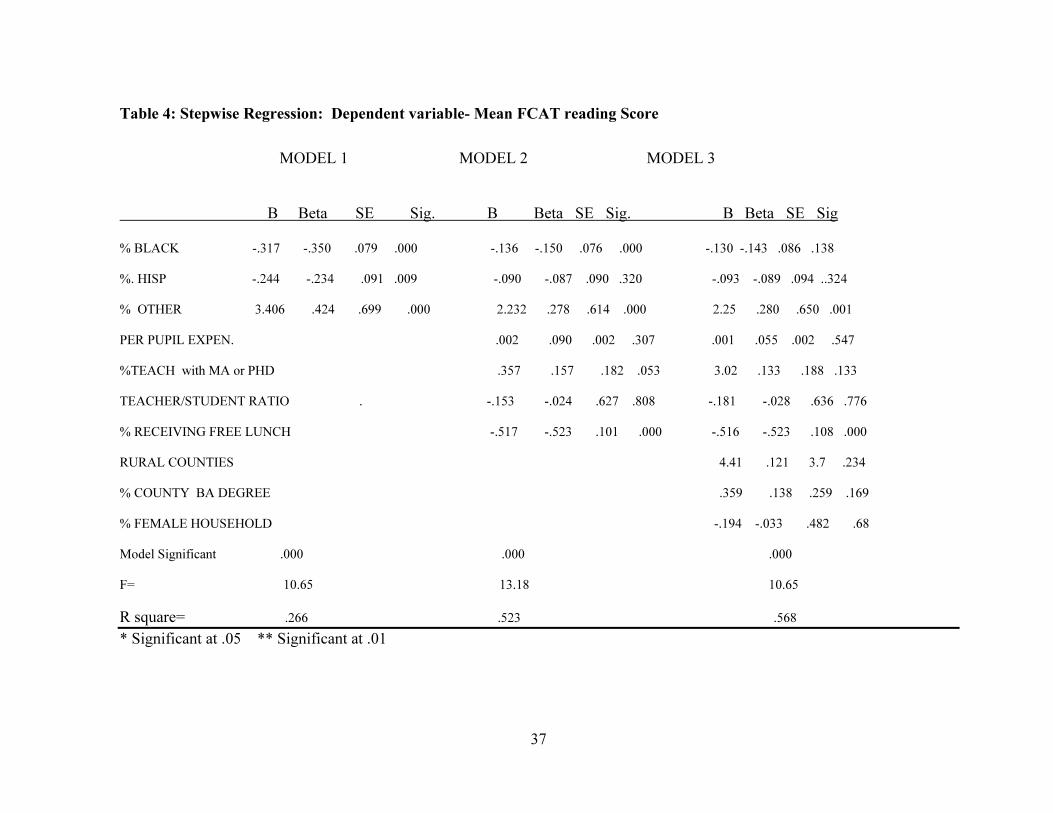
The first model included the dependent variable, mean reading FCAT score, with the
percentage of Black, percentage Hispanic, and the percentage of the “Other” category. The
percentage of White students was the reference category. Each of the race variables were
significant indicating that race is significantly associated with FCAT reading scores. Specifically
as the percentage of Hispanic and Black students increased in a school, the mean FCAT reading
scores decreased. This is substantiates the existing literature reviewed for this study.
Furthermore, as the percent of “Other” students increases so did mean FCAT scores.
30
Model 2 adds in the second set of variables, per pupil expenditure, % teachers with
advanced degrees, student teacher ratio, and % receiving free lunch. The results for this model
show that the percentage of Black and “Other” students remained significant and in the same
direction, after adding the second set of independent variables into the model. However the
percentage of students who are Hispanic did not remain significant when the new variables were
introduced into the model. Among the variables entered in the second step, only percentage of
students who receive free lunch was significantly associated with FCAT reading scores
(p=.000). The relationship was moderate but negative, indicating that as the percentage of free
lunches increase in schools, mean FCAT scores decrease.
Model 3 introduced county level variables into the regression including rural/ urban
status, the percentage of the county with a B.A. degree or higher, the percentage of female-
headed households in the county, and county PTA membership. Two variables remained
significantly associated with FCAT reading scores, the percentage of “Other” students, and the
percentage of students receiving free lunch. The relationship between the percentage of “Other”
students and FCAT reading score was positive indicating that as the percent of “Other”
students increases, so does the mean FCAT score for the school. This finding is consistent with
research suggesting that Asian students, the majority of the “Other” category, are not as
disadvantaged in academics as other groups, especially Blacks and Hispanics (Goyette & Xie,
1999). This may an explanation of why the “Other” variable is positively correlated with FCAT
scores. The relationship between free lunch and FCAT score was negative indicating that as the
percentage of student receiving free lunch decreases the mean FCAT reading score increases.
Surprisingly, county level education was not significant which counters the literature. However,
it may be due to the measurement of the variable.
31
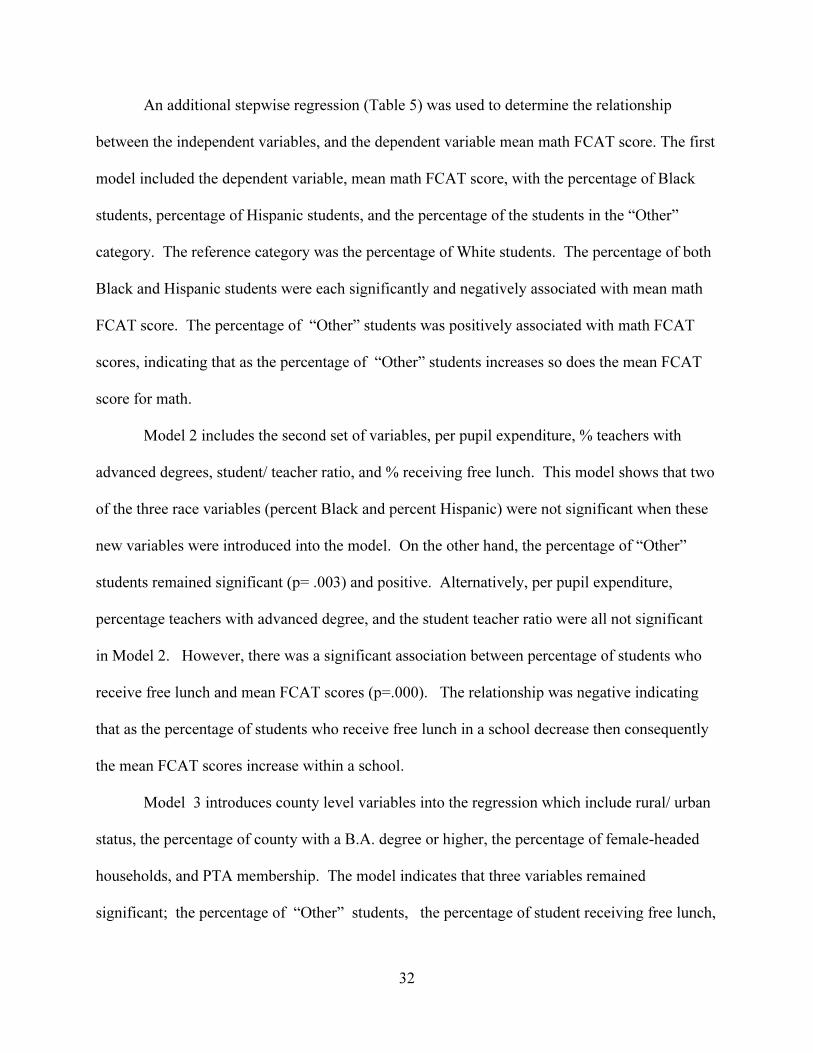
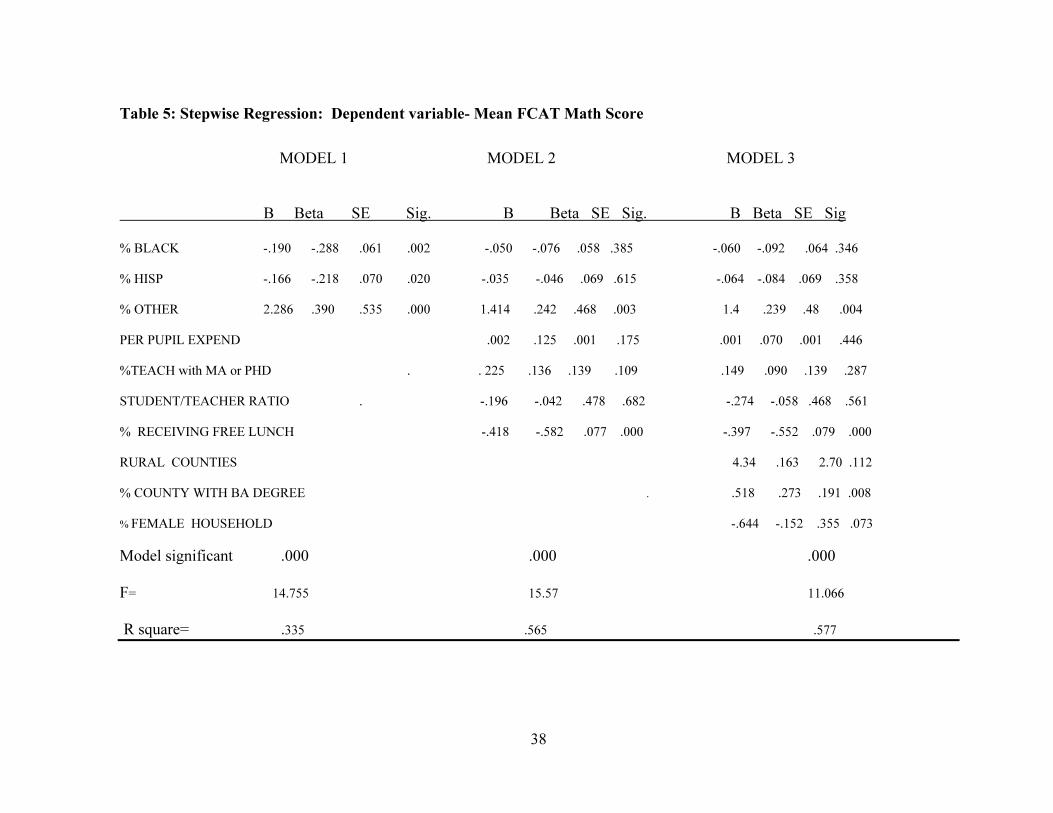
An additional stepwise regression (Table 5) was used to determine the relationship
between the independent variables, and the dependent variable mean math FCAT score. The first
model included the dependent variable, mean math FCAT score, with the percentage of Black
students, percentage of Hispanic students, and the percentage of the students in the “Other”
category. The reference category was the percentage of White students. The percentage of both
Black and Hispanic students were each significantly and negatively associated with mean math
FCAT score. The percentage of “Other” students was positively associated with math FCAT
scores, indicating that as the percentage of “Other” students increases so does the mean FCAT
score for math.
Model 2 includes the second set of variables, per pupil expenditure, % teachers with
advanced degrees, student/ teacher ratio, and % receiving free lunch. This model shows that two
of the three race variables (percent Black and percent Hispanic) were not significant when these
new variables were introduced into the model. On the other hand, the percentage of “Other”
students remained significant (p= .003) and positive. Alternatively, per pupil expenditure,
percentage teachers with advanced degree, and the student teacher ratio were all not significant
in Model 2. However, there was a significant association between percentage of students who
receive free lunch and mean FCAT scores (p=.000). The relationship was negative indicating
that as the percentage of students who receive free lunch in a school decrease then consequently
the mean FCAT scores increase within a school.
Model 3 introduces county level variables into the regression which include rural/ urban
status, the percentage of county with a B.A. degree or higher, the percentage of female-headed
households, and PTA membership. The model indicates that three variables remained
significant; the percentage of “Other” students, the percentage of student receiving free lunch,
32

and the percentage of the county that has a Bachelor’s degree or higher. The relationship
between the percentage of “Other” students and FCAT score is positive indicating that as the
percent of “Other” students increases so does the mean math FCAT score for the school. The
relationship between free lunch and math FCAT score is negative indicating that as the
percentage of students receiving free lunch decreases then the mean FCAT scores increases.
Lastly, the association between the county level education and the mean math FCAT is positive
indicating that as the education level increases within a county so do FCAT scores.
In sum, it is important to note that the two separate regression models for mean reading
and mean math scores are very similar. The only thing that is dissimilar is the county level
education variable which is significant with math scores only.
33

Table 1: Descriptives: Sample characteristics for the Dependent and Independent
Variables
UVariables % Mean Range NU
% WHITE 58.5 1-98 128
% BLACK 24.1 0-94 127
% HISP 15.9 0-93 124
% OTHER 3.2 0-9 97
% RECEIVING FREELUNCH 37.62 2-90 127
%TEACH with MA or PHD 35.85 0-66 128
TEACHER/STUDENT RATIO 17.62 7-23 129
PER PUPIL EXPENDITURE $5017.30 $ 3707-7710 130
% COUNTY WITH A BA DEGREE 16.51 5.20-37.10 130
PTA MEMEBERSHIP 20133 60-56188 100
% FEMALE HEADED HOUSEHOLDS 58.36 48.90-67.30 130
MEAN MATH FCAT SCORE 321 280-352 129
PERCENT PASS MATH FCAT 76.7 251-352 129
MEAN READING FCAT SCORE 295 251-352 129
PERCENT PASS READING FCAT 50.9 21-82 129
PERCENT RURAL 40.8
N= 131
34

35
Table 2: Bivariate Correlations – Independent variables association with mean math and
reading FCAT scores
UVariables Mean Math Score Mean Reading Score % WHITE .393** .418**
% BLACK -.394** -.391**
% HISP -.191* -.235**
% OTHER .264** .380**
% RECEIVING FREELUNCH -.665** -.705**
%TEACH with MA or PHD .292** .313**
TEACHER/STUDENT RATIO .125 .115
PER PUPIL EXPENDITURE -.091 -.114
% COUNTY WITH A BA DEGREE .302* .253**
PTA MEMEBERSHIP -.135 -.105
% FEMALE HEADED HOUSEHOLDS .165 .211*
N=131
• * Significant at .05
• ** Significant at .01

36
Table 3: Correlation Matrix-
1 2 3 4 5 6 7 8 9 10 11 12
1.% white 1 -.65** -.65* -.07* -.47** .01 -.24** .28** .25** -.59** -.02 .28**
2.% Black 1 -.14 .01 .36** -.06 -.04** -.15 .16 -.22* .23** -.09
3. %Hispanic 1 -.02 .28** .09 .36** -.18* -.11 -.52** .16 -.32*
4. % other 1 -.23* .15 .13 -.33** .31** -.19 -.14 .14
5.% free lunch 1 -.28** -.31** .25** -.23** .09 .31** -.15
6.Teach. Qual. 1 .37** -.26** .35** .13 -.11 .08
7.Ratio 1 -.35** .28 .41** -.50** -.24**
8.Rural 1 -.61** -.47** .23** .09
9.Education 1 .14 -.01 .11
10.PTA member. 1 -.18 -.31**
11.Per pupil Exp. 1 .06
12.Female-household. 1
• * Significant at .05
** Significant at .01
37
Table 4: Stepwise Regression: Dependent variable- Mean FCAT reading Score
MODEL 1 MODEL 2 MODEL 3
U B Beta SE Sig. B Beta SE Sig. B Beta SE Sig
% BLACK -.317 -.350 .079 .000 -.136 -.150 .076 .000 -.130 -.143 .086 .138
%. HISP -.244 -.234 .091 .009 -.090 -.087 .090 .320 -.093 -.089 .094 ..324
% OTHER 3.406 .424 .699 .000 2.232 .278 .614 .000 2.25 .280 .650 .001
PER PUPIL EXPEN. .002 .090 .002 .307 .001 .055 .002 .547
%TEACH with MA or PHD .357 .157 .182 .053 3.02 .133 .188 .133
TEACHER/STUDENT RATIO . -.153 -.024 .627 .808 -.181 -.028 .636 .776
% RECEIVING FREE LUNCH -.517 -.523 .101 .000 -.516 -.523 .108 .000
RURAL COUNTIES 4.41 .121 3.7 .234
% COUNTY BA DEGREE .359 .138 .259 .169
% FEMALE HOUSEHOLD -.194 -.033 .482 .68
Model Significant .000 .000 .000
F= 10.65 13.18 10.65
R square= .266 .523 .568
* Significant at .05 ** Significant at .01
38
Table 5: Stepwise Regression: Dependent variable- Mean FCAT Math Score
MODEL 1 MODEL 2 MODEL 3
U B Beta SE Sig. B Beta SE Sig. B Beta SE Sig
% BLACK -.190 -.288 .061 .002 -.050 -.076 .058 .385 -.060 -.092 .064 .346
% HISP -.166 -.218 .070 .020 -.035 -.046 .069 .615 -.064 -.084 .069 .358
% OTHER 2.286 .390 .535 .000 1.414 .242 .468 .003 1.4 .239 .48 .004
PER PUPIL EXPEND .002 .125 .001 .175 .001 .070 .001 .446
%TEACH with MA or PHD . . 225 .136 .139 .109 .149 .090 .139 .287
STUDENT/TEACHER RATIO . -.196 -.042 .478 .682 -.274 -.058 .468 .561
% RECEIVING FREE LUNCH -.418 -.582 .077 .000 -.397 -.552 .079 .000
RURAL COUNTIES 4.34 .163 2.70 .112
% COUNTY WITH BA DEGREE . .518 .273 .191 .008
% FEMALE HOUSEHOLD -.644 -.152 .355 .073
Model significant .000 .000 .000
F= 14.755 15.57 11.066
R square= .335 .565 .577
CHAPTER FIVE: CONCLUSION
This study attempted to examine the relationship between race and standardized test score
achievement. More specifically, this study attempted to determine whether or not observed racial
differences remained after additional variables that could potentially affect FCAT scores for minority
and non-minority students were considered. The main purpose was to understand how race, school-
level resources, and parental influences affect both math and reading FCAT scores in Florida.
There is an abundance of literature that focuses on the standardized test score difference
between minority and non-minority students. Within the existing literature, socio-economic factors,
parental influences, and school-level resources have been used to explain racial differences in test
scores. As discussed earlier, using the theoretical framework of conflict theory, it is hypothesized
that White non- minority students perform better on standardized tests due to higher socio-economic
statuses, parental education, family roles, parental involvement, and school level resources. It has
been argued that race is a determining factor for standardized test performance primarily as a result of
socio-economic status differences. Higher incomes are correlated with the availability of resources
such as books, computers, and other learning tools. As a result of higher socioeconomic status, non-
minority students are afforded greater access to tools that facilitate the learning process. Parental
marital status is another determining factor of test achievement because intact families typically have
more resources. Also, higher levels of parental involvement are critical because they help the
student stay focused in school in order to achieve high test scores. Finally, higher levels of school
resources allow students access to higher quality classes to prepare them for standardized tests. In
39
other words, a gap in test scores persists between wealthy and poor students because of a difference
in availability of resources.
As hypothesized this study found racial differences in FCAT reading and math test scores.
After looking at the characteristics of the schools, the data make it clear that schools with the largest
percentage of Blacks and Hispanics have lower test scores. This is consistent with the literature
concerning standardized test scores. For example, as mentioned previously, according to the National
Assessment of Educational Progress (NAEP), the standardized test scores of Black students have
trailed behind White students for the past 30 years in reading, vocabulary, and math.
In the multiple regression models, when race was the only variable included in the model it
was significant. However, as other variables were introduced into the regression models, the
relationship between race and FCAT scores changed. For example, when considering mean FCAT
reading scores, when per pupil expenditure, teacher qualifications, and student/teacher ratio were
added into the equation, race (Black and Hispanic) did not remain significant. Within the regression
models, the “Other” race variable was the only one to remain significant. Additionally, within that
model, the percentage of students who receive free lunch within a school was most strongly related to
FCAT scores. Additionally, as rural/urban county status, county level education, and female-headed
households were introduced in the last step, the percent of “Other” students stayed significant as
well as percent receiving free lunch. Also, the county-level education variable, measuring the percent
of the population 25 and older with a BA degree or higher, was significant for math FCAT scores.
Race was only significant when introduced by itself, excluding all 8 of the other independent
variables.
As this study used school-level and county level data, the variables as well as the results, that
follow are limited. Hence, usage of actual data showing parental income, parental marital status, and
40
parental education, may have been more accurate. Most importantly, further studies are needed to
fully understand the female-headed household variable in relationship to test score achievement.
Although this study offers some suggestions as to why it is positively correlated with FCAT scores,
more data are needed to understand this phenomenon. This project sought to extend the literature
regarding standardized test scores, particularly the Florida Comprehensive Achievement Test
(FCAT). Although the literature suggests that race and ethnicity may be correlated with low test
scores (Bali & Alvarez, 2004) , the results of this paper did not find a correlation once other relevant
variables were included in the model, with the exception of the “Other “ category. As mentioned, this
may be due to the differences in Asians attitudes toward education, etc. Goyette and Xie (1999)
suggest that Asians often view education as the main vehicle for upward mobility, both social and
economic. Also, they assert that parental expectations may be higher among Asian groups.
However, this study was consistent with Dittmer’s (2004) study concluding that the percentage of
free or reduced lunch within a school is the most important variable for modeling test score
achievement. In the current study, this variable remained significant as all the other variables were
added to the model.
Lastly, this study has added to the literature in this area and added insight into standardized
test score achievement. The results of this study suggests that economic factors are more relevant to
test scores than race and that county education levels are also correlated with test score achievements.
This is supportive of the guiding theoretical framework that suggests that there is a constant battle for
resources, mainly economic resources. In conclusion, future research in this area may be needed to
understand how economic and education factors impact FCAT scores when other variables are
controlled for. Perhaps is would be advantageous to exclude race from all analysis and focus on
socio-economic factors solely and focus on economic structures.
41

Furthermore, the findings of this study may present implications for educational policy reform
that impacts standardized tests score practices in American schools. These findings suggest that race
and ethnicity are not directly related to test score achievement so immigrants and students who speak
another language will not receive additional preparation for the FCAT. Additionally, the variable
most associated with test score achievement, the percent of students receiving free lunch, is
considered an economic issue. If the history of American society is a predictor of the future, the gap
between the wealthy and the poor will continue to persist and even strengthen. This is not good news
for the educational system in America that works as systems to keep this dynamic in motion. This
has implications for lower income students who come from economically challenged areas.
According to the framework of conflict theory, within society, individuals and groups benefit from a
particular structure, usually the economic structure, and strive to maintain its equilibrium. The
economic structure in society molds the superstructure, which includes ideologies, social institutions,
the state, and the educational system. According to conflict theory, dominant social institutions serve
to perpetuate and reproduce the economic class structure. Thus, a constant struggle persists including
competition over valuable resources. The competing groups struggle to gain access of educational
resources and access to knowledge furthering the perpetuation of educational stratification. This
conflict over resources can be clearly seen in the results of this study.
In effect, the percent of free lunch in a school may be indicative of how well the school is
funded, how well the school prepares the students for testing, the number of advanced classes
offered, the teacher qualifications, and student /teacher ratio, etc. which ultimately predicts FCAT
success or failure. As mentioned above, the FCAT test score gap is in fact an economic battle
between the haves and the have nots, the wealthy and the poor, the high income students and low
income students, the powerful and the powerless; a constant struggle. In sum, using the theoretical
42

framework of conflict theory, according to this study, White non- minority students perform better on
standardized tests due to higher socio-economic status which affords higher quality educational
experiences and increased life chances.
43

LIST OF REFERENCES
Bali, V., Alvarez, M. (2004). The race gap in student achievement scores: Longitudinal evidence
from a racially diverse school district. Policy Studies Journal 32 (3) 359-350.
Bernstein, L. (1992). Where is reform taking place? An analysis of policy changes and school
climate. Journal of Teacher Education 14 (3) 297-302.
Bracey, G. (2000). A short guide to standardized testing. Phi Delta Kappa Fastbacks 459, pgs. 7-52.
Brooks-Gunn, J., Klebanov, P., and Duncan, G. (1996) Ethnic differences in children’s intelligence
tests scores: Roles of economic deprivation, home environment, and maternal characteristics.
Child Development 65 pgs. 346-360.
Childs, T.S., Shakeshaft, C. (1986) A meta-analysis of research on the relationship between
educational expenditures and student achievement. Journal of Educational Finance 12
pgs. 249-263.
Cochran, C.L., Malone, E.F. (1995). Equality and achievement in education. Boulder: Westview
Press.
Coleman, J. (1961). The adolescent society: The social life of the teenager and its impact on
education. New York.
Cordero-Guzman, H. (2001). Cognitive skills, test scores, and social stratification : The role of
family and school-level resources on racial/ethnic differences in scores on standardized tests
(AFQT). The Review of Black Political Economy 28 (43) 1-57.
Dittmer, J. (2004). Assessing school assessment: A case study of the geographic implications of the
A+ plan in Jacksonville, Fl. Southeastern Geographer 44 (2) 170-185.
44

D’Souza, D. (1995). The end of racism: Principles for a multicultural society. New York, NY: The
Free Press.
Duncan, G, Yeung, W., Brooks-Gunn, J et al. (1998). How much does childhood poverty affect the
life chances of children? American Sociological Review 63 (3) 406-423.
Ellinger, K., Wright, D., Hirlinger, M. (1995). Brains for bucks? School revenue and student
achievement in Oklahoma. The Social Science Journal 32 (3) 299-308.
Esposito, M. (1999). Learning in Urban Blight: School climate and its effects on the school
performance of urban, minority, low income children. School Psychology Review 28 (3) 1-
16.
Gamoran, A. (2001). American schooling and educational inequality: A Forecast for the 21P
stP
century. Sociology of Education. Pgs. 135-53.
Glick, J. E., White, M.J. (2003). The academic trajectories of immigrant youths. Demography 40,
759-784.
Goyette, K., Xie, T. (1999). Educational expectations of Asian youths: Determinants and ethnic
differences. Sociology of Education 72 (1) 22-36.
Hammond, L. (2000). The school reform movement and the education of African American Youth:
A retrospective update. 69 (4) 263-287.
Hanushecks, E. (1996). Improving American schools: The role of incentives. National Academic
Press pg. 268.
Jencks, C., Phillips, M. (1998). America’s next achievement test: Closing the black white test
score gap. American Prospect 9 (40) 44-53.
Kao, G., Thompson, J. (2003). Racial and ethnic stratification in educational achievement and
attainment. Annual Review of Sociology 29 (26) 417-425.
45
Kao, G., Tienda, M., and Schneider, B. (1996) Racial and ethnic variation in educational
achievement. Res. Sociol. Educ.Social. 11, 263-97.
Kozol, J. (1991). Rich child, poor child. Electronic Learning Journal v10, pg. 56
Kozol, J. (1992). Savage Inequalities: Children in American schools. New York, NY: Harper
Perennial.
Kozol, J. (2000)a. A conversation with Kozol. School Administrator 57 (10), 16.
TKozolTT, J. (2000)b. An unequal education: TTUnder endowed school libraries in the South Bronx. T
TSchool Library Journal TT46 (5)TT 46-9. T
Linn, R. (2000). Testing and accountability. Educational Researcher pgs. 4-15.
Marx, K., Engels, F. (1848). Manifesto of the Communist Party. London: Oxford University Press.
McLanahan, S., Sandefur, G. (1994). Growing up with a single parent: What hurts, what helps.
Cambridge, MA: Harvard University Press.
Racial Disputes in Minnesota Basic Standards Test Scores 1996-2000. Roy Wilkens Center for
Human Relations and Social Justice. Hubert H. Humphrey Institute of Public Affairs.
University of Minnesota. (www.scimathmn.org/keyfind.pdf)
Rothstein, R. (2004). A wider lens on the Black-White achievement gap. Phi Delta Kappa 86 (2)
104-110.
Strickland, D. (2004). The role of literacy in early childhood and education. The Reading Teacher
58 (1) 86-88.
Van Hook, J., Brown, S., Kwenda, M. (2002). A decomposition of trends in poverty among children
of immigrants. Demography 41 (4) 649-70.
Warren, J.R. (1996). Educational inequality among white and Mexican-origin adolescents in the
46
American Southwest. Sociological Education 69 pgs.142-58.
Wesson, K. (2000). The Volvo effect: And other thoughts on schools and standardized testing.
Education Week 20 (12) 34-36.
Florida Department of Education. The State Report and District Results Report. Retrieved on
November 14, 2005 from HTUhttp://www.fldoe.org/websiteUTH.
Florida Department of Health. Chapter 381.0406 section 2a Florida Statue 3.C.1. Retrieved
November 14, 2005, from HTUwww.doh.state.fl.usUTH.
Florida Department of Education (FLDOE). Assessment and Performance: Scores, Reports, and
Searchable FCAT Database. Retrieved on November 19, 2005, from http://www.fldoe.org.
Florida Parent Teacher Association (PTA). Parental Involvement Facts. Retrieved on November 20,
2005, from http://www.Floridapta.org/membership.
GreatSchools.net. School Overview. Basic School Information. Retrieved on November 20,2005,
from HTUhttp://www.greatschools.netUTH.
National Education Association (NEA). Parents and Community: Guide to testing at your child’s
School. NEA accountability systems. Retrieved on November 14, 2005, from
HTUhttp://www.nea.org/parents/index.htmlUTH.
National Association of Education Progress. (NAEP) Digest of Education: Statistics tables and
Figures. (1995). Retrieved November 14, 2005 from
http://nces.ed.gov/programs/digest/d95/dtab125.asp.
Public Broadcasting System. Evolving Classrooms: Testing. Retrieved on November 14, 2005, from
47
http://www.pbs.org/kcet/publicschools/.
US Census: Table B-5 named Education, Income, and Poverty. Retrieved on November 14, 2005,
from HTUwww.quickfacts.census/govUTH.
US Census: Table B-3 named Group Quarters population and Household. Retrieved on November
14, 2005, from HTUwww.quickfacts.census/govUTH
48