search.jsp?r=19920009200 2019-08-31t16:30:14+00:00z · was sampled by an escort-d data acquisition...
TRANSCRIPT

https://ntrs.nasa.gov/search.jsp?R=19920009200 2020-01-01T20:33:59+00:00Z

SELF-PRESSURIZATION OF A FLIGHTWEIGHT LIQUID HYDROGEN TANK: EFFECTS OF FILL LEVEL AT LOW WALL HEAT FXUX
N. T. Van Drew* National Aeronautics and Space Administration
Lewis Research Center Cleveland, Ohio 44135
C. S. Lin* Analex Corporation
Brook Park, Ohio 44142
M. M. Hasan* National Aeronautics and Space Administration
Lewis Research Center Cleveland, Ohio 44135
Abstract
Experimental results are presented for the self- pressurization and thermal stratification of a 4.89 m3 liquid hydrogen storage tank subjected to low heat flux (2.0 and 3.5 W/m2) in normal gravity. The test tank was representative of future spacecraft tankage, having a low mass-to-volume ratio and high performance multi-layer thermal insulation. Tests were performed at fill levels of 29 and 49 percent (by volume) and complement previous tests at 83 percent fill. As the heat flux increases, the pressure rise rate at each fill level exceeds the homogenous rate by an increasing ratio. In the present work, this ratio did not exceed a value of 2. The slowest pressure rise rate was observed for the 49 percent fill level at both heat fluxes. This result is attributed to the oblate spheroidal tank geometry which introduces the variables of wetted wall area, liquid-vapor interfacial area, and ratio of side wall-to-bottom heating as a function of fill level or liquid depth. Initial tank thermal conditions were found to affect the initial pressure rise rate. Quasi-steady pressure rise rates are independent of starcing conditions.
A ami C specifk heat capacity E enor M total mass m segment mass P tank pressure
Q 9 T t U
v 0 P
U
heating rate heat flux temperature time total internal energy specific internal energy volume heat input fraction density
Subscripts:
eb
L mb
hSP
V W wet 1 2
energy balance homogeneous self-pressurization liquid mass balance vapor wall wetted wall initial state final state
Liquid hydrogen &H2) is the propellant of choice for future interplanetary space flight utilizing either chemical or nuclear thermal propulsion. For well-insulated cryogenic storage systems, the space thermal environment can result in heat leak rates of less than 5 Wlm2. These heat leaks, although low, result in the inevitable pressurization of closed storage systems. Test data from
*member, AIAA 1

large scale LH2 tankage at the expected level of heat flux is scarce. Most available data for LH2 self-pressurization and stratification was obtained at higher wall heat fluxes under nucleate boiling conditions and is of limited usefulness for design of long term storage systems.
An experiment1 with a large spherical LH2 tank (208 m3) subjected to a heat flux of 1.9 W/m2 resulted in a pressure rise rate of 3.6 kPa/hr, a rate more than 10 times the corresponding homogeneous rate for an isothermal system. The increased rate of pressure rise results from the development of a warm liquid layer at the free surface due to buoyancy effects. Free convection in the liquid was greatly enhanced by the large tank size and high fill level. Existence of the warm liquid layer was experimentally verified by temperature measurements.
In previous experiments2 with a 4.89 m3 LH2 storage tank filled to 83 percent (by volume), it was found that a low heat flux (0.35 W/mz) produced a pressure rise rate slightly above the homogeneous value. At higher heat fluxes of 2.0 and 3.5 W/rn2, the pressure rise rate was greater than the homogeneous rate by a factor of two or three. Also, the starting conditions (either isothermal ullage or steady boil-off rate) had a significant impact on the transient initial pressure rise rate. Following the initial transient, quasi-steady pressure rise rates are independent of the starting condition. Initial transient pressure rise rates greatly exceed quasi-steady values regardless of the starting conditions.
Experimental results are presented herein for the same 4.89 m3 tank at fill levels of 29 and 49 percent and heat fluxes of 2.0 and 3.5 W/mZ under normal gravity conditions. This range of heat fluxes is typical of values expected in future space missions. The flightweight LH2 tank was representative of spacecraft tankage, having a low mass-to-volume ratio and high performance multi- layer thermal insulation.
Exwrimental Apparatus
Tests were conducted in a 7.6 m diameter vacuum chamber. A 4.0 m diameter cylindrical cryoshroud encloses the test tank. The shroud may be cooled with liquid nitrogen or heated above ambient temperature with electrical resistance heating to obtain the desired tank wall heat flux. Vacuum chamber pressures on the order of 1 0 4 Pa are obtainable. The tank is suspended by fiberglass composite struts and all instrumentation lines and most fluid flow lines are routed through a LH2 cold guard to minimize conductive heat transfer to the test article. The tank is constructed of chemical-milled 2219
aluminum and insulated with 2 blankets of multi-layer insulation, each comprised of 17 layers of double aluminized Mylar separated by silk netting. It is approximately an ellipsoidal volume of revolution having a major-to-minor axis ratio of 1.2, a major diameter of 2.2 m, a volume of 4.89 m3, and an internal surface area of 14.0 m2. The tank mass is 149 kg. Most of the wall is 2.08 mm thick except for the bolted flange and lid at the top, lands for support lugs, and a thickened equatorial region. The tank insulation system, size, and lightweight construction (except for the lid) are representative of the type of system that may be used in future orbital transfer vehicles.
Locations of various sensors in the test tank are shown schematically in Fig. 1. Liquid fill level is measured by a capacitance probe. Liquid and vapor temperatures in the tank are measured by silicon diode transducers, and the external wall temperature distribution is measured by a number of wall-mounted silicon diode transducers. Tank
@ lnlernal temperature sensors + External wall Iemperature sensors
Figure 1. - Tank Instrumentation.
pressure is measured by pressure transducers located in the vent line. Boil-off flow is measured by thermal dispersion type gas flow meters in the vent line. Liquid-vapor temperature measurements are accurate to k 0.3 K, while wall temperatures are accurate to rt 0.6 K. An in situ calibration increases the accuracy of liquid-vapor temperature measurements to rf: 0.1 K by adjusting the individual sensor readings to known saturation conditions. Tank pressure measurements are accurate to rt 0.01 kPa. Capacitance probe readings are accurate to rt 1.9 cm,
2

translating to a maximum error of f 1.5 percent fill at the 50 percent fill level (by volume). Boil-off flow measurements are accurate to f 0.030 and f 0.089 standard m 3 h (SCMH) for the 2.83 and 8.49 SCMH meters, respectively. Analog data from instrumentation was sampled by an ESCORT-D data acquisition system.
Boil-off tests precede the self-pressurization tests for the purposes of conditioning the tank and insulation system and for determination of the total heat leak rate into the tank. The tank vent pressure is initially above the operating pressure of the b a c w u r e control system and the tank is filled with LH2 to 95 percent fill to cool the tank top section until wall-mounted sensors indicate temperatures within 0.5 K of the saturation tempemture at the tank vent pressure. The vent pressure is then slowly deereased to the operating pressure of the backpressure control system (117 kPa for boil-off tests). The boil-off rate is monitored until steady conditions (less than 5 percent variation over 4 hr) are obtained for boil-off flowrate and fluid, w&, and insulation temperatures. The average wall heat flux values of 2.0 and 3.5 W/m2 were obtained from shroud operating temperatures of 294 and 350 K, respectively3. After steady conditions are obtained, the tank is prepared for the first of the self-pressurization tests.
The tank vent valves are closed at the conclusion of the previous test (boil-off or self-pressurization) and the tank is slowly drained to a level slightly above the desired fill level. Next, the tanPC pressure is reduced to atmospheric pressure (103 kPa) by venting which induces substantial bulk boiling of the fluid that initially producesnearly isothermal conditions in the tank. Normally, the tests are performed using a steady boil-off state as the starting condition. For a steady boil-off starting condition, tank venting is maintained until the liquid surface-to-tank lid temperature gradient and boil-off rate stabilize (a wait of 4 hr or more). After uniform boil-off and steady wall temperaw are obtained, the vent is closed to initiate the self-pressurization process. An additional test was performed with an isothermal starting condition. This test is initiated shortly after tank pressure is reduced to atmospheric pressure by venting. As soon as the tank lid temperature reaches its minimum value (approximately 23 K), the test is begun by closing the vent line valves. Data is sampled at 112 hr intervals during experiments.
Results and D iscussioq
Pressure rise measurements at fill levels of 29,49, and 83 percent with heat flux equal to 2.0 and 3.5 W/m2 are
shown in Fig. 2. The data shown were obtained with a steady boil-off starting condition. It is noted that each test is characterized by an initial transient response followed by a period of quasi-stcady pressure rise rate. As will be shown later, the transient period is characterized by rapid changes in the vapor and unwetted wall temperatures. Also shown are the corresponding tank pressure histories calculated from the homogeneous pressure rise equation4:
The homogeneous model assumes a uniform saturated two-phase fluid mixture and in each case gives a slower 2201 200
!5 d L.
%
0 5 i o is 20 Time, hr
(a) q = 2.0 Wlm2
0 5 10 15 Time, hr
(b) q = 3.5 Wlm2
Figure 2. - Effect of Fill Level on Pressure Rise Rate. Steady Boil-Off Starting Condition.
(Data for 83 Percent Fill from Hasan, et al2)
3
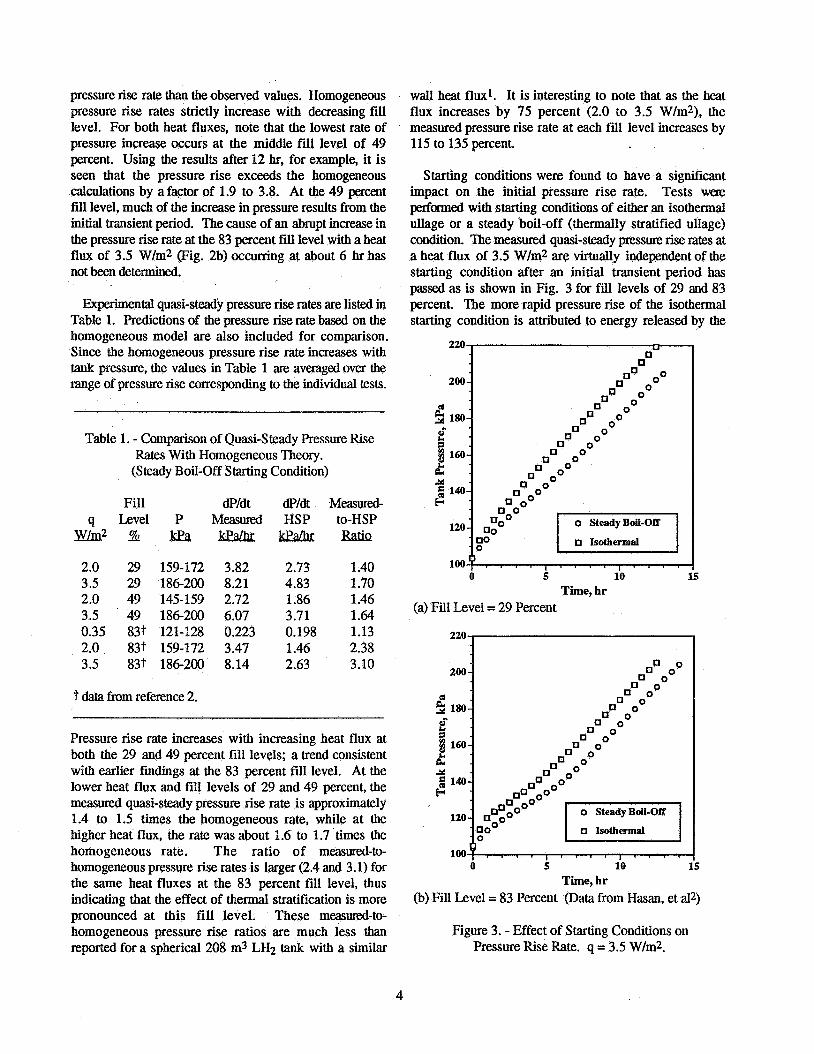
pressure rise rate than the observed values. Homogeneous pressure rise rates strictly increase with decreasing fill level. For both heat fluxes, note that the lowest rate of pressure increase occurs at the middle fill level of 49 percent. Using the results after 12 hr, for example, it is seen that the pressure rise exceeds the homogeneous calculations by afactor of 1.9 to 3.8. At the 49 percent fill level, much of the increase in pressure results from the initial transient period. The cause of an abrupt increase in the pressure rise rate at the 83 percent fill level with a heat flux of 3.5 WIm2 (Fig. 2b) occurring at about 6 hr has not been determined.
Experimental quasi-steady pressure rise rates are listed in Table 1. Predictions of the pressure rise rate based on the homogeneous model are also included for comparison. Since (he homogeneous pressure rise rate increases with tank pressure, the values in Table 1 are avemgedover the m g e of pressure rise corresponding to the individual tests.
Table 1. - Comparison of Quasi-Steady Pressure Rise Rates With Homogeneous Theory.
(Steady Boil-Off Starting Condition)
Fill dP/dt dP/dt M e a s d - q Level P MeasumI HSP to-HSP
m 2 % kEa kE#!kkPa/hr Iw’iQ
2.0 29 159-172 3.82 2.73 1.40 3.5 29 186-200 8.21 4.83 1.70 2.0 49 145-159 2.72 1.86 1.46 3.5 49 186-200 6.07 3.71 1.64 0.35 83t 121-128 0.223 0.198 1.13 2.0 83t 159-172 3.47 1.46 2.38 3.5 83t 186-200 8.14 2.63 3.10
t data from reference 2.
Pressure rise rate increases with increasing heat flux at both the 29 and 49 percent fill levels; a trend consistent with earlier findings at the 83 percent fill level. At the lower heat flux and fill levels of 29 and 49 percent, the measured quasi-steady pressure rise rate is approximately 1.4 to 1.5 times the homogeneous rate, while at the higher heat flux, the rate was about 1.6 to 1.7 times the homogeneous rate. The ratio of measured-to- homogeneous pressure rise rates is larger (2.4 and 3.1) for the same heat fluxes at the 83 percent fill level, thus indicating that the effect of thermal stratification is more pronounced at this fill level. These measured-to- homogeneous pressure rise ratios are much less than reported for a spherical 208 m3 LH2 tank with a similar
wall heat fluxl. It is interesting to note that as the heat flux increases by 75 percent (2.0 to 3.5 W/m2), the measured pressure rise rate at each fill level increases by 115 to 135 percent.
Starting conditions were found to have a significant impact on the initial pressure rise rate. Tests wese performed with starting conditions of either an isothermal ullage or a steady boil-off (thermally stratified ullage) condition. The measured quasi-steady pressure rise rates at a heat flux of 3.5 Wlm2 are virtually independent of the starting condition after an initial transient period has passed as is shown in Fig. 3 for fill levels of 29 and 83 percent. The more rapid pressure rise of the isothermal starting condition is attributed to energy released by the
l o o , , , , , , , , , , , * , , , 0 S 10
Time, hr (a) Fill Level = 29 Percent
220 , I
5
0 5 i o is
(b) Fill Level = 83 Percent (Data from Hasan, et al2) Time, hr
Figure 3. - Effect of Starting Conditions on Pressure Rise Rate. q = 3.5 Wlm2.
4

1.75 ,
1-75?
1.5-
1.25 -
E 1-
5 .- u"
2 0.75-
0.5-
0.25-
0
initially superheated liquid that exists at the initiation of the experiment.
i
. . . . , . . . , , , . . . , , . . . I 10 20 30 40 50
(a) Fill Level = 29 Percent 1.75 1 1.5
1.25
E 1 LI 3 M .I 2 0.75
0.5
0.25
0 10 20 30 40
The measmd fluid temperatures near the vertical axis of the tank are shown in Fig. 4 for the three fill levels at the higher heat flux. Temperature profiles at the start of the test as well as distributions at 4 and 12 hr intervals are shown. The saturation temperature at the tank pressure has been added at the location of the liquid surface in Fig. 4b due to faulty temperature measurements at the 50 percent fill position. Vapor temperatures initially increase more rapidly than liquid temperatures. At the 83 percent fill, the vapor temperatures reach a quasi-steady condition within a 4 hr interval. It is apparent that the time required to obtain quasi-steady vapor temperatures increases with increasing ullage volume (decreasing fill level). Furthermore, the maximum vapor temperature increases with decreasing fill level. On the liquid side, measured liquid temperatures are below the saturation temperatures as expected. Liquid subcooling, based on the two measurement locations nearest the bottom, is approximately 0.7, 0.5, and 1.3 K at the 29, 49, and 83 percent fills, respectively. The lower s u b l i n g at the 49 percent fill condition is related to the lower tank pressure and saturation temperature at the 12 hr mark for this fill level.
Fluid and wall temperature data for the 49 percent fill level at a heat flux of 3.5 W/m2 are shown in Fig. 5. Temperature histories at selected vertical locations are shown along with vertical temperature profiles at 0,4, and 12 hr. It is seen that the transient behavior of both wall and fluid temperatures are similar. Temperatures below the liquid level increase quasi-linearly, while the vapor and exposed wall temperatures initially increase rapidly and then approach a quasi-steady condition. This initial transient behavior and the following quasi-steady conditions in the vapor region and unwetted wall area coincide in time with the pressure rise results shown earlier in Fig. 2(b). Maximum differences between the wall and fluid temperatures at any vertical position is about 1 K, with the wall temperature being higher. Close agreement of these temperatures does not necessarily indicate uniform radial temperature distributions. However, the magnitude of variations in both vapor and liquid temperatures in the radial direction thought to be small.
Fluid and wall temperature behavior at other fill levels is similar except that the time required to reach steady conditions varies. This effect is shown in Fig. 6 for the uppermost vapor temperature measurement location at the higher heat flux. It is evident that the time required to reach steady ullage conditions decreases with increasing
5
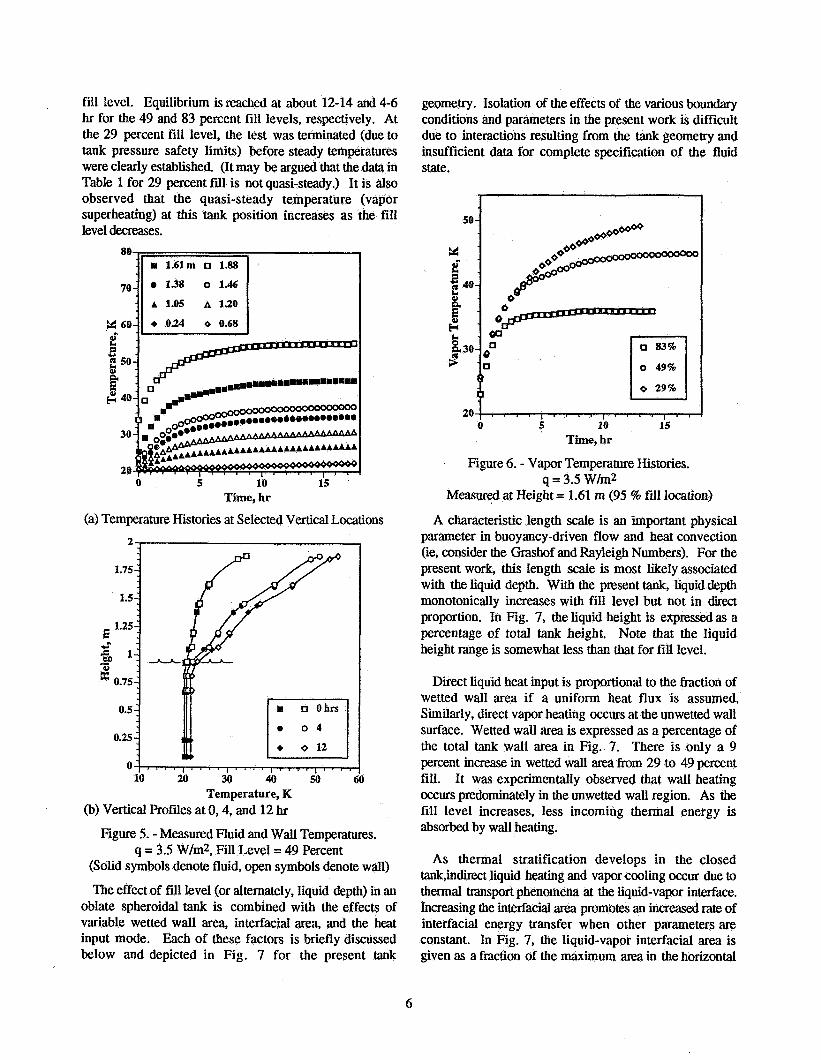
fill level. Equilibrium is reached at about 12-14 and 4-6 hr for the 49 and 83 percent fill levels, respectively. At the 29 percent fill level, the test was terminated (due to tank pressure safety limits) before steady temperatures were clearly established. (It may be argued that the data in Table 1 for 29 percent fill is not quasi-steady.) It is also observed that the quasi-steady temperature (vapor superheating) at this tank position increases as the fill level decreases.
0 5 10 15
(a) Temperature Histories at Selected Vertical Locations Time, hr
1.75-
1.5-
E 1-25i 5 1; ." ' 0.75:
0.5-
0.25 :
0 ' 10
geometry. Isolation of the effects of the various boundary conditions and parameters in the present work is difficult due to interactions resulting from the tank geometry and insufficient data for complete specification of the fluid state.
. . , . . . , , , . , , , . . . . J 20 30 40 50 60
I 50 -
0 5 10 15 Time, hr
Figure 6. - Vapor Temperature Histories. q = 3.5 Wlm2
Measured at Height = 1.61 m (95 8 N1 location)
A characteristic length scale is an important physical parameter in buoyancy-driven flow and heat convection (ie, consider the Grashof and Rayleigh Numbers). For the present work, this length scale is most likely associated with the liquid depth. With the present tank, liquid depth monotonically increases with fill level but not in direct proportion. In Fig. 7, the liquid height is expressed as a percentage of total tank height. Note that the liquid height range is somewhat less than that for fill level.
Direct liquid heat input is proportional to the fraction of wetted wall area if a uniform heat flux is assumed. Similarly, direct vapor heating occurs at the unwetted wall surface. Wetted wall area is expressed as a percentage of the total tank wall area in Fig. 7. There is only a 9 percent increase in wetted wall area from 29 to 49 percent fill. It was experimentally observed that wall heating occurs predominately in the unwetted wall region. As the fill level increases, less incoming thermal energy is absorbed by wall heating.
As thermal stratification develops in the closed tank,indirect liquid heating and vapor cooling occur due to thermal transport phenomena at the liquid-vapor interface. Increasing the inteifacial area promotes an increased rate of interfacial energy transfer when other parameters are constant. In Fig. 7, the liquid-vapor interfacial area is given as a fraction of the maximum a m in the horizontal
6
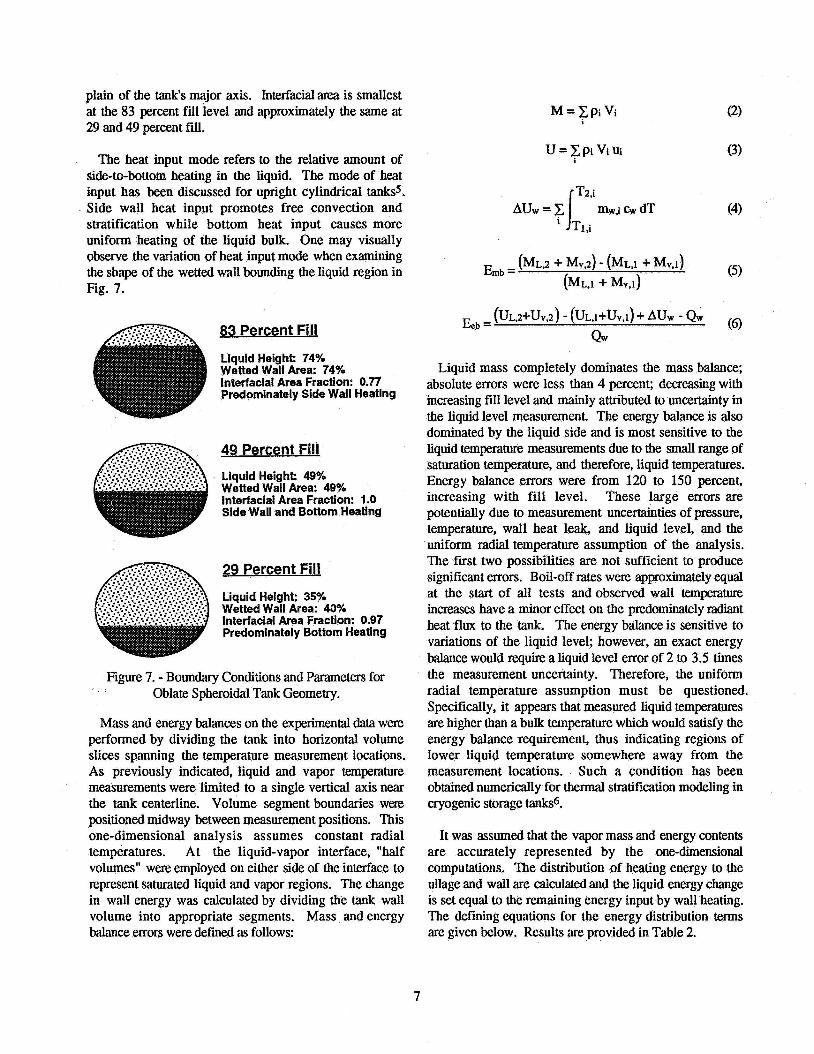
plain of the tank's major axis. Interfacial a m is smallest at the 83 percent fill level and appmximately the same at 29 and 49 percent fill.
U=I:piViui (3) The heat input mode refers to the relative amount of i
side-to-bottom heating in the liquid. The mode of heat input has been discussed for upright cylindrical tankss. Side wall heat input promotes free convection and
uniform heating of the liquid bulk. One may visually observe the variation of heat input mode when examining
T2.i AUw = I: mw,i CW dT (4) I i stratification while bottom heat input causes more TI ,i
(ML,~ + Mv.2) - (MLJ + Mv.1) the shape of the wetted wall bounding the liquid region in Emb = Fig. 7. (MLJ + Mv,l)
83 Percent Fill
Liquid Height: 74% Wetted Wall Area: 74% Interfacial Area Fraction: 0.77 Predominately Side Wall Heating
49 Percent Fill
Liquid Height: 490/. Wetted Wall Area: 49% Interfacial Area Fraction: 1.0 Side Wall and Bottom Heating
... . -. .. . .': J .:*-.:. G.:.~-;:L;.:- interfacial Area Fraction: 0.97 Predominately Bottom Heating
Figure 7. - Boundary Conditions and Parameters for Oblate Spheroidal Tank Geometry.
Mass and energy balances on the experimental data were performed by dividing the tank into horizontal volume slices spanning the temperature measurement locations. As previously indicated, liquid and vapor temperature measurements were limited to a single vertical axis near the tank centerline. Volume segment boundaries weze positioned midway between measurement positions. This one-dimensional analysis assumes constant radial temperatures. At the liquid-vapor interface, "half volumes" were employed on either side of the interface to represent saturated liquid and vapor regions. The change in wall energy was calculated by dividing the tank wall volume into appropriate segments. Mass and energy balance errors were defined as follows:
Liquid mass completely dominates the mass balance; absolute errors were less than 4 percent; decreasing with increasing fill level and mainly attributed to uncertainty in the liquid level measurement. The energy balance is also dominated by the liquid side and is most sensitive to the liquid temperature measurements due to the small range of saturation temperature, and therefore, liquid temperatures. Energy balance errors were from 120 to 150 percent, increasing with fill level. These large errors are potentidly due to measurement uncertainties of pressure, temperature, wall heat leak, and liquid level, and the uniform radial temperature assumption of the analysis. The first two possibilities are not sufficient to produce significant errors. Boil-off rates were approximately equal at the start of all tests and observed wall temperature increases have a minor effect on the predominately radiant heat flux to the tank. The energy balance is sensitive to variations of the liquid level; however, an exact energy balance would require a liquid level error of 2 to 3.5 times the measurement uncertainty. Therefore, the uniform radial temperature assumption must be questioned. Specifically, it appears that measured liquid temperatures are higher than a bulk temperature which would satisfy the energy balance requirement, thus indicating regions of lower liquid temperature somewhere away from the measurement locations. Such a condition has been obtained numerically for thermal stratification modeling in cryogenic storage tanks6.
It was assumed that the vapor mass and energy contents are accurately represented by the one-dimensional computations. The distribution of heating energy to the ullage and wall are calculated and the liquid energy change is set equal to the remaining energy input by wall heating. The defining equations for the energy distribution terms are given below. Results are provided in Table 2.
7

Uv,2-Uv,l Qw
(pv =
@w-- - AUw Qw
$ L = l - @ v - @ W
Table 2. - Heat Distribution Analysis. (Steady Boil-Off Starting Condition,
q=3.5 W/m2,12 hr interval)
29 7 39 54 40 88 49 5 21 74 49 94 83 3 8 89 74 99
The wall heating fraction is small as a result of the low mass of the flightweight tank, and ranges from 3 to 7 percent of the total energy input. The wall energy increase occurs predominately in the unwetted region. Unwetted wall area, and therefore the wall heating fraction, decrease with increasing fill level. It is noted that the adjusted liquid heating fi-action increases with fill level and exceeds the vapor heating fraction in each case. Also, the liquid heating fraction exceeds the wetted wall fraction at each fill level. If the wall heat flux is uniform, this result implies heat transfer from the vapor to the liquid. (The uniform heat flux assumption is reasonable, since about 85 percent of the heat leak is uniformly distributed and the remaining heat leak paths are located in both the upper and lower halves of the tank3.) Energy transfer to the liquid region is a combined result of direct wall heat input, conduction along the tank wall from the unwetted to wetted regions, and interfacial heat transport at the free surface. Liquid heating fractions based on the homogeneous model are also tabulated and exceed the experimental results as expected.
Conclusions and Recommendationq
Self-pressurization tests of LH2 in an oblate spheroiaal tank have been conducted at wall heat fluxes of 2.0 and 3.5 W/m2. The heat flux range is representative of future cryogenic storage tanks for space applications. Data taken at fill levels of 29 and 49 percent complement earlier results obtained at 83 percent fill.
The quasi-steady pressure rise rate at 29 and 49 percent fill was found to exceed that for homogeneous conditions by a factor of less than two. This ratio is less than that found earlier for the 83 percent fill and substantially less than reported for a much larger tank at a similar wall heat flux. The initial pressure rise rate is more rapid than for quasi-steady conditions; an effect to be considered when predicting storage tank pressure histories.
Pressure rise rates and the ratio of measured- to-homogeneous pressure rise increase with wall heat flux at each fill level as a result of increased free convection and thermal stratifkation.
Time required to achieve quasi-steady vapor temperatures increases with decreasing fill level. The maximum amount of vapor superheating also increases with decreasing fill level.
The mode of heat transfer is complex and is the greatest factor controlling the pressure rise rate. Pressure rise rates at varying tank fill level are subject to the combined effects of liquid height, wetted wall area, liquid-vapor interfacial area, and mode of wall heating. For an oblate spheroidal tank geometry, it was found that the pressure rise rates for LH2 were lowest at middle fill levels.
An energy balance analysis indicates that substantial liquid heating occurs due to indirect energy transfer from the vapor to liquid regions via wall conduction and thermal transport at the liquid-vapor interface. Tests should be repeated with additional radial fluid temjxram sensors in the tank to verify the hypothesis of non-uniform liquid temperatures.
Acknowledgeme n6
The authors gratefully acknowledge the assistance and teamwork of the K-Site personnel supporting Test Phase IB.
References
1. Liebenberg, D.H., and Edeskuty, F.J., "Pressurization Analysis of a Large-Scale Liquid-Hydrogen Dewar," International Advances in Cryogenic Engineering, K.D. Timmerhaus, ed., Plenum Press, Vol. 10 (Sections M-U), pp. 284-289, 1965.
8

2. Hasan, M.M., Lin, C.S., and Van Dresar, N.T., "Self-Pressurization of a Flightweight Liquid Hydrogen Storage Tank Subjected to Low Heat Fhx," -Heater - m, A. Adorjan and A. Bejan, eds., ASME HTD-Vol. 167, (also NASA TM 103804).
3. Stochl, R.J., and Knoll, R.H., "Thermal Performance of a Liquid Hydrogen Tank Multilayer Insulation System at Warm Boundary Temperatures of 630,530 and 152 O R , " AIAA paper 91-2400 (also NASA TM 104476), 1991.
4. Lin, C.S., Van Dresar, N.T., and Hasan, M.M., "A Pressure Control Analysis of Cryogenic Storage Tanks," AIAA Paper 91-2405 (also NASA TM 104409),1991.
5. Tatom, J.W., Brown, W.H., Knight, L.H., and Coxe, E.F., "Analysis of Thermal Stratification of Liquid Hydrogen in Rocket Propellant Tanks,'' Advances in Cryogenic Engineering, K.D. Timmerhaus, ed., Plenum Press, Vol. 9, pp. 265-272, 1964.
6. Lin, C.S., and Hasan, M.M., "Numerical Investigation of the Thermal Stratification in Cryogenic Tanks Subjected to Wall Heat Flux," AIAA Paper 90-2375 (also NASA TM 103194),1990.
9

WU - 593-2 1
N.T. Van Dresar, M.M. Hasan, C.-S. Lin
I 7. PERFORMING ORGANIZATION NAME(S) AND ADDRESS(ES) 1 8. PERFORMING ORGANIZATION
National Aeronautics and Space Administration Lewis Research Center Cleveland, Ohio 44135 -3191
REPORT NUMBER
E-6813
9. SPONSORING/MONITORING AGENCY NAMES@) AND ADDRESS(ES) I O . SPONSORING/MONITORING AGENCY REPORT NUMBER
National Aeronautics and Space Administration Washington, D.C. 20546 -0oO1 NASA TM- 1054 11
AIAA-92-0818
11. SUPPLEMENTARY NOTES
Prepared for the 30th Aerospace Sciences Meeting and Exhibit sponsored by the American Institute of Aeronautics and Astronautics,
Unclassified -Unlimited Subject Categories 28 and 34
Experimental results are presented for the self-pressurization and thermal stratification of a 4.89 m3 liquid hydrogen storage tank subjected to low heat flux (2.0 and 3.5 W/m2) in normal gravity. The test tank was representative of future spacecraft tankage, having a low mass-to-volume ratio and high performance multi-layer thermal insulation. Tests were performed at fill levels of 29 and 49 percent (by volume) and complement previous tests at 83 percent fill. As the heat flux increases, the pressure rise rate at each fill level exceeds the homogenous rate by an increasing ratio. In the present work, this ratio did not exceed a value of 2. The slowest pressure rise rate was observed for the 49 percent fill level at both heat fluxes. This result is attributed to the oblate spheroidal tank geometry which introduces the variables of wetted wall area, liquid-vapor interfacial area, and ratio of side wall-to-bottom heating as a function of fill level or liquid depth. Initial tank thermal conditions were found to affect the initial pressure rise rate. Quasi-steady pressure rise rates are independent of starting conditions.
14. SUBJECT TERMS 115. NUMBER OF PAGES
Cryogenic fluid storage; Stratification; Fuel tank pressurization 10 16. PRICE CODE
Prescribed by ANSI Std. 239-18 298-1 02