?r=19880019599 2018-03-15t16:53:45+00:00z · pdf filecritical joints in large composite...
TRANSCRIPT

https://ntrs.nasa.gov/search.jsp?R=19880019599 2018-05-21T13:42:33+00:00Z

NASA Contractor Report 3914
Critical Joints in Large Composite Primary Aircraft Structures
Volume I-Technica l Summary
B. L. Bunin
Dougias A.'rcraft Company Long Beach, California
Prepared for Lanqley Research Center under Contract NAS1-16857
National Aeronautics and Space Admillistration
ScienEific and Technical Information Branch

This report - Critical Joints in Large Composite Primary Aircraft Structures, - was prepared by Douglas Aircraft Company, McDonnell Douglas Corporation, under contract NASl-16857. The proj- ect was conducted as part of the NASA Aircraft Energy Efficiency (ACEE) program.
The research effort was monitored by Andrew J. Chapman, ACEE Composites Project Office, Langley Research Center, NASA. Bruce L. Bunin was the Douglas Pro.:ect Manager. Max Klotzsche was Douglas ACEE Program Manager.
In addition to the author, Douglas personnel contributing to this program included D. J. Watts and W. D. Nelson, prior Project Managers; L. J. Hart-Smith and J. B. Black, Stress Analysis; L. P. Marius, Design; J. V. Walker and E. P. Moenning, Materials; G. C. Janicki and P. J. Marra, Manufacturing R&D, and R. L. Oswald, Program Administration.
CONTENTS
Section Page
2 PHASE I TECHNOLOGY DEVELOPMENT . . . . . . . . . . . . . . . . . . . . . . . . . . . . . . . . . 9
3 CONCEPT SELECTION . . . . . . . . . . . . . . . . . . . . . . . . . . . . . . . . . . . . . . . . . . . . . . . . . . 17
4 DESIGN DATA - ANCILLARY TESTS . . . . . . . . . . . . . . . . . . . . . . . . . . . . . . . . . . . . 21 Strength Properties . . . . . . . . . . . . . . . . . . . . . . . . . . . . . . . . . . . . . . . . . . . . . . . . . . . . 2 1 Load-Deflection Properties . . . . . . . . . . . . . . . . . . . . . . . . . . . . . . . . . . . . . . . . . . . . . 23 Edt Bending . . . . . . . . . . . . . . . . . . . . . . . . . . . . . . . . . . . . . . . . . . . . . . . . . . . . . . . . . 24
5 TECHNOLOGY DEMONSTRATION TEST PROGRAM . . . . . . . . . . . . . . . . . . . . . . 31 Stringer Transition Test . . . . . . . . . . . . . . . . . . . . . . . . . . . . . . . . . . . . . . . . . . . . . . . . 3 1 Demonstration Subcomponent Tests . . . . . . . . . . . . . . . . . . . . . . . . . . . . . . . . . . . . . 33 Technology Demonstration Test . . . . . . . . . . . . . . . . . . . . . . . . . . . . . . . . . . . . . . . . . 34
6 ANALYSIS METHODOLOGY DEVELOPMENT . . . . . . . . . . . . . . . . . . . . . . . . . . . . 43
7 ANALYSWTEST CORRELATION . . . . . . . . . . . . . . . . . . . . . . . . . . . . . . . . . . . . . . . . 53
8 CONCLUSIONS . . . . . . . . . . . . . . . . . . . . . . . . . . . . . . . . . . . . . . . . . . . . . . . . . . . . . . . . . 59
. . . . . . . . . . . . . . . . . . . . . . . . . . . . . . . . . . . . . . . . . . . . . . . . . . . . . . . . . . 9 REFERENCES 61

Figure
ILLUSTRATIONS
Page
Baseline Aircraft Configuration . . . . . . . . . . . . . . . . . . . . . . . . . . . . . . . . . . . . . . . . , . . . . 1 I Wing Load Intensities and Joint Locations . . . . . . . . . . . . . . . . . . . . . . . . . . . . . . . . . . . . . 1 1 Relation Between Strengths of Bolted Joints in Ductile, Fibrous Composite and Brittle Materials . . . . . . . . . . . . . . . . . . . . . . . . . . . . . . . . . . . . . . . . . . . . . . . . . . . . . . . 12 Composite Stress Concentration Factors . . . . . . . . . . . . . . . . . . . . . . . . . . . . . . . . . . . . . . 12 Bearing-Bypass Interactions under Tension Load . . . . . . . . . . . . . . . . . . . . . . . . . . . . . . . 13 Rearing-Bypass Interactions under Compression Load . . . . . . . . . . . . . . . . . . . . . . . . . . . 13 Fastener Load-Deflection Properties . . . . . . . . . . . . . . . . . . . . . . . . . . . . . . . . . . . . . . . . . 14 Effect of Joint Configuration on Bolt Load Distribution . . . . . . . . . . . . . . . . . . . . . . . . . 14 Bearing-Bypass Interactions Minimum Initial Load Transfer Approach . . . . . . . . . . . . . I5 Two-Row, Three-Column Subcomponent Joint, Net-Tension Failure . . . . . . . . . . . . . . 15 Bearing-Bypass Failure Envelopes . . . . . . . . . . . . . . . . . . . . . . . . . . . . . . . . . . . . . . . . . . . . 16 Lower Rear Spar and Stringer Conceptual Joint . . . . . . . . . . . . . . . . . . . . . . . . . . . . . . . . 18 Four-Row Tension Joint - Splice Plate Delaminations . . . . . . . . . . . . . . . . . . . . . . . . . . 19 Composite Stress Concentration Factors at Failure . . . . . . . . . . . . . . . . . . . . . . . . . . . . . . 25 Bolt Bending Effects for Composite Joints . . . . . . . . . . . . . . . . . . . . . . . . . . . . . . . . . . . . . 25 Bolted Composite Joint Efficiency Chart (25-Percent @Degree Plies) . . . . . . . . . . . . . . . 26 Bolted Composite Joint Efficiency Chart (37.5-Percent @Degree Plies) . . . . . . . . . . . . . 26 Effect of Fiber Pattern on Multirow Joint Strength and Strain Levels . . . . . . . . . . . . . . . 27 Bolted Joint Elastic Spring Rates - Phase I1 Double Shear Test Versus Prediction . . . . 27 Predicted Elastic Spring Rate . . . . . . . . . . . . . . . . . . . . . . . . . . . . . . . . . . . . . . . . . . . . . . . . 2P Two-Row Bolted Joint - Bolt Failure . . . . . . . . . . . . . . . . . . . . . . . . . . . . . . . . . . . . . . . 28 Approximate Single Row Joint Allowables . . . . . . . . . . . . . . . . . . . . . . . . . . . . . . . . . . . . 29 Phase I I Test Program . . . . . . . . . . . . . . . . . . . . . . . . . . . . . . . . . . . . . . . . . . . . . . . . . . . . . 36 Stringer Transition Joint Design Concept . . . . . . . . . . . . . . . . . . . . . . . . . . . . . . . . . . . . . . 37 Stringer Transition Specimen Installed in Test Machine . . . . . . . . . . . . . . . . . . . . . . . . . . 37 Photo-Elastic Survey - Stringer Blade, Applied Load = 80,000 Pounds . . . . . . . . . . . . 38 Photo-Elastic Survey - Upper Splice, Applied Load = 80,OOO Pounds . . . . . . . . . . . . . 38 Stringer Transition Test - Failed Specimen . . . . . . . . . . . . . . . . . . . . . . . . . . . . . . . . . . . . 39 Demonstration Subcomponent Tests . . . . . . . . . . . . . . . . . . . . . . . . . . . . . . . . . . . . . . . . . 40 Subcomponent No. 1 - Failed Specimen . . . . . . . . . . . . . . . . . . . . . . . . . . . . . . . . . . . . . . 40 Subcomponent No. 2 - Failed Specimen . . . . . . . . . . . . . . . . . . . . . . . . . . . . . . . . . . . . . . 41 Technology Demonstration Joint Design Concept . . . . . . . . . . . . . . . . . . . . . . . . . . . . . . 41
PRECEIlING PAGE BLANK NOT FILMED

ILLUSTRATIONS (Con tinud)
Figure pylc
................................ Technology Demonstration Specimen Assembly 42 Technology Demonstration Specimen - Te..> Section ........................... 42 Test Article after Instrumentation - Spar Cap Side ............................. 43
........................................ Technology Demonstration Test Setup 43 Technology Demonstration Test No. 1 - End Pitting Failure ..................... 44 Technology Demonstration Test - End Fitting Failure .......................... 44 C-Scan Results Spar Cap Member . . . . . . . . . . . . . . . . . . . . . . . . . . . . . . . . . . . . . . . . . . . . 45 Joint Re-test with Aluminum Replacement Part ................................ 45
.............................. Technology Demonstration - Test Section Failure 46 Technology Demonstration - Test Section Failure .............................. 46
. . . . . . . . . . . . . . . . . . . . . . . . . . . Loads and Deformations on Elements of Bolted Joints 5 1 . . . . . . . . . . . . . . . . . . . . . . . . . . . . . . . . . . . . . . Stringer Transition Joint Analysis Model 52
............................................ Explc- led View of Analysis Model 52 .............................. Bearing-Bypass Loads in Stringer Transition Joint 55
. . . . . . . . . . . . . . . . . . . . . . . . . . . . . . . Stringer Transition - Analysis/Test Correlation 56 . . . . . . . . . . . . . . . . . . . . . Demonstration Subcomponent - Analysis/Test Correlation 56
. . . . . . . . . . . . . . . . . . . Bearing-Bypass Interactions . - Technology Demonstration Test 57
TABLES
Table Page
. . . . . . . . . . . . . . . . . 1 Phase I1 Test Program - Technology Demonstration Test Results 47

SUMMARY
A program was conducted to develop and demonstrate the technology for critical structural joints of a composite wing structure that meets all the design requirements of a 1990commercial transport aircraft.
The program was divided into two phases. During Phase I, completed in September of 1983, the pro- cedures for bolted composite joint design and analysis were developed. Tests were conducted at the ele- ment level to supply the empirical data required for methods development (Reference 1). Large com- posite multirow bolted joints were tested to verify the selected design concepts and for correlation with analysis predictions (Reference 2). The Phase I summary is reported in Reference 3. The Phase I1 pro- gram included additional tests to provide joint design and analysis data, and culminated with several technology demonstration tests of a major joint area representative of a commercial transport wing.

SKCTION I INTRODUCTION
The major objective of this investigation was to develop and demonstrate the technology for critical structural joints of a composite wing structure that meets all the design requirements of a 1990commer- cia1 transport aircraft.
To fulfill this objective, procedures for the design and analysis of bolted joints in composite structures were developed. Structural tests of single-bolt joints were conducted to provide empirical data in sup- port of the design and analysis of multirow joints (Reference 1). Multirow joint specimens referred to as "joint subcomponents" were tested in both tension and compression during the Phase I effort to pro- vide data for correlation with analytical predictions (Reference 2). In most cases, excellent correlation between analysis and test resdts was demonstrated, verifying the basic analytical approach. The A4EJ computer analysis program was used to design and predict the strength of large multirow bolted joints which usually failed at gross-section strain levels on the order of 0.005. For the material systems and fiber patterns tested, this corresponds to far-field stress levels of roughly 45,000 to 47,000 psi.
The specific objective for Phase I1 of the program was to demonstrate the technol:.:;y developed during Phase I with structural tests of representative wing joint structure and to correlate these results with analytical predictions. The critical wing joint selected for the technology demonstration effort was the side of the fuselage splice at the lower rear spar. The test program examined portions of this area sepa- rately and culminated in the testing of a large bolted joint specimen representing the aforementioned wing splice which included the wing skin, spar cap, and spar web members. Further development of the analysis methodology was required to properly model the behavior of representative wing joint struc- ture, typically more complex than the relatively simple skin splices tested in Phase I. Semiempirical methods were combined with finite element analysis models and accurate strength predictions were again achieved.
The work was conducted at the Douglas Aircraft Company, Long Beach, California, under contract to NASA-Langley Research Center. The research work performed on this program was based initially on an earlier contract with NASA-Langley on small bolted coupon tests in which the fai!ure mechanisms and strengths for composite laminates with bolt holes were characterized empirically (Reference 3). In a later contract with the US. Air Force Flight Dynamics Laboratory at Wright-Patterson AFB, Ohio, the A4EJ computer analysis program wah developed for the analysis of multirow bolted joints (Reference 4). Other related work will be discussed throughout the report.
After a review of the Phase I effort, this report will focus on the technology demonstration program of Phase 11. The analysis methodology development, structural test program, and correlation between test results and analytical strength predictions are reviewed.
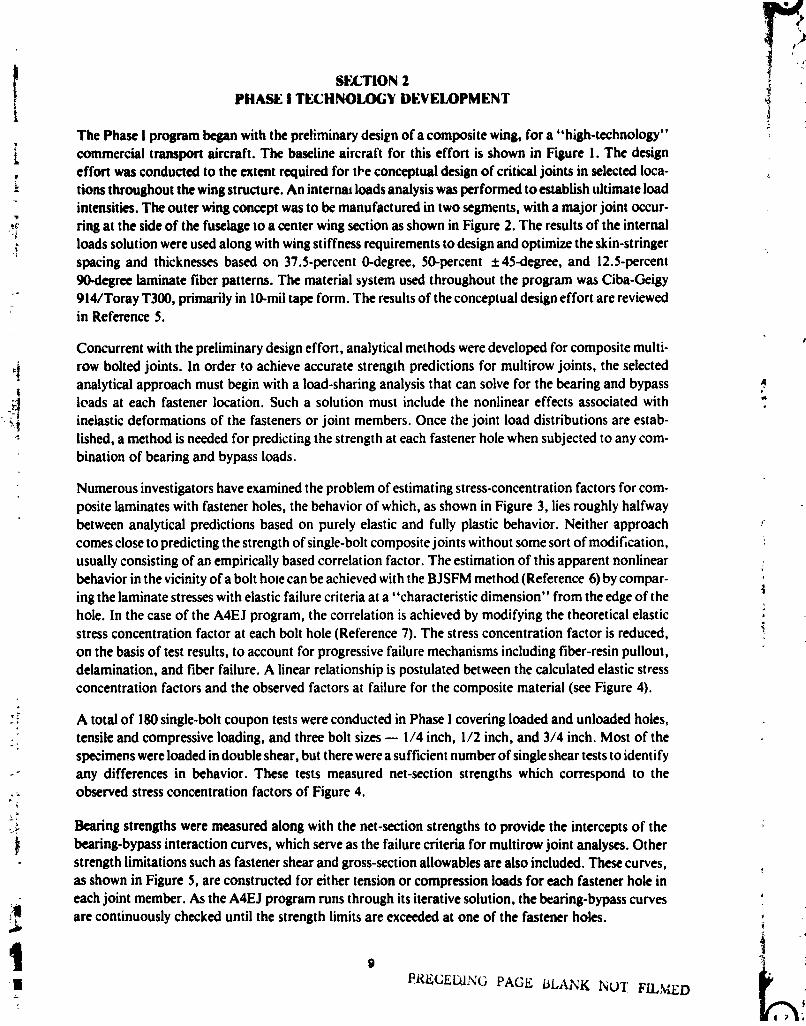
SF1CTION 2 PHASE I TECHNOLOGY DEVELOPMENT
The Phase 1 program began with the preliminary design of a composite wing, for a "high-technology" commercial transport aircraft. The baseline aircraft for this effort is shown in Figure 1. The design effort was conducted to the extent required for tbe conceptual design of critical joints in selected loca- tions throughout the wing structure. An internal loads analysis was performed to establish ultimate load intensities. The outer wing concept was to be manufactured in two segments, with a major joint occur- ring at the side of the fuselage to a center wing section as shown in Figure 2. The results of the internal loads solution were used along with wing stiffness requirements to design and optimize the skin-stringer spacing and thicknesses based on 37.5-percent O-degree, 50-percent i45degree, and 12.5-percent 90dcgree laminate fiber patterns. The material system used throughout the program was Ciba-Geigy 914/Toray T300, primarily in 10-mii tape form. The results of the conceptual design effort are reviewed in Reference 5.
Concurrent with the preliminary design effort, analytical merhods were developed for composite multi- row bolted joints. In order to achieve accurate strength predictions for multirow joints, the selected analytical approach must begin with a load-sharing analysis that can solve for the bearing and bypass loads at each fastener location. Such a solution must include the nonlinear effects associated with inelastic deformations of the fasteners or joint members. Once the joint load distributions are estab- lished, a method is needed for predicting the strength at each fastener hole when subjected to any com- bination of bearing and bypass loads.
Numerous investigators have examined the problem of estimating stress-concentration factors for com- posite laminates with fastener holes, the behavior of which, as shown in Figure 3, lies roughly halfway between analytical predictions based on purely elastic and fully plastic behavior. Neither approach comes close to predicting the strength of single-bolt composite joints without some sort of modification, usually consisting of an empirically based correlation factor. The estimation of this apparent nonlinear behavior in the vicinity of a bolt hole can be achieved with the BJSFM method (Reference 6) by compar- ing the laminate stresses with elastic failure criteria at a "characteristic dimension" from the edge of the hole. In the case of the A4EJ program, the correlation is achieved by modifying the theoretical elastic stress concentration factor at each bolt hole (Reference 7). The stress concentration factor is reduced, on the basis of test results, to account for progressive failure mechanisms including fiber-resin pullout, delamination, and fiber failure. A linear relationship is postulated between the calculated elastic stress concentration factors and the observed factors at failure for the composite material (see Figure 4).
A total of 180 single-bolt coupon tests were conducted in Phase I covering loaded and unloaded holes, tensile and compressive loading, and three bolt sizes - 114 inch, 1/2 inch, and 3/4 inch. Most of the specimens were loaded in double shear, but there were a sufficient number of single shear tests to identify any differences in behavior. These tests measured net-section strengths which correspond to the observed stress concentration factors of Figure 4.
Bearing strengths were measured along with the net-section strengths to provide the intercepts of the bearing-bypass interaction curves, which serve as the failure criteria for multirow joint analyses. Other strength limitations such as fastener shear and gross-section allowables are also included. These curves, as shown in Figure 5, are constructed for either tension or compression loads for each fastener hole in each joint member. As the A4EJ program runs through its iterative solution, the bearing-bypass curves are continuously checked until the strength limits are exceeded at one of the fastener holes.
9
PHC;CEWI\'G PAGE IILANK hU? FILMED

In order to perform the load-sharing analyses, the l d d e f k c t i o n properties at each fastener location must be determined and input to the program as a stiffness property. The dtiglebdt test specimens wen instrumented so that load deflection curves to failure wen generated for each configuration, character- izing both the linear and nonlinear ranges of behavior. The Eoaddeflcction proQertics are iderliwd in the A4EJ program with a simple bilinear model, as shown in Figure 6, in which the sccond portion of the c u m represents plastic deformation. This nonlinear range of behavior can be essential to performing accurate strength predictions, particularly for joint geometries which produce a substantial amount of plastic deformation prior to failure. During the Phase I investigation, it was found that the linear por- tions of these curves could be represented accurately by minor modifmtions to an old NACA formula (Reference 8) developed during an investigation of metallic joints.
Having generated the mechanical properties required for the analysis of multirow joints, parametric studies were conducted to evaluate the effects of varying joint proportions and configurations on bolt load distributions and overall performance. The results of one such study are presented in Figure 7, where the effects of varying joint member thicknesses on the fastener load sharing and ultimate joint strengths were evaluated. This study revealed that by tailoring the joint geometry, a bolt load distribu- tion could be generated which maintains a low-bearing high-bypass condition at the first or outermost row of fasteners.
The nature of conrposite materials is such that the bypass strength is always substantially greater than the bearing strength for reasonably isotropic laminates with bolt holes. Thus, it was determined that the maximum strength for a multirow bolted joint is achieved by minimizing the load transfer at the first row of fasteners where the bypass load is the highest, while allowing the other fasteners to carry the remain- ing load without permitting a premature failure in some other location. This principle is illustrated in Figurc 8 in which typical interaction curves are drawn in terms of loads and stresses.
The methods and data described above were used to analytically predict the strength of 20 large multi- row bolted joints tested in the Phase I program. In most cases, good correlation was demonstrated between analysis and test results. Figure 9 shows one of the subcomponent specimens after testing. This particular specimen had a 1-inch-thick center skin and was fastened together with two rows and three iolumns of 3/4inchdiameter bolts. The analysis-test correlation for this specimen configuration loaded in both tension and compression is shown in Figure 10 in terms of the associated bearing-bypass interaction curves. The proximity of the predicted and tested strengths shows good correlation in all cases.
The prime conclusion drawn from the Phase I effort was that it is possible to make reliable strength pre- dictions for large multirow bolted joints in fibrous composite laminates. Not all geometries and load conditions were covered, and several aspects of the analysis methodology warrant further development. Nevertheless, the key ingredients in efficient joint design were identified and :lerifd by test. The stress
. and strain levels achieved at failure for the multirow joints tested were a considerable improvement over the state of the art, and the methodology was developed to the extent that a second phase of the effort was planned to demonstrate the level of technology using large multirow joints representative of actual transport wing structure.
The Phase I program is summarized in Reference 5.

" S t
ORIGj:?,'';:- i. .. - . OF POOR QiJALI1v
WEIGHT SLIMMARV ILBI r--- 14OFTSlN. - -- - - - -
MODEL D 3743 22
MAXIMUM TAKEOFF 2 13.500 n MAXIMUM LANDING MAXIMUM ZERO FUEL 180.000 FUEL CAPACITY IAT 6 7 LBIGAL) 85.WO MANUFACTURER'S EMPTY WEIGHT 122.811 OPERATOR'S ITEMS 4.W5 OPERATOR'S EMPTY WEIGHT 127.703 MAXIMUM PAYLOAD 52.300
k- 131 FT 5 IN. \ \
44 FT 4 IN.
t 27 n 2 IN 4 L-SFTSIN. J
FIGURE 1. BASELINE AIRCRAFT CONFIGURATION
c-.- --,
l ' '%?; 4.Im
OUreOARD KWm LOU) INTENSITIES ARE IN POUNDS PER INCH
FIGURE 2. WING LOAD INTENSITIES AND JOINT LOCATIONS

JOINT 0.4 STRUCTURAL EFFICIENCY o*3 IP/(F t, wt)l
DUCTILE METAL
BRITTLE MATERIAL
" 0 0.2 0.4 0.6 0.8 1 0 d/w
RATIO OF BOLT DIAMETER TO STRIP WIDTH
FIGURE 3. RELATION BETWEEN STRENGTHS OF BOLTED JOINTS I N DUCTILE, FIBROUS COMPOSITE
AND BRITTLE MATERIALS
FIGURE 4. COMPOSITE STRESS CONCENT RATION FACTORS

TMEORETEAL LOAD A T wwcn LAMMATE WOULD FA# BV TENSION
"/'- IF onLv TnE BEARIMG FAILURE MAD NOT OCCURRED FMST
J '\
\
BEARING CUT-OFF
TENSILE FAILURES
ACTUAL LOAO A T wwcn LAMINATE FAILS THROUGH WlTtl NO IEARll.S LOAD
Pbyprrr
FIGURE 5h). BEARING-BYPASS INTERALTIONS UNDER TENSION LOAD
LOOSE HOLE -------
TIGHT -FIT I (FILLED) HOLE I
I
FAILURE OF NET SECTION AT "a" I
+--. . I
Pbyprrr
FAILURE DUE TO COYBINATON OF
- BEARING AND BY PASS STRESSES AT "b"
FIGURE 5(b). BEARlNG-5YPkSS INTERACTIONS UNDER COMPRESSION LOAD
13

THEORY TEST
LOAD P
DEFLECTION d DEFLECTION d
FIGURE 6. FASTENER LOADDEFLECTION PROPERTIF
BOLT LOAD DlSlRlBUTlONS 4 . R W BOLTED JOINT
''~ /o
9 5 r-2'- // . /. *.* P **. / .' ..***
B O L T L O A D 8
(1ooOU) I
- CON) IGURATION 1 0****--4 CONFIGURATION 2 0- -4 CONFIGURATION 3 r - - l CONFIGURATION 4
- 0.50 I N .
CONFIGURATION - 4
E,,, 0M)S INJIN.
CONFIGURATION 3
E- - 0.0045 I N JIN
CONFIGURATION 2
E - - 0.0045 I N I I N
0.50 IN. 1 2 3 4 0 2 5 I N
--ffc
FIGURE 7. EFFECT OF JOINT CONFIOUdATiOW ON BOLT LOAD DISTRIBUTION


2-ROW, 3-COLUMN TENSION AND COMPRESSION SPECIMENS d 0.75 IN., w = 9.0 IN., t ~ ~ w = 1.0 IN., twLgE P: 0.67 IN. (X 2)
COY~RESSKHI TEST srLm PLATE CRITICAL #AI(IC LOAD
ci,m u, t" TENSlOl TEST CEWTER Sam CRITICAL
-100 -100 -300 -200 - 100 0 200 300 400 5 BVrASS LQAO (1,000 LB) BVrASS LOAD (1,000 LBI (COYPRESSKHII (TENSION)
FIGURE 10. BEARING-BYPASS FAILURE ENVELOPES

SECTION 3 CONCEPT SELECTION
Several design concepts were developed during the P h a ~ i program for critical joint locations through- out the wing. Based on the scope and the overall objectives of the Phase I1 effort, a specific section of critical wing joint structure was selected for the purposes of a technology demonstration. The internal- loads solution for the baseline wing concept indicated running-load intensities of roughly 36,000 pounds per inch near the wing root at the rear spar (Figure 2). Since these load levels were the highest throughout the wing, this portion of the structure was selected for the technology demonstration program.
Critical-joint concepts were developed for the upper and lower cover panels based on the 37.5-percent (Megsee laminate pattern, with gross-section strain levels restricted to 0.0032 to 0.004, depending on the fastener sizes. After ancillary test data became available, a series of A4EJ analysis solutions indicated that strain levels on the order of 0.004 to 0.005 were achievable through careful tailoring of joint propor- tions to optimize the bolt load distributions. The high-tension load on the wing lower surface was deter- mined to be the most critical condition. Thus, the wing root splice at the lower rear spar was chosen as the basis for the Phase I1 program.
The design objective for the wing-root splice was to provide a bolted joint of sufficient structural integ- rity while minimizing the complexity of fabrication and assembly procedures. The original concept shown in Figure 11 includes the rear spar web and the first stringer runout. A portion of the spar cap channel scction is shown in a double shear splice along with the wing skin. The stringer runout is accom- plished by scarfing off the stringer blade while simultaneously increasing in thickness before entering the bolted joint. The upper surface of the skin and cap members are joined by a titanium "tee" splice plate forming an attach point to the side of the fuselage bulkhead. The lower surface is spliced by an external titanium plate. The spar web and the standing leg of the spar cap are also spliced by a titanium tee on the external stirface, and are joined internall-yr by an aluminum corner fitting which transfers load through the side of the fuselage bulkhead with large tension fasteners. The corner fitting is also attached through the skin and spar cap splice, providing additional rigidity to the corner attachment.
Metal materials were selected for the splice plate members for several reasons. Optimum b.. load distri- butions are obtained by tailoring the joint proportions, which includes tapering the splice plates in order to minimize the load transfer at the first row of bolts. During the Phase I program, several of the sub- component tension joints with tapered composite splice plates suffered premature failures due to unex- pectedly high peel stresses and interlaminar forces, as illustrated in Figure 12. Although improved design concepts for these members have been developed, the use of metallic splice plates seemed the most simple and cost effective way of avoiding these potential failure modes. Further, the use of protruding head fasteners on tapered members requires either spotfacing of the splice plate surface or the use of tapered washers under the fastener heads and nuts. Spotfacing into tapered composite laminates intro- duces potentially critical peel forces in combination with local stress concentration effects, and the use of tapered washers increases the cost and complexity of the assembly procedures. Thus, the use of metallic splice plates with spotfacing on tapered surfaces to accommodate fastener seating was adopted as a standard practice.


SECTlON 4 DESIGN DATA - ANCILLARY TESTS
The Phase 11 test program began with a series of ancillary tests to further characterize the behavior of single-row composite joints. Tests wereconducted for joint geometries which were not tested in Phase I, or where data were inconclusive from previous tests. Unloaded-hole and loaded-hole specimens were tested to determine net-section strengths and the associated stress concentration factors at failure. Wider specimens were tested in the loaded-hole configuration to establish bearing strength limits at the initial point of nonlineari'v (bearing yield) and at ultimate load. These tests provide the intercepts for the bearing-bypass interaction curves, serving as the failure criteria for multirow joint analyses. The ancil- lary test program is reported in Reference 1.
STRENGTH PROPERTIES
Several of the tension coupon specimens tested in Phase I suffered premature failures at the point of load introduction. Thus, a series of unloaded-hole tension specimens were tested in Phase 11 to recover missing data points and extend the existing data base. The fastener diameters ranged from 0.375 to 1.0 inch, and were tested at width-to-di~meter ratios of 3 and 5. Two sets of specimens were fabricated which were identical in every way except for the ply thicknesses - 5-mil tape was used for one set, 10-mil tape for the other. From the results of these tests (Reference I) there appears to be no significant dif- ference in strength between laminates fabricated with either of the two ply thicknesses. However, a dif- ference in the appearance of the failed specimens was observed, with the 10-mil specimens suffering sub- stantial delaminations around the hole at failure while the 5-mil specimens exhibited a more uniform (clean) net-section failure.
The results of these tests were used to calculate the stress concentration factors at failure of the com- posite laminates, which are plotted against the calculated elastic-isotropic stress concentration factors in Figure 13. The trends indicated by this plot suggest that the relationship between K,, and Kt, is not per- fectly linear for a line constrained through the point (1 , l ) . Thus, the stress concentration relief factor, referred to as "C" factor, does not appear to remain constant for variations in the specimen width-to- diameter (w/d) ratio. While a complete characterization of this relationship would be useful, the data supplied by this limited series of specimens was sufficient to provide the analytical data base required for the analysis of the multirow joints to be tested in this program. A much more extensive series of tests would be required to fully acccsn! for changes in hole size, thickness, w/d ratio, fiber pattern, material system properties, etc.
Loaded-hole tension specimens were tested to provide net-section strengths and laminate bearing strengths. The results of the narrow specimen tests (w/d = 3) which failed in net-tension are also plotted in Figure 13. These results are consistent with the results of Phase I tests, where a value for C of roughly 0.42 was typical of loaded-hole tension failures for the laminate pattern with 37.5 percent 0-degree fibers.
The loaded-hole, double-shear specimens tested during the Phase I program all had external splice plates which were one-half the thickness of the central skin. For the wider specimens designed to measure laminate bearing stress allowables, all failures occurred in the splice plate members at bearing stress levels of around 100 ksi. This failure mode was expected, due to the relatively smail amouni of clamp-up provided by the fastener heads and nuts, as compared to the clamp-up afforded the center
21
PKISCEDII'JG '.'AGE BLANK NOT FILMED

plate which is sandwiched between the two splice members. This condition is aggravated by bending of the fasteners under load as illustrated in Figure 14. Regardless of whether the applied loads are tensile or compressive, the bolt deflection and rotation are such that the clamp-up on the bearing side of the fastener hole is relieved as the applied load is increased. This lowers the resistance to delaminations of the outer plies under bearing loads and can drastically reduce the allowable bearing stress levels for lami- nates on the outer surface of composite bolted joints.
In order to obtain realistic bearing stress allowables for the center members in a double shear joint, several coupons were tested in Phase 11 with composite or metallic splice plates of sufficient thickness to force the failure to occur in the central members. These tests resulted in ultimate bearing stress levels of roughly 160 ksi for the fully clamped central plates, representing a 60-percent increase in strength over that of external conlposite splice members.
The ancillary test results provided the database required to fully characterize the bearing-bypass inter- action curves for typical multirow joint configurations. While all of the large multirow joints tested throughout the program used the (37.5/50/12.5) fiber pattern, single-row joints using quasi-isotropic laminates (25/50/25) were also tested as a baseline. The strength limits of single-row and multirow joints can be plotted in terms of the joint geometry, shown in Figure 15. This plot was constructed for the quasi-isotropic, with the lowest curve representing the maximum strengths that can be achieved with a single-row joint. For this laminate, the maximum strength is reached at a w/d ratio of about 3 to 1, with a structural efficiency (unnotched strength divided by notched strength) of roughly 40 percent. The upper curve in the chart indicates the limiting case of an unloaded hole, while the curves in between represent various combinations of bearing and bypass loads. Thus, it is clear from these plots that the maximum strength for a multirow joint is obtained by minimizing the bearing stress at the critically loaded bolt, where the bypass stress is the highest.
A similar plot is presented in Figure 16 for the orthotropic laminate (37.5/50/12.5) which was selected for the composite wing structure. This chart illustrates that, depending on the geometry, joint strengths roughly 10 to 20 percent greater than that for the quasi-isotropic laminate can be achieved. (It should be noted that these plots were constructed using unnotched strength values about 15 percent lower than the tested values. However, since this was the case for both laminates, the trends indicated by comparison of the two figures are typical.) These results suggest that a tradeoff exists between the added strength due to the increase in 0-degree fibers and the associated increase in stress-concentration factors.
This tradeoff is explained in Figure 17, where the two fiber patterns are compared in terms of the strength and strain levels at failure for a typical multirow joint, as we:l as the unnotched strengths of the basic laminates. The bearing-bypass curves shown in the lower left-hand corner of Figure 17 represent typical strength envelopes for each of the two fiber patterns. The dashed line follows a path of low bear- ing and high bypass load, typical of the condition found at the first bolt row of an efficiently designed multirow joint as shown in the sketch to the right.
This chart shows that while the pattern B laminate has a 40-percent greater strength in unnotched tension than the pattern A laminate, the strength increase for a typical multirow joint is only 17 percent due to the higher stress concentration factors for the B pattern. Furthermore, since the relative difference in laminate modulus values is greater than the difference in joint strengths, the strain-to-failure for the pat- tern A joint is actually 7 percent greater than that for pattern B. Thus, two key points cannot be over-

iooked during the design process for composite joints: (I) an increase in unnotched laminate strength does not translate into an equivalent increase in joint strength; and (2) where the laminate fiber pattern is still a design variable, optimizing the joint for maximum strain d x s not guarantee the highest strength or most weight-efficient design. The principal parameter governing the ci-ign of composite bolted joints is the amount of load that must be transferred, not the operating strain level of the adjacent structure.
LOAD-DEFLECTION PROPERTlES
The loaded-hole tests were also used to determine the load-deflection characteristics of single-bolt com- posite joints. As discussed in Section 2, these properties are required as input data for use in performing the load-sharing analyses for multirow bolted joints. Most of the configurations tested in Phase 11 were sufficiently different from those of Phase I to provide a valuable addition to theexistingdatabase and to further verify the accuracy of the methods developed during Phase I for the prediction of elastic spring rates.
The measured spring rates for the Phase 11 tests are plotted against the analytically predicted values in Figure 18. The tested values shown are the average results of three identical specimens, while the predicted values were calculated from the aforementioned semiempirical equation developed in Phase I. With the 45-degree line on the plot representing perfect correlation, these results were very encouraging in that good correlation was again demonstrated between predictions and tested values ?or those specimens with composite skins and splices (in all but one test series), the variations between the tested averages and predicted values were less than the amount of scatter between test results among the sets of identical specimens.
This was not the case for specimens with composite skins and titanium splice plates for which the tested spring rates were somewhat greater than corresponding predictions. These differences between test and analysis, while not overly significant, should be accounted for in the analysis of multirow joints using similar configurations. To speculate, the higher spring rates may be the result of several phenomena. The iiidnium joint members maintained a measurably closer hole tolerance or were closer to "net-fit" than similar composite parts. This may have provided a more rigid foundation for the fastener, restric- ting the elastic bending of the bolt and producing a higher spring rate. It should also be noted that the general trend, as shown in Figure 18, was for the tested spring rates to fall above the predicted values - somewhat in contrast to the Phase 1 results. The slightly higher stiffnesses for the Phase I1 tests may have resulted from the higher fastener torque values used in this series which, if nothing else, would increase the friction force between plates and produce a stiffer load path.
Parametric studies were conducted throughout the program to evaluate the effects of variations in joint geometries on the resulting elastic spring rates. Using the equation developed during Phase I, plots were constructed as shown in Figure 19 to analytically predict these effects. In general terms, the elastic spring rates are a function of the joint material properties, the bolt-diameter-to-skin-thickness ratio, and the skin-to-splice-plate-thickness ratio. Where the splices are very thin with respect to the bolt diameter, the stiffness of the load path remains relatively low due to high bearing stresses. When the splice plates become tw thick, a drop in the elastic spring rate is predicted because of excessive bolt bending. Maxi- mum stiffness exists somewhere in between these two extremes, as sh jwn in Figure 19, depending on the relative dimensions and sizes of the joint components.

BOLT BENDING
During the Phase I investigation, several single-row and multirow joint specimens suffered "premature" failures due to bending of the fasteners. One such failure is shown in Figure 20, where the severe bolt bending eventually led to failure of the fasteners in combined shear and tension, or to shear failure of the threads between the shear-head nuts and fasteners. In nearly every case, these failures resulted from an overestimation of the fastenerstrtngths, rather than by underestimating thestrength of the composite members. Bolt bending failures (defined here as caused by a severe plastic bending of the fasteners) were observed at load levels as low as 50 percent of the rated fastener shear strength. Thus, a routine evaiuation of the fastener size solely on the basis of shear strength proved to be inadequate.
The potential for bolt bending failures can often be more significant for highly loaded composite struc- tures than for metallic components. Because of the lower efficiency levels attainable with bolted joints in composites compared with metallic structures (Figure 3), highly loaded composite members can often require more thickness than a metal counterpart for an equal amount of load transfer. As the fastener diameter decreases with respect to !he joint member thicknesses (decreasing diameter/thickness, or d/t ratio), the additional eccentricity leads to an increase in fastener bending deflections for a given load level. Furthermore, any increase in elastic bending deflections will contribute to the loss of clamp-up, and lower the effective bsnrhg stress allowables, as discussed earlier in the section on Strength Prop- erties.
Design guidelines for the selection of fastener sizes typically have been based on the fastener shear strength and on some limitation of the allowable d/t ratio. However, such a broad criterion can some- times be either unconservative or overly conservative, depending on the relative dimensions of the members to be joined and the splicing material through which the load is transferred. The chart shown in Figure 21 was developed in an effort to provide a more comprehensive method of selecting fastener sizes, with consideration given to the bearing strengths of the materials to be joined, the fastener shear strength, and the potential for bolt bending failures. The bolt bending failure curves were derived from limited test results and assume that the bending failures are a function of the d/t ratio for both the skin and splice members (Reference 9).
Figure 21 was developed for double shear joints and is nondimensionalized, except for the center skin bearing stress allowables which are plotted in units of ksi. The chart shows that for low values of d/t2 (where t 2 is the thickness of one splice plate), a d/t, (for the central skin) of roughly 1.0 is near optimum for bearing stress allowables that are typical of composite joints. The bending failure curves show that at low d/t ratios for both the skin and splice plates, bolt bending failures can occur at low percentages of the joint member bearing strengths and fastener shear strengths. As the d/tz ratio increases, the propen- sity for bolt bending failures decreases due to the lower eccentricity, and the fastener shear strength becomes the limiting factor. Eventually, as the d/t, ratio become large, the splice plate bearing strengths become the strength cutoff, as indicated by the dashed lines to the upper left in Figure 21, I t should be noted that the bolt bending curves on this chart are approximate, and will likely require modification as more test data are obtained. All potential failure modes can be included on this chart except, of course, for net-section failures, which must be calculated separately.


GROSS SECTION STRESS (KSI)
20
4 0.006 2S PFRCEMT O-#OME PATTLRH
CAMOWXPOXV U Y M T E S t - 6.88 I lo' n, - 0.005
F, - 50.80 K U
GROSS SECTION StRAW - 0.003
- 0.002
0.25.IWCH BOLTS
0 0.2 0.4 0.6 0.8 1 .O
MAMETER-TO-WIDTH RATK) (d/w)
FIGURE 15. BOLTED COMPOSITE JOINT EFFICIENCY CHART (25PEhCENT 0-DEGREE PLIES)
GROSS SECTION STRESS (KSI)
37.5 PERCENT 0-MORE€ PATTERN CARKm-EmXY LAYMATES
E - 9.19 = 10' PSI
F, - 78.75 U S
UNLOADLO MOLES
0.25-INCH BOLTS
GROSS S E C T W STRAIN
0.002
- 0 0.2 0.4 0.6 0.8 1 .O
DIAMETER-TO-WIDTH RATK) (d/w)
FIGURE 16. BOLTEQ COMPOSITE JOINT EFFICIENCY CHART (37.SPERCENT OOEGREE PLIES)

PATTERN A = (25% O', 50% ~45'~ 25% 90') E = 7.4 x lo6 8 PATTERN 0 = (37.5% 0'- 50% *45*, 12.5% 90') E = 9.3 x lo6
m - 3 - .,(, ,.: ;: :...:
UNNOTCHED TENSION STRENGTH ULTIMATE STRENGTH FAILURE STRAiH
BEARING LOAD
BYPASS LGAD
FIGURE 17. EFFECT OF F I W R PATTERN O N MULTIROW JOINT STRENGTH AND STRAIN LEVELS
PATTERN A - (25% 0 ' . 50% e45'.
PATTERN B - (37.5% 0'. 50% 245'. / 1.6 12.5% 90') rp
" 9/ " I
PREDICTED SPRING RATES (LEAN. x lo6)
1.2 TESTED SPRING RATES (LWIN. x 106)
0.8
0.4
FIGURE 18. BOLTED JOINT ELASTIC SPRING RATES -PHASE I1 DOUBLE SHEAR TEST VEilSUS PREDICTION
- /- O d - 0.375. t i = 0.333. 12 = 0.167. PAT A / g .d = 0 375, t l = 0.333, t2 = 0 167. PAT 6
/ e d = 0 375, ti = 0.333. t2 - 0.250, PAT B a / - d / A d = 0.750, t l = 0.666. 12 = 0.333. PAT A /
/ A d - 0.750. 11 = 0.666. 12 - 0.333. PAT 8
/ F d = 0.750. t i - 0.666. 12 = 0.499, PAT A / - / r d = 0.750. 11 = 0.666, t2 - 0 499. PAT 8
/ a d - 0.750,tl = 0.666. 12 = 0.375, PAT 8 w/ti / - / 8 d = 0.500. 11 = 0.499. 12 = 0.250, PAT B w/t~
/ o / . . a
Od - 0.500. t i = J.499. 12 - 0.333. PAT B 1 1 1 1 a . 1
0 0.4 0.8 1.2 1.6 2.0 2.4 2.8 3.0


1.00 wnn
R
BOLT SHEAR 0.75 LOAD RATIO
(FAILURE LOAD/ FASTENER SHEAR 0.50
STRENGTH)
0.25
0 0 0.50 1 .OO 1 .50 2.0
CENTER SKIN THICKNESS/BOLT DIAMETER ( t l / d )
FIGURE 21. APPROXIMATE SINGLE-ROW JOINT ALLOWAPCES

SECTION 3
TECHNOLOGY DLMONSTRATION TEST PROCRA<?
The Phase I1 test program concluded with a series of large multirow bolted joim yxcimens represen- tative of the lower rear spar splice at the side of the fuselage as described in Sectiufi 3. Because of the complexity of this portion of the structure, a technology demor~stration test program was formulated to investigate portions of this area individually. The test program is described praphically in Figure 22. The stringer transition joint was tested as a separate specimen, while portions of the corner joint representing the skin-spar cap and spar web splices were tested as subcomponents. The test program culminated with the testing of a large bolted joint specimen representing the entire skin and spar corner splice, without including the stringer transition.
This approach to the test program was adopted for several reasons. The greater comolexity of represen- tative structure compared with the relatively simple joints tested in Phase I required further developme~t of the analysis methodology. By testing several individual components of the corner joint structure, the accuracy of the selected analyticai approach could be evaluated prior to the large technology demonstra- tion test. In addit: n, the strength of these individual portions of the structure and the efficiency of the chosen design colicepts could be measured more directly by these individual tests. This was particularly appropriate for the stringer transition joint test in which the strength of the stringer blsde transition was demonstrated to exceed that of the bolted splice. Th: technalogy demonstration test was a final verifica- tion of the design concepts. manufacturing methods, and analytical approach.
All of the Phase I1 multirow joint tests were static tension tests. Each specimen was loaded to what was considered a ''limit load" level, after which the specimen was inspected visually to emure that no premature failures or damage had taken place. AII of the joint members representing the wing cover panel structure were composite laminates made with the Ciba-Geigy 914/T300 material system in 10-mil tape form. The splice plates for each specimen were metallic, made either of alumir~um or titanium. In each case, the laminate fiber pattern was (37.5% 0". 50% k 45", 12.5% 90"). All fasteners were made of titanium.
STRINGER TRANSITION TEST
The stringer transition joint was the first of the multirow bolted joints to be tested in Phase 11. The con- c:pt shown in Figure 23 represents the lower wing skin with an integral blade stringer which transitions into a bolttd shear joint at the side of the fuselage. The stringer blade is scarfed along the length of the bolted joint whilea thickness buildup is introduced in both theskin and thestringer. The transition is ini- tiated just beyond the first row of fasteners in the skin splice to maximize the bypass load at the critical row of fasteners.
Several design concepts were considered far the stringer joint. The objective was to develop a concept which would be appropriate not only for 1 .1 . side of the fuselage splice but for any portion of the wing structur where a stringer runout or transition 's required. Further, the selected concept was to be of minimum complexity from a manufacturing standpoint while mai,.taininp a satisfactory level of struc- tural integrity. After evaluating several candidate design concepts, the scarfed stringer apprqach was selected. This method eliminates the need for a bolted connection through the stringer blade itself, greatly simplifying the fabrication and assembly requirements.
31 PRECEDING PAGE BLANK NOT FILMED

The primary concern for this design was the strength at the tip o l the stringer transition where the high load transfer combined with stress concentration effect could lead to critical out-of-plane forces. To counteract these effects, continuous plies were maintained wherever possible and thickness tranjitions were achieved with taper angles that were shallow enough to redwe the inherent peel forces below critical levels. The section was laid up with the stringer blade ~t full depth, and was later machine- tapered.
Tapered titanium splice plates were used to transfer the load into the composite structure. The titanium fasteners varied in diameter from 7/ 16 inch at the thin end of the splice to 5/8 inch at the thick end. The composite skin and blade sections outside the joint were nominally 0.504 inch and 0.426 inch, respec- tively. These features were incorporated in the design in an attempt to optimize the bolt load distribu- tions and maximize the strength of the joint. The skin-stringer combination wa!: designed to an ultimate design strain level of roughly 0.005 inch/inch (or 46,500 psi) for the lower wing surface.
The stringer joint specimen is shown in Figure 24 fully assembled and mounted in the test machine. The specimen was fabricated with a stringer transition at each end, and the titanium splice plates were extended to form the points of attachment to the test machine. This greatly simplified the specimen and its assembly by combining the end fitting joints with the test section(s). One end of the specimen was equipped with axial strain gages to monitor joint load d~stributions throughout the test, while the other end was coated with a photoelastic naterial.
The photoelastic coating was used to provide a qualitative assessment of the structural response and to identify any unforeseen areas of high stress intensity. I t is possible to obtain quite accurate stress-strain measurements using this technique. (Through the use of a polariscope, the fringe orders can be measured to within 0.01 fringes, where each fringe indicates a variation of 10,000 psi. However, this level of accuracy was unnecessary for this specimen since it was possible to mount strain gages at the other [identical] end).
Photographs of the coated regions were tcken at several load levels throughout the test. The photograph shown in Figure 25(a) shows the variation in stress for the constant-thickness blade frcm the skin surface to the top of the section. The change in direction or "bend" in the fringe patterns just outside the bolted joint results from the increase in thickness which occurs simultaneously in the skin and stringer at that point. (The mess level is increasing from the edge of the blade towards the skin.) A slight decrease in stress level is also visible in the blade section along the length of the bobed joint as the load in the com- posite member is transferred into the splice piates. Strain gages mounted at the other end of the specimen confirm the load distributions as indicated by the photoelastic survey.
The photograph shown in Figure 25(b) illustrates the stress distributions on the surface of the upper titanium splice plate and along the edge of the stringer blade. The tip of the stringer transition had been identified as a potentially critical location, and the photoelastic coating clearly showed the sharp increase in stress level at that pcint. This view also shows the complex stress field on the surface of the titanium splice member. This condition, resulting from the conlbination of stress concentrations (due to fastener holes and spotfacing), hole shadowing (regions of low stress between fasteners), and a thickness transi- tion illustrate the difficulty in placing a strain gage on the surface of such a member to monitor the bolt load distributions along a multirow bolted joint.

Though the conclusions that can be drawn from the photoelastic measurements are primarily quan- titaiive, the stress distributions in each member as indicated by the coating provide useful information regarding the specimen structural behavior which can also be used for correlation with analytically predicted trends. A complete set of photographs from this test are presented in Reference 10.
The joint transition specimen was tested to static failure at an ultimate load of 197,200 pounds, or at a running load intensity of about 34,300 pounds per inch. This corresponds to an average gross-section stress and strain level of roughly 50,000 psi and 5,300 microstrain in the basic section, prior to the thickness buildup outside the joint. It should be noted that these "average" values are for the entire cross-section, which is actually varying in stress and strain level from the base of the skin to the top of the stringer blade. Strain gages mounted on the skin outside the build-up indicated a strain level of about 5,900 microstrain, which would correspond to a strain level in the thicker section at the bolted joint of roughly 4,700 microstrain. The Young's nlodulus for the test laminate was 9.3 x lo6 psi.
The specimen failed in net-section tension through the first (outermost) row of fasteners at a high- bypass, low-bearing load combination, followed by tension failure through the minimum section of the stringer blade (Figure 26). Analytical predictions of the failure mode and location correlated precisely with the test results. This test was very successful in that the merits of both the design concept and fabrication methods were demonstrated, and the accuracy of the analysis methodology was verified. Detailed discussions of the analysis methods and analysis/test correlation are prsented in Sections 6 and 7.
DEMONSTRATION SUBCOMPONENT TESTS
In addition to the stringer transition specimen, selected portions of the corner joint were tested indi- vidually as "subcomponents" of the larger structure. The primary purpose of these tests was to provide additional confidence in the recently developed analvtical methods. The subcomponent specimen shown in Figure 27, one of two to be teszed, represents the portion of the wing skin and spar cap splice below the aluminum corner fitting. An additional subcomponent specimen (not shown) was tested as a representative portion of the spar and stiffener web sections which were spliced externally by a titanium splice and inte~ .?ally by the aluminum ccrner fitting. The member thicknesses, fastener sizes, and overall joint geometry of the subcomponent specimens were identical to the corresponding portions of the technology demonstration joint (see the following section, Technoiogy Demonstration Test).
The two demonstration subcomponent specimens were tested in static tension to failure, resulting in net- section tension failures through the first row of fasteners as shown in Figures 28 and 29, The failure modes and locations were correctly predicted analytically. The specimen shown in Figure 28 consisted of two composite plates, each 1/2-inch thick, representing the wing skin and spar cap members. Tapered titanium splice plates were attached on either side of the laminates, and an aluminum tension fitting representative of the demonstration joint corner fitting was mounted above one splice and attached at the specimen centerline with two load-indicating tension bolts. The failure occurred at an applied load of 270,000 pounds. This corresponds to a gross-section stress and strain level of about 47,500psi and 5,100 microstrain for the composite members.
The smaller subcomponent specimen shown in Figure 29 consisted of a 1/2-inch thick laminate repre- senting the vertical leg of the spar cap, while a thinner laminate roughly 1/3 inch thick represented the stiffener web. In this case, the aluminum fitting is the only means of load transfer on one side of the joint through the tenslon fastener between fittings. A tapered titanium splice was used on the opposite side.

Failure occurred at an applied load of 1 15,400 pounds, corresponding to a gross-section stress of 46,200 psi and a strain level of 4,970 microstrain The failure mode was again a net-section failure in the two composite members through the first rou of bolts, as shown in Figure 29.
The successful testing of the two subcomponent specimens provided a sufficient level of \.onfidence in both the design approach and analysis methodology to proceed with the design and fabrication of the technology demonstrat;on joint. The analysis of these two specimens included the first attempts at predicting load-sharing through several layers of material in a multirow joint using a scmiempirical, finite-element approach. Fastener modeling techniques were modified in order to properly represent the joint load-deflection characteristics at each fastener location (see Section 6) without inducing any addi- tional loads due to secondary effects.
The correlation between strength predictions and test results for the two subcomponent specimens verified the effectiveness of these analytical modeling techniques, and the performance of the two specimens demonstratej the overall design approach. These results provided a sufficient level of con- fidence in the recently developed methodology to confidently perform the load-sharing analysis and subsequent strength predictions for the larger and more complex technology demonstration specimen.
TECHNOLOGY DEMONSTRATION TEST
The Phase 11 test program culminated in a static tension test of a large bolted joint representing the lower rear spar and wing skin splice at the side of the fuselage attachment. The original design concept for the
test specimen in shown in Figure 30. The composite joint structure consisted of the wing skin, s p s cap, and spar web members. All of the splice plates and fittings were made of aluminum and ti:anium, for the reason discussed in Section 3. The splice members were tapered and fastener sizes were selected in an attempt to optimize the bolt load distributions arid maximize the joint strength. The standing leg of the titanium "tee9* splice at the spt5men centerline represents the attachment to the side of the fuselage bulkhead where the outboard wing structure is spliced to a center wing box.
The specimen presented a challenging task from both an engineering and manufacturing standpoint. In an effort to reduce the complexity and cost of the structural test, the dihedral and sweep break of the actual baseline wing design were not included in the specimen. Neveriheless, the asymmetric nature of the specimen warranted the use of side restraints at the specimen centerline to restrict out-of-plane deflections which would not be present in an actual wing box structure. The specimen end fittings were designed to minimize these effects by adjusting the center" e of applied load toward the test section center of mass. All of the composite j o i ~ r members were fabricates with the same 10-mil tape materialas previous specimens, using the 37.5 percent 0-degree fiber pattern.
The technology demonstration test article is shown in Figure 3 1 in the process of being assembled. All of the composite joint members were flat plates except for the spar cap membprs which were angle sections. The spar capsections were fabricated on an aluminum male tool which had the required thickness transi- tions machined into the tool surface. Figure 32 shows a closeup view of the joint test section with one side fully assembled. Titanium fasteners were used in all cases and the tapered metallic surfaces were spot- faced to accommodate fastener seating.

The specimen was equipped with 25 axial strain gages to monitor the joint performance throughout the test. The gages were used primarily to measure the load ,'istribution between joint members, although several gages were located along the edges of the members between fastener rows to evaluate the load- sharing between layers. The specimen is shown in Figure 33 with the strain gages attached, ready for installation in the test machine.
The overall test setup is shown in Figure 34. The specimen is attached to the test machine through a standard pin loading arrangement. A dual actuator system with two 500,000-pound-capacity load cells was used to apply the test loads.
The static test began with a limit-load test, during which the specimen was loaded to 300,000 pounds in axial tension followed by a return to zero load. The specimen was then inspected visually and no flaws or damage were found. The test wtlck was ;h:n loaded continuously to failure, which occurred at a load of 488,000 pou~ds. Although this failure load was roughl, 92 percent of the predicted strength, the failure was located in tht end fitting area away from the joint test section. A closeup. viov of the failure is :t.dvrli
in Figure 35. This view shows that the spar cap member was actually delamiwttd from the thickness buildel 7 on the inner surface of the cap to the first row of fasteners in the end fitting, where a net-section failure aecurred in the reduced thickness of the spar cap member. The skin and spar web members failed through the first row of field fasteners toward the joint test section.
It is not possible to verify the exact cause of failure. However, it does appear that the failure was, in fact, initiated by the delamination of the spar cap member. Once this delamination extended to the first row of fasteners in the end fitting, the effective thickness at the net-section was reduced by approximately one-third to a level which was insufficient to carry the test loads. Once the initial failure of the spar cap occurred, the first row of field fasteners became a point of high load transfer and thc 5nal failure of the skin and spar web members took place. The end fitting failure is graphically represented in F:'gre 36.
A close inspection of the failed members after the test substantiated the initial observations and conclu- sions regarding the cause and mode of failure. (It should be noted that c-scan results for the failed spar cap member prior to the test did produce some questionable results in the region of the delamination.) A typical c-scan of the joint test section taken after the test is shown in Figure 37. Scan results indicate that irreversible damage in the opposite-side spar cap members had taken place, and that the joint test section was close to failing when the premature end fitting failure took place. After reviewing the possible pro- gram options, it was decided to refurbish the failed specimen and conduct another static test. This effort was conducted using Douglas development funds.
After complete visual and nondestructive inspections of the unfailed composite mtmbers were com- pleted, the specimen was reassembled using two 7075-T6 aluminum plates to replace the failed com- posite members. The aluminum parts were machined to the exact thicknesses of the original composite parts, both in the joint test section and the end fitting areas. The refurbished test article, with a view of the aluminum replacement parts, is shown in Figure 38.
Another static test was then conducted, this time with excellerrt results. The specimen failed at an applied load of 484,420pounds with both the failure load and location showing good correlation with analytical predictions. The maximum strain in the composite members, occurring in the spar cap section, was roughly 5,000 microstrain. This corresponds to a far-field stress level of about 46,500 psi. The failure


TABLE 1 PHASE II TEST PRC 3- QM
TECHNOLOGY DEMONSTRAT .V TEST RESULTS
TEST SPECIMEN p- --
STRINGER TRANSITION
SUBCOMPONENT NO. 1
SUBCOMPONENT NO. 2
TECHNOLOGY DEMONSTRATION ARTICLE TEST NO. 1
TECHNOLOGY DEMONST RATION 6RTICLE TEST NO. 2
FAILURE PREDICTED LOAD 1 STRENGTH (LB) (LB)
;ROSS-SECTION STRESS AT
FAILURE (PSI)
50,000'
47.500
46,200
4 3 . i 3 0 (ShtrJ) 45,600 (SPAR)
42.800 (SKIN) 46,500 (SPAR)
'AVERAGE STRESS IN BASIC SECTION PRIOR TO THICKNESS BUILDUP ' 'CALCULATED STRAIN LEVEL AT BOLTED JOINT AFTER THICKNESS BUILDUP
- 'REFER TO DISCUSSION - PAGE 54 " "'REFER TO DISCUSSION - PAGES 54 AND 55
;ROSS-SECTKM STRAIN AT
FAILURE MICROSTRAIN)
5,891 4.700"
5.100
4,970
4.700 (SKIN)
4.900 (SPAR)
4.600 (SKIN)
5.000 (SPAR)
PREDICTED ST RAIN LEVEL
5.945 NET-SECTION 4,600 T ENSION
4,920 NET-SECTION TENSION
3,900"'
5,110 NET-SECTION ISKIN) I TENSION
NET-SECTION TENSION
5.110 (SKIN)
5,330 (SPAR)
5,330 (SPAR)
END FITTING

SECTION 6 ANALYSIS METHODOLOGY DEVELOPMENT
The analytical methods developed during Phase 1 were sufficient for the analysis of multirow joints of uniform cross-section, or for structures where geometric variations have a minimum influence on the bolt load distributions. Load-sharing analyses using the A4EJ computer program were proven to give accurate results for the prediction of the bolt load distributions and failure loads for the two-row and four-row joints tested in Phase I . The program can predict the load-sharing between fasteners both at the limit of elastic (linear) behavior and after the load redistribution associated with any noncatastrophic initial damage. An iterative solution is performed for the load-sharing between multiple parallel springs (fasteners) and also accounts for the linear or nonlinear deformations of the joint members between fasteners as sets of springs in series. The details of the mathematical model on which the A4EJ sd~ution is based are described in Figure 41.
Strength cutoffs are input to the program for the fasteners in shear or bending, and for the joint members under combined bearing and bypass loads at each fastener location. The bearing-bypass inter- action curves are developed empirically, as discussed in Section 4. Much of the methodology develop ment effort during Phase I1 focused on refining the methods for establishing these strength cutoffs, such as the chart presented earlier in Figure 21 which defines bolt bending allowables as a function of joint geometry.
Although solutions using the A4EJ program were accurate for the analysis of Phase I subcomponent joints, the more complex joints of Phase 11 required a more versatile analysis approach. Accurate load- sharing analyses of structures which have substantial geometric variations in the joint region cannot be performed with simple strip solutions. The A4EJ program is also limited to single-shear or double-shear joints with uniaxial loading. Actual structure is often more complex, with biaxial or triahial stress states and multiple layers of material. The need for a more comprehensive analysis method became evident when considering the andysis approach to be used for the stringer transition specimen. The concept (Figure 23) carries the stringer blade well beyond the first row of fasteners in the bolted joint before tran- sitioning into the skin. While simple analyses using the A4EJ program can provide an estimate of the joint performance, an accurate load-sharing analysis must account for the amount of "bypass" load in the stringer blade versus the bypass load at each fastener hole.
The selected approach was to combine a finite element analysis model with the semiempirical methods developed throughout the program. The concept, illustrated in Figure 42, was to use a finite element model to perform the load-sharing analysis, while the strength cutoffs would still be determined semi- empirically. Figure 42 shows a representation of the finite element model used in the analysis of the stringer transition specimen. The model was constructed using the NASTRAN finite element code, with isotropic and anisotropic elements used to model the metallic and cmposite members, respectively.
Laminate stiffness and unnotched strength properties were calcdated on a ply-by-ply basis. The , fasteners were represented by bending bars with properties which would provide the correct load-
deflection properties (elastic spring rates) based on calculations using the existing semiempirical methods. Bearing-bypass load combinations determined by the model at each fastener location are then compared to empirically derived interaction curves for failure prediction. Nonlinear effects are
d
. * G+ accounted for through successive iterations with altered stiffness properties, based on the same bilinear
: 33

representation of the load-deflection properties at each fastener. Customary failure criteria are used for the unnotched portions of the structure.
!
There is often a tendency to use finite element analysis methods at excessive levels of detail, resulting in unnecessarily high costs. It was therefore an objective of the analysis development effort to perform accurate strength predictions while minimizing the complexity of the approach. Since the stringer transi-
\
tion joint was the first to be tested, a relatively coarse grid model was constructed to model its behavior. It should be noted that the finite element model was not used to examine the stress concentration effects at the fastener holes. The bearing-bypass curves determined by semiempirical methods fully account for these effects, so the finite element model need only perform the load-sharing analysis to determine bolt load distributions.
The initial modeling approach shown in Figure 42 had the fastener elements attaching directly to the plate elements which represented each joint member. At first, no material was removed where the fastener holes were located. This approach was eventually shown to be somewhat oversimplified for several reasons. In the case of the stringer transition analysis, the amount of bypass load on either side of the fastener hole was critical to performing an accurate strength prediction. (,See discussion of anaysis/test correlation for stringer joint in Section 7.) In addition, the stiffness of the joint members are more correctly represented by removing material for the fastener holes.
This approach also facilitated the modeling of fasteners for the analysis of the demonstration subcom- ponent specimens and the technology demonstration article. By removing the material at the fastener holes, the bolts are more readily represented through multiple layers of material and can easily be modeled to account for biaxial or off-axis loading. The individual fasteners are represented by simple bending bars which are given bending stiffness properties derived from load-deflection calculations or from single-row test results.
Following the analysis of the stringer transition joint, all subsequent analysis models reflected the refinements discussed above. An exploded view of the finite element model used for the analysis of the technology demonstration specimen is shown in Figure 43. This model is somewhat more detailed than the stringer joint model, particularly in the region of fastener holes where a reasonable representation of the true net-section area (stiffness) was desired. The analytical model was reacted at the test specimen centerline and uniform displacements were enforced on the skin, spar cap, and spar web members to generale tne applied tension loads,
The key to this analysis approach is the use of finite element analysis in combination with semiempirical methods. By using the finite element niodel to perform only the load-sharing analysis, the model com- plexity and cost can be kept to a minimum. More detail can be used where correlation with strain gage data is required, or for structural details or areas of potentially high stress intensity other than the bolted joint which require a detailed stress analysis. The orthotropic elements of a NASTRAN can properly ac- count for any biaxial effects, which may otherwise be difficult to predict with simpler methods when highly orthotropic fiber patterns are used. Although methods for determining bearing-bypass inter- action curves under biaxial loads have not been presented here, any method such as the BJSFM program (discussed earlier) can be used, in conjunction with the load-sharing analysis model, to calculate the strength envelopes at each fastener location.

ORIGINAL PAGE IS R q y A m The fdlowing section will present the correlation &ZRRe a a ysls and test results for the multirow
joints tested in Phase 11. While goou ,melation is shown in each case, the intent here is not to replace the simpler analytical methods with the more complex approach using finite elements. The most simple and cost effective analysis method that will result in accurate strength predictions should always be selected, depending of course on the complexity of the structure to be analyzed.
I I
h+Z FASTENER STAT. ON
i B. FREE-BODY DIAGRAMS REFEREYCE STATI?N ( k t 0
MUTION 4 I
FINAL SHEAR DEFORMATION * AT AN0 AROUND = 6 2 ( ~ ) - 6 1 ( ~ )
i FASTENER
I d t w )
C. DISPLACEMENTS UNDER LOAD '
FIGURE 41. LOADS AND DEFORMATIONS ON ELEMENTS OF BOLTED JOINTS


SECTION 7 AN ALYSIS/TEST CORRELATION
Finite element analyses were combined with semiempirical methods to make strength predictions for each of the four multirow joints tested in Phase 11. The finiteelement models were used to determine the load-sharing between joint members and the bolt load distributions in the joint itself. In some cases, the models were used to predict strain levels for specific portions of each joint member. Bearing-bypass loads from the finite element solutions were compared with semiempirically derived interaction curves to predict the failure load for each specimen. In general, good correlation was demonstrated between analytical predictions and test results. Average data from ancillary tests were used for input to the multirow analyses.
The joint transition specimen analysis was based on the NASTRAN finite element model shown in Figure 42 which was used to determine the stress distribution in the composite skin and stringer blade and to solve for the load-sharing between rows of fasteners. Two iterations were required to account for the change in stiffness (nonlinearily) due to a predicted bearing yield in the titanium splice plates at the first row of fasteners.
As discussed in Section 6, the finite eleme~t approach was necesscry for this analysis to properly account for the amount of load carried in the stringer blade beyond the first row of fasteners in the bolted joint. This concept is illustrated graphically in Figure 44. The amount of load passing through the stringer blade at point C must be determined by the finite element model in order to predict the loads in the skin at points A and B which bypass the fastener hole. This effect must beaccounted for at each fastener loca- tion so that strength checks can be made using the proper bearing-bypass load combinations, which are then compared to the associated interaction curves.
The nature of the stringer transition structure is such that there may be a difference in the amount of load transferred around the hole at points A and B. Since there is a substantial difference in the net area and the stress concentration effects between the inr;,sr and outer sides of the fastener hole, this difference in load (if any) must also be determined before an accurate qtresqth prediction can be made.
The completed analysis solution predicted a net-section tension failure through the first row of fasteners at an ultimate load of 183,700 pounds (Figure 45). This predicted strength is roughly 5 percent below the tested value of 193,200 pounds. The predicted failure mode correlated precisely with the test results, as described earlier in Section 5. The strain level in the composite skin away from the joint (before the
L buildup in thickness) was monitored throughout the test. The measured strain at failure of 5,891 microstrain is quite close to the predicted value of 5,945. This corresponds to a difference of roughly 500 psi between the predicted stress level at failure of 55,290 psi and the tested stress level of 54,790 psi.
Analysis models wereconstructed for each of the two subcomponent specimens, with each joint member represented in its actual geometry. The modeling approach was modified for these two specimens to more properly represent the fistener holes by removing material from each plate element in an amount roughly equal to the area of the bolt hole. This gave a more accurate model of the joint member stiff- nesses and allowed the use of a revised approach for modeling the fasteners. The new approach consisted
4
:- of bending elements representing the bolts with axial bars attached at each end to react the shear load
,,;
transfer to the joint members. This method allowed the simplest means for modeling the fasteners

through several layers of material. Since the stress concentration effects due to the fastener holes need not be examined by the finite element model, the holes can be represented in a gross sense, with a minimum of detail.
The analysis results for the subcomponent joint representing the wing skin and spar cap members are illustrated in Figure 46. A net-section tension failure through the first row of fasteners was predicted to occur at an ultimate load of 260,000 pounds. This failure mode correlates precisely with the test results (Figure 28), and the strength prediction falls within 4 percent of the testel value of 270,000 pounds. These two values are easily within the range of results that may result from variations in material proper- ties and fastener hole tolerances. Strain readings were taken at selected locations throughout the joint and were compared with predicted strain levels from the analytical model with generally good correla- tion. (A complete set of load versus strain plots including the predicted values are contained in Reference 10.)
The small subcomponent representing the spar cap and spar web members was analyzed in a similar fashion, with the predicted failure mode again being a net-section failure through the first fastener row. Although this correlated well with the test resdts (Figure 29), the predicted strength was about 28 per- cent below the tested failure load. After reviewing the finite element results for thisanalysis, it was found that the model was predicting a substantial difference in strain level betwesn the two composite members. Intuitively, this was not a logical result, and it was eventually determined that the end condi- tions of the test specimen had not been properly represented. This allowed unrealistic deformations to take place, resulting in the overly conservative analysis result.
Based on the analysis correlation achieved to this point in the program, the same techniques were used to perform the strength analysis for the technology demonstration article. Although the demonstration article was more complex than previous specimens, the loading was primarily uniaxial and the bearing- bypass curves based on existing ancillary data were again used as the failure criteria for each fastener hole along with the bolt shear and bending allowables. The magnitudes of the bearing and bypass loads at each fastener were extracted from the model and compared to the corresponding interaction curve. The results of this evaluation indicated that the critical location was the first (outermost) row of fasteners in the wing skin member, although the spar cap member was very close to its predicted failure load for the same applied load level. The predicted ultimate load was 531,000 pounds.
The completed analysis indicated that some nonlinear effects were anticipated prior to failure. A slight amount of bearing yield at several locations in the titanium splice plates was predicted at load levels just below ultimate, and far above what could be considered limit load. The failure of the second static test actually occurr~d at an applied load of 484,420 pounds, roughly 92 percent of the predicted strength. The bearing-bypass curve presented in Figure 47 shows the test results and analytical predictions for the first row of fasteners in the spar cap member. The actual failure is shown to have occurred at a lower load level than had been predicted, but this result is a least partially attributable to the difference in overall load sharing between joint members. While the analysis model predicted nearly equal load sharing bet- ween the wirig skin and spar cap members, the test results (discussed earlier in Section 5) indicated that the spar cap member was working to about a 10-percent-higher stress level than the skin.
This slight difference between the analysis and test resu!ts may hayo wurred for sel -ral reasons. The analysis model did not include a detailed representation of the specii,ren end fittings, which could have affected the load sharing between the skin and spar. The load redistribution which may have resulted

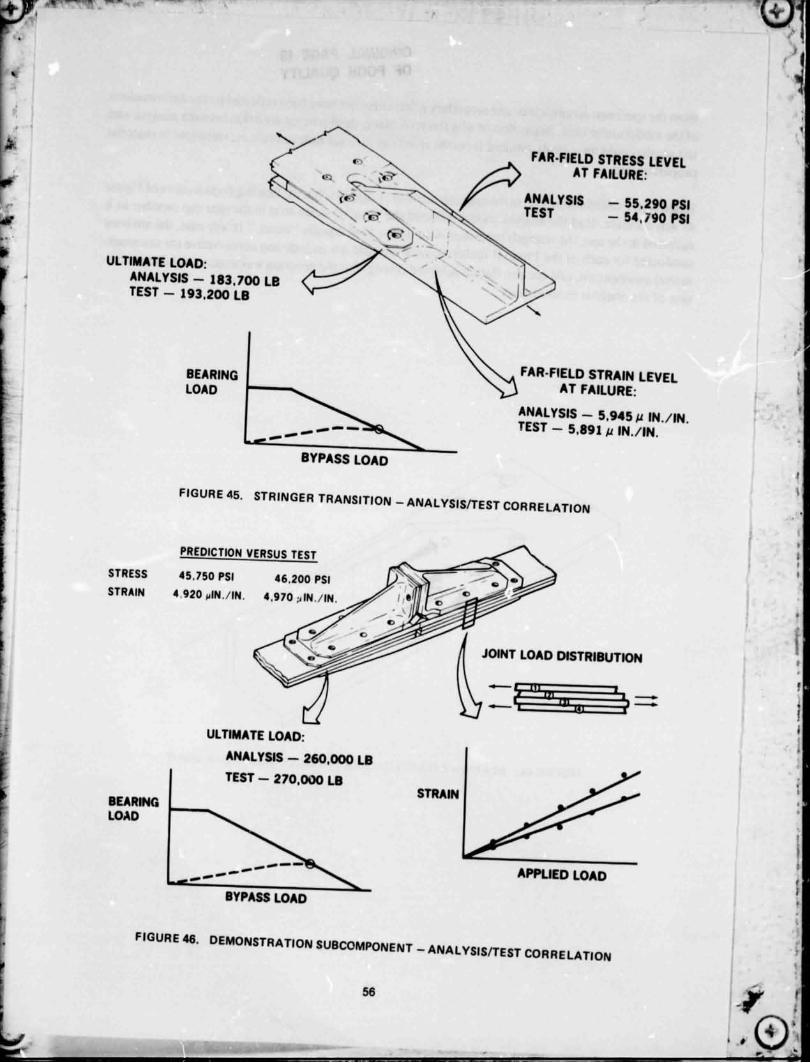

TECHNOLOGY DEMONSTRATION JOINT ANALYSIS BEARING-BYPASS INTERACTIONS SPAR CAP MEMBER - FIRST ROW OF FASTENERS
30,060 r TESTED SPAR CAP FAILURE LOAD = PREDICTED VALUE (PORTION OF LOAD CARRIED BY SKIN < PREDICTED VALUE)
1 ANALYSIS: = fshin
BEARING LOAD (POUNDS)
BEARING YIELD PREDICTED FAILURE
IN SPLICE PL' .'E- OF SPAR CAP
0 10,000 20,000 30,000 40,000 50,000
BVPASS LOAD (POUNDS)
FIGURE 47. BEARING-BYPASS INTERACTIONS - TECHNOLOGY DEMONSTRATION TEST

SECTION 8 CONCLUSIONS
The results obtained in :his program have demmstrated the ability to design and fabricate critical struc- tural joints for large composite wing structure representative of a commercial transport aircraft. The analysis methods developed throughout the program were shown to give reliable strength predictions for large multirow bolted joints in fibrous composite laminates. Gross-section stress levels on the order of 45,000 to 50,000 psi and corresponding strain levels of 4,700 to 5 . 0 0 microstrain were achieved in most cases.
The key to maximizing the strength of bolted composite joints is in restricting the bearing stresses at the most critically load-!-J locations. For constant-thickness skins, the critical location for tensioh failures will typically be the outermost row of fasteners where the combination of bearing and bypass loads is the highest. The nature of bearing-bypass interactions in most composite laminates is such that the highest strength will be attained by minimizing the bearkg load at the first row of bolts, and maximizing thp bypass load which can then be transferred by the remaining fast :ner rows.
The most efficient joint designs have uniform-thickness skins in combination with tapered splice plates and tailored fastener sizes in order to~chieve the desired bolt load distributions. The use of unreinforcd skins also facilitates straightforward bolted repairs in areas away from the joint. Thickoess buildups at bolted joints are perm~tted if warranted by the design, as long as the basic structure outside the joint is not so highly stressed as to make it unrepairable.
The strength of multirow bolted joints in composite s t rsdres is governed by the associated bearing- bypass load interaction under tensile or compressive loads. However, the poten:ial for fastener failures either in shear or bending should not be overiooked. An accurate load-sharing analysis method, such as tne A4EJ program, is required to perform accurate strength predictions, which can account for any nanlinear effects which may influence the bolt load distributions. For more complex joint structure, such solutions can be achieved through the use of finite element analyses in combination with semi- empirical met hods.
The design of critical joints in highly loaded composite wing structure may often be the limiting factor in establishing idtimate design strain levels. Thus, the joint designs should be optimized first, before the "basic" structural concepts are selected, to ensure that the final configuration can withstand the design loads at each critical joint and to preserve the inherent repairability of the structure. This approach will avoid any compromises in the joint designs which would eventually result in a lower overall structural efficiency. For transport wing structure, any small extra weight in the splice plate material or fasteners is worth incurring in order to maximize the efficiency of the heavy skins. Metal materials are often the best choice for splice plate design, particularly where the potential exists for critical interlaminar or out-of- plane forces.
Not all joint geometries or load conditions were examined during this program, arid a substantial body of work remiins. The multirow compression joints testcj during Phase 1 identified new failure modes which warrant further investigation. All of the joint tests discussed here were subjected to uniaxial loads. In actual structure, biaxial or triaxial stress states are often encountered, and efforts toward the develop- ment of methodoloqy which can account for these effects must continue. Dcspite the relative csmplexit y of the technology demonstration joint test, the performance or behavior of an actual wing box structure
58 1'KECEUING PAGE BLANK NOT FILMED
is substantially more complex. Unexpected forces due to secondary effects can often arise which are dif- ficult, if not impossible, to predict analyiically. Only the successful testing of a representative wing box structure would provide a sufficient level of confidence in the selected joint design concepts.
The high gross-section strains exhibited by the bolted joints tested in this program indicate that highly loaded bolted joints in primary composite structures are feasible. However, the design, analysis, and manufwture of such structure require more attention to detail than for ductile metal alloys. The op- timum designs and trends presented here are not all-inclusive, and the results of thr parametric studies used to develop these trends will change with the evolution of more advanced and improved material systems.

SECTION 9 REFERENCES
Bunin, B. L. and Sagui, R. L,, Critical Joints in Large Composite Primary Aircraft Structures, Volume 111 - Ancillary Dats Test Results, NASA-CR-172588, 1985.
Bunin, B. L., Critical Composite Joint Subcomponents - Analysis and Test Results, NASA CR-3711, September 1983.
Hart-Smith, L. J., Bolted Jcints in Graphite-Epoxy Composites, NASA CR-144899, January 1976.
!.kart-Smith, L. J., Design Methodology for Bonded-Bolted Composite Joints, USAF Contract Report AFWAL-TR-81-3154, Vols.1 and 11, February 1982. (Available from DTIC as AD A1 17 342.)
Nelson, W. D., Bunin, B. L. and Hart-Smith, L. J., Critical Joints in Large Composite Aircraft Structure, NASA CR-3710, August 19Li..
Garbo, S. P. and Ogonowski, J. M., Effect of Variance and Manufacturing Tolerances on the Design Strength and Life of Mechanically Fastened Compos~te Joints, USAF Contract Report AFWAL-TR-81-3041, Vols.1-IV, April 1981.
Hart-Smith, L. J., Mechanically Fastened Joints for Advanced Composites - Phenomenological Considerations and Simple Analyses, Douglas Aircraft Company Paper 6748A presented to the Fourth Conference on Fibrous Composites in Structural Design, San Diego, California, November 1978.
Tate, M. B. and Rosenfeld, S. J., Preliminary Investigation of the Loads Carried by Indiv'dual Bolts in Bolted Joints, NACA TN 105 1, May 1946.
Bunin, B. I ,, Studies on Highly Loaded Bolted Joints in Composite Structures, Douglas Aircraft Compd .y Paper 741 8 presented to the 2% h National SAMPE Symposium and Exhibition, Reno, Nevada, April 1984.
Bunin, B. L., Critical Joints in Large Composite Primary Aircraft Structures, Volume I1 - Technology Demonstration Test Report, NAS. \ CR-172587, 1985.

I . R~port No. I 2. Gomnmmt No, 3. Rnipirnt's Cltslg No. NASA CR-3914 I -
6. T~rle and Subt~tlr C r i ti ca: J o i n t s i n Large Composite Primary A i r c r a f t S t ruc tu res
Nat iona l Aeronautics & Space Admin is t ra t ion C 14 Sponw~ng Apcncv Cod.
Washington D.C., 20546 534-03- 13-39
5. hh September 1985
6. hdorming 0r)milrtion b6
Volume I - Technical Sumnary
7 Authorlr)
B. L. Bunin - 3 Pwformtng Orenizatton Name a d AddrW
Douglas A i r c r a f t Company 3855 Lakewood Blvd. Long Beach, Ca. 90845
2 Sg~nswlng A ~ W V NWW and Address
I
5 Supplementary Notes
8. Plrfwmiq Olgnizatio?, Rlpoct No. ACEE-26- FR- 3504
10. Work Unit No.
1 1 . Contract or Grant NO.
NAS 1 - 16857 *
13. TVP of Repon and PQlod Covnd
Contractor R e ~ o r t
NASA Langl ey Technical Monitor: Andrew J. Chapman FINAL REPORT
6 Abstract
A program was conducted a t Douglas A i r c r a f t Company t o develop t h e technology f o r c r i t i c a l j o i n t s i n composi t e wing s t r u c t u r e t h a t meets a l l the design requirements o f a 1990 commercial t r anspo r t a i r c r a f t . In f u l f i l l i n g t h i s ob jec t i ve , a n a l y t i c a l procedures f o r j ~ i n t design and ana lys is were developed dur ing Phase I of t he program. Tests were conducted a t the element l e v e l t o supply t h e emp i r i ca l data requ i red f o r methods development. Large composite mu1 t i row j o i n t s were t es ted t o v e r i f y the selected design concepts and f o r c o r r e l a t i o n w i t h ana l ys i s p red ic t ions . The Phase I I program inc luded add i t i ona l t e s t s t o p rov ide j o i n t design and ana lys is data, and culminated w i t h several technology demonstration t e s t s o f a major j o i n t area represen ta t i ve of a commercial t r anspo r t wing. A f t e r a review o f the Phase I e f f o r t , t h i s r e p o r t focuses on the technology demonstration program o f Phase 11. The ana l ys i s methodology devel opment , s t r u c t u r a l t e s t program, and c o r r e l a t i c n between t e s t r esu l t s and a n a l y t i c a l s t reng th p red i c t i ons a re reviewed.
- 7 Kev Words (Suggested by Authorbl l 18. O~stribution Statement
Advanced Composite St ructures Bo l ted J o i n t s 1 - .-. -
Composite Wing Test Resul ts Subject Category 24