search.jsp?r=19830004830 2018-07 … · the work was performed by the evendale product ensineerins...
TRANSCRIPT

https://ntrs.nasa.gov/search.jsp?R=19830004830 2018-07-19T11:57:54+00:00Z

r:_i! : :1., , .,, _
ii _ I
I, R_S No, I 3, Gtutrnflwnt _on No, 3, fletll_ent's Cetal_ No,
NA_ CR-165581 I; i I ' i I
ii "4, Tl|hl and Sul_i|lll §, Right OIl_lCF6 Jet Engine Diagnostics Prosr_ - _gh PreSsure Tu:bine June 19,89
_; Koundnils/Cle&ranca Invas_iga_ion 0, Pu_orml_ Or98nttltlo_ @ode
::i 7. Author(1) ' 8, PlrformJngOrgenlsttlon Report No,.
•I_ w.o. Xoward,w. A. F.chlng . ag_Azaa,;o li
i: ,owo.ku°,,.0....t...... 0. FtffoCminaOraeniutlotlNilnU_ AddlllSl
General Elecr.ric Co=party , ; 11. ContrKt or Grant No,Aircraft Engine G:oup
_ Clnclnnat i, _Ohio NAS3-20631n. rn. of,._ _d _rl_ Cov.,d12. Spon_:xina_Y Namemd A(Xlrm Contractor t_aport
National AeronaUtics and Space Administration _ "Washing_or_D.C. 20545 - 14. _en_l_ Ale_ Code
IS, S._lem_ary Notes
Project Manager -J, KcAulay, Pro_ect Engineer - R. P, Dangler :NASA_Lewis Research Cancer, Cleveland, Ohio
• m, i
16, A_sct
A systematic test program was conductedto evaluate.othe effects of high pressure turbineclearance changes on engine and module performance and to measure CF6-SOC high pressure _urbina--Stage 1. tip clearance and _taton out-of-roundness during e_aady-state and transient o_eratiou.
The remtlts indicated a good correlation of th_ analytical mndel of round engine clearance responsewith measured data. The stator out-of-roundness measurements verified that the analytical tech-nique for predicting the distortion e_£ects of mechanical loads is accurate, whereas the techni-que for calculating the effects of certain circ_m_ereutial thermal gradients requires somemodifica_ions. A potential for.improvements in roundness was established in the order of 0.38(0.015 in.), equivale£t to 0,86 percent turbine, efficiency which translates toe cruise SFC im_ove
men_ of 0.36 _ercent,
The _P turbine Stage 1 .tip clearance performance derivative was established as 0,44 =m (17 mils)par percent of turbine efficiency at _ake-off power, somewhat s_aller, _hare_o_e, more sensitive •than predicted from previous investigations.
Jet En81ne l Unclasbified UnlimitedKigh Pressure Turbine Clearance/K_ndnese I
e. Turbofan Engine
Unclassified
' _msalebytheNationalTechnicalInfmmtio_Service,$_ingfield,Virginia22181
_AS_-C-I_ (Rev. I0.75)

The work was performed by the Evendale Product Ensineerins Opera_ion ofGeneral Electric's Aircraft Engine Group, Aircraft Ensino Engineerins Div£-
| sion, Evendale, Ohio. The prosram was conducted for the National Aeronauticsand Space Administration, Lewis Research Center, Cleveland, Ohio, under Sub-task 5.2 of the CY6 Jet EnsUe Diagnostics Prosram , Contract Number NAS3-20631.The CF6 Jet Engine Diagnostics Prosram is part of the Ens£ne Component _nprove-
• ' ment (ECI_ Project, which is part of the NASA Aircraft gnersy Efficiency(ACEE) _Program. The NASA Project Engineer for this program was R. P. Dengler. Theprogram was initiated in January 1980 and completed in May1981.-
The report was prepared by W. A. Fasch£ug, General Electric Program-Manager, and W. D. Howard, ProJect-En$ineer, with the assistance of M. W............Thomas, M. P. Murphy, and B. D. Beck.
tl

• I
/
/
TABLE OF CONTENTS
Section Page
,- 1.0 SUMMARY i
!2.0 INTRODUCTION 2-
3.0 BACKGROUND 4
3_I High Pressure Turbine Clearance Response 4
3.2 Hish Pressure Turbine Roundness 9.
3.2.1. Turbine Midframe Effects 9
3.2.2 HPT Shroud Support Temperature Effects 11
3.2.3 Low__Plessure •Turbine CasingEffects 18
4.0 TEST VEHICLE AND INSTEUMENTATZON 19
4.1 EnBlne ConflBuratlon ..............................19
4.2 _nstrumentation 20
4.2.1 General _nformation 20. -
4.2.2 Aerodynamic Instrumentation 22I 4.2.3 Structural _nstrumentation 23..
4.2.4 Clearanceometer Probe Instrumentation 23
5.0 - TEST FACILITY 26
6.0 TEST PROCEDURE 28
6.1 Performance Tee= 28
6.2 PoSttest Teardown and Hardware Analysis 32...
7.__---TEST RESULTS 33
7.1 EnEine Performance 33
7.1.1 Discussion of. Results 34
7.2 HP Turhlne Stase 1 Clearance Map 38
7.2.1 Clearance As a Function of Tlme for a 10-Second
Accel from Ground Idle to Takeoff Power 38
7.2.2 Clearance As a Function of Tlme for a Deeel
from Steady-State Takeoff Power to Ground Idle 407.2.3 Reburst 40 '--
7.2.4 Clearance As a Function of Core Speed, R2;Compressor Exit Temperature, T3; and CompressorExitPressure, P3 _ 44
V .
PRECEDING.PAGE_LANI(NOT FILMED

TABLE OF CONTENTS (CONCLUDED_
_ Section PaR0
il_i 7.3 Ensine Shutdown (Stopcock) Test 44
i 7.4. Cold Motoring Data 497.5 High Pressure Turbine Starer Roundness _9
_i 7.5.1 Low Pressure Turbine Temperatures 53 .___. .
7.5.1.1 Horizontal Flange/Skln TemperatureGradients 53
7.5.1.I Circumferential Temperature Gradients 53
7.5.2 Turbine Midframe Temperatures 53
7.5.3 High Pressure TurbineStator Temperatures 67
_i_i 7.5.4 LowPressure Turbine Effects 82
_: 7.5.5 Turbine Midframe.Effects 82
!ii 7.5.5 Measured TranslentHPT Starer Roundness 87 _i 7.5.7 Discussion of Roundness Data 87
i
i 7.6 .Elearance and Roundness Quantitative Baseline 87
&.0 - DISCUSSION OF RESULTS i06
i! _0 ==,_o_ _o_'_ APPEND_X_B - REFERENCES 112
ti_' 113!i APPENDIX C - QUALITY ASSURANCE
!i:
.!
I !
vi ...............!

LISTOF ILLUST T!O S I' ++i
J
| I. CF6-50 HP Turbine Cross Section .... 5 +I
2. Typical CLASS MASS Model of liFT Stage 1 Nozzle SuPport. 5 1
3. Typical CLASS MASS Model of HPT Shroud Support, Stage 2 Nozzle_ Support and Turbine Midframe. 7 ..... ':!
4. Typical Hot Rotor Reburst. 8 .+:_
5.. CF6-50 MoJorCases and Frames. i0+ :_
6. Turbine Midframe. 12 4
7. Typical Turblnr Midframe Forward Hat Section Deflection RelatiVe
to Hub_Resultln s from,Takeoff Transient Operation. 13
8. Typical EFT Shroud Support Deflection Relative to TMF Hub _ I |(Caused by TMFHat Section Distortion) Resulting from Takeoff I'::
_' Transient Operation .... .... 14.... I :,
9. Comparison of Calculated Versus MeasuredDistortlon in Static.
Test, VertlcalMountReaction Loadlng, 15,
I0. Comparison of Calculated.VersusMeasured+Distortlon in Static
Test, Torque Reaction Mount Loading. 16
Ii ...............Comparison of Calculated Versus Measured Distortion in Static_
Test, TMF Struts Number 2,4,5 Heated Above Rest of Structure. 17.
12, Engine Instrumentatlon. 21
13. HP Turbine .Probe Location/Reworked.-ComPonents. °-4
P 14. Probe Angular Position Aft Looking Forward 25
15. CF6 Engine in Test Cell. 27
16.. Test Sequence (Continued on Figure 17). 29 :1
............ 17+. Test Sequence. 30 . ,_
i 18. HP Turbine Efficiency Loss Associated sith Tip Clearance Change tof 0.305 mm (0.012 inch). 35
19. Exhaust Gas Temperature Increase Associated with 0.305 mm
(0.012 inch) Increase in HP Turbine Tip Clearance. 35 i20. Loss Overall Engine Performance Associated with HP Turbine Tip i
Clearance Change of 0.305 mm (0.012 •inch). 37 +i
J
vii i
k +

LIST OF ILLUSTRATIONS (Contlnued)nll 0
Figure _
21. Stage 1 Blade Clearance as a Function of _ime During an Accel- Istation from Ground _dle to Takeoff Power. 39
22. Stage 1 Blade Clearance as a Function of Time Durlng a Decel-eration from Takeoff Power to Ground Idle. 41
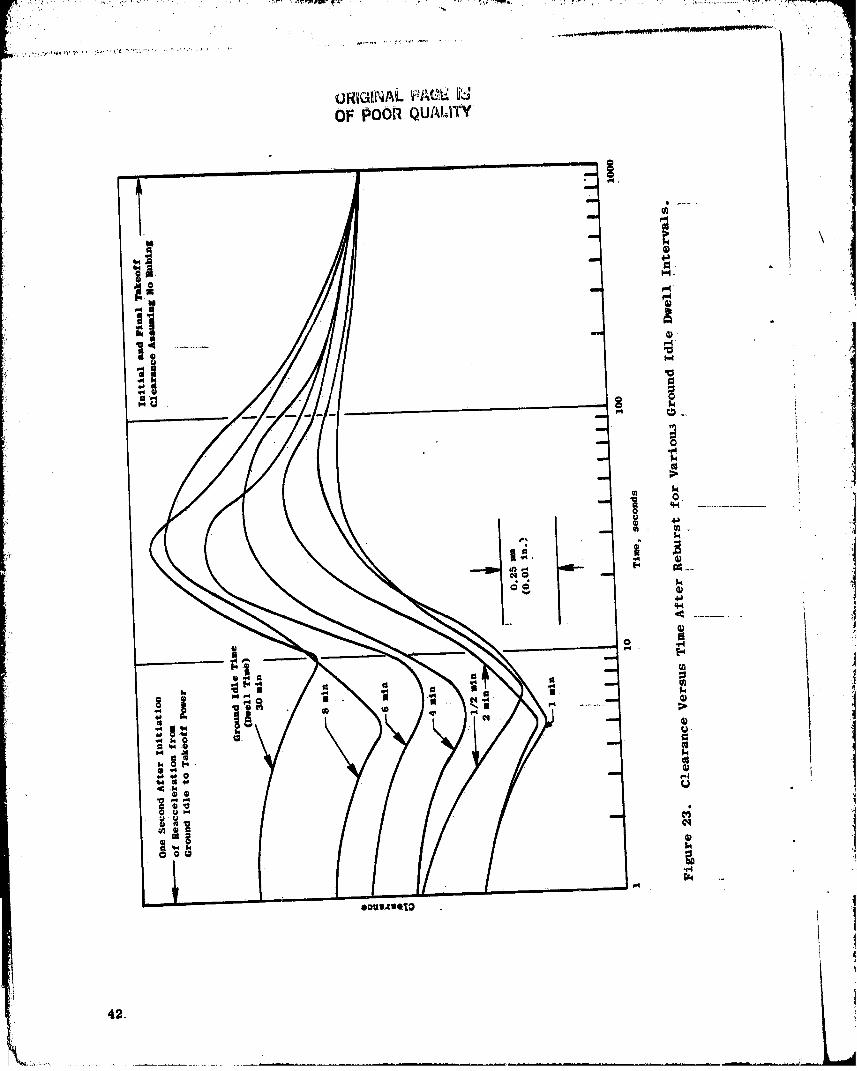
23. Clearance VersusTime After Reburst forVarlous Ground IdleDwell Intervals. 42
24. Clearance Effects from Engine Reburst After Two Minute DwellTime. 43
25. ___Core Speed as a Function of Time Exhibitlng a 2 Minute DwellPrior to Reburst. 43
26. Clearance as a2unctlon of Core Speed. 45
27. Clearance as a Function of Compressor. ExltTemperature. 46
28. Clearance asaFunctlon of Compressor Exit Pressure. 47
29. Clearance Versus Time After Stopcock. 48
30. Core Speed Versus Time AfterStcpcock. 48
31. Theoretical Approximation of Stage IBlade Tip Clearance
Following a Stopcock from Takeoff Power. 50
32. Cold Motor Roundness, Deviation of Indlvdual Probe Readlng
from the Averase of All Readinss. 51
33. Posttest Stage l Shroud Surface Roundness Inspection. 52
34. LP Turbine Stator Case_Ins_rumentatlon. 54
35. LP Turbine Stator Case Axial Temperature Distrlbutlon, Ground141e. 55
36. LP Turblne:Stator Case Axial Temperature D_strlbutlon, Takeoff. 56
37. LP Turbine Stator Case CircumferentlalTemperature Distrlbutlon_
Axial Location Number i, Ground Idle. 57
38. LP Turbine Stator Case Circumferential Temperature Distribution,
Axial Location Number 2, Ground Idle. 58
39. LP Turbine Stator Case Circumferential Temperature Distribution,
Axial LocationNumber 3, Ground Idle. 59
40, LP Turbine StaCorCase CircumferenClal Temperature DistrlbuClon,
Axial Location Number 4, Ground Idle. 60 ,.
41, LP Turbine Stator Case Circumferential Temperature Distribution, ,:Axial Averase, Ground Idle. 61
VIii
4

i: LIST OF ILLUSTRATIONS (CONTINUED)
ill Figure
I 42. LP Turbine Stator Case Circumferential Temperature Distrlbut_on,_" AxlaiLocation Number I, Takeoff. 62
43. LP Turbine Stator Case Circumferential Temperature Distribution,Axial Location Number 2, Takeoff. 63
44. . LP Turbine Stator Case CiroumferentlalTemperature Dis_rlbutlon,Axial Location Number 3, Takeoff. 64
45. LP Turbine Stator Case [email protected] Distribution,
Axial Location Number 4, Takeoff._, 65
_i_ 46. LP Turbine Stator Case Circumferential Temperature Distrlbutlon,Axial Average, Takeoff. 66
47. Turbine MidframeTemperature, Ground Idle. 68
48. Turbine Midframe Caslng Hat Section Average Temperature, GroundIdle. 69_
49. Turbine Midframe Casing Hat Section_RadialTemperature Gradient,Ground Idle_ 70.
50 .......Turbine M/dframe Temperature, Takeoff. 71
51. TurblneNldframe Casing Hat Section Average Temperature, Takeoff. 72
52. Turbine Midframe Casing Hat Section Radial Temperature Gradient,Takeoff. 73
53. Turbine Midframe/Compressor Rear Frame Flanse Average Temperature,Ground Idle. ?4____ ......
5_. Turbine Midframe/Compressor Rear Frame Flange Average Temperature,Takeoff. 75
55. HP Turbine StatorTemperature, Ground Idle (Location A). 76
56. HP Turbine Stator Temperature, Groundldle (LocatlonB). ._7
57. HP TurblneStator Temperature, Ground Idle (Location C). 78
58. HPTurblne Stator Temperature, Takeoff(Locatlon A). 79
59. HP Turbine StatorTemperature, Takeoff (Location B). 80
60. HP Turbine Stator Temperature, Takeoff (.Location C). 81
61, Calculated HPTStator Out-of-Roundness Due to TMF, Ground Idle. 83
62. Calculated HPT Stator Out-of-Roundness Due to TMF, Takeoff. 84
63." Calculated HPTStatorOut-of-Roundness Due to SEator Temper-ature Variation, Ground Idle. 85
Ix

k
il LIST OF ILLUSTRATIONS (Concluded)!i'
!ii_ 64. Calculated I_PT Stator Out-of-Roundness Due to Stator Temperature IVariation, Takeoff. 86
65. Total EPTurblne StatorOut-of-Roundness, Ground Idle. 88
66. Total HP TurblneStator Out-of-Roundness, Takeoff. 89 _....
67. HP Turbine StatorOut-of-Roundness, Burst + 0 Seconds. 90
68. HP Turbine Stator Out-of-Roundness, Burst %9 Seconds. 91
69. HP Turbine Stator Out-of-Roundness, Burst • 20 Seconds ...... -92
70. HP Turbine Stator Out-of-Roundness, Burst+123 Seconds. 93 "
_i. HP Turbine Stator Out-of-Roundness, Burst_ 305 Seconds .... 94
72. HP Turbine Stator Out-of-Roundness, Burst +747 Seconds. 95
_ 73. HP Turbine Stator Out-of-.Roundness, ChQp + 0 Seconds. 96
74. HP Turbine Stator Out,of-Roundness, Chop + lOSeconds. 97 --
i 75. HP Turbine Stator_Out-of-Roundness, Chop +20 Seconds. 9876._ HP_Turblne Stator Out-of-Roundness, Chop + 40 Seconds. 99
77. HP Turblne_Stat_rO_t_of-Roundnesss Chop + I00 Seconds. i00
78. -/_P Turbine Stator_Out_of-Roundness, Chop + 308 Seconds. i01
79. HPTurbine Stator Out,of-Roundness, Chop + 425 Seconds. 102
80. HP Turbine StatorOut-of-Roundness, Chop +1020Seconds. 103
81. Maximum and Minimum Probe Readings During An Accel. 104
82. _MaximumandMinl,iumProbe Readings During a Decel. 105
X_

In the CF6Jet Engine Diagnostics Program, the causes of performancedegradation were determined for each component of revenue service engines.It was found that a significant contribution to performance degradation wascaused by increased airfoil tip radial clearances in the high pressureturbine.
_ Since the influence of these clearances on engine performance and fuel_ consumption is significant, it is important Co establish these relationships,
i especially considering the high price of fuel. It is equally important co
l understand the causes of clearance deterioration so that they can be reducedor eliminated.
The objective of this _nvesCigation was to conduct a systematic test
i program to evaluate the effects of high pressure turbine clearance changesi: on engine and module performance and to measure CF6-50C high pressure turbineStage 1 tip clearance and SCatorouc-of-roundness during steady-state and
if: transient operation.
_ An instrumented engine test was conducted with eight clearanceometerprobes installed in the Stage 1 high pressure turbine shrouds. Stage 1 tip
!_ clearances and scator our-of-roundness were measured during steady-state andtransient operating conditions. The turbine static parts were instrumentedwith pressure and temperature probes Co monitor the behavior of chese struccuresand the corresponding clearanceomecer date. The effect of clearance on engine
_ and module performance was established from performance calibrations before_:- and after the basic running clearance of the Stage 1 turbine was increased
by blade-tlp-on-shroudrubs.
_e data from the program were analyzedto determine (1) the effete ofI: high pressure turbine clearance changes on engine and module performance,
(2) the StaRe 1 high pressure turbine clearance map, (3) the high pressureI turbine statorout-of-roundness map, (4) a correlation between measured
::< r and predicted clearances, and (5) a quantitative baseline to which clearance .....control improvements can be compared.
,, The results indicated a good correlation of the analyclcal modelofI round engine clearance response with measured data. The stator out-of-round-' ness measurements verlfled.Chat the analyClcal technlque for predicting the dis-i tor$ing effects of mechanical loads is accuraEe, whereas the technique_ for calculating the effects of certain circumferential thermal sradlents!! requires some modlflcatlons. A potential for improvements in roundness was_ established in the order of 0.38 mm (0.015 in.), equivalent to 0.86 percent ini " turbine efficiency which translates to a cruise SFC Improvement of 0.36 percent.
_i The HP turbine Stage 1 tip clearance performance derivative was establishedw as 0.44 mm (17 mils) per percent of turbine efficiency at take-off power, some-
what smaller, therefore, more sensitive than predicted from previous InvestiSafilons.

2.0 INTRODUCTION
The recent energy demand has outpaced domestic fuel supplies creatln8
; an increased United States dependsnc_ on foreisn oil. This increased_:' dependence was accentuated by the OPEC embargo in the winter of 1973-74,: which triggered a rapid rise in the price of fuel. This price rise, along' with subsequent increases, brought abouta set of changing economic circumstancesi.+ with regard to the use of energy. These events were felt in all sectors ofi" the transportation industry. As a result, the Government, with the support
of the+aviation industry, initiated programs aimed at both the supply and' demandaspects of the problem. T_e supply aspect is being investigated by ._ I!: determining the fuel availability from new sources such as coal and oil: shale, with concurrent programs in progress to develop engine combustors and
i! fuel systems to accept these broader based fuels.. •
:, i Eeduced fuel consumption is the approach being employed to deal with
_!.:': the demand aspect of theproblem. Accordingly, NASA is sponsoring the Air-
i::!:i craft Energy Efficiency (ACEE) program which is directed toward reducln_:.: fuel consumption for commercial air transports. The long-range effort to.
reduce_fuel consumption is expected to evolve new technology which will
i: permit development of emote energy efficient turbofan, or an improved propul T_i!: sion cycle such as that for turboprops. Studies have indicated large re-
ductions in fuel usage are possible {e.g., 15 to 40 percent) from this ap- --
_ proach, however, significant Impact in fuel usage is considered to be i0
i: or more years away. In the near term, the only practical propulsion ap-
i proach is to improve the fuel efficiencyof current engines since theseengines will continue to be the siEnlflcant fuel users for the next 15 to
:: 20 years .....
! The Engine Component Improvement (ECl).program Is the element of the
,i. ACEE program directed at improving the fuel efficiency of current engines.;..... The ECI+program consists of two parts: (I) Performance Improvement and
i:/ (2) EnglneDiagnostlcs. The Performance Improvement program is directed at ...............:_: developing engine performance improvement and retention concepts for new
_:" production and retrofit engines. The Engine Diagnostics effortls topro-::. vide information related to determining the sources and magnitudes of per-
:.: formance deterioration for.the high bypass ratio turbofan engines utilized on
": widabody #ircraft.
i_: As part of the Engine Diagnostics effort, NASA-Lewls initiated a pro-
_ : gram with the General Electric Company to conduct high pressure turbine
:.!i_ i clearance investigations.
The modern aircraft gas turbine engine typically uses highly loaded •_ compressor and turbine stages. Although this design approach tends to_" reduce weisht and improve overall efficiency, the high pressure ratio turbineii bladin8 is more sensitive to blade tip-to-shroud clearance. Since clearance
i is directly related to _as leakage, aerodynamic losses result, _......
i As .a Jet engine accumulates operating time in revenue service, its ;•. performance deteriorates as a function of time and operating cycles. A _
,. large part of the CF6-50 engine performance deterioration has been deter- ,_; mined to be cha_geableto the high pressure turbine (Ref. i). This deterlor-
ation is primarily due to an increase in blade tlp-to-shroud clearance which .........
results from loss of tip or shroud materials by rubbing of blade tips on theshrouds. The major cause of CF6-50 rubs is stator out-of-roundness broughtabout by thermal 8radients and transient thermal responses of adjacent struc-tures, such as the compressor rear frame, turbine midframe and low pressureturbine case.
|

It is very important to the engine designer co decern_.ne the e_fecc ofclearance on turbine performance and Co understand the relationship of the radialgrowth of the rotor and scacor for both transient and steady-sCare operatingconditions; Achievingand maintaining small tip clearances requires thaC rubsbe avoided,or aC least closely controlled.
' Studies have shown thac significantimprovements in engine performance(reduced fuel consumption) and engine life extension (cost savings) can resultif proper tip clearance techniques are implemented. It is very important,
_ therefore, to obtain running clearance measurements during engine operation,quantitatively evaluate the effect of clearance onperformance and to understandthe nature of shroud out-of-roundness..
_n order to clearly identify causes and effects of turbine clearance changes,measurements of these clearances in the turbine temperature environment of an
engine to an accuracy of _ 0.05 mm (0.002 in,) are required. Various measuringdevices have been used ln the past, but most of them have serious limitations.
Rub pins have been used which show only the minimum clearance requirements, but
with no reference as to when the event occurred in time. Highenergy X-rayhas been used, but is dlfflcultto determine roundness and requires speclally
equipped test sites. The touch probe device is widely used, however, it cannotmeasure individual blade clearances or clearance durlng transients. The capa-
cltance sensor Isalso being used increasingly, but has shown limitations pre-
cludlnguse in the hot turbine envlronmen_.
A clearance measuring device which overcomes all of the above problems and
provides_accurate clearance measurements is an optical, non-contactlng sensor
called a clearanceometer probe. Such a device has been designed, built, anddemonstrated_by theGeneral Electric Company. Abench model wasfabrlcated and
tested in a controlled laboratory environment to assess accuracy and toughness
in a simulated turbine environment. This initial evaluation was followed bya factory engine test on a J79 enginein August 1979. The success of bothdemonstrations provided the necessary toolto attain accurate measurements of'
high pressureturblne blade tip clearances, stator roundness and rotor/stator
concentricity on the CF6-50 engine.
An instrumented engine test was conducted at the General Electric, Evendale,
! Ohio, test facility. This test was concluded in September, 1980. The objectives.
i of thls effort were to measure CF6-50 high pressure turblneStage 1 tlp clearanceand stator oUt-of-roundness, and to evaluate the effects of high pressure turbine
i clearance changes on engine and module performances. The testing included bothsteady-state and transient engine operating conditions.
The data obtained from this test program have been analyzed to determine:
(1) the effect of high pressure turbine clearance changes on engine and moduleperformance, (2) the highpressure turbine Stage 1 clearance map, (3) the high
pressure turbine stator out-of-roundness map, (4) a correlation between experi-mentally measured and analytically predicted average clearances and roundness,and (5) a quantitative baseline to which clearance control improvements can becompared.
3

3.0. BACKGROLTHD
) ',
}_. Zt had previously been determined that turbine blade-to-shroud clearanceincreases are one of the leading causes of engine performance deteriorat_on
; (Ref. 1) The most needed information pertaining to the clearance/performance
)_ relationship was a quantitative measurement of the effect of clearance changes' upon engine performance. Once this relationship is established, the round
)i!i, engine clearance-response with respect to different engine operating parameters, ji: such as core speed (N2) and compressor discharge pressure (P3)) is required to
.... determine when clearance increasing rubs could occur. Finally, shroud surface
II_,I roundness must be addressed because the combined effects of out-of-roundness)._ and round engine response determine when rubs occur.
Rotor eccentricity is a topic often discussed with respect to blade-to-shroud clearance and performance deterioration. Because the CF6-50 high pressure
i_<:._ turbine rotor (Figure 1) is supported by bearings at each end, the eccentricity_!:_:: is a function only of the bearing clearances, runout of bearing centers and
Ii relative structural stlffnesses. This eccentricity has been shown to be a small,repeatable, and known effect in the CF6-50 en_ne and is not addressed in this
iill! reRo t.
i!i_ 3.1 High Pressure Turbine Clearance Response
,,_'i:_:_, Clearance response may b_ determined analytically through deflection analyses
il of both the rotating and static engine structures. Heat transfer and aerody-L_ namic models of the components are required to provide appropriate and consis- --
}_._.- tent temperature and pressure boundary conditions as inputs to the structural_i models.
Typical portions of the structural model of the CF6-50 high pressure turbinestator are shown in Figures 2 and3. These hlgh pressure turbine components
have been analyzed primarily with a General Electric computer program called
CLASS/MASS)employing an axisynnnegrlc analysis.
Engine throttle movements, such as steels, decels, and rebursts have been._
analyzed uslngthis model. The steady-state operating points of ground Idle,
takeoff power, and cruise power have also been analyzed ....
Experience has shown Chat steady-state engine operating clearances are
usually determined as a result of engine transient operating conditions. A• calculated or observed mlnimumwhlch occurs during transient maneuvers will
dictate the clearance which must be set initially in order to avoid rubs.
The worst case, i.e., minimum clearance or rub condition for the CF6-50 engine)
has been predicted to occur during a hot rotor reburst. A reburst is defined
as an engine decel from high power to idle, holding at idle for a period of _time (generally less than five minutes) and then accelerating the engine
back to high power. The turbine shroud support member is considerably lessmassive than the turbine disk and, consequently, it cools more qulckly than
the disk during the time at idle. A reacceleration of the engine adds rotational
stress growth and blade thermal growth to the already existen_ disk thermal
stress growth.- The result is a hot blade tip radius greater than that of theshroud surface which thereby produces blade tip rubbing. The typical growth
; characteristics for both the rotor and the stator during s reburst maneuver are
presented in Figure _ as a function of time ......
4


.I
!i

A significant part of engine deterioration may be caused by warm rotorrebursts (time at ground idle more _han five minutes) for which little data areavailable. This test included warm rotor reburats to provide data relative tothis type of engine operation.
3.2 High Pressure Turbine Roundnes s
The control of the roundness of a gas turbine engine structure requires
an evaluation of the material properties and characteristics as well as environ-_ mental influences for all the prima_y engine structural members. Figure 5
highlights and defines the critical structural members of this engine. Thesecomponents include the fan casing, the compressor casing, the compressor rearframe (CRF), high pressure turbine (HPT) Stage i and 2 nozzle supports, the
turbine mldframe (TMF), the low pressure turbine (LPT) caslngand the turbinerear frame (TRF).
Eachof these components is subjected to varying levels of both non-axi-
symmetric loading and clrcumferentlally nonuniform radlal thermal gradients.•These effects tend to induce out-of-roundness dlstortlonsln these components
which can propagate throughout the entire length of the engine. The result is
that the study of theroundness of an engine structure must include not onlyits Inherent-ability to remain roundSut also must include the distorting In-
fluenca of nelghbor_s_/uctures.
The roundness study utilized General Electric Structural Analysis pro-
grams "CLASS/MASS" and "MASS", of the entire CF6-50 structural system. Thesemodels w_re used to evaluate the magnitudes of _t-of-roundness of each com-
ponent and the effects thatdlstortlons of the various components have on Stagei HPT shroud roundness.
Non-axlsymmetrlc frame structures must first be modeled with the "MASS"
program and the calculated deformations applled to the "CLASS/MASS" program.asboundary conditions. The"MASS" program employs three-dlmenslonal analysis
and has the capability of handling non-axlsymmetrlc structures consisting ofplate, brlc_, shall and beam elements. Transient engine conditions were In-
! cluded in these analyses s_nce the most severe thermal effects do not neces_ -sarily coincide, tlmewise, w_th the mostsevere mechanical loading effects.
The contributions of each englne component to both high pressure tur-
bine roundness and t_ansi_nt clearances were then determined using Fourler
Series approxlmatlc_s. These contributions were superimposed to obtain theroundness and clearance response maps of the high pressure turbine.
The analytical studies indicated that the compressor rear frame has a
negligible effect on HPT out-of-roundness.
3.2.1 TurblneMidframe Effects
The blade tip clearance Is influenced by the amount of distortion and
out-of-roundness IL the shrouds. The high pressure turbine shroudsln the
CF6-50 engine are supported from the mldframe forward flange. This flange is
9

10 .

_L_rpv r¸ L_ _ _,
_ i _'_............... ..... • _ _' _ _ '1
!it connected to the structural hat sections of the turbine midframe by a sheet
_t metal cone. The turbine midframe is shown schematically in Figure 6.
!i_ Turbine Midframe Temperature and Pressure Effect_
!i Distortions of the turbine midframe structural hat sections are transmitted
through the supporting structure to the high pressure turbine shrouds• Figuresi 7 and 8 show typically the kind of turbine midframe forward hat section and
i: _ resultant high pressure turbine shroud distortions which result from the_ transients following the engine acceleration from Idle to maximum power. Thesef
distortions primarily occur due to (a) mechanical loading on the turbine mid-
i frame, (b) pressure loadings transmitted to the turbine midframe, and (c) tempera-
_ ture differences in the engine structure. Structural temperature gradients are• caused by different thermal response rates, gas stream circumferential temperature
variations and strut internal airtemperature variations. Three of the strutsoperate approximately ll0OC (200OF) hotter than the other five struts. The
varying strut temperatures result in different amounts of thermal expansionin the struts. This causes a nonuniform distortion of the turbine midframe hat
sections and an out-of-roundness distortion of the high_ressure turbine shrouds.
Turbine Midframe Deformation Due to En_ine Mounting Loads• !
_ The turblnemidframe isalso deformed by loads from the mounting of the
i engine. The aft engine mount is an integral part of the structural hat section.Theseeffects are included in the_overall structural model.
Correlation of AnalyslsTechnlques of High Pressure Turbine StatorDistortion Resultln_ from Turbine Midframe Distortion
i An analysis of HPTstator distortion resulting from TMF distortion was
performed using the General Electric Structural Analysis computer programs.
The analyslsmethod had been correlated by means of statlc testlng(Independentof and prlorto this contract) of the full englnestructure durlngwhich both -
I TMF hat section and HPT stator out-of-roundnesses were measured. Three testswere conducted for thefollowlng !oadlngs: .__
a. Vertical load reaction at engine aft mount points 1b. Torque load reaction at engine aft mount point I
c. Thermal loading where three of the eight TMF struts were Iheated 90°C (162°F) above the rest of the structure
The correlation between measured and calculated out-of-roundness is shown" -- in Figures 9 through ii
3.2.2 HPT Shroud Support Temperature Effects
Since roundness must be assured before any significant work can be directedtoward blade tip clearance reduction, the turbine shroud structure itself must
stay round, In addition to being influenced by other engine structures, turbinestructures ma_ lose their roundness due to recirculation of hot flowpath gasesinto the cabities between the turbine flowpath hardware• This recirculation
of hot gases can induce local overheating of the turbine structural members,causing them to elastically distort.
11
i

12

ALF_
FiKure 7. Typical Turbine Midframe Forward Hat Section Deflection Relative
to Hub_Resulting fron Takeoff Transient Operation.
13

Fisur e 8. Typical HPT Shroud Support Deflection Relative to TMFHub _(Caused by T_F Hat S_tion Distortion) Resultin_ from TakeoffTransient Operation.
14


OF POORQUALITY
16 ... """ ..... _" '

/.T

i,i,!'__ ,• ....... ' ............................. _ . , ........................... ,;,. ....... __........................• ," ___--_ _ "" _°_,_,
iI 3.2.3 Low Pressure Turbine Castn 8 DistOrtion Effects
i_ The low pressure turbine casing, like _he turbine midframe, is subject-:_ ed to bothaxially and circumferentially varying temperatures and loads. Two_ mechanisms were Judged to be possible contributors to HPT out-of-roundness,i_ These mechanisms are:
_ 1, Temperature differentials between the LPT statorcaee.horizontal_.,. flanges and skin cause the horizontal flanges to grow relative ._-'[ to the skin, thereby distorting the LPT forwardflange, These
il distortions are transmitted forward to the HPT stator. _2 .........Circumferential temperature gradients in the LPT statorcase skin.,if! force the LPT-stator case into an out-of-round shape and.props-
i gate forward to induce HPT stator out-of.roundness. IThe HPT out-of-roundness caused by the horizontal flange/skin tempera-__:_ ture gradients and clrcumferentlal thermal gradients was evaluated by using _•
_i both computer and.emplrlcal models, The method.ofdetermlnlng out-of-roundness ihad been verified by tests in which the flanges and skin of the LPT casing _=were heated and the resultlngHPT deflections measured.
18
4,0 TEST VEIIZCLEAND X.NRTRUMRNTAT]ON
The teat vohicle used in thin £nvestigation wen a CF5-$0C engine, whichhad boon assembled using standard turbine components raprezentotive o_' \production engines Currently oporatins in revenue sorvico, Several components
_., were modified for the installation of the clearan_eometer probes and other
_ii required InatrumentatLon Ioadoutz,
i The angles was assembled wlth largo rotor-to-seater clearances exceptfor the Stage I high pr.esauro turbine (IIPT)., By building only the Stage i HP.Twlthtlgllt Clearances, the intent wee to isolate the of fact upon performance of
l: Stage 1 blade=to-shroud clearance, by suztalulug a blade-on shroud rub, Provided _}. thac no other Components deteriorated during.the time the rub. was sustained, or
that any deterioration which did occur could be identified and. quantitatively amaassed,the clearaucaometor readings before, and after, the rub could be corrolatad withcosine performance monitored before and after the rub to determine a relationshipbetween,chanson in tlp Clearancam and changes In engine health paramaters
(Exit Gas Tamparatura (EGT), Turbine Efficiency (ST), Specific Fuel Consumption(arc)., Thrust (F),. otc.)., In-particular, the relationship, of clearance andefficiency-determined through this tent Could ba Compared with those established q
tn other tents to determine whether or not the relatlve 8iguiflcanca of HPT tlp i_ clearance deterioration was weaker, stronger Or about the same am had been
azsezaed previoualz.
P;, 4.1 RNOZNE CONFZ_URATION
A description of tile cast vehicle and its associated component confisu-i ration is.given as follows: •
•............Fau..Frame..................................................................A standard CF6-50C frou_ frame
with rake pad capability torecord Compressor lnl_ cb._r-ectarintics, if noedoA.
• COmpressor Starer Standard CF6-_fiC co,preener-or&car,
• Compresoor ROtOr... Standard CF6-,50C rotor,i
• Compressor Rear Frame A CF6-50C frame modified tOreceive .clearancoomotar _probes ............
• Combuztor Standard .CF_6-50C combuator__ ,i
• , Fuel._ozzle CF6-50C fuel nozzles. '1
• Stage I High Pressure Turbine __CF6-50C assembly,
Nozzle Azzambly (including- imini-nozzlo)
19

E'
t:_
,!. • Stage 2 High Pressure Turbine CF6-50C configuration _odifiad
_:,: Nossle Assembly . Co receive clearanceomeCer probesi.i_;, e. H_gh Pressure Turbine Re,or CF6-50C
4
:: • _Turbine_Midframe-. CF6-50C
ii: a LOWPressure Turbine CF6-50
fll_;; s Exhaus_Nozzle CF6-50C configuration
!:: 4.2 INSTRUMENTATION
:_., Engine station (plane) designa_ions .used for the testing were in accordancewI_hARP755A. Figure 12 illustrates the plane locations on a CF6-50 engine cross
I_.. section and idenClfles _he Instrumentation used. The instrumentation is brokeni_' down in_o four groups: general ins_rumen_a_ton_ aerodynamic ins_rumen_a_ion,i_'. turbine s_ruc_ural ins_r_men_a_ion, and clearanceome_er probe ins_rumen_a_ion.
i;._ _.2.1 General _ns_rumeneaC_on
f: • Br-_me_ic_ressure - The local barome_ric pressure measuned_using.[!; a cording microharograph..
e.. Humidity - The absolute humidity measured in grains of.mols_ure
per pcund of dry air using a humidi_y indicator.
• Cell S_a_ic Pressure (Po) -_Tes_ cell s_a_ic pressure measured a_four loca_ions in _he cell,
!.
• Fan Speed (XNL) - Low pressure rotor speed measur_.d_usin_cwo fan casemounCed_ fan'speed aensocs.
o_Core Speed (XNH) - High pressure rotor speed measured using enginecore-speed sensor driven off the and of Che_lube. and scavenge pump.
e_ Main Fuel Flow (WFM).-Volume_rlc flowme_er, faclll_ymoun_ed.
• Verifica_ion FuelFlow..(WFV) -.-Second fuel flowme_er moun_ed inseries wlCh WFM.
2O
L_d
k . ...........

i

• Fuel Temperature - Temperature of fuel measured a_ the facility flow-meter using a+single chromel/alumel probe in the fuel line+
• Fuel Sample Specific Gravity (SGSAMP) - Specific 8rarity of the fuelsample measured using a hydrometer.
• Fuel Sample Temperature (TSAMP) -Fuel sample temperature measured \during the specific Brevity measurement.
a
• Fuel Lower Heatin_ Value (LHV) - Lower hea_ins value of the fuel ]sample a• determined by a bomb calorimeter,
_ s Thrust (FG) - Thrust-frame, axial force measuring using three
_ stratn-ga_e type load cells_for redundant measurement.• VariableStator Vane Position (VSV) - Readout of the LVDT attached
to the high pressure compresso_ variable statorpump handle.
• Variable Bleed ValvePosition (VBV) - Eeadout of the LVDTattachedto the variable bleed valveactuation mechanism. _,
!• 4°2.2 gerod_namic Instrumentation
The followin_ rakes, probes, andstatic pressure taps wereinstalled tomeasure airflow, temperature,and pressure as:required to define componentperformance. (See Figure 1_.)
Fan.Inlet (Plane i_
Bellmouthrakes were installed to measure static pressure, total.pres-sure, and total temperature at _he fan inlet. Founrakes, each havlnE six_otal pressure probes, slx static pressure probes, and two total temperatureprobes were used ....
Booster Discharge (Plane 23_
Five arc rakes, each havin_ sixtemperatureand six pressure probes jwere_installed to measure booster dischar_e total temperature and total pres- |sure. Ten taps were installed to measure booster discharge static pressure. !
Compressor Inlet (Plane 25) _i
Five flowpath,wall static pressure taps were installed. "
Compressor Discharge (Plane 3)
Five of the borescope port plugs in the compressor rear frame were " _modified to permitcompressor discharge static pressure measurement. A single5-element thermocouple probe was used to measure compressor dischargetemperature.

• ! i........i .... ....
!i Low Pressure Turbine Inlet.. _Plane 49_
I Temperature in this plane is measured by eleven 5-element rakes withi individual probe readout to permit monitoring of temperature profiles Pres-
sure is measuredusing five probes, each havingfive elements all feeding asingle fitting.I
c:
Low Pressure T_rhine DJ.scharae (Plane 5_
_ Low pressure turbine discharge pressure is measured using four rakes,
!_ having, five elements each.. '....
_/" 4-.2.3 Turbine Structural Instrumentation
_i s HPT Stator Thermocouples: 24 imbedded in structure a_d 2 air_: thermocouples
• HPT Stator Pressure Probes: 4 basket-type pressure probes intheStage 1 shroud cooling air suppl],cavit_
s Engine Structure2hermocouples: 1_6 metal and 14 air thermocoupSes__
a Engine Structure Cooling Air Temperatures_dn__Pr_e_sures: 14 airthermocouples and 10 pressure, probes .....
• LPT Case Thermocouples: 48metal thermocouples
• LPT CaseCooling Manifold and Under CowlInstrumentation: 17pressure probes under cowl and in supply tubes
4.2.4 Clearanceometer Probe Instrumentatlon
Eight clearanceometer probes were installed in the test vehicle abovethe Stg. I blade tlps as shown InFigure 13. These probes were used to obtalureal, time, individual high pressure turbine blade tlp-to-shroud clearancemeasurements to an accuracy of_O.0_ u_ (0.002 in.). The high pressure turbinestator on the test vehicle was modelled to recelve•the probes. The reworkedstatorcomponents included_ Stage 1 shrouds, Stage 2 nozzle support, filterscreen and 10th stage air seal. The clearanceometer probes were located at _-
eight clrcumferen_al positlons, as nearly equally spaced as was practical(Figure i_).
• Each clearanceon_ter probe was individually calibrated and checked duringassembly on the HPT stator. A final reference calibration was obtained duringinitial cold rotatign and _otoring of the engine..
A proven light-beam triangulation technique was utilized for the clear-ance measuring sensors. Data were collected for fixed-time intervals andindividual blade clearances were obtained from each probe. Individual probeprocessors were used to store clearance data and the processor calculatedblade minimum, maximum and average clearances from all the data collected.A high speed data tape recorder was used to independent_y record individualblade clearances.
_3

24¸

8
324056
3
104 ° 19 !
25

': 5.0 TEST FACILITY
All testing was conducted in Test Cell 2, Building 500, at the GeneralElectric Company plant in Evendale, Ohio_ A photograph of an engine installedin the test cell is shown in Fi2ure 15.
:!
_ Cell 2 has access to the data recording systems in the Instrumentation Data
° Room. In addition to the standard test cell equipment , a clearanceometer probe
cooling system was provided which utilized engine compressor bleed air. A micro- _ "
computer and hlgh speed signal processor were used to collect and record theclearanceometer data.
The_data acquisition and processing system in use in Evendale consist
_,_, of a Cell System and a Site System. The Cell System performs steady-stateand transient data acquisition, convezsion to engineering units, qulck-look
performance calculations, and short-term storage. Converted data is auto-
matically transmitted Co the Site System for further on-llne processing and_! hard-copy output. The Site System utilizes a data-base concept for efficient_ storage, retrieval, and reprocesslng of current and historical data. In
addition, data may be transmitted to the General Electric Evendale Time Sharing ...., Computer Center for further processlns, such as cycle deck analysis and
:'i' comparison..
Data acquisition capabillty consists of:400 pressure channels, 400
temperature channels, I0 frequency channels, and 28 d.c. voltages, such as:load cells, individual pressure transducers, position potentiometers, etc .............The pressure system consists of ten 40-port scannlvalves wlth available
pressure ranges from + 6.9 N/cm 2 (i0 pslg) through + 345 N/cm 2 (500 pslg).
The system incorporates auto-ranglns and multiple s_mpllns capabillty for_all __data channels to assure optimal resolution and precision in addition to
variable averaging tlme for frequency measurements. Data may be achieved and
processed in either a steady-state or transient mode. Typical acquisition tlmefor all data to be recorded for a steady state test point (condition) is 30 ......seconds and each measurement (parameter) is sampled 40. times over that time
period. Transient acquisition rates are variable from one sample per second perchannel to 250 samples per second per channel. Redundant measurements are
made of key parameters such as fuel flow, fan speed, and thrust. Automatic.... data rejection _echniques, ratio of redundant measurements, and on-line system-
verification analysis further enhance overall data quality.
All data is converted to engineering units on the Cell System and auto-matically transferred to the Site System. These are then used in variousdata-analysis computer programs. Quick-look programs are available on theCell System to provide on-line and hard copy of overall engine performance t
and health calculations. Simultaneously, these data are available at the !
Site System for hard copy and plotting of corrected overall and interstageperformance characteristics. Easineering units and/or calculated data maybe transmitted to the General Electric Evendale Time,Sharing Computer Centerfor archival storage and additional analysis such as cycle deck comparison.
26

ORIGINAL I_,_ _SOF POOR QUALITY
!
|,

¸ ....... - ,.......... ...... .......,
6,0 TEST PROCEDURE ._
_
i_ The test objectives were to secure round engine clearance maps, i.e.,_ blade tip clearances as a function of core speed, compressor exit temperature,
compressor exit pressure, and time; and both steady-state and transient out-of-.. roundness maps. The effect of varying clearance upon engine performance was .
_ ' also to be evaluated. The clearance and out-of-roundness maps were to be de-
termined from the data generated by clearanceometer probe_. • ii; 4
.... Inorder to achieve these objectives, a test plan was developed which
consisted of operating the engine at the following test condltlonsz 'i_!.i "_
_i • Cold motoring_. • Ground Idle _
• Slow accels to, and decels from takeoff power . __! • Steady-state operation at takeoff power .._
time intervals at takeoff
• Several rebursts to takeoff power after specified time intervals
at ground Idle (dwelltlme) _il. • Sufficient engine speed settings to establish the performanceb>
_. power calibration
._. e. Stopcock
_.. Aschematlc presentation of the. test sequence, showing power level condl-
_ tions or settings for specified times, is given in Figures 16,and 17. There
were actually two types of test operations. One was performed to provide accu-
: rate transient response; the other was used to. evaluate the relationship ofclearance to performance. The stopcock, or engine shutdown from cruise power,
by turning the fuel flow off, concluded the second test sequence. The intentof thls Investlgatlonwas to obtain data on the effect of this operation,
which is performed in aircraft acceptance testing, on short term performancedeterioration.
6_I PERFORMANCE TEST
The performance test program was deslsned to evaluate the performance
and Stage i rotor tip clearance over a range of power settings after the
engine reached steady-state conditions. Each power calibration consisted ofback-to-back sets of power levels in descending order of fan speed with ashort shutdown in-between. The engine shutdown was included to assuretesting repeatability.
A list of the speed settings and stabilization times for the powercalibration checks (both "A" and "B") is presented in the followln 8 tablez
28

29

O_lGll'_gL PAGe:iS .iOF POOR QUALITY'
3O

POWER CALIBRATION TEST RUNS
Corrected Fan Speed _rpm) Stabilization Time (_in)Power Calibration "A"
Ground Zdle 12\
3600 ._ 12
3785 5
3585 4
. 3323 4
2093_. 4
Ground Idle 3
Shut down, obtain new thrust balance measuremenu (or readlng) andrestart
engln_ower-Calibration "B"uround Idle 12
3600 12 _'
3820 5 ......!i
,i. 3700, 4 "
ii. 3640 ...... 4 ................ ] ..
3410 4.i 3123 4
Ground Idle 3.
Shut Down .
Data Analysis Technique
The data were analyzed usingthe General Electric Phase II computerpro-8ram. This program has for its basls a status cycle deck representative ofthe particular engine model being tested. Some of the key features of thisdata •analysis program are=.-
ila. For each teat readlng,a pretestpredicti_n point is run on the cycle . _!
_ deck atthe tested conditions (ambient temperature, pressure, humidi.• ty, etc.), _nd_this pretest point is used :o check raw data quality_ ......
_ b. Several alternate analysis paths are built in for determination ofcore flow, low pressure system work, etc. Inadditlon. it is possible
" for the user to select his own analysis setup. All of these analysispaths guarantee a balanced cycle; that is, the solutlon is self-con-sistent and satisfies thecontinulty, momentum, and energy_9_quatlons.
31

_ c. The built-in analysis options feature mission data protection, Whena measurement is missing, a suitable assumption is made to replacethe measurement in theanalysis; for example, when compressor dis-
• charge temperature is unavailable, compressor efficiency is held atthe predicted level to effectively take its place. For a few key
,i_. measurements, the analysis Is terminated when they are unavailable,.but for the majority of the measurements, an alternate analysis is ,
i:_ performed instead.
t
I_ d. At. the conclusion of the analysis, the cycle deck is matched to the". test data; that is, the cycledeck maps, etc., have been rescaledlill to be consistent with the measurements.
e. The data is adjusted to dry, sea level, static, standard-day condi--tion by runningtherescaled cycle deck at the_tandard condition.
i i This method for correcting thedata eliminates the problem, encoun-_i_ tered in the past, of trying to select a singlenumberto represent,
ii- for example, the temperature effect on fuel flow independent ofpower setting or type of day. This is particularly significant in
modern engines because they _employ more variable geometry.ii 16.2 POSTTEST TEAEDOWN AND HARDWARE ANALYSES
Iii After the conclusion of the engine testing, the turbine section of the :if! engine, including the high pressure turbine rotor, Stage 2 nozzle assembly
(with Stage 1 and 2 shrouds) and turbine mldframe, was disassembled and visu-
i!/ .. ally and dimensionally inspected. These measurements were then correlated
with the clearanceometer data, especially the data obtained during cold motor-"ing.

7,0 TF.STtumULTS
7. I. ENG]'.NEPERFORMANCE
During the clearance phase of the testing, performance was measured,severaltimes throughout the test to ascertain any resulting effects On engine parame-ters.
' °Analytlcal studlws predicted a stage one blade-on-shroud rub to occur dur-lag both a two-mlnute and a nlnety-seCond reburst, Performance was monitoredinitially•prior to any of the.rebursts and agaln.prlor-to the two-mlnute reburst,
I_ after the twO-mimers reburst, prior tO _he nlnet-s_nd reburst, and after the
I ninety second reburst.
Ii The clearance, shOwed that a rub.of.. 0.305 mm (0,012 in)probe, measurements
.... was sustained during the reburst testing._ The performance instrumentation_pro-'_.i vlded data for the.G,E. Phase IS computer analysis of engine performance.. As-
i aumptlons and data adjustments made.ln thls performance study were: |q
i a, All data wore adjusted within the program tO sea level, dry, standard, day conditions,
b, Core flow was based on high.pressure turbine flow function.
c, Compressor discharge temperature,was based on the initial.buildstatus.deck compressor,map and Compressor efflclency characterletlcs wereassumed to remain constant throughout this testing. This assumption.or COrrelation use was necessitated by difficulties encountered withcompressordischnrge instrumentation. This is consldered a valid de-
!. viation, hOwever, since the compressor stages were intentionally assem......._: bled wlth large tlp clearances tO avoid rubbing, which •couldvery wall
result in lower..efficiencies.
i_,. d, The High Pressure Turbine efficiency was calculated from the turbine' pressure ratio,, inlet temperature and work extraction. The turbine_,: inlet temperature _not measured) was determined from the compressori_ discharge temperature and the.Combustor- temperature rise associated.:: with the measured fuel flow. The turbine work was determined from an
i:- energy bahmCe with the measured compressor system. This is an acceptedi" • prOCedure_.
•.......The low pressure turbine for this test was.built wlth new statlonaryseals. Thus. some LP: turbine deterioration was experienced.during the .........
' test: program and is accounted fOr-ln the measured overall-performance_._i results. The Phase II data analysis IndiCated.the.amount of LP turbine
deterioration was on the order Of.0.1% _SFC and 0.6_ C (I° F) increasein exhaust gas temperature, The performance data reported-herein have
i_ been adjusted to account for the LPT deterioration sO that the datai COuld be compared with respect to performance effects due to the HPTi Ouly,
l 33

!
7.1.1 Discussion of Results
The results shown in Figures 18, 19 and 20 represent thechanges in high
pressure turbine efficiency, exhaust gas temperature and overall engine speci-
fic fuel .consumption associated with a clearance change of 0.305 mm (0,0121 In]£rom the baseline performance power calibration,
A prediction of changes in turbine efficiency, exhaust gas temperature andspecific fuel consu_ptlon was made for an 0.305 mm (0.012 in) change in Staga 1 _
rotor tip clearance. This prediction was based upon the analysis of test re-
sults obtained in several air turbine component tests and the attendant engineperformance models developed as a result of these and others designed to isolate
" .i the performance related characteristic. A comparlsonof the test data and pre-dictions is sho_n in the following table:
• Effect o_ 0.305 mm (12 mils> Sta_e 1 Tip Clearance _ncrease at Takeoff
(F - 222kN/50,000 Lb)
Test Results Pre-Test Prediction
_ _ -0.7 -0.57i
- _ EGT°C 9. 7
SFC X 0.37 0.55
Clearance (mm) -0.4_ -0.53An T.(_)
Clearance (mils) -17 -21 •
_n._ (_).
If all of the calculated deterioration in engine performance is assign,
able to the measured change in HPT Stage 1 blade tip clearance, the results
of this test show a stronger effect of Stage l.clearance on performance
than determined by previous tests. •Therefore, explanations for this differ-
ence were sought. I i
• Mentioned previously wasthe assumption during performance data reduc- " ition that the compressor had not deteriorated during this test. There is
" no evidence, b_sedon tip clearance, that the compressor changed.. :I
34

I'_ OF POOR QUALITY i
Slr :'
.' u
0 _
*., _ =
_., ¢_ P_I=,el.
0 tO
=._ "_ e.
_ 0
t °0 ¢3 0 0 _-0 _0 _ qr
'!' " ,.;- ¢;..... d- d3ueo._ed 'sSO'l ,_OUeTOTlI_ euTq.xu,L dH "I
35

tORIGINALPl_(;:l__ fOF POORQUALITYw! ......................................................................................................................................................
iJ
36


The deterioration of the Low Pressure Turbine was assessed at 0.1Z in
SFC. If this number were in error, the results for _PT Stage 1 clearancederiva_ive would change.
Throughout the CF6 dia_nos_ic program, a cause of deterioration, whichhas been consistently identified as si_nificant, _ increased airfoil surfaceroughness on fan, HP compressor, HP Turbine and LP Turbine airfoils. Althoughit would not be anticipated that sisnificant roughness increases occur overthe relatively short time encompassed by this test, the tip clearancederiva-tire was established on the basis of small changes in performance for smallchanges in measured clearance. This means then that variables, such assmallincreases in roughness, may have some effect on these test results that isnot readily recognizable. Any unassessed deterioration which did occur wouldbe in the direction of improving the agreement between, the derivative measuredin this test and the _reviously accepted derivative ....
One thing is clear.• The Stage 1 HPT blade tip clearance has a signifi-cant effect on engine performance and the derivative ofStage 1 clearanceon performance was assessed to be. at least_as influentialasthat which
i hasbeen _eviouslyaccepted ....
_i!' 7.2 BP TURBINE STAGE 1 CL_CE MAP'_ The results of the clearanceometer test are presented for several opera-
i- tional conditions. Tip clearance is presented as a function of time for
the following throttle movements; an accel from ground idle to steady-state.._i takeoff power in which takeoff power Isattained wlthln I0 seconds;-a decel
from steady-state takeoff condi_ions to ground idle; and varylng-times at
ground Idle followed by a burst to takeoff power. In addition, clearance is
I exit temperature (T3) , and as a function of compressor exitpressure (P3).
The clearances presented are the average of the readings of the eight probesand data have been corrected where necessary to reflect a consistent setof amblentcondltlona.
/
_I 7.2.1 Clearance As a Function of Time for e lO-Second Accel from
i, Ground Idle _o.Takeoff Power ._ The measured Stage 1 blade-to-shroud clearance as a function of time for
• a lO-second accel is shown in Figure 21. The predicted clearance is also
_i plotted. There is approximately an 0.25 _ (0.010 in) difference between .measured and predicted clearance with the measured clearance being larger-
_' than the predicted clearance. The major difference between the predictedand measured clearance appears to occur at the steady-state takeoff and 1
idle conditions. The shape of the curves, however, are very similar. 1
_ Three distinct areas of clearance behavior may be observed. First, as •rotor speed increases fr_nO-10 set., the clearance decreases due to mechanical(pri_arily speed) effects. From 10-35 sec. the static structures become warmerthan the rotating structures, resulting in a clearance increase. From 35-1000set., the more massive rotating structureswarm up causing clearance to decrease
and eventually reach a steady-s_a_e value, i !I
3S I •

3O

• ..... , _ • _ ...... 7,_,_, _. •.... _ --_ _¢._ ._ _. . _.,._
l7,2_2 Clearance As a Function of T.Ime for a Deeel from.Stgady-State
Takeoff Power to Grou, d Idle
The measured Stage 1 blade-to-shroud clearance as a function of time for a
decel from steady-state takeoff power to ground idle is presented in Figure 22.The predicted clearances are alsoplotted .... As is evident from this figure, themeasured clearance compares• very well with the analytical prediction.
i
ii_: Again, clearance as a function oftlme for a decel is characterized by__ \three regions. As RPM decreases, clearance initially increases (up.tol0
seconds). Then the stator cools down, closing around the rotor (i0 to i00seconds)•; _Inally the rotor cools, causing a clearance increase (I00 to I000seconds).
7.2. 3 Reburst
Previous to this investigation, throttle rebursts were thought to be ._the sIEnlflcantcause of resultant clearance increases and consequent perform-ance losses. One of the objectives of this test was to obtain clearance and
_emperature data for various reburst operatlonal.conditions.to verlfythls, i
Reburst-type data were obtained for engine Idle times of 8, 6, 4, 2,
I, and %mlnutes. Figure 23 presents the round engine clearance data
resulting from these tests. The starting point for each of the plotted curves _,.is the beginning of thereaccel from ground Idle after the labeled dwell time.
A reburst from stabillzed ground Idle (i.e., 30 minutes) is also shown forreference. This represents a "cold" rotor reburst or a accel from stabilized
ground idle. - ...........
_t is evident from Figure 23 that a minimum clearance exists for re-
bursts following a one to two minute dwell time at ground idle. This is also
supported by data presented in Figure 22 which shows that the mlnlmumclearanceduring a decel occurs at approximately I00 seconds._
Clearance as a function of time from the steady-state takeoff power
point through the accel minimum clearance point for a reburst after a two-
: minute dwell time at ground idle is shown in Figures 24 and 25.• Figure 24shows the effect of reburston clearance. Figure 25 shows H_turblne rotor
_ RPM as a functlonof time. during this throttle sequence. The additional i
closurefrom steady-state takeoff resulting from a two-mlnute reburstls i0.7_mm (0.029 in.). This agrees extremely well with the predlctedclosureof 0.79 _n.(O.03_ in.).
This reburst data shows that warm and hot rotor (dependent upon ground _
idle dwell time) reburstsare englneoperatlng conditions which potentlallycause rubs and consequent performance deterioration. The time correlated
clearance andtemperature data obtained from thls:test has slgnlflcantlyen-hanced the understanding of reburstsand verified that the closure (and sub-
sequent rub) predictions are correct.
4o•

ORIGIN/_£."' _.,OFP-O0_QUAl.i_,y
41
4_.

Takeotltl_ ............
................ o.as -.,(o,01 in.) .
,i _ -T /i "
\
0.74 m. _. 71hal Oround Idle
d
_ ."1 I
0 '. 60 100 1BO _uOTi,.e,second
tFigure 24 ........Clearance Effects from Engine Reburst Af.ter Two MinuteDwell Time. _
i
r_:
Takeoff Takeoff
,d_ ._z I
Chop Burst
c_ ,_ 2 rain1
i .,, IGround Idle
i 1- ii
O 50 cO0. 150 200
Time, secgnds
Figure 25. Core Speed As a Function of Time Exhibitinga 2 Minute Dwell Prior _o Reburst.
43

,: i Exit Temperature, T3} and Compressor_Exlt Pressure, P3 ;I
!" The relationships of clearance as a function of core speed, compressor exit !i tempera=ure and compreusor exitpressure are presented in Yigures 26, 27 and 28.; The dataused to construct these curves were obtained from steady-state conditions |LI achieved during the power calibration work. Steady-state is defined as that time
!" when all engine parameters have ceased to appreciably change. Most of these
iI steady-state data are"off_design" conditions, i.e., other than ground idle, take,
i off, and cruise, i_" The datawere used as the basellnerelatlonships to establish an empiri- .........
L. tel model.to predict clearance for.an7 steady-state operating condition.iI,' This is a very useful tool because, to obtain approximate clearances for
a glven operating condition, it eliminates the need for heat transfer and
aeromodellng using the resultlngheat transfer and nero model temperaturesand pressures. This emplrlcal model Is only an approximation and certainly
not a totally valid analytical picture. It is extremel_ useful, however, i
in translating from a new engine to a deteriorated one, from a hot day:.
_, high altitude takeoff to a sea lev_.istandard condition takeoff, etc.
These functional relationships are also quite useful in assessing the
accuracy of steady-state calculations, especially the heat transfer portion
of such analyses.
!; 7.3 ENGINE SHUTDOWN (STOPCOCK) TEST "
An engine shutdown from cruise, or higher, power is termed a stopcock.The testing for this Inves£igation included a stopcock from cruise in orderto establish,he transient clearance response during this type of maneuver.
It is common in aircraft acceptance, testlng to perform stopcocks. The intent
of this investigation was to gather datawhlch would be of value in assessingthe effect that aircraft acceptance test stopcocks might have on short term
performance deterioration.
The stopcock test sequence was initiated from a core speed of 9500 RPM
after having stabilized at this speed for approximately i0 minutes. The fuelflow to the engine_as cut. The engine coasted down and was restarted after
i 200 seconds. This restart was done to eliminate the possibility of both high
I and low speed rotor seizure and of sump and bearing as a result of losing oil
cooling.
The average Stage 1 blade_to-shroud clearance versus time during stop-
Cock is presented in Figure 29. The core speed, N2, versus time is presentedin Figure 30 as a reference.
The clearance curve may be divided into three regions of interest. The _
first region is where clearance is increasing (up to 60 seconds). _This clearanceincrease is caused by the loss of mechanical effects (centrifugal forces and
pressure loads). The second region is that clearance decrease caused by thestatorcooling down (60 to 240 seconds). This stator cool-down period wasinterrupted by the engine being restarted. During the restart, the clearancereductionoccurs because mechanical effects are somewhat restored by returning
to idle. The third region of interest is where clearance increased because therotor was cooling (240 to 400 seconds).
44 _

r • 1t
OF POORQUALITY 'i
45

• 100 200 300 400 _00 600,Compressorgxlt Temperature,._ C --
Figure 27, Clea__r_t_c_As_ _ F.unctlon of Compressor Exlt Temperature,
46.


0 200 300 ........ 40_Time, _conds .
Figure 29. Clearance Versus T£me After S_opcock.
xo,ooo.._.,---T_,_ I iCru£se =--=41m_Stop Cock Interrupted- t
N2 . Ens£ne Refired end - I
8000 Recu_ed to Idle Ground
4_0k
aOOO
0 •0 1oo 200 300 400
Ttme, second=
Fl_re 30. Core Speed Versus Time After Stopcock.

A theoretical approximation of a stopcock from steady-state takeoff power,based on the cruise stopcock measured result, is shownin Figure 31. Thiscurve modifies the information sathered in the stopcock test to reflect the
higher power level and removes the interruption in the transient which resultedwhen the engine was refired. It can be_seen that no round engine rub is pre-dicted for an uninterrupted stopcock in which no engine restart was made. \
7.4 COLD MOTORING DATA
w ..
Cold motoring data were obtained while turning the rotor wlthan airstarter motor. There was no combustion occurring within the englne_and prior
to this testthe engine hadnot been running for at least 8 hours. Clearance- Iometer data were taken durlng thls phase of testing. These data are presented Iin Figure 32. The cold motor roundness is plotted as davlatlonfrom the
average.
These data are requlrad for accurateanalyses of both clearance responseand out-of-roundness. The cold motoring data represent the cold clearances
and the shape of the HP stator as assembled. These data, therefore, are thebasis for both cold clearance and out-of-roundness. Itls the composite
picture of manufacturlng-andassembly causedout-of-roundness. The averageof the clearanceometer readings during cold motoring is used to establish the
cold clearance. The cold motoring clearance shape is used to establish the
initial engine out-of-roundness. This initial Out-of-roundness can then beutilized to modify the out-of-roundness data to reflect the round engine
assumedas the analytical starting point.
The Stage 1 blade-to-shroud clearance, asobtalned by post test inspec-
tion, is shownln Figure 33. Again, this roundnessshape is plotted asdeviation from average. _f a sli@ht rotor eccentricltyls assumedand
assembly caused out,of-roundness is considered, the similarity between the
two shapes (Figures 32 and 33) is close. This Is verified by the average of
the clearanceometer data and the inspection data being within 0.025 mm
(0.001 in) of one another.
7.5 HIGH PRESSURE TURBINE STATOR ROUNDNESS
The objective of this portion of the programwas to measure those
parameters believed toinfluence high pressure turbine roundness, analyticallydetermine their effect on roundness, and compare the calculated roundness to 1the measured roundness obtained from the clearanceometer results. _
• 1Themeasured roundness was obtained by averaging the data from the
clearance probes, subtractlng out the cold motoring measured assembly out-
of-roundness, and then plotting the deviations from the average clearance ivalue. This relates the roundness data to the clearance response data and
to a theoretical round engine starting point. Therefore, the variation ofreadings from the eight clearance probes provides a measure of the roundnessof the high pressure turbine Stage 1 shroud system.
49 i
I

'_" OF POOR ,QUALITY ............................................
e_ue_teoI_
L 50

Avernge4
Figure 39. Cold Motor Roundness, Deviattonof Individual
, Probe Reading from the Average of Ill Readings.
51

Round
4
Ftsure 33. Po=ttest 8tase X Shroud 8urfaco. RoundneslXn|peetton,

7.5..1 LOw Pressure Turbine Temperatures
The LPT stator case was instrumented with 48 skin thermocouples (SeeFi_'_re 34) in order to obtain data required to analytically determine LPTcontributions to HPT out-of-roundness. The two mechanisms believed to con-
tribute significantly to HPT out-of-roundness were temperature differentialsbetween the LPTstator case horizontalflanges and sheet metal skin andcircumferential _emperature gradients in the LPTstatorcasa skin. _
7.5.1.1 Horizontal Flange/Skin Temperature Gradients
. The temperature differences between the LPT statorcase horizontal _.flanges and skin were obtained from the test engine skin thermocouple _
data at various steady-state points including takeoff and ground Idle. Themaxlmumtemperature dlfferencebetween _he LPTstator case horizontal flanges
and .skin, for anyof the axial stations measured, was i08°C (194°F) a_ take-offandthe_maxlmum difference between the average temperature of the flanges
and skin was 31°C (55°F)_- Figures 35 and 36 compare.the axlal test tempera-
ture distributions of the LPT stator case horizontal fla-_esand skin (as
well as the _veral__ay_rage of all T/C's) for ground idle and takeoff condi-tions.... l...........]
_i 7.5.1.2 Circumferentlal Temperature Gradients
ii!i_i:iI LPT,stator case skin circumferential temperature distributions were sobtained for ground idle andtakeoff conditions using the test data. These
distributions _ere then represented by Fourier Series in order to determine
_:I the principal harmonics contribution to the distorted LPT stator case modeshapes. Figures'37 through _i illustrate the circumferential test temperature ]I ! distributions of each of the four axial stations of the LPT stator case and i
! of the_average of all axial stations for an engine _round idle condition_ii (refer to FIRure 3_ for axial station designation). F_g_res _2 through _6 :
!i_i illustrate circumferential test temperature distributions at the same locations
i_,,! for anenglne takeoff condition.
7.5.2 TurblneMidframe Temperatures
Temperatures of the-structural elements in the turbine m_dframe weremeasured at steady-state ground idle and takeoff power at the same time that
I clearances in the high pressure turbine were being recorded. The significant'_ engine parameters recorded at these conditions, which are used_for determining
. the mechanical loading on the TMF, are as follows:
Ground Idle Takeoff •
I "" Fan Speed, RPM 864 3785• Core.Speed, RPM 6_46 10,235
! _ Engine Thrust, N (Lb) 8496 (1910) 210,978 (47430)RPT exit temp., _°C . 400. 895 _
i HPT exit pressure, N/cm 2 (PSIA) 11.5 (16.7) 58.7 (85)
53


1
5S ................................

56
]1._

OF POofl _l._._.t._-,_, ......
TAv
Data Point Missing..__.Between End Points
Figure 37. LP Turbine StatorrCase Circumferential Temperature Dlstribution,Axial Location Number I t" Ground Idle.
57

OF PO0_ QUALITY
,, _l_ 50° F_ 10° C
TT .
TAv
a
Figure 38. LP Turbine Stator Case Circ_n_erential. Temperature DistribUtion, ..Axial Location Number _ Ground .Idle.

I
\TAv
\
.i
\ /Estimated (Data _%
, Not Available)__._ ............................_q._ _/
B_
Figure 39. LP Turbine Stator Case Circumferential Temperature Distribution,Axial Location Number 3, (]round Idle.
59I

ORIGINALPAGEISOF POORQUALITY
1
TAvg
t_i̧
J
i
• Figure 40. LP Turbine Stator Came Circumferential Temperature Distribution,Axial Location Number 4_ Ground Idle. _

OF _OORQUALITY'
TAvg
Figure 41. LP Turb£ne Stator Case C£rcumferential.Temperature Distribution,., Ax£alAverase, Ground Idle.
.t
61J

Figure 42. LP Turbine StatOr Case Ctrcumferent_al Temperature Distribution,
_._ Axial Location Number 1,__Tak@_f.f_ ....................................................................................................................................................................................
'i
62 ...........................
L ,,. •

a
Ft_tlw 43. IA_ Turbine $tat_;rCaBe Cirt'ttmterQutlaX Teml}eraturQ DI,trttatt_kou, ..
• A._tal LOca_tOu Numb_" 2, T.k,_ff. .
' !d ....... _ .......... .,.. .......... ..il

ORIGINALPA_E I_OF POORQUALITY ,;
'"I
__L ii
100° F- i• \ "
20 o C
Figure 44. LP Turbine Stator-Case CLrcum£erential Temperature Distribution|_Axial Location Number 3, Takeo££. - 1
, 64 _ i

TAv
Figure 48___ LP Turbine Stator Case_Ctrcumferential Temperature Distribution to _ Axial Location Number 4, Takeoff.
6_

• TAv
!
Figure 46. LP Turbine Stator Case Circumferential Temperature. Distribution,Axial Average, Takeoff.
66

il i_ The measured temperatures in the TMF_structural elements are shown in
I Figures 47 through 49 for 8round idle and Figures 50 through 52 for takeoff.
, _ The temperatures of each of the eight struts was measured to obtain thestrut to strut variation shown on Figures 49 and 50. The hub temperature wasmeasured at several circumferential locations. No significant temperature
_i: _ • variation was noted; therefore, only _he_average temperature is shown on_..t, Figures 47 and 50._
I_i"'I' The temperatures on _he TMF casing hat sections were measured at .the base
ii " and apex:of the hat section at a number of circumferential locations. Thesemeasurements were then used to calculate the area weighted average temperature[_! and radial gradient at each location. This was done in order to obtain the
_:.i;_ data in a form which would be usable.ln the analytical model. These are the_! ! data presented on Figures 48, 49, 51 and 52. Also shown onFigures. 51 and 52
_:.|+ are the estimates of these temperatures made prior to this testing. These
engine testing. As the thermal mass and heating/coollng mechanism for the hat
section varies around the circumference of the TMF caslng, temperature measure- _ments were made at t_elve circumferential locations to obtain an accurate repre-
i!__i sentatlon of_ha.tamperature varlations in this area.
ii_! Temperatures on the TMF/CEF flange were measured at the radial mid point
- of both the CRF and the TMF flanges as a measure of the average flange temper-
ature and_are shown.on FiguTes 53 and 54.
/_!'_: 7.5.3 High Pressure Turbine Stator Temperatures
! Temperatures were also measured at three locations on the HPT'stator at
I the same engine operating points.. The results are shown on Fio"ures 56 through57 for ground Idle and Figures 58 through 60 for takeoff. _-
67

68
_ , ,_ - ,, i , i I II lllIIl II I

69

ORIGINALPAG_,_i:_OF POORQUALITY
70


72

73


.......ORIGi_,L " ...._" "
Pkt::_,[_,;
OF-POORQUALITY A_'_,r
p,
HPT Shroud Support
450 ° C
400 ° C
350° C..
I
FiKure 64. Turbine Midirame/Compressor Rear Frame FlanKe _verage• Temperature s Takeoff.
-t
'!i/ 75
I'. • _ " j

Figure 55. HP TurbineStator Temperature,Ground Idle (Location A).

p
ORIGINALPAGEL"J'OF POORQUALITY
\
• . _._10 ° (3
. "T
Figure $6.__HPTurbine Stator TemperaturejGrQund__dle (Location B).
7 .......

184°
:_ Reference
F£gure 57. BPTurbine Stator Temperature,Ground Idle (Location C).
78

,: . , • • _' , ...... _ • • , _i_'¸_' _. ,.
n_ORIGINPzLP_,,,_._[_OF POORQUALITY
" Figure 58. HP Turoine Stator Temperature,.Takeoff (Location A).
I
0 •
79

o_. _:_. _.
' 20 ° C..
-r-
543. o
Reference
_i_ F_ure 59. li_ Turbine Stator Tempera ture,._Takeoff (Location B).
i:i
80_

OF POORQUALITY
10° Ce.
-t"
" Figure 60. HPTurbine Stator_TemperaturejTakeoff (LocattonC).
81

7.5.4 Low Pressure Turbine Effects
Horizontal Flange/Skin Temperature Gradient Effect s
Based on the CF8-50 structural system model, the gradient of the averagesof the LPT horizontal flange/skin temperatures (see Figures 35 and 36) trans- .
lares into an HPT stato_ out-of-roundness of less than 0.025 _n (0,001 in). _ \
Circumferential Temperature Gradients I i
Each of the ciroumferent_al temperature distributions depicted in Figures f' i
37 through 46 was represented bya Fourier Series.. These representations ldemonstrated that no single harmonic dominated the mode shapes at the ground
!idle condition but that for thetakeoff condition, the first harmonic clearlydominated. The Fourier Series representations of .the circumferential averagemode shapes for both ground idle and takeoff were used in conjunction with the."CLASS/MASS" influence coefficients to determine that the LPTinduced HPT But-
of-roundness is approxima_ely 0_025mm (0.001 _ for both ground idle andtakeoff conditions.
Discussion Of LPT Caused HPT Out-Of-Roundness
The LPT-caused HPT ou=-of-roundness of approximately . 025 -_ (0.001 in. )from the thermal gradient of the flange/skin system and of approximately 0.025. mm(0.001 in.) from the skin circumferential gradient are very small compared to 1the out-of-roundness caused by the turbine midframe. Considering the complex-Ity of the.model and the many approximations made throughout the analysl.s.. _techni%ue, these small out-of-roundnesses wer_e__ILe_lected. _
7.5o5 Tur_Jine Midframe Effects 1L _ L
Using the measured temperatures uu the turbine mldframe structural elements
and TMF/CRF flange, and the engine operating parameters to-establlsh mechanical
:_ loading on the TMF, the out-of-roundness in the HPT stator was calculated forground Idle and takeoff. Thli calculated out-of-roundness is shown in Figures61 and 62.
High Pressure 5_rbine Stator Temperature Gradient Effects
The calculated stator out-of-roundness due to. the measured temperaturevariation in the stator is shown in Figures 63 end 64.
Total Calcu!a_ed Out-Of-Roundness I
The total calculated HPTstator out-of-roundness, due to turbine mldframe
effects and high pressure turbine stator temperature gradients is shown in
82

o.=5== (o.oz _n.).
8 "
Figure 61. Calculated HPT Stator O_t-of-Roundness Due to T_F,Oround Idle.
@
83 '
Il

F_sure 62. Calculated. Hl=T Stator Out.-of-Roundness..Due to TMF_ _iTakeoff.
1,!
_' 84 i

ALF
jRound
Fisure 63. Calculated [-I13'1'Stator Out-o¢-Roundness Due.to Stator
, Temperature Variation a Ground Idle.
I .]
t
85 ....

, Round
Figure 64. Calculated HPT Stator Out-o2-Roundness..Due .to Stator !
Temperature Variation, Takeoff.
6 _-_

Figures 65 and 66 and compared to the measured data at these points from theengine test.
7.5.6 Measured Transient HPT Starer Roundness
The high pressure turbine starer out-of-roundness for a thrnttle burst is_presented in Figures 67 through 72 andthe out-of-roundness during a throttle
' chop _s shown in Figures 73 through 80. These figures show the slowly changi_ngroundness relationship wlth respect to time during these throttle movements.
7.5.7 Discussion of Roundness Data
Themeasured versus calculated out-of-roundness is used to correlate the
analytical models, techniques, and assumptions used in HPT out-of-roundnesspredictions. Comparison of calculated to measured out-of-roundness under oper-ating conditions has not been possible prior to the testing conducted in thisprogram. Comparison of the HPT out-of-roundness measured during this test tothat calculated from the operating conditions and adjacentstructure tempera-tures obtained at the .same time provides the.data required to show where im-
provements need to be made in the analytical prediction methods. These datacan also be used in the future to verify the effectiveness of any such improve-
ments.
The correlation bet_een measured and calculated out-of-roundness is not
good, especially at the takeoff condition. A review ofthe measured transientout-of-roundness data followlng a rapid accel from ground idle to takeoff and
also following a rapid decel from takeoff to ground idle, Figures 81 and 82,
shows that the change in distorted HPT sta_or shape occurs gradually over a
il_il period of several minutes. From this, it Is concluded that the ma_or drlvlng
element for out-of-roundness is the differentlalthermal response in the engine "_! structures which is.known to occur slowly. Mechanical loads will result in a
,l_i!i near step change in _ut-of-roundness asthe parameters which• cause these loads ,_' (thrust and +internal pressures) change only during the initial 10,20 seconds and
then remain relatively constant. Prior component static load testing has shown
good correlation of measured to calculated out-of-roundness formechanlcal and
thermal loading with the TMF structural elements. From the above discusslon,it is concluded that improvements, ln out,of-roundness prediction methods are
required in the area of thermally induced distortion in__he_engine casings andHPT starer structure..-
, 7.6 CLEARANCE AND ROUNDNESS _UANT_TAT_VE BASELINE
A quantitative baseline has been defined from the clearance curves and• the out-of-roundness plots obtained from this test. Although the relationship°
between performance and clearance has not been experimentally evaluated, thedata obtained from tests conducted do provide a basis for more accurate theo-
retical predictions.
Although there is a minor mismatch between the measured and analytically
predlctedclearance as a function of time relationships, the curve shapes of _.the analytical model correlate well (Ref. Figures 21 and 22). This willenable accurate assessments of response rates, total times, slope changes,
etc. of proposed design changes. 87

Fisure 65. To_al lipTurbine S_a_or Our-of-Roundness, Ground Idle.

r
89

Fl8ure 67. HPTurbine Stator Out-of-Roundness, Burst + 0 Seconds•
I
' 1
9O

45
• Fisure 68. HPTurbL__neStator Out-of-Roundnessp Burst SecOnds.
1!


OFPOORQU/_!.ITY
F£ursEE_70. HP Tu.r.blne_sta._.or..Out-.o_-Rqundn..ess,_...B__r_s._.._.+123.S..e_.o_ndp............................ !
• ii
93

OF POOR QU_Li_CY,i
,
Figure 71. HPTurbine Stator Out-o_-Boundness, Burst + 306 Seconds.
94

i
OF_..POOR (_LIALiTY
0,25 eml (0.01 :l.n.)
--f-.,! ° 1
Round
, •
ib
Ftsure 72. HP 'A_rbtne Stator Out-o_-Roundness t Burst + 747 Seconds.

I...........
98

¥isure 74. HP Turbine StatorOut-of-Roundness_ Chop + 10 Seconds. .!
.1............ 97

4
I
Fisure 75. HP Turbine Stator Out-of Roundnessj Chop Seconds.
98

ALF
_ 7 I_ii:l!i_l "
i_i 64
Figure 75. HP Turbine Stator Out-of-R0undness e Chop _ 40 SecondB,
99

F_gure 77. HP Turbine Stator Out-og-Roundness, Chop + 100 "Seconds. I
1'loo I

81
7 ALF
101

!
6 _
I1
.1
¥1gure 79. HP Turbine S_ator Out-o:_-Roundneu, Chop + 425 Seconds.
J
102

I._._
OF POOR QU/,_.k_"Pt'
_i• 9.5.
1
t
.!Figure 80. HP Turbine Stator Out-of-Roundness_ Chop + 109.0 Seconds.
103


:_aNd_lli_f_am_,_,,,_m_-,,_. .................................. _ .......... :.....:_::_._._.... _ ..... , _.. ..,,.,
,. °
.... 8.0 DISCUSSION OF RESULTS
provide insight into the causes and magnitudes of Stage $ rturbofanrelated engine performance deterioration of the CF6-50 engine.
doing, itwas Judged that the principal gain to be realized would be theengineidentification of improvements which could be made to the in order to
reduce its fuel consumption.
Analyses conducted prior to this contract indicated that a meaningful
investigation would have to Includethe following elements:
a) A survey of normal transient and steady state clearance behavior
i! suchas:
i) Accels from low to high power_ 2) Decels from high to low power_! ., 3) Establishing clearances as functions of*N2, P3, T3
h) A surve_ of non-rautlne transients including:ifi_ I) Throttle reburs_s with varying ground idle dwell times__._
2) Engine shutdqwn (stopcock) from high power
c) A survey of shroud surface out-of-roundness during transient and
steady state op.eration and an assessment of the •causes of this out-of,roundness
d) A direct measurement on a full-scale operating engine of the effect
that a change in Stage 1 blade tip clearance has on engine fuel
consumption, ._.
The results of thls_InTestigatlon have been meanlngful in all of theseareas: :.
a) Normal Translent and !!teadY State Clearance Behavior
The results of this investigation show that a good understanding exists
of the behavior of the englnewhen it is assumed to remain round and the rotorand stator concentric, A relatively constant error exists between the measured
and predicted clearances for an accel from ground idle totakeoff power (Figure21). The disagreement is about'0.25 mm (0,01 in), The location of maximum andminimum clearance values in time are in excellent agreement, These results
indicate that the analytical tools being employed and the assumptions madewith respect to transient thermal and mechanical response wi11 result in.
reliable predictions of round engine clearances.
The above statement is further supported by the transient decel responsefrom takeoff to idle, (Figure 29), which also exhibits good correlation both inlevel of clearance and in timewise location of maximum and minimum values.
106

With respect to the establis_ment of clearance as a function of power
level (N2 , P3' T_), that information will be of value in the determination ofthe impact on fuel consur_ption of part-power and off-design point engine opera-tiou. _tia necessary to know these relationships when conducting _ntegratedfuel burn calculations, for example; conducting such studies was not a task orgoal of this investigation.
t b) Non-Routine Transient Behavior
This investigation provided a survey of an important class of transientengine operati,ns called rebursts. A reburst is defined as a decal from a
" high, stabilized power point to idle followed by an aceel back to a high power,point. The variable which characterizes the severity (nearness-to-rub) of areburst is the length of time the engine is operated at idle prior to the ac-celeration to high power. This L_terval is termed the dwell time. Figure 23shows the clearance behavior duringthereburst acceleration for various dwellt ime8.
This information is of value for two major reasons. One reason is that byknowing the dwell intervals over which rubs are most likely to occurs, factory
• acceptance tests and aircraft acceptance and commercial operation procedures
may be adjusted, wher possible, to avoid both short term and longer term de_e-
rloratlon caused by increased blade tip clearances. The other is that it pro-vides a basellne with which improved designs, intended to make theenglne less
sensitive to rebursts, may be compared (Eeference 2makes use of these data toshow the improvement achieved in a modlfleddeslgn) .... _
The other non-routlnetranslent investigated was an engine shutdown. There ;
are two types of engine shutdowns of interest, a shutdown from high power at or
near sea level ambient condition (stopcock) and a shutdown at altitude followedby a dwell time durlngwhlch the fan continues to rotate (windnLi11) by virtue of
the alrcraft_s forward momentum and finally an engine restart and accel back tothe power level from which the engine had been shut down. The latter case is a
form of a reburst called a windmilllng air start. Investigation of wlndmilllng
air starts was beyound the scope of this investigation. Nevertheless, the arean important source of deterioration and data from the enslne shutdown actually
performed in the investigation.was used to predict clearance behavior for wind-milllngalr starts.
The engine shutdown actually performed was a stopcock. The clearance andcore speed transients are shown in Figures 29 and 30 respectively. The stopcockwas interrupted, for reasons discussed earlier, at 200 sac. The en8ine was re-fired and returned to idle. Figure 31 is an extension of the stopcock data,as-suming that the atopcocked engine was not restarted and adjusted to initiate
• from takeoff power rather than from cruise power as actually conducted. Itshows that a rub would not be expected to occur.
Two things stand out. One is that a pure (uninterrupted) stopcock will notresult in a rub. Secondly, a stopcock which is interrupted may very well resultin a rub even though the engine is being returned to only idle power. This issignificant. It demonstrates that more attention needs to be paid to what onepreviouslywouldhave considered to be of little significance: the transient
107

movements from shutdown to motoring and motoring to idle. Depending on what
preceded these transients and on the length of shutdown time, rubs (deteriora-tion) are predictable.
One final note on windmilling air starts. The data from this investiga-
tion were adjusted to analytically predict the clearance behavior during awindmilling air start performed during the flight test program of a differentmodel of the CF6 engine. Because of geometry differences between engines,
probable imprecision in the extrapolation to different ambient conditions and \other adjustment inaccuracies, this analysis mustbe considered an approxima- -. '_rich| however, rubs were predicted of a magnitude in reasonable asreement withthose actually observed by borescope inspection.
Since windmillin8 air starts are performed during aircraft acceptance -
testing, they represent a potentially signlficant source o!_ short term deteri-.
oration which may be recoverable either by adJustlng acceptance test procedures ili!or by incorporating design_) which are less sensitive to these throttle movements.
c). Shroud Roundness Survey
This investlgation was the first survey of transient and steady-state
roundness performed on an actual full scale operating CF6-50 engine. Previous,
and unrelated, component testing had established relationships between the out-of-roundness of various engine structures and the resulting induced shroud out-
of-roundness. These relationships were used in stress and deflection models
_oes_ablish shroud shapes. This present Investigatlon has demonstrated that
previously established estimates of shapes do not mirror the actual shapes
well. Figure 66 illustrates the point and demonstrates the value of havingrun this.lnvestigatlon. Fromempirical investigations, it: is known that the
measured shape is an accurate reflection of the net out-of-roundness of the
Stage I shroud surface. Engines which run with a Stage I shroud surface
ground to a round condition have the highest likelihood ofsustainlng rubsbetween 2:30 - 3:30 and 7:30 - 9:00 o'clock, aft looking forward. The
measured results of this investigation _re in agreement wi_h this empiricallydetermined out-_of-roundness shape.
Both the shape and magnitude of shroud out-of-roundness can be deter-
mined empirically as has been the practice. The signlflcant aspect for poten-.tlal fuel efficiency improvements is the magnitude, not the shape, of out-of-roundness. This investigation has established that the potential for im-
provements in roundness is on the order of 0.38 mm (0.015 in.) equivalent to ,f0.86 percent in turbine efflciencywhlch translates to a cruise SFC improve-
ment potential of approximately 0.36 percent.d) Tip ClearancePe_formance Derivative
The results of this investigation have assigned an importance to Stage
1 blade tip clearance which is in reasonable agreementwith unrelated pre-vious testing and with the investigation of Reference 1. This present in-vestigation indicates that the Stage 1 blade tip clearance has a somewhat
stronger effect on fuel efficiency than has been the accepted case.
I08

i
9
9.0 CONCLUSIONS
This testprogram has provided many outstanding results. Real-time Stage 1 ,iblade-to-shroud clearance measurements have been obtained for a CF6-50C engine.Since eight clearaucaometer probes were located around the circumference of the
_ Stage 1 shroud area, the circumferential variation was used to obtain the round- !i_ hess of the Stage 1 shroud area. Using the clearanceometerprobes while sus-
I tannin8 a Stage l blade-on-shroud rub established of the clearancethe magnitudeincrease during the rub. By monitoring engine performance before and after the
+ rub+ the effect of clearance upon performance was experimentally determined.
The test enslne was very heavily instrumented. This instrumentation pro-vldedtemperatures, pressures, flows, etc. for many sIEnlfloant engine parameters i
!
and areas of interest. These data points allowed a correlation _Ith these en-gine parameters and hish pressure turblna Stage I clearances.
• I
The pressure and temperature+measuremenP_ provided data that were used topredict the effect of both the turbine mldframe and the low pressure turbine
upon Stage 1 high pressure turbine roundness. The comparison of this prediction
and the measured roundnesswas used to verify that the current analysis tech-nique formechanlcally caused loads and distortions was correct and that the
,+ method used to evaluate +th_ effects of certain clrcumferentiaL+thermal _d_nte ,._; required modlflcat_on.1
!+i The average clearance data showed that, althougha small steady state error
! exists, the analyt_ca!i model of round enslne clearance response is qui_e+gopd .... '_iAreas of improvement in the fuel consumption characteristics of the CF6-50
I engine exp!ored in the discussion of results are: t
i 1. Design changes_to make the engine less rebura_ sensitive. !
2. Design and/or aircraft acceptance test changes to make the engine
!less sensitive to windmlllln8 air starts.
h_ 3. _ncorPoratlon+of designs which will improve shroud surface roundness. ii Reference 2 explores aspects of these improvements.t
109

111

_P_ND_X% r m_FERENC_S
i. R.H. Wulf, "Ensine DiasnosticsProsramp CF6-50 Ensine PerformanceDeterioration", NASA CR-159867, November 1980. \
2. W.D. Howard and W.A. FaschlnE,"CF6 Jet EnEine PerformanceImprovement - H_ghPressure Turbine Roundness", NASA CR-16$555December 1981. _........................

_J
A_PENDZXC
INTROOUCTION
The quality program applied to this contract is a documented system_ throughout the design, manufacture, repair, overhaul and modification cycle •
for gas turbine aircraft engines. The quality system has been constructed- to comply with military specifications M_L-Q-9858A, MIL-I-45208, and MIL-STD-
45662 and Federal Aviation Regulations ¥AR-145 and appl!cableportlon of FAR-21.
The quality system and its Implementatlon are defined by a complete setof procedures which has been coordinatedwith the DODand ¥AAandhae their. _,concurrence. In addition, the quality system as described in the qualityprogram meets the contractor requirements required by the NASA-Lew_s ResearchCenter. The following is a brief synopsis of the system.
sYsm, 1The quality system is-documented by operating procedures which coordinate
the quallty-related activities in the functional areas of Engineering, Manu- 1facturlng, Materials, Purchasing, and Engine Programs. The qualitysystem isa slngleastandard system whereinall product lines are controlled by thecommonquality system. The actions and activities associated with determinatlonof _qualltyare recorded, anddocumentatlon is available forrevlew.
Inherent in the system is the assurance of conformance to the qualityrequirements. This.includes the performance of required inspections andtests._ In addition, the system provides change control requirements whichassure that design changes are incorporated into manufacturing, procurementand quality documentation, and into the products. Material used forparts is verified for conformance to applicable engineering specifications,utilizing appropriate physical and..chemical testing procedures.
Measuring devices used forproduct acceptance and £netnmentat£on used tocontrol, record, monitor, or indicate results of readings during inspection
" and test are initially inspected and calibrated and periodically are reverifiedor recalibratad at a prescribed frequency. Such calibration is performed by
• technicians against etandards which are traceable to the National Bureau ofStandards. The gages are identified by a control number and are on a recallschedule for reverification and calibration. The calibration function main-tains a record of the location of each gage and the date it requires recali-bration. Instructions implement the provisions of MIL-STD-45662 and theappropriate FAR requirements.
113
_ork inscrucc_ous •re issued for co_pl_a_ct by operators, inspeccors:casters| and _echan_cs. Component p•rc manufacture provides for l•boratot_overv_e_ of a_l special and cr_c_c•l processes, includin8 qualification andcerc_c•t_on of personn_: equipment and processes.
.
When work _s performed _u accordance _r_Ch work insCrucc_ons, the opera-tot/inspector records chac the work has bean performed. Th_s _s accomplishedby the operator/inspector scamp_ns or s_n_ns the+operation sequence sheer Cos_sn_gy ch•C the operac_on has been performed.
Var_ous desisns of scamps •re used co _nd_c•Ce the _nspecc_on of statusof work Ln process and _£n_shed _cams. Pergcrmmce or acceptance of specialprocesses _.8 _.ud_.caced by dtst_cctve scamps •ss_,gned speclf_.cally co person-ne_. performin8 one process or _spect_.on. Ac_u_.sCr•Cion of cha scamp systemand the _.ssuance of eca_ps •re guncC_.ous of the Qual_.Cy 0person.on. The scamps• re'applied co che paperwork idenC_.fy_.u S or den0C_.u8 the _.Cmns requ_rin8 con-Crol. When so•spin8 of hardware occurs, only iaboracory approved ink _,s usedto assure 8sainsc dsm_se.
The type and locate.on of ocher p•rc _arkin8 are spec_.f_.ed by the desii_ensineer on che dr•win8 Co assure effects do noc couproucLse des_sn requite-sauce and p•tc quality.
.t
Control of p•rc handl_s•, so.teSs an_ dell.very is ma_nC•ined Chroush cheanC£re cycle. Ensinee and •ssembl£es •re scored in spec£s_ doll£es and trans-portation cares. Fin£shed assembled pares •re scored so •e Co preclude dam•8eand contamination, openinSS •re covered, lints capped and procecc_ve covets•ppl£ed •J required.
Hour.uS.rein8 hardware is controlled by a system of materiel review •C the_component source. _och • Qu_icy representecive and an EnZineerin8 repre-sentative provide the accept (use-as-is or repair) decisions. Honconfotuances
114
