r . inaugural lecture - core.ac.uk · enhancing extension education research using structural...
TRANSCRIPT

r .INAUGURAL LECTURE series

EnhancingExtension Education Researchusing Structural Equation Modeling
Enriching Evidence-Based ExtensionWolk Practices


EnhancingExtension Education Researchusing Structural Equation Modeling
Enriching Evidence-Based ExtensionWorl<Practices
Professor Dr. Bahaman Abu SamahDiploma in Agric. (UPM), BSc (Crop Science) Louisiana State University,
M. Sc (Extension Education) Louisiana State University, Ph.D (Extension Education)Iowa State University
18 November 2016
Auditorium PendidikanFakulti Pengajian Pendidikan
Universiti Putra Malaysia
UHIVEASfTlP\ITRAIIIAlAYSIAiu II ••• " i .....
Universiti Putra Malaysia PressSerdang • 2016
http://www.penerbit.upm.edu.my

© Universiti Putra Malaysia PressFirst Print 2016
All rights reserved. No part of this book may be reproduced in any form withoutpermission in writing from the publisher, except by a reviewer who wishes to quotebrief passages in a review written for inclusion in a magazine or newspaper.
UPM Press is a member of the Malaysian Book Publishers Association(MABOPA)Membership No.: 9802
ISBN 978-967-344-648-3
TypesettingCover Design
: Sahariah Abdol Rahim @ Ibrahim: Md Fairus Ahmad
Design, layout and printed byPenerbit Universiti Putra Malaysia43400 UPM SerdangSelangor Darul EhsanTel: 03-8946 8855 / 8854Fax: 03-89416172http://www.penerbit.upm.edu.my

Contents
Abstract
Introduction 3
Extension Education: The Tradition and the UPM Story 4
Extension: Linking Practices and Education 6
Statistical Analysis in Extension Education Research 10
Structure Equation Modeling (SEM) 11
Advantages of using SEM in Extension Education Research 12
SEM Terminologies
Requirements in SEM
Assumptions in SEM
What is AMOS
Goodness-of-Fit Indices
Construct Validity
Building a Theory Based Model
The Practical Stage of SEM Analysis
Direct, Indirect and Total Effects
Analysis Related to Multiple
Mediation Effect
Moderation Effect
16
18
242627
2830
31
4244
4660

Conclusion 66
References 68
Statistical Learning Tool (SLT 3) 72
Biography 75
Acknowledgement 81
List of Inaugural Lectures 83

Bahaman Abu Samah
ABSTRACTAmidst the increasing global demand for food, health, social,economic and political security, the need for new knowledgeand technologies initiated by higher learning as well as otherresearch and development institutions is undeniably significant.The transfer of such knowledge and technologies takes placesystematically through the support of impactful, effective andefficient extension work practices. The continuous challenge thatawaits extension professionals is to ensure that the knowledge andtechnology transfer process is not only demand-driven, but mostimportantly, research-driven and evidence-based. Research-drivenand evidence-based extension work practices can scientificallycomplement the demands of the community and industry. Poorresearch and extension work practice linkages will leave thecommunity and industry unfamiliar with new knowledge andtechnologies. This calls for an enhancement of extension educationresearch to enrich evidence-based extension work practices. Thisgap needs to be addressed by utilizing appropriate research andstatistical applications that can help extension professionals toexplain technical findings in a simple and straightforward mannerto their clients. Through evidence-based extension work practices,extension work professionals can connect clients with research-basedinformation, which will eventually improve their overall well-being.
Current and future trends in extension work practices call formore participatory knowledge and technology transfer approachesas compared to the old 'top down' model. Extension professionalsshould thus equip themselves with knowledge on adult educationand extension education research, as well as substantial technicalknowledge in planning, implementation and evaluation of extensionprograms.
Given the need for a combination of research-driven,participatory and demand-driven extension work practices, this
1111

Enhancing Extension Research using Structural Equation Modeling
inaugural lecture will focus on how extension education researchand organizational extension work practices can be enhancedthrough the utilization of appropriate statistical applications,specifically Structural Equation Modeling (SEM). Based on mypersonal and professional knowledge and experience, the first partof this lecture will be an elaboration on how extension educationstakeholders can take advantage of the powerful statistical analysesprovided by Structural Equation Modeling (SEM) in their researchand development projects. Secondly, I will highlight the importanceof equipping extension professionals with adequate knowledge andskill in the application and interpretation of SEM outputs. Finally,I will address how the incorporation of SEM analysis can lead tobetter development and enrichment of evidence-based extensionwork practices.
Malaysia and the world are faced with the task of providingmore evidence-based extension education work practices. This iswhere research and extension linkages need to utilize cutting edgeanalysis tools that can provide more objective and tangible evidenceto inform extension professionals on the impact of their work withthe community and industry. The use of empirical evidence inevaluating the impact of extension education programs must beembraced by stakeholders at all levels. Future extension educationwork and research will go beyond reporting feedback from clientsand partners and calculating income generated from extensioncollaboration. By making use of tangible evidence to informclients, which includes policy makers, researchers and extensionpractitioners at all levels (Ministries, Higher Learning Institutions,Research and Extension agencies and other relevant bodies) canprovide more rigorous input to improve and advance the overallresearch-extension-utilization ecosystem. Hence, in this inaugurallecture, I will humbly share how Structure Equation Modeling(SEM) can enhance extension education research and ultimatelyenrich evidence-based extension work practices.
1112

Bahaman Abu Samah
INTRODUCTIONThe increasing global demand for food, health, social, economic andpolitical security has called for new knowledge and technologiesinitiated by higher learning as well as other research anddevelopment institutions to be significantly extended to the widercommunity and industry (Bahaman et al., 2012). This transfer ofknowledge and technologies systematically takes place throughthe support of impactful, effective and efficient extension workpractices. The continuous challenge for extension professionalsis to ensure that the knowledge and technology transfer process isnot only demand-driven, but most importantly research-driven andevidence-based. Clients in recent years have voiced their penchantfor participatory and demand-driven extension methodologies (Baig&Aldosari, 2013). Research-driven and evidence-based extensionwork practices can scientifically complement the demands ofcommunity and industry. Poorresearch and extension work practicelinkages will leave community and industry unfamiliar with newknowledge and technologies. This calls for an enhancement ofextension education research to enrich evidence-based extensionwork practices. Extension professionals should cogently explain tothe public and other stakeholders how their work practices impacttheir economic, environmental and social well-beings (Gagnon,Garst & Franz, 2015).
This gap needs to be addressed by utilizing appropriate researchand statistical applications that can help extension professionals toexplain technical findings in a simple and straightforward mannerto their clients. Through evidence-based extension work practices,extension work professionals can connect clients with research-based information, which will eventually improve their overall well-being (Bahaman et aI., 20 IIa). Evidence based practices extensionare exceptional as it emphasizes on the use of statistical analyses to
3111

Enhancing Extension Research using Structural Equation Modeling
transfer science to practice in its research and extension linkages(Dunifon et al., 2004).
EXTENSION EDUCATION: THE TRADITION ANDTHE UPM STORYThe term extension education was first introduced in 1873 byCambridge University to refer to systematic educational initiativesundertaken by the University to disseminate relevant knowledgeand information to common people outside of university premise(Addison, 1972). This idea of educational initiative throughextension education was later spread to other universities in Englandand other parts of the world including the United States.
The enactment of Smith-Lever Act in 1914 marked thebeginning of agricultural extension in the United States. This Actled to the establishment of a national Cooperative Extension Service(CES) that provides rural American with relevant agriculturalknowledge through land-grant colleges and universities. Initiallyagricultural extension dealt primarily on agricultural advancement.Nonetheless, the initiatives were later extended to include homeeconomics, youth development, community and rural developmentand leadership development. At the time of the establishmentof CES, more than 50 percent of the US population resided inrural areas and about 30 percent of labor force were involved inagricultural related jobs or income generating activities. On thecontrary only 17 percent of the population is currently living inrural areas. (https://nifa.usda.gov/cooperative-extension-history).
Extension function was introduced in Malaya in 1905 with theestablishment of Department of Agriculture (DOA), Ministry ofAgriculture with the mandate to oversee all development related toagricultural sector (Azimi, 2007). However, eventually extensionservices in Malaysia are undertaken by various agencies under at
1114

Bahaman Abu Samah
least six different ministries that cater for specific commodities orservice sectors (Rahim, 1992).
As for the higher learning institution, the founding custodianof extension education originate in the establishment of Centrefor Extension and Continuing Education (CECE) in UniversitiPertanian Malaysia in 1976 which strategically went throughtremendous development serving the nation, the Asian region andworked closely with partners across the globe. The UPM extensionstory is worth sharing because it provides the original idea of what itis like in nowadays university-community-industry engagement. In1996, with the rapid change of focus at the macro national contextfrom an agro-based to a knowledge based economy, CECE was thentransferred to Faculty of Educational Studies, UPM as Departmentof Extension Education and continue providing extension educationadvise and services to the community within and outside UPM(Universiti Putra Malaysia). Interestingly, in 200 1,with the concernon the importance of food security and how it relates to the well-being of the global citizen, Malaysia realized that despite the need tocompete and strive towards becoming a developed nation embracingICT and knowledge based economy, agriculture should never besidelined and in fact, a sector that should be sustained so as toenhance the food security and well-being of Malaysia. Agriculturewas again seen as the important source to national sovereignity andextension education as one of the pillars in supporting agriculturalproductivity and the overall national well-being went through arejuvenation exercise. UPM eventually established a Centre forExtension, Entrepreneurship and Professional Advancement orAPEEC, which is now the University Community TransformationCentre or UCTC.
By being the guardian of extension and community engagementfor UPM, UCTC has grown to become an institution to be reckoned
5111

Enhancing Extension Research using Structural Equation Modeling
with. Extension services in UPM have branched out beyondagricultural extension, covering a wider focus on the social andeconomic well-being of the community in Malaysia and acrossthe globe. However, the overarching question that continuouslystimulate my lifelong commitment to my profession as a reflectiveextension education scholar, researcher and practitioner is to whatextent is our present extension education research and developmentactivities are in tandem with the current and how do we preparefor the future trends in extension work practices? In the followingsections, I will elaborate how extension work practices in UPM andMalaysia can be enhanced to fulfill the needs of various stakeholdersin and outside Malaysia.
EXTENSION: LINKING PRACTICES ANDEDUCATIONVarious definitions of extension have been put forward by variousauthors. According to Kelsey and Hearne (1966), "extension workis an out of school system of education in which adults and youngpeople learn by doing. It is a partnership between the government,the land-grant institutions, and the people, which provides servicesand education designed to meet the needs of the people".
Another definition was accorded by Leagans (1961), extensioneducation is an applied science consisting of content derived fromresearch, accumulated field experiences and relevant principlesdrawn from the behavioral science synthesized with usefultechnology into a body of philosophy, principles, content andmethods focused on the problems of out of school education foradults and youth.
Another definition was proposed by Maimunah (1989) whichstates that extension is a two-way communication process that
1116

Bahaman Abu Samah
connects knowledge center with an intermediary (extension worker)and the final recipients (community). The goal of extension isto bring about change among extension workers and finally thecommunity through the process of non-formal education so thatthey can improve their living standard towards prosperity.
It is interesting to note that extension is an out of school activitythat provides non-formal education for community to help themimprove their living standards. Research is an important componentto ensure success of extension program. Extension research shouldbe based on issues and problems faced by community in order tocome up with relevant solutions or technological innovation throughresearch should be channeled to these groups to further improve theircurrent practice thus resulting increase productivity (Bahaman et aI.,2009). In a research project on 'Youth and Telecentres in CommunityBuilding in Rural Peninsular Malaysia', (Bahaman et aI., 2013),utilizing SEM analysis, my team and I found how youths' utilizationoftelecentres can contribute to and influence community building.Characteristics related to the quality of information acquiredand utilized by these youth form the more powerful predictor toeffective community building. The SEM analysis provided a more'precise' and 'accurate' research findings that enrich my evidence-based extension work practices. I would like to argue that in mostextension education research and work practices, researchers andpractitioners are faced with the challenging task of explaining thecomplex and latent construct encapsulating their work to the widercommunity and industry in a more rigorous manner. Based on mycareer experiences I profoundly believe that some of our presentextension education research particularly in UPM, lack this rigorand can be further improved by reporting findings and recommendstrategies that are more precise and inclusive to enrich and sustainour extension work practices.
7111

Enhancing Extension Research using Structural Equation Modeling
Research and Extension Linkages
Research is an essential component of extension education to ensurerelevant and beneficial programs to its stakeholders. In the UnitedState, the notion of incorporating extension and research can betraced back to the enactments of the Morrill (1862) and Smith-Lever(1914) Acts. Particularly the Smith-Lever Act led to the partnershipbetween the United State Department of Agriculture (USDA)and Land-Grant universities resulting in the establishment ofCooperative Extension Service (CES). This CES enabled extensionclients comprised farmers and home economics to benefit in termsof better understanding and skills from research findings generatedby USDA and Land-Grant universities.
Extension can be envisaged as research-extension linkagesthrough which knowledge, information and innovation from researchentities are channeled to community by extension agents (Rahim,1992). Issues and problem faced by extension clientele should beused as basis for research which in tum help to generate solutionswhich will be channeled back to the people. In order to make surethat extension provides relevant and beneficial programs to itsstakeholders, continuous research employing appropriate theoriesand methodologies must be continually enhanced (Braverman &Engle,2009)
Research is important in extension as it 1) Generates newknowledge and technologies, 2) helps to better understand issues/problems, 3) is crucial to assessing community and program needs,4) is a tool for program development and policies, 5) is the basisfor decision making, 6) enhances knowledge to address extensionproblems, 7) ensures success of extension programs, and 8) helpsto evaluate effectiveness of extension programs.
1118

Bahaman Abu Samah
The Need for Research-Driven, Participatory andDemand-Driven Extension ModelCurrent and future trends in extension work practices have calledfor more participatory knowledge and technology transfer approachas compared to old 'top down' model. Extension professionals areexpected to provide more effective, accountable and evidence-basedextension education program (Fetsch, MacPhee & Boyer, 2012).Extension professionals should equip themselves with knowledgein adult education and extension education research, as well assubstantial technical knowledge in planning, implementation andevaluation of extension programs.
Extension General Dec._.n ....approach extension
Qproject-drlven
services! extension
transferaltechnoiOllY(TOT)
Example Centrallzect Commodity.top-down. focused extension,supply-drNvn e_g .• edension forservice: e.a ... rice IntenslflcatlOl'\,training and sue-' or cottonvisit system extension
Major Tec:hnoIOIIY Weakllnkag""I..... unsuitable
e>with research.
for local education andsoclo- prlvete sectoreconomic or,aniutionsand·sro-cUmaticconditions
Participatory Demand-human resourc.. driven.
"" development "" partlclpato<yLV extension LV and pI... Ustlcextension
Farmlresystemsresearch andextension;unlvef"sIty.community"" ....... rships
Insufficient
QpoIlcy.ndInstitutionalsupport
Oece_.IIH<tbottom-upapproactwswlth ....I""chain actors..-partners
Collaboration.mane
r'\ r ..... rc ...LV exte-nsJOf\,education andprivate sectororganlzations
Figure 1 Evolution of Extension Practices (Suvedi & Kaplowitz, 2016)
With the need for a combination of research-driven,participatory and demand-driven extension work practices, thisinaugural lecture will focus on how to enhance extension educationresearch and organizational extension work practices throughutilizing appropriate statistical applications, specifically Structural
9111

Enhancing Extension Research using Structural Equation Modeling
Equation Modeling (SEM). Using my personal and professionalknowledge and experience, this lecture will also discuss howextension education stakeholders should take advantage of thepowerful statistical analyses provided by Structural EquationModeling (SEM) in their research and development projects.Besides that, I will then highlight the importance equippingextension professionals with adequate knowledge and skill in theapplication and interpretation ofSEM output. Finally, I will addresshow the incorporation of SEM analysis can be linked to betterdevelopment and enrichment of evidence-based extension workpractices.
STATISTICAL ANALYSES IN EXTENSIONEDUCATIONData analysis is an integral component in any social scienceresearch activities including extension research. Research in thisdiscipline involves complex interrelationships between constructswhich comprise independent, dependent as well as interveningconstructs. The intervening constructs include, among others,mediators and moderators. In this light, lecturers, researchers orgraduate students must have mastery of two important elements,namely, 1) knowledge and understanding on statistics, and 2)skill in using statistical software, in order to equip them for dataanalyses. One must be familiar with various statistical procedures,from basic statistics to multivariate statistics. Understanding ofcommonly used statistics, such as t-test, ANOVA, correlation andregression analyses, must be internalized by every researcher. Inaddition, to ensure the appropriate application of each statistic,a researcher needs to understand seven basic information whichinclude: 1) purpose of the statistics; 2) requirements to use the
III to

Bahaman Abu Samah
statistics; 3) assumptions required to apply the statistics; 4) howto run the analysis in the statistical package; 5) what and how topresent the results of analysis; 6) understand the decision criteria;and 7) make the right interpretation.
As for statistical packages, there are a number of them that arecommonly used which include, among others, SPSS, SAS, Minitab,Rand Stata. These statistical packages are employed for generalpurpose statistical analyses. However, there is another category ofstatistical packages that are used for structural equation modeling.The use of structural equation modeling is not a substitute forthe other existing statistical analysis. Nevertheless, its usage isconsidered a complement to the others.
However for multi-dimensional constructs (i.e., it consists ofmultiple underlying concepts), the use of SEM is an advantage.The distinction between constructs and concepts is clearer in multi-dimensional constructs, where the higher order abstraction is calleda construct and the lower order abstractions are called concepts. Thenature of social research often involves social theories to explainthe phenomena we observe in the social world. This seems a fairlystraightforward exercise, but we need to remember that socialphenomena are not stand-alone events but are entwined with a seriesof constructs that need to be viewed within more comprehensiveinterrelationships.
STRUCTURAL EQUATION MODELING (SEM)Structural equation modeling (SEM) which has its roots in pathanalysis was pioneered by Sewall Wright, a geneticist, in 1921 (Hox& Bechger, 1998). It has been widely employed in various fieldsof studies, especially in social sciences (Cheng, 200 I). SEM is amultivariate statistical technique that incorporates factor analysis,path analysis and multiple regression (Hox & Bechger, 1998, Ho,
11111

Enhancing Extension Research using Structural Equation Modeling
2006). The use ofSEM has gained rapid momentum since the 1970s,which is attributed to the availability of user-friendly softwaresuch as AMOS (MacCallum and Austin, 2000). Additionally, itspopularity is attributed to its explanatory ability and statisticalefficiency for model testing with a single comprehensive procedure(Cheng, 2001; Hair, 2006). SEM is a group of statistical models thatseek to explain a series of simultaneous dependence relationshipsbetween the independent variables and dependent variables (Hairet.al ., 20 I0; Ho, 2006). SEM provides a quantitative test of atheoretical model hypothesized by the researchers, including howsets of variables define constructs and how these constructs arerelated to each other (Schumacker and Lomax, 2010).
In order to provide a much clearer idea about the applicationsof SEM, relevant results from a study (Mohammad Badsarand Bahaman Abu Samah, 2011) entitled "Factors influencingsustainability of information and communication technologytelecenter projects in rural Peninsular Malaysia" will be presentedhere.
ADVANTAGES OF USING SEM IN EXTENSIONEDUCATION RESEARCHThe following are some of the advantages or benefits of usingSEM over other existing statistical procedures that can be appliedin extension education research:
1. Model interdependencies between several outcome (DVs)and their causal factors (IVs)One common limitation of using the multivariate techniques isthat they can examine just a single relationship at a time, eventhough the techniques such as multivariate analysis of varianceallow for multiple dependent variables, but represent only a
11112

Bahaman Abu Samah
single relationship between the dependent and independentvariables (Hair et.al 2006, p.705). Structural equationmodeling on the other hand allows the researcher to test aseries of dependence relationships simultaneously. The SEMtechnique is especially useful in testing theories that includemultiple equations comprising dependence relationships (Hairet.al 2010, p.630) which can be applied to further enhanceextension education research.
2. SEM enables simultaneous tests of overall model fit as wellas individual parameter estimate testsWithout information about the model's goodness-of-fit, it isdifficult to assess the adequacy of the theory underlying thehypothesized model (Ho, 2006). SEM is capable of estimatingthe model fit and multiple and interrelated dependencerelationships at the same time.
3. SEM allows us to use latent (unobserved) variables independence relationshipsAs indicated by Schumacker and Lomax (2010) researchersare becoming more aware of the need to use multiple observedvariables as a measure of a latent variable. The latent variableprovides a better measure of an abstract or complex constructcompared to using a single item variable. The SEM analysishas the ability to incorporate latent (or unobserved) variables inthe analysis. A latent variable is a hypothesized or unobservedconstruct which cannot be measured directly (Ho, 2006).
4 SEM involves greater recognition of validityOne of the biggest advantages of SEM is its ability to assessthe construct validity of the proposed measurement theory.Construct validity is the extent to which a set of measured items
13111

Enhancing Extension Research using Structural Equation Modeling
actually reflect the theoretical latent constructs those items aredesigned to measure (Hair et aI., P, 708). Construct validity asindicated by Hair et aI., (2010) is made up of four components:convergent validity, discriminant validity, nomological validityand face validity.
5. SEM software programs such as AMOS have becomeincreasingly user friendlyToday, most SEM software programs (such as AMOS, Lisrel,Mplus and EQS) are Windows-based and use pull-down menusand a wide selection of drawing tools, which are much easierto use compared with software that need inputs (Schumacher& Lomax, 2010).
6. SEM improves statistical estimation by incorporatingmeasurement errorsGenerally the univariate and multivariate statistical techniquesassume that there is no error associated with the measurementof the variables (Ho, 2006). However, as indicated by Hair etaI., (2010), from both practical and theoretical perspectives,researchers cannot measure a concept perfectly and thus somedegree of measurement error is always present. For example,when asking about household income, we know some peoplewill not provide their actual income. Therefore, the answersprovided have some form of measurement errors and thataffects the estimate of the true structural coefficient (Hair etaI., 2010). Consequently, SEM incorporates measurementerrors in its analysis.
In order to show how SEM improves statistical estimation theresults of two separate analyses are presented, that employ multiplelinear regression (Figure 2) and structural equation modeling
11114

Bahaman Abu Samah
(Figure 3). These analyses involve four independent variables(leadership competency, telecenter characteristics, understandingcommunity and individual factors) and one dependent variable(telecenter sustainability). As depicted by the two results, thecoefficient of determination for multiple linear regression is (R2= .517) while for SEM it is (R2 = .641). In other words, the fourindependent variables in multiple linear regression explain 51.7percent of the variance in telecenter sustainability. On the otherhand in SEM, the set of variables explain 64.1 percent of thevariance in the dependent variable, which is a substantial increase(12.4 percent) in statistical estimation. This increase is attributedto the use of measurement errors in SEM.
TelecenterSUSlainabilily
R2= .517
Individualfador
Figure 2 Results of Multiple Linear Regression
15 III

Enhancing Extension Research using Structural Equation Modeling
0.. ...... ·380300OF·'42Ret..,. o.sq C"iS O~2 n1.. 000Ofl I". 8) •. 8Qi8AOFI p.• 0).86'Cfl (.... '.033IFI (" •• ,.834Nfl f••• }.8QO
TlIC"·.}·g2()RMSEA (,noe, -089AJC (.., '--)&&82_(~~..,.....)
Figure 3 Results of SEM Analysis
SEM TERMINOLOGIESSEM applies several terms for the variables used in its analysis.These terms include latent variable, manifest variable, exogenousvariable and endogenous variable.
1. A latent variable is an unobserved concept that is not directlymeasured. The latent variable is represented by a number ofobserved variables (items/indicators). Therefore, the latentconstruct is measured indirectly through multiple observedvariables or indicators (Hair et aI., 2010). According to Westland(2010), many social variables are conceptual in nature, whichcannot be measured directly. The main advantages of usingthe latent construct, as indicated by Hair et al. (2006), are"the improvements in statistical estimates (by incorporatingthe measurement error and capacity to assess validity as wellas reliability), that better represent the theoretical concept
11116
Bahaman Abu Samah
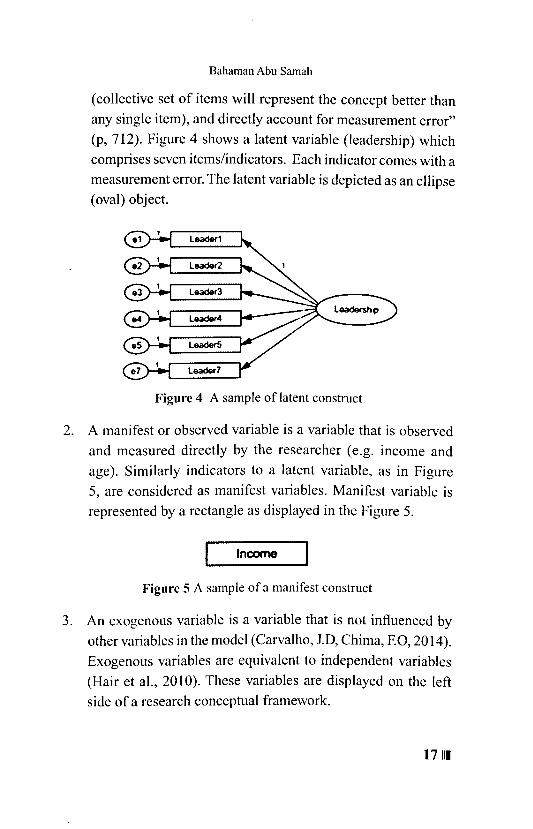
(collective set of items will represent the concept better thanany single item), and directly account for measurement error"(p, 712). Figure 4 shows a latent variable (leadership) whichcomprises seven items/indicators. Each indicator comes with ameasurement error. The latent variable is depicted as an ellipse(oval) object.
Figure 4 A sample of latent construct
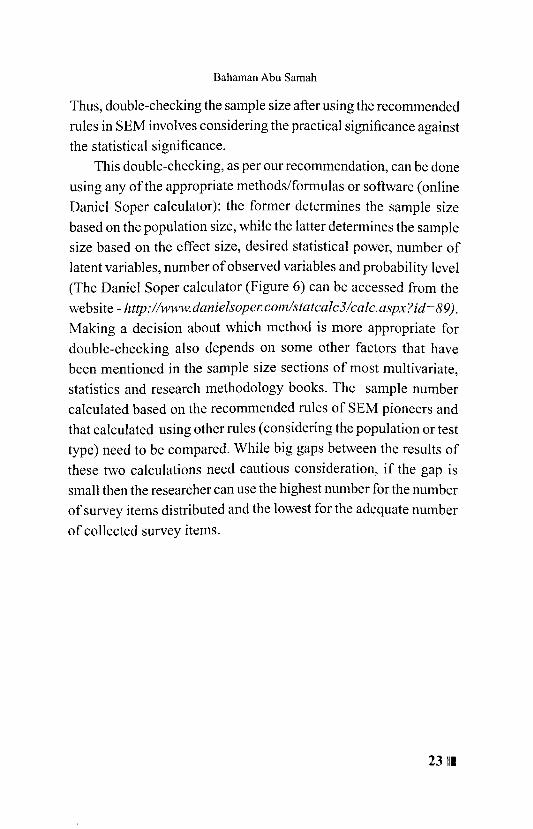
2. A manifest or observed variable is a variable that is observedand measured directly by the researcher (e.g. income andage). Similarly indicators to a latent variable, as in Figure5, are considered as manifest variables. Manifest variable isrepresented by a rectangle as displayed in the Figure 5.
Income
Figurc 5 A sample of a manifest construct
3. An exogenous variable is a variable that is not influenced byother variables in the model (Carvalho, J.D, Chima, EO, 2014).Exogenous variables are equivalent to independent variables(Hair et aI., 2010). These variables are displayed on the leftside of a research conceptual framework.
17111

Enhancing Extension Research using Structural Equation Modeling
4. An endogenous variable is a variable whose variation isexplained by exogenous variables and other endogenousvariables (including mediator variables) in the causal model!path diagram. The endogenous variables are equivalent todependent variables (Hair et aI., 2010). These variables aredisplayed on the right side of a research conceptual framework.
REQUIREMENTS IN SEMBefore taking a decision to use SEM, the researcher should checktwo major requirements for SEM analysis, namely, the number ofindicators and the sample size required.
1. Number of Indicators
The number of indicators or items is one of the contentious issues instructural equation modeling. From one angle, internal consistencyreliability is greater if there are more items (Kline, 2011, p.70).From another angle, more items (measured variables or indicators)are not necessarily better. Even though more items produce higherreliability estimates and generalizability, more items also requirelarger sample sizes and can thus make it difficult to produce trulyunidimensional factors. As the researcher increases the number ofscale items (indicators) representing a single construct (factor), theymay include a subset of items that inadvertently focuses on somespecific aspect of a problem and may create a sub-factor (Hair etaI., 2010, p.698).
Practically speaking, a model needs " ... a minimum of threeitems per factor, preferably four, not only to provide minimumcoverage of the construct's theoretical domain, but also to provideadequate identification for the construct". Identification refers to"whether enough information exists to identify a solution to a setof structural equations" (Hair et aI., 2010, p.698).
11118

Bahaman Abu Samah
Models and even constructs can be characterized by their degreeof identification, which is defined by the degree of freedom of amodel after all the parameters to be estimated have been specified.The degree of freedom in SEM differs from the degree of freedomin (for example) regression analysis in that it is not influenced bythe sample size. In regression analysis, the degree of freedomis the sample size minus the number of estimated coefficients,while the degree of freedom in SEM "represent[ s] the amount ofmathematical information available to estimate model parameters"(Hair et aI., 2006, p.74S). The degree of freedom for a SEM modelis determined by the following formula:
1d[ =Z[(p)(P + 1)] - k
(Hair et aI., 2006, p. 746)Wherep = number of observed variablesk =number of estimated (free) parameters.
An easy and practical way to calculate and check the degree ofmodel identification is to subtract the parameters to be estimatedfrom the unique term (which refers to the number of variances andcovariances to be estimated). Thus, the number of indicators usedin the model or construct could be used to establish the degree ofidentification in three levels.
The first level is when a construct is defined using two itemsor indicators. This produces a negative degree of freedom andconsequently the level of model identification would be under-identified. It is important to note that an under-identified modelcannot be computed. The second level is when a construct isdefined using three items or indicators where as a result, its degree
19111

Enhancing Extension Research using Structural Equation Modeling
of freedom is zero and it is thus referred to as saturated. In thissituation, the level of identification is called just-identified. In ajust-identified model, the number of unique variances/covariancesis equal to the number of estimated parameters. While a just-identified model can be computed and factor loading for items canbe estimated, the model fit cannot be computed.
The third level is when a construct is defined using four or moreindicators in which the model would have more unique covariancesand variances terms than parameters to be estimated. Therefore themodel has a positive degree of freedom, for which a fit value canbe computed. The third level of identification which is termed asover identified is in which all required estimations, including factorloadings and model fit indices, have been computed.
2. Sample SizeSample size is another requirement of SEM that needs carefulconsideration. It is generally understood among statisticians thatSEM requires large sample sizes. However, it is difficult to give asimple answer to the question of how large a sample needs to be(Kline, 2005, 2010). According to Ho (2006), there is no agreementon the meaning of "sufficiently large" (p.290).
Kline (2005, 2010), as one of the pioneers in SEM, has offeredvery rough guidelines for determining a sufficiently large samplesize. He asserts that a sample with fewer than 100 cases would beuntenable except in the evaluation of a very simple bare-bonesmodel. Further, a sample with fewer than 100 cases in descriptiveresearch is not sufficiently large and is considered a "small" samplesize. A "medium" sample size could range from 100 to 200 casesbut, most importantly, this is not absolute and confirmation of thesample size's adequacy is dependent on the complexity of the model.If the number of cases exceeds 200, this is considered a "large"
11120

Bahaman Abu Samah
sample size. Overall, Kline's (2005, 2010) guidelines for samplesize in estimation methods are: small, n < 100; medium, n between100 and 200; and large, n > 200.
Hair et aI. (2010) are also among the pioneers of SEM, andbelieve that the adequacy of the sample size in SEM is dependenton the model's complexity and the basic measurement model'scharacteristics, including the number of constructs and theindicators of each construct. They further suggest that samplesize should be increased when the data deviates from multivariatenormality or when the amount of missing data exceeds 10 percent. An important point to consider is that the type of estimationtechnique is also influential in determining the size of the sample.For example, using sample-intensive estimation techniques (e.g.ADF) requires a larger sample size while using group analysisnecessitates meeting the requirements of the adequacy of the samplesize in each group (Hair et aI., 2010, p.662). The general rule ofHair et aI. (2010) in determining sample size by pre-considerationof the abovementioned characteristics is as follows: 100 cases is theminimum requirement of a model with five or fewer constructs (eachconstruct with more than three items), in which the standardizedfactor loading of items should exceed the value of .6. A total of 150cases is the minimum requirement of a model with seven constructsor fewer (each construct with more than two items), in which thestandardized factor loading of items should stand at the modestcommunalities means of .5. A total of 300 cases is the minimumrequirement of a model with seven or fewer constructs (fewer thanthree constructs with two items), in which the standardized factorloading of items is below .45. A total of500 cases is the minimumrequirement of a model with a large number of constructs, in whichsome have items with standardized factor loading values below .45and some have fewer than three measured items.
21111

Enhancing Extension Research using Structural Equation Modeling
To finalize the discussion on how large a sample needs to bein SEM, the researcher needs to consider the following criteriawhen deciding on the sample size: number of constructs, numberof items of each construct, the level of communalities (standardizedfactor loading), the model complexity, the amount of missingdata, the level of normal distribution and the type of estimationtechnique. After careful consideration of the factors influencingsample size, the researcher could use a recommended sample sizerange. Schumacker & Lomax (20 I0) recall the rule of thumb ofstatistics' texts as ten cases per variable or 20 cases per variable,while Bentler & Chou (1987) suggest a ratio of five to ten casesper observed variable. Five cases per observed variable would besufficient for a model with normal distribution (in which eachlatent variable needs to have multiple indicators) and ten cases perobserved variable would be sufficient for a model with other typesof distribution. Lastly, the most appropriate minimum ratio is tenrespondents per parameter, with an increase in the sample size asthe model complexity increases.
The last but also the most important point, from our point ofview, is that after considering the aforementioned criteria and usingany of the aforementioned rules in determining the sample size,it is better to double-check the adequacy of the sample size. Theimportance of this is related to the generalizability of the findings,as the number of cases can affect the results of statistical tests byeither making them insensitive, for small sample sizes, or overlysensitive, for very large sample sizes. According to Byrne (2010),a small sample size tends to over-reject true population models.According to Hair et aI. (2006), at a certain alpha level, a largersample size increases the power of statistical tests where smallereffects would be found to be statistically significant while forextremely big sample sizes, approximately any effect is significant.
11122
Bahaman Abu Samah
Thus, double-checking the sample size after using the recommendedrules in SEM involves considering the practical significance againstthe statistical significance.
This double-checking, as per our recommendation, can be doneusing any of the appropriate methods/formulas or software (onlineDaniel Soper calculator): the former determines the sample sizebased on the population size, while the latter determines the samplesize based on the effect size, desired statistical power, number oflatent variables, number of observed variables and probability level(The Daniel Soper calculator (Figure 6) can be accessed from thewebsite - http://www.danielsoper.comlstatcalc3lcalc.aspx?id=89).Making a decision about which method is more appropriate fordouble-checking also depends on some other factors that havebeen mentioned in the sample size sections of most multivariate,statistics and research methodology books. The sample numbercalculated based on the recommended rules of SEM pioneers andthat calculated using other rules (considering the population or testtype) need to be compared. While big gaps between the results ofthese two calculations need cautious consideration, if the gap issmall then the researcher can use the highest number for the numberof survey items distributed and the lowest for the adequate numberof collected survey items.
23111

Enhancing Extension Research using Structural Equation Modeling
....... tIIIlId_ .•• '·- ..
0..... __ ..- U tit
...... 011 " tt_ ...-.._ te ...
.'--".'~"':"'~ .. c....-"""""""""."""'_."""""'''''I.V_ .,_ ....,_. ...... .....-. ~......,w.. y,.~ .. ,... .r.,...... ...-.:'I .-..:t ,........ .-..a.nt .....
........................ .,.._.,., ........... CId. c.-....
Figure 6 A-Priori Sample Size Calculator for SEM
ASSUMPTIONS IN SEM
NormalityOne of the main assumptions in using ML estimation is normaldistribution of the data. Non-normal data affects the variance/covariance among the variables and can occur due to the limitedsample size or the limited scaling of the variables, such as that due tothe use of ordinal scales rather than interval scales (Schumacker &Lomax, 2010). According to Kline (2011), evidence has suggestedthat if the skew and kurtosis values are within reasonable ranges, thissatisfies the multivariate normality assumption. The skew implies
11124

Bahaman Abu Samah
that "the shape of a unimodal distribution is asymmetrical aboutits mean" (p.60), in which positive skew means most of the scoresare below the mean and negative skew indicates that most of thescores are above the mean. The kurtosis value is about the tail andpeak of the unimodal asymmetrical distribution shape, in whichpositive kurtosis (called leptokurtic) indicates a heavier tail and ahigher peak, while negative kurtosis (called platykurtic) indicatesjust the opposite (Kline, 2011).
Different rules of thumb are applicable to different resources toidentify the normality issue. According to Schumacker & Lomax(2004) categorical data and ordinal data with values less than 15are assumed to be normal if the skewness and kurtosis values arewithin the range of ±1.0. However, according to other references,values of ±1.5 or even ±2.0 are acceptable. Nevertheless, Byrne(2010) recommends the cut-off point ofless than ±7 as an acceptablekurtosis value.
OutlierAn outlier is a score that is different from the rest (Kline, 2011) orthat refers to a data value that is extreme or atypical (Schumacker& Lomax, 2010). Outliers may affect the mean, standard deviationand correlation coefficient values. The different sources of outliersinclude: data entry errors, observation errors, measurement errors(either based on the instruction or layout) or respondents' extremepoints of view and self-reported extreme values (Schumacker& Lomax, 2010). To find outliers, Hair et al. (2006) discuss theMahalanobis distance (d-squared) measure, which is "the distancein standard deviation units between a set of scores for one caseand the sample mean (centroid)" (p.65). Byrne (2010) also placesemphasis on looking at the d-squared value to find the outlier casesand declares that a d-squared value that stands distinctively apart
25111
Enhancing Extension Research using Structural Equation Modeling
from all other d-squared values shows the possibility of outliers.
Multicollinearity
Multicollinearity refers to high correlation among variables.Multicollinearity occurs when two or more variables measure thesame aspect instead of different constructs. One of the reasonsfor the occurrence of multicollinearity is due to the researcherinadvertently using composite variables and their constitutevariables together (Kline, 2011). The criterion for determiningmulticollinearity, according to Hair et al. (2010), is a correlationgreater than .9 and according to Kline (2011), a correlation greaterthan .85. The multicollinearity assessment in AMOS software isbased on the results of the correlation matrix in the measurementmodel.
To overcome the issue of multicollinearity, the first method isto combine the highly correlated constructs, if this is theoreticallyaccepted and applicable in the field (Byrne, 2010). The secondmethod is to remove one of the highly correlated constructs (Kline,2011).
WHAT IS AMOS?AMOS, which stands for Analysis of MOment Structures, is oneof the popular software for SEM. Other software that are usedfor SEM include LlSREL, EQS, CALlS, MPlus and MxGraph.AMOS, a covariance based SEM software, utilizes a simple anduser-friendly interface to build models that more realisticallyreflect complex relationships between constructs within a researchconceptual framework.
AMOS is an easy-to-use program where the user can specify,view and modify their model graphically by using simple drawing
11126

Bahaman Abu Samah
tools on the screen (Arbuckle, 2011). Further, by using AMOS, userscan simply evaluate their model fit, make modifications and printout the results of their final model. There are different versions ofthe AMOS software and recent versions (20, 21, and 22) releasedhave extensive documentation and user guides, including onlinehelp systems and advanced reference materials (Arbuckle, 2011).The present version (22) is much more practical and even moreuser friendly for users who are beginners in using AMOS and arenot very familiar with intermediate statistics.
GOODNESS-OF-FIT INDICESSeveral measures called goodness-of-fit indices are available toassess the overall fit of the hypothesized model. The overall modelfit refers to a test of whether the model proposed by the researcher isclose enough to observe the covariance input matrix (Kline, 2011).In other words, goodness-of-fit indices are the extent to which theactual data that has been gathered (or the observed covariance inputmatrix) corresponds or departs from the proposed model (Ho, 2006).Goodness-of-fit measures can be classified into three categories(Ho, 2006): absolute fit measures, incremental fit measures andparsimonious fit measures. These are discussed in the followingsections, along with the corresponding measures for each category.
Although there are many different indices, it is not possibleand not necessary for all of the indices to meet the fit criteria. Theendeavors of different scholars have shown the importance of usingdifferent indices to support the model fit. For example, Jaccard &Wan (1996, cited in Garson, 2009) recommend the use of at leastthree fit tests. Kline (1998, cited in Garson, 2009) recommendsusing at least four tests, such as chi-square, GFI, NFl or CFI; NNFI;and SR 1\1Rtests. Hair et al. (2006) also state that reporting X2 anddegree or j rccdom values along with CFI and RMSEA values will
27111

Enhancing Extension Research using Structural Equation Modeling
often provide sufficient unique information for evaluation. We relyon the most comprehensive point of view that is applicable acrossa wide range of situations which is the view suggested by Hair etaI. (2010). Hair et aI. (2010) indicate that if three to four fit indicesmeet the criteria it provides adequate evidence of model fit. Theaforementioned three to four indices should include one incrementalindex and one absolute index, in addition to the X2 value and theassociated degrees of freedom. In the case of comparing two models,the agreement of at least one of the parsimonious fit indices is alsorequired.
CONSTRUCT VALIDITYAs mentioned earlier, one of the main advantages of using SEM isits ability to assess the construct validity of a proposed model ratherthan only to test the reliability. Construct validity is the extent towhich a set of measured items actually reflect the theoretical latentconstruct. Therefore, construct validity deals with the accuracy ofa construct's measurement (Hair et aI., 2010). The assessment ofconstruct validity is made up of four important components: contentand face validity, convergent validity, discriminant validity andnomological validity.
1. Content and face validityContent validity refers to the consistency of a scale and thetheoretical definition of the concept and how the conceptworks. The face validity measure is also important as it isrelated to judgements on whether the instrument looks goodand appropriate. Usually, a panel of experts who know thetheoretical foundation of the concept judges the face and contentvalidity ofa scale (Muijs, 2004). The content and face validitymust be established prior to any theoretical testing when using
11128

Bahaman Abu Samah
CFA. Without an understanding of every item's content ormeaning, it is impossible to specify a valid construct correctly.
2. Convergent validityConvergent validity refers to the converging or sharing ofa proportion of variance among the indicators of a specificconstruct. The ways to estimate the relative amount ofconvergent validity among item measures (according to Hair etai., 2006) are factor loading, variance extracted and constructreliability, which can be outlined as follows:
Factor loading is the value that appears on each arrow of themodel and it reflects the correlation between the originalvariable and the factor, showing the nature of that particularvariable in the factor. To support the convergent validity of aconstruct, all factor loading values should first be statisticallysignificant. Secondly, a good rule of thumb is that standardizedfactor loading estimates should be .5 or higher (ideally .7 orhigher) to support the convergent validity.
Average variance extracted (AVE) is the average of the squaredfactor loading. An AVE value of .5 or higher is a good rule ofthumb suggesting adequate convergent validity. An AVE valueofless than.5 indicates that, on average, the amount of varianceexplained by the latent factor is less than the error remainingin the items. The AVE value is calculated using the followingformula (Hair et ai., 20 I0, p.709):
~A2AVE=-
11
Construct reliability indicates the internal consistency of aconstruct and its assessment follows the same rule as Cronbach's
291il

Enhancing Extension Research using Structural Equation Modeling
alpha calculation. Thus, the value of the construct reliabilityshould be .7 or higher, to indicate adequate convergent validityof the construct. Construct reliability can be calculated usingthe following formula (Hair et al., 2010, p.710):
3. Discriminant validityDiscriminant validity is the extent to which a construct istruly distinct from the other constructs. The average varianceextracted (AVE) for two factors should be greater than thesquared correlation between the two factors, to provide evidenceof discriminant validity.
4. Nomological validityNomological validity is concerned with the relationship of anyconstruct with other constructs according to the hypothesizedrelationship derived from theory. Nomological validity is testedby examining whether the correlations among the constructs ina measurement theory make sense. The matrix of correlationscan be useful in such an assessment and correlation ofless than.2 is questionable.
BUILDING A THEORY BASED MODELSEM is strongly theory based: theory plays an important role inestablishing the hypothesized relationships of the proposed model(Hair et al., 2010; Ho, 2006). Further, in SEM, any modificationto the proposed model needs to be justified by relevant theories.Thus, when making any modifications or contributing to atheoretically proposed model, the researcher needs to hypothesize
11130

Bahaman Abu Samah
the modifications using relevant theory or logical grounds, notempirical grounds (Kline, 2005). Overall, SEM is dissimilar toother multivariate analysis methods due to its strength as a theory-based approach and it leading researchers to conduct theory-basedresearch. The use of a theory-based approach in SEM, along withtheory-based specifications, identification and modifications ofthe proposed model, and interpretations also based on theory (Ho,2006, p.2S3) is more likely to contribute to the world of knowledge
THE PRACTICAL STAGE OF SEM ANALYSISGenerally, SEM analyses comprise three stages, namely 1)confirmatory factor analysis for individual constructs (CFA);, 2)a measurement model; and 3) a Structural model. The first twostages are more for data preparation while the last stage is used torespond to research objectives and hypotheses.
1. CFA for Individual ConstructsThe first stage of conducting SEM is to run factor analysis forindividual constructs. Factor analysis aims to simplify a large numberof intercorrelated items into a few representative constructs. Thereare two approaches to conducting factor analysis: exploratory factoranalysis(EFA) and confirmatory factor analysis(CFA). However, acombination of both is also acceptable. Exploratory factor analysisdetermines the number of factors that could best describe the databased on the statistical results. In fact, a researcher who has nostrong literature to support the number of factors that really existor does not know which variables or items belong to which factorswill need to conduct EFA. EFA is used when a researcher needs todevelop a scale instead of using prior research scales.
Since researchers generally use standard scales or prior researchscales with some modifications for their research situations and as
31111
Enhancing Extension Research using Structural Equation Modeling
SEM involves strictly theory-based analysis, CFA is recommended.It is worth noting that EFA follows the same procedure as CFAexcept that EFA has a prior stage. To conduct EFA, a researchershould first explore the indicators of each factor and the number offactors that exist in the data set. Practically speaking, in this situationthe research should use a general approach to factor analysis (usingSPSS). The explored number of factors and the indicators of thefactors can then be confirmed using SEM, with the same procedureforCFA.
In CFA, the researcher theoretically has literature support todetermine the number offactors that exist for a set of variables andthe number of items that belong to a factor. Further, CFA confirmsor rejects the theoretical specification of the factors and shows howthe theoretical factors match the actual data (Hair et al., 2010).
There are debates on the importance of individual CFA overthe measurement model. Some scholars believe that since in SEManalysis we are interested in testing the intercorrelation of factors,we should not drop the items or indicators of any construct inisolation from other factors. Although this reason behind thedebate is true and important, individual CFA is still the best wayto find the bad items in a less complex model and it is easier tomanage compared with the measurement model. Further, whenwe get perfect fit for each individual construct, it is then easier toachieve good model fit in the overall measurement model. Thus,we recommend first conducting individual CFA to identify theweak items/indicators and trying to find the best indicators of eachindividual construct. Items should only be dropped after running themeasurement model to know how the deletion of each item couldinfluence other factors or indicators.
To conduct individual CFA after drawing the hypothesizedmodel extracted from theory or explored in EFA, the researcher
11132

Bahaman Abu Samah
needs to: a) test for model fit; b) check for convergent validity; andc) determine construct reliability.
a. Test for model fitTwo criteria must be fulfilled in order to establish model fit - 1)have at least three or four of the fit indices from the absoluteand incremental fit measures; and 2) meet the requirementsfor standardized factor loadings. The fit indices should includerelative chi-square, RMSEA and anyone or two of the other fitindices. As for the standardized factor loading, all the loadingsmust be positive, more than .50 and none more than 1.0.
b. Convergent validityAVE can be used as a measure of convergent validity. AVE iscalculated by dividing the total squared factor loading by thenumber of items/indicators. An AVE equivalent to or morethan .50 meets convergent validity for a construct.
c. Construct reliabilityIn SEM, the above mentioned formula can be used to calculateconstruct reliability. This construct validity is comparable tothe Cronbach alpha in SPSS. By convention, the cut-off valuefor construct reliability is more than or equal to .70.
Types of CFA for Individual ConstructsIndividual CFA can be categorized as first-order CFA and second-order CFA. First-order CFA can be simple individual construct CFA(Figure 7), in which the variable measured is based on a series ofindicators or an individual construct with dimensions, where eachdimension is measured by a series of items (Figure 8). In second-order CFA, a variable is measured based on a series of dimensionsunder a bigger construct (Figure 8). The decision of which type of
33111

Enhancing Extension Research using Structural Equation Modeling
CFA to select depends on the essence of the variable, the methodof variable measurement and the researcher's hypothesized path.
Figure 7 Simple Individual Construct CFA
Figure 8 Individual Construct with Three Dimensions Based on First-Order CFA
.1134

Bahaman Abu Samah
Figure 9 Individual Construct with Three Dimensions Based onSecond-Order CFA
The following figure displays the results of the confirmatoryfactor analysis for telecenter sustainability. Based on the fit indicesand factor loadings for each indicator, as in Figure 10, this variablemeets the model fit. In addition, based on the results in Table 1, thisvariable also meets convergent validity (AVE=.528) and constructreliability (CR=.848).
35111

Enhancing Extension Research using Structural Equation Modeling
~16.899CF=5ReIaWe Qj-Sq (<5.0)=3.380p:.OO5GFI (>=.9) =.982AGFI (>=.9) =.945CA (>=.9) =.982Fl (>=.9) =.963N=l (>=.9) =.975TU (>=.9) =.965RM$EA(<= .06) =.061Ne (kMw bellilrF36.899(StaIlCIaiclDd MtirneIes)
Figure 10 Results of CFA for Telecenter Sustainability
Table 1 Factor Loading, Average Variance Extracted and ConstructReliability for Telecenter Sustainability
Items/Indicators Factor loading AVE
Sustain 1 .728 .528Sustain 3 .678Sustain 4 .722Sustain 5 .737Sustain 6 .764
eR.848
2. Measurement modelThe measurement model is the second stage in SEM analysis. Atthis stage, all the individual constructs are entered into the modelwith no demarcation between exogenous and endogenous variables.According to Hair et. al. (2006), each latent construct to be includedin the model is identified and the measured indicator variables(items) are assigned to latent constructs in the measurement model.
11136

Bahaman Abu Samah
The following tasks are to be tested in the measurement model:
a Test for model fitThe same criteria as in CFA is applied to test for the model fitofa measurement model. Generally, if the individual constructmeets the model fit, the tendency for the measurement modelto meet the model fit will be high.
b. Convergent validityIf you skip CFA for the individual construct, then you can testfor convergent validity in this measurement model. The samecriteria applies to test for convergent validity of the individualconstruct in the measurement model.
c Test for discriminant validityDiscriminant validity refers to the extent to which a constructis truly distinct from other constructs. This validity involvesthe relationship between a particular latent construct and otherconstructs of a similar nature (Brown, 2006). Discriminantvalidity is measured to check that a construct is really differentfrom other constructs. For any two constructs, the discriminantvalidity is met if the correlation coefficient (r) is less than .90(Farnell and Larcker, 1981; Hair et aI, 2010) or their individualAVE is greater than their corresponding r2 (Bryne, 2010).
d Test for normalityStructural equation modeling is a parametric statistic. Hencethe distribution of scores for all the constructs must meet theassumption of normality. Skewness and kurtosis can be usedto test for this assumption. This assumption is met if skewnessis between -2 to +2 and kurtosis is between -7 to +7.
e. Test for multicollinearityMulticollinearity refers to high correlations between exogenous/independent variables. Multicollinearity occurs when
37111
Enhancing Extension Research using Structural Equation Modeling
correlations between two exogenous variables is .90 or more(Hair et. al. (2010)
f Test for outliersAn outlier is a value that is substantively too small or too bigas compared to other scores. Mahalanobis D squared can beused for this purpose. Cases with high Mahalanobis D squared,are potentially outliers. The second criteria is to calculateMahalanobis D squared by degree of freedom. Degree offreedom refers to the total number of indicators. For a samplesize of more than 200, if the quotient is bigger than 4, thecorresponding cases are potentially outliers.
In this study, a total of six constructs (four exogenous andtwo endogenous) were involved. In the measurement model, allvariables were entered with no differentiation made between the twocategories of variables (Figure 11). With reference to fit indices andfactor loadings for each indicator, the measurement model meetsthe model fit.
11138

Bahaman Abu Samah
CN-Square=597.23'DF=215R_ Chi-Sq«5.0)=2.n8p=.oooGFI (>=.9) =.872AGFI (>=.9) =.838CFI (>=.9) =.917IFI (>=.9) =.9'8NFl (>=.9) =.878TLI (>=.9) 0.903RMSEA t= .08) =.070AlC (~_0I')=7.9.23.(S_ed_lN)
Figure 11 Measurement Model
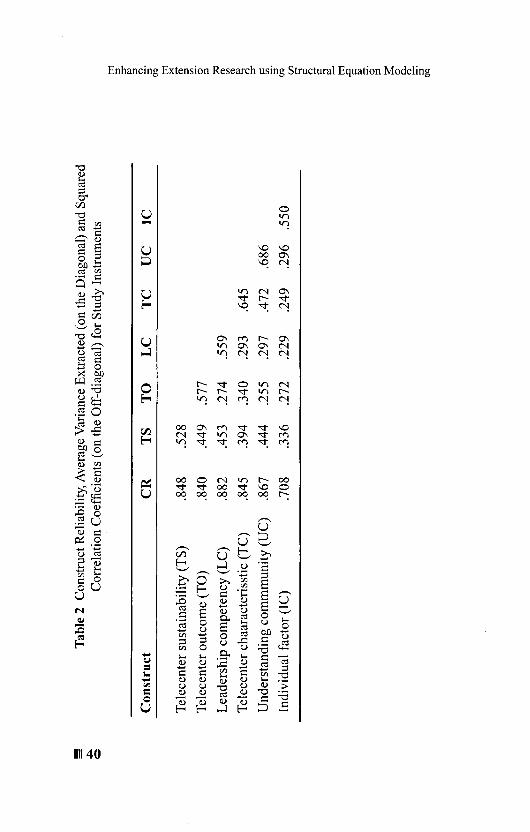
Results for the measurement model are presented in Table 2.Based on the construct reliability (CR) values, all the six variablesare reliable (CR > .7) and all the variables meet convergentvalidity (AVE> .5). The results of this table can be used to testfor discriminant validity. Any two variables meet discriminantvalidity when the AVEs for the two variables are higher than theircorresponding r squared.
39111
Enhancing Extension Research using Structural Equation Modeling
.1140
u-
oEo-<
ooONV)t-oo"1""1"00"1"'-0000 00 00 00 00 t-
-~=loo-'"=QU
oV)V)
u-'-'...o-o~
Bahaman Abu Samah
3. Structural modelWhile the overall measurement model is specified and validatedwith CFA, in the last stage of structural equation modeling,the structural model is represented by specifying the set ofrelationships between the constructs. The representation ofthe theory with a set of structural equations is usually depictedwith a visual path diagram. The structural equation model isan inclusive model that specifies the pattern of relationshipsamong exogenous and endogenous variables, either observed orlatent (Hair et al., 2010; Ho, 2006). In other words, the structuralmodel specifies the way that each variable affects the others.The focus here is not on testing the construct validity of thelatent variables, as in the measurement model, but to examinethe relationships between latent or manifest constructs. Thestructural model is used to test the level of model fit and thedirect, indirect and total effects of the exogenous variables onthe endogenous variable.
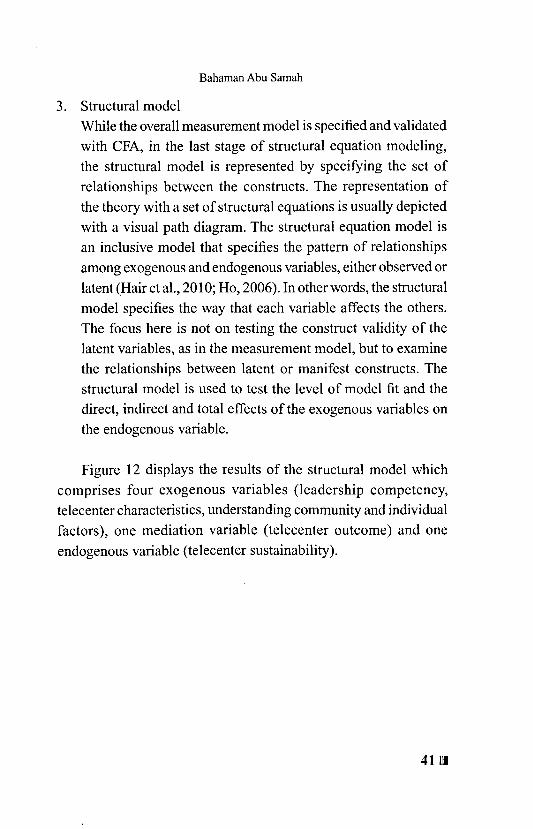
Figure 12 displays the results of the structural model whichcomprises four exogenous variables (leadership competency,telecenter characteristics, understanding community and individualfactors), one mediation variable (telecenter outcome) and oneendogenous variable (telecenter sustainability).
41111

Enhancing Extension Research using Structural Equation Modeling
~7.23'OF ... 5_ Chi-SQ (<5.0)02.m... 000OAp..t) •.anAGFI pe.I, • .838
II CA(M".I) • .817WI (>s.I) •. e1'NFl po._I) -.878TU (-.$)-.803fWSEA(o .01) -.010AIC __ ~71 • .231--I
Figure 12 Structural Model
As mentioned earlier, the structural model depicts therelationship between the exogenous and endogenous variables.Using this structural model, the following analyses can be carriedout, namely, 1) determine direct, indirect and total effects; 2)analyses related to multiple linear regression; 3) test for mediationeffect; and 4) test for moderation effect.
DIRECT, INDIRECT AND TOTAL EFFECTSIf there is a mediating variable in a structural model, then it ispossible to calculate direct, indirect and total effects. The advantageof using this information is that it gives a better picture of thecontributions of each predictor variable towards the prediction ofthe endogenous variables. In addition, it is possible to comparethe contribution of the direct and indirect effects of the exogenous
11142
Bahaman Abu Samah
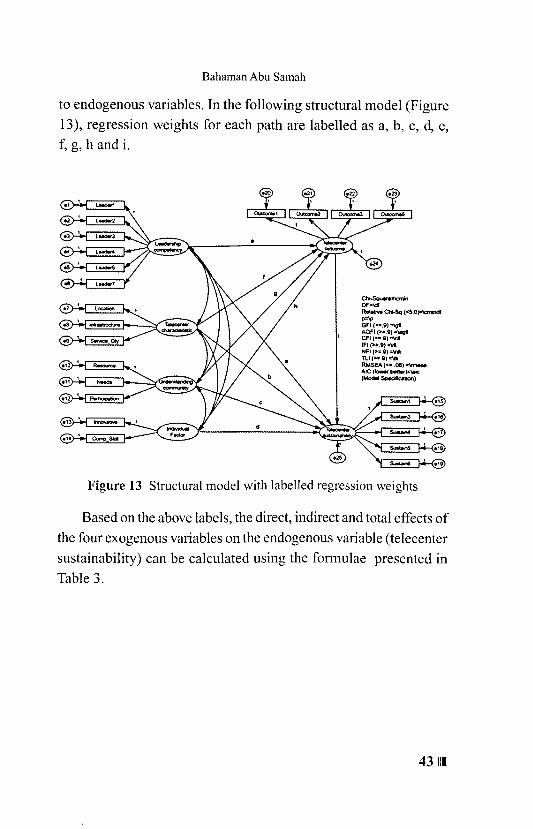
to endogenous variables. In the following structural model (Figure13), regression weights for each path are labelled as a, b, c, cl, e,f, g, hand i.
~OF=\df_ChI-SQ «5.0_p=,.GFI(>::.Q)='IgfIAGFI(n.9)=\egtICfl (>=.Q) =\elllF1p'a.9)1l\iftNFl(>z.8)~'Ttl (>"'.9,:\IIiRMSEA (c;a .08) Z\rmMeAte (towwbeCler):\ajc(.......-1
Figure 13 Structural model with labelled regression weights
Based on the above labels, the direct, indirect and total effects ofthe four exogenous variables on the endogenous variable (telecentersustainability) can be calculated using the formulae presented inTable 3.
43111

Enhancing Extension Research using Structural Equation Modeling
Table 3 Formulae for Calculating Direct, Indirect and Total Effects
Path Direct Indirect Total
Leadership competency-> Sustainability a el a+ ei
Telecenter characteristics-> Telecenter sustainability b fi b+fi
Understanding community-> Telecenter sustainability c gl c + gi
Individual factors-> Telecenter sustainability d hi d+hi
ANALYSES RELATED TO MULTIPLE
Linear RegressionThe results from the structural model can be used to respond toanalyses in multiple linear regression. The analyses include: 1) testfor regression model; 2) test for slope; and 3) model summaries.Testing for the regression model is embedded in the test for modelfit. The test for model fit comprises fit indices and factor loadingsand the requirements for model fit are similar to that for CFA andthe measurement model.
The second analysis involves testing of slope which is to test thecontribution of the individual predictors to the dependent variable.Instead of the t-value, as in multiple linear regression, SEM providesan alternative statistic, the critical ratio (CR) to test the significanceof the contribution of the individual predictors. While these twostatistics are comparable the test of the significance is based onthe given p-value.
The final analysis is to derive and interpret the model summarieswhich include the multiple correlation coefficient (R) and coefficientof determination (R2). The R, which ranges between 0 to 1, indicates
11144

Bahaman Abu Samah
the strength of the relationship between the set of predictors and thedependent variables while the R2 , which also ranges between 0 to1, depicts the amount of variance in the dependent variable that isexplained by the set of predictors.
Results from the structural model are summarized in Table 4.Leadership competency, understanding community and telecenteroutcome contribute significantly toward telecenter sustainability.The highest contribution is attributed by leadership competency(Beta=.326), followed by understanding community (Beta=.300)and telecenter outcome (Beta=.275). In contrast, both telecentercharacteristics and individual factors do not contribute significantlytowards telecenter sustainability.
Based on the multiple correlation coefficient, the relationshipbetween all the five factors and telecenter sustainability is consideredto be high (R=.826). In addition, this set offactors contribute a totalof68.3 percent of the variance in telecenter sustainability (R2=.683)
Table 4 Results ofSEM on Effect of Predictors on TelecenterSustainability
Construct B SE Beta eR p
Leadership competency .362 .067 .326 5.440 .000Telecenter characteristics .037 .076 .035 .483 .629Understanding community .305 .071 .300 4.276 .000Individual factors .119 .079 .100 1.518 .129Te1ecenter outcome .237 .052 .275 4.566 .000
R = .826R2 = .683
45111

Enhancing Extension Research using Structural Equation Modeling
MEDIATION EFFECTThere has been a growing trend in recent years whereby researchersare not interested in just studying the relationships between thepredictor and criterion variables, but also in incorporating the effectsof mediating variables. Investigation of these mediating variablescan further facilitate explanation of the complex inter-relationshipsbetween the variables in a given model.
With the advancements in computing, testing of the mediationeffect, which used to be complicated, incorporating a seriesof multiple linear regression analyses, can now be done easilyand efficiently through the use of structural equation modeling.According to Baron and Kenny (1986), a variable may functionas a mediator when it accounts for the relationship between thepredictor and the criterion. The mediator explains how externalphysical events take on an internal psychological significanceand how or why such an effect occurs. A mediator is the mediumthrough which the predictor influences the criterion. The mediatoris part of the causal process whereby the mediator is depicted in apath diagram together with the predictor and criterion variables.
Rather than hypothesizing a direct causal relationship betweenthe predictor and criterion, a mediation model hypothesizes that thepredictor causes the mediator, which in turn causes the criterionvariable. The mediator serves to clarify the nature of the relationshipbetween the predictor and criterion variables (MacKinnon 2008). Amediation effect occurs when a third construct intervenes betweentwo other related constructs. The mediator explains the relationshipbetween the other two constructs (Hair et al. 20 I0).
A variable may be considered a mediator to the extent that itcarries the influence of predictor to the criterion variables. Thegeneral test for mediation is to examine the relationship between, 1)predictor and the criterion variables; 2) predictor and the mediator
11146

Bahaman Abu Samah
variables; and 3) mediator and the criterion variables. All of thesecorrelations should be significant. The relation between predictorand criterion should be reduced (to zero in the case of totalmediation) after controlling the relationship between the mediatorand criterion variables.
Types of Mediation Models
Figure 14 depicts the direct relationship between a predictor (X) anda criterion variable (Y). The symbol c refers to the path coefficientbetween X and Y. It represents the total effect between X and Y.
Figure 14 Direct relationship between predictor and criterion
As mentioned earlier, a mediator is a variable that intervenesin the relationship between the predictor and criterion variables.Generally, there are three different types of mediation models,namely, the single mediation model, single-step multiplemediation model, and multiple-step multiple mediation model.This categorization is based on the number of mediator variablesand the nature of the relationship between the predictor, mediatorand criterion variables.
1. Simple Mediation ModelThe Simple Mediation Model consists of a predictor, a mediatorand a criterion variable, as in Figure 15. In this model, the direct,indirect and total effects are as follows:
Direct effect = c'Indirect effect = abTotal effect = c' + ab
47111

Enhancing Extension Research using Structural Equation Modeling
Figure 15 Simple mediation model
2. Single-Step Multiple Mediation ModelThis model comprises more than one mediator variable. As depictedin Figure 16, two mediator variables (M 1 and M2) coexist in themodel together with a predictor and criterion variable. The predictoris related to the individual mediator variables separately from thecriterion variable. Calculations for direct, indirect and total effectsare given below:
Direct effect = c'Indirect effect = a Ib 1 + a2b2Total effect = c' + al bl + a2b2
Figure 16 Single-step multiple mediation model
3. Multiple-Step Multiple Mediation ModelAs in the above mediation model, the Multiple-Step Multiple
11148

Bahaman Abu Samah
Mediation Model also consists of more than one mediator variable.However, instead of having separate links between the mediatorvariables and the criterion variable, the predictor variable is relatedto the first mediator (Ml) through the second mediator (M2) andto the criterion variable, as presented in Figure 17.
The direct, indirect and total effects are given as follows:Direct effect = c'Indirect effect = albl + a2b2 + ala3b2Total effect = c' + alb I + a2b2 + ala3b2
Figure 17 Multiple-step multiple mediation model
Importance of the Mediation TestThe basic importance of the mediation test is to answer the questionsof the "how" and "why" of the inter-relationship between theconstructs. MacKinnon et al. (2007), in their article on mediationanalysis, have outlined three reasons for mediation in psychology:1) it is the root of the stimulus organism response model; 2) themediation variables form the basis of many psychological theories;and 3) it relates to methodological considerations.
49111

Enhancing Extension Research using Structural Equation Modeling
Approaches to the Mediation Test
MacKinnon (2000) has outlined three major methods to test forthe mediation effect, namely, the causal steps approach, coefficientdifference, and product of coefficients. Interestingly, all these threemethods utilize the results of the three regression analyses below.The first equation is derived from simple linear regression betweenthe predictor (X) and criterion (Y). The second equation is the resultof simple linear regression between the predictor (X) and criterion(M) while the third equation results from a multiple linear regressionbetween the predictors (X and M) and the criterion (Y). Note thatb, and ej for all the three equations represent intercept (constant)and residual, respectively.
Y=bo + cX + ejM =bo + aX +ejY = bo + c'X + bM + e
j
Equation 1Equation 2Equation 3
1. Causal Steps ApproachThe causal steps approach was popularized by Baron and Kenny(1986) and is the most commonly used method to test for themediation effect. This approach entails four steps to establish themediation effect, namely:
a) The predictor (X) significantly affects the criterion (Y), as inEquation 1.
b) The predictor (X) significantly affects the mediator (M), as inEquation 2.
c) The mediator (M) significantly affects the criterion (Y) in thepresence of predictor (X), as in Equation 3.
d) The regression coefficient (c'), as in Equation 3, is significantlyreduced as compared to c, as in Equation 1.
11150

Bahaman Abu Samah
2. Coefficient Difference MethodMacKinnon and Dwyer (1993) postulate that the value of themediated or indirect effect can be calculated as ab or c - c'. Thec and c' are derived from Equations 1 and 3, respectively. Thedifference in the coefficients (c - c ') reflects the reduction in theeffect of the predictor (X) on the criterion (Y) when the mediator isentered into the regression model. In order to test for the mediationeffect, the difference in the coefficients is divided by the standarderror of the difference. The resulting value is compared against thestandard normal distribution for decision and conclusion.
3. Product of Coefficients MethodThe mediated or indirect effect, according to Alwin and Hauser(1975), is computed by multiplying coefficient a from Equation 1and coefficient b from Equation 3. The product ab is then dividedby its standard error to yield a value that can be compared againsta standard normal distribution for decision and conclusion.
Multi-M odel AnalysisAs mentioned earlier, Multi-Model Analysis employs the causalsteps approach, as proposed by Baron and Kenny (1986). Theanalysis involves three different models, namely, the full mediationmodel, indirect model and direct model. The Multi-Model Analysisfor the mediation test involves two major stages. The first stage is toestablish the presence of a mediation effect in the overall structuralmodel. Once the presence of a mediation effect is established, thesecond stage is to test the mediation effect of the mediator on thespecific paths in the structure.
51111

Enhancing Extension Research using Structural Equation Modeling
1. Establishing the presence of a mediation effectThe two different structural models are compared - full mediationmodel and indirect model. If the full mediation model is found to bebetter than the indirect model, then it can be established that someform of mediation effect is present in the structural model. Fromthe results of SEM analyses, the values of chi-square, ParsimonyNormed Fit Index (PNFI) and Akaike Information Correction (AIC)are compared using the following criteria:
a. Chi-Square. The smaller the X2value, the better the model.
b. Parsimony Normed Fit Index (PNFI). A larger PNFI valueindicates a better model.
c. Akaike Information Correction (AIC). A smaller AIC valuespecifies a better model.
2. Test mediation effect for individual path/sAt this stage, the full mediation model is compared with the directmodel. Based on the comparison, four plausible outcomes of themediation test can be established, which are:
a. Full mediation. The mediator fully mediates the relationshipbetween the exogenous and endogenous variables.
b. Partial mediation. The mediator only partially mediates therelationship between the exogenous and endogenous variables.
c. No mediation. The mediator does not mediate the relationshipbetween the exogenous and endogenous variables.
d. Indirect effect. There is only an indirect relationship betweenthe exogenous and endogenous variables through the mediator.
The decision criteria for the mediation test using multi-modelanalysis are presented in the following table.
11152

Bahaman Abu Samah
Table 5 Decision criteria for the mediation test
Decision
Direct Model
X-Vp
X-VMediation Model
X-M M-YBeta p p p
No mediationIndirect effectPartial mediationFull mediation
NSSS
NS! S! NS
NSSSS
NSSSS
Note: S significantNS non-significant! reduce/decrease
The results from the mediation test using the multi-modelanalysis (MMA) are presented in Table 6. Based on the results andthe above decision criteria it can be concluded that: I) telecenteroutcome partially mediates the relationship between leadershipcompetency and telecenter sustainability; 2) There exists an indirecteffect between telecenter characteristics and telecenter sustainabilitythrough the telecenter outcome; 3) the telecenter outcome doesnot mediate the relationship between understanding communityand telecenter sustainability; and 4) telecenter outcome fullymediates the relationship between individual factors and telecentersustainability
53111

Enhancing Extension Research using Structural Equation Modeling
Table 6 Results of Mediation Effects ofTelecenter Outcome onRelationship between Leadership Competency and Telecenter
Sustainability (MMA)
Factor/Model!Hypothesized Paths Beta p
Leadership CompetencyDirect Model
Leadership competency - Telecenter sustainabilityMediation Model
Leadership competency - Telecenter sustainabilityLeadership competency - Telecenter outcomeTelecenter outcome - Telecenter sustainability
Telecenter CharacteristicsDirect Model
Telecenter characteristics - Telecenter sustainabilityMediation Model
Telecenter characteristics - Telecenter sustainabilityTelecenter characteristics - Telecenter outcomeTelecenter outcome - Telecenter sustainability
Understanding CommunityDirect Model
Understanding community - Telecenter sustainability .324 .000Mediation Model
Understanding community - Telecenter sustainability .300 .000Understanding community - Telecenter outcome .022 .306Telecenter outcome - Telecenter sustainability .060 .004
Individual FactorsDirect Model
Individual factors - Telecenter sustainabilityMediation Model
Individual factors - Telecenter sustainabilityIndividual factors - Telecenter outcomeTelecenter outcome - Telecenter sustainability
.384 .000
.326 .000
.326 .000
.060 .004
.114 .121
.035 .629
.082 .001
.060 .004
.163 .016
.100
.062
.060
.129
.020
.004
11154

Bahaman Abu Samah
Bootstrap MethodIn almost all studies, data collection incurs a substantial amountof money and manpower. Researchers normally utilize the sampledata to get the best possible estimates of statistics such as thesample means and standard deviation. These estimates can be moreaccurately generated if a series of samples are used to measurethe said estimate. Unfortunately, due to financial, time, as well as,manpower constraints, such endeavors cannot be undertaken.
Bootstrapping can be employed as an alternative method toovercome the above constraints and at the same time still accomplishthe task of approximating the estimates. Bootstrapping wasintroduced by Bradley Efron (1979) as a procedure to estimate thesampling distribution of a parameter estimate. Since its inception,the bootstrap method has gained extensive acceptance amongstatisticians and has been incorporated into popular statisticalanalysis software such as SPSS and AMOS. According to Arbuckle(2007), the bootstrap method can generate an approximate standarderror for practically any estimate used in AMOS.
Bootstrapping is a resampling technique that involvesresampling (with replacement) from one set of sample data. Theprocess of resampling is conducted many times. Generally theminimum number of resampling is 1,000 times although Hayesrecommends at least 5,000 times. In the case ofa simple mediationmodel with one predictor, criterion and mediator variables, thebootstrapping procedure will yield numerous values of a, bandab, which represent path coefficient X -+ M, path coefficient M -+
Y and indirect effect (X -+ M -+ Y), respectively. A summary ofvalues computed from each of the bootstrap samples will constitutethe bootstrap distribution of the indirect effect.
55111
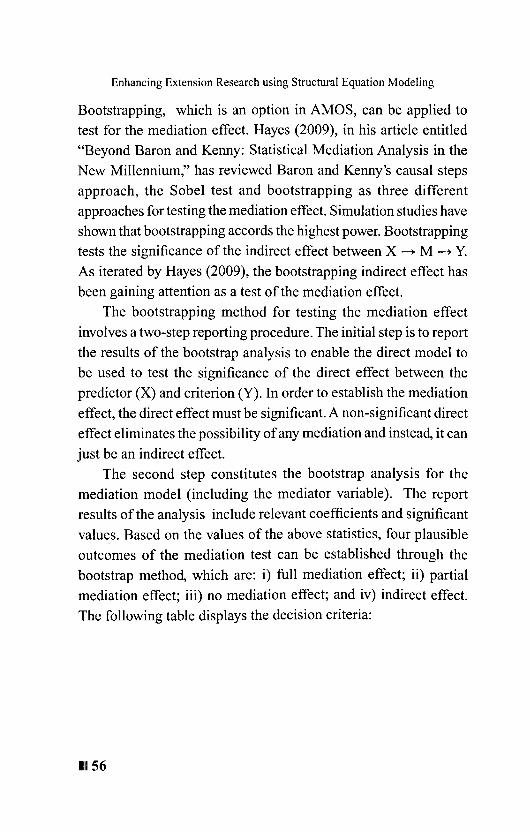
Enhancing Extension Research using Structural Equation Modeling
Bootstrapping, which is an option in AMOS, can be applied totest for the mediation effect. Hayes (2009), in his article entitled"Beyond Baron and Kenny: Statistical Mediation Analysis in theNew Millennium," has reviewed Baron and Kenny's causal stepsapproach, the Sobel test and bootstrapping as three differentapproaches for testing the mediation effect. Simulation studies haveshown that bootstrapping accords the highest power. Bootstrappingtests the significance of the indirect effect between X - M - Y.As iterated by Hayes (2009), the bootstrapping indirect effect hasbeen gaining attention as a test of the mediation effect.
The bootstrapping method for testing the mediation effectinvolves a two-step reporting procedure. The initial step is to reportthe results of the bootstrap analysis to enable the direct model tobe used to test the significance of the direct effect between thepredictor (X) and criterion (Y). In order to establish the mediationeffect, the direct effect must be significant. A non-significant directeffect eliminates the possibility of any mediation and instead, it canjust be an indirect effect.
The second step constitutes the bootstrap analysis for themediation model (including the mediator variable). The reportresults of the analysis include relevant coefficients and significantvalues. Based on the values of the above statistics, four plausibleoutcomes of the mediation test can be established through thebootstrap method, which are: i) full mediation effect; ii) partialmediation effect; iii) no mediation effect; and iv) indirect effect.The following table displays the decision criteria:
11156

Bahaman Abu Samah
Table 7 Decision criteria for mediation test using the Bootstrapmethod
Decision
Direct Model
X~Y
p
Mediation Model
X~Y SIE 95% Cl
Beta p p 0
NS InsideNS S Outside
! S S Outside! NS S Inside
No mediationIndirect effect NSPartial mediation SFull mediation S
Note: SNS
t
significantnon-significantreduce/decrease
Analysis using the bootstrap method yields the following tworesults, namely, results of the direct model (Figure 18); and resultsfor the mediation model (Figure 19). In the direct model, all indirectpaths are set as constraints in which all the paths are set as zero (asif there is no mediator in the model). The mediation model, on theother hand, includes the mediator, which leads to a combination ofdirect and indirect effects.
57111
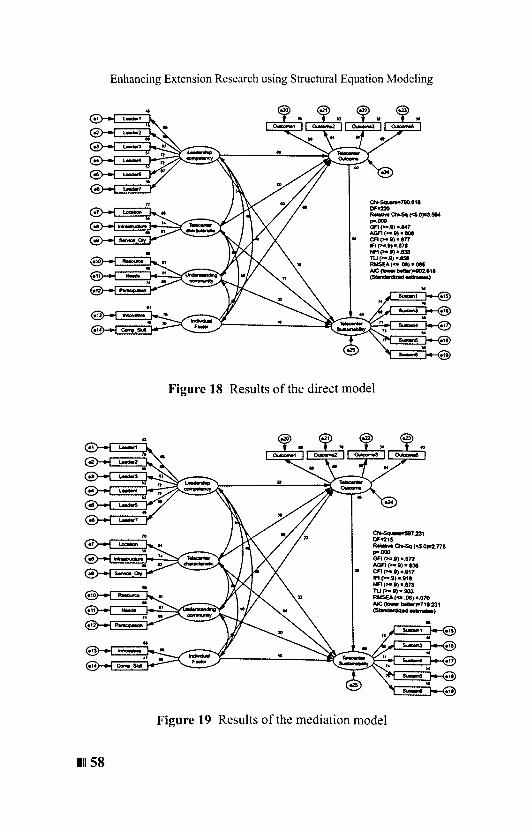
Enhancing Extension Research using Structural Equation Modeling
~71IO,e1a01'0220-a..sq, ..."'"'....... 000GFlpc .• )· ... ,AGFt pe.O)._808CF1p..') •.'77Flp· .•)·.llI"'r-.t)·.831ru(-.')·.85IRt.ISEA(- .08) •.•NC~beBer>-t02..,.C~ ....... )
Figure 18 Results of the direct model
~.23'CF-21$-a..sq'''.O)02.m... 000GFI{lra_8)·.anAGF1(>e.0) -.135CA pe.O) -.t171FIP..8) •. luaNFl (>C.V) •. 178TU C-.I) •.W3RNSEA(OI .08) -.070NC(bAw~7".231(~~)
Figure 19 Results of the mediation model
11158

Bahaman Abu Samah
Summary of the results from the direct and mediation modelsare presented in Table 8. Based on the above decision criteria, 1)telecenter outcome partially mediates the relationship betweenleadership competency and telecenter sustainability; 2) there is anindirect effect of telecenter outcome on the relationship betweentelecenter characteristics and telecenter sustainability; 3) thereno mediation effect of telecenter outcome on the relationshipbetween understanding community and telecenter sustainability;and 4) telecenter outcome fully mediates the relationship betweenindividual factors and telecenter sustainability.
Table 8 Bootstrap Results of Mediation Effect ofTelecenter Outcomeon Relationship between Factors and Telecenter Sustainability
Factor/Model! 95%CIHypothesized Paths Bootstrap BC
Beta p LB VB
Leadership CompetencyDirect Model
Leadership competency___.Telecenter sustainability .384 .000
Mediation ModelLeadership competency___.Telecenter sustainability .326 .000Standardized Indirect Effect (SIE) .060 .004 .020 .120
Telecenter CharacteristicsDirect Model
Telecenter characteristics___.Telecenter sustainability .114 .121
Mediation Model
Telecenter characteristics___.Telecenter sustainability .035 .629
Standardized Indirect Effect (SIE) .082 .001 .033 .159
59111

Enhancing Extension Research using Structural Equation Modeling
Understanding CommunityDirect Model
Understanding community_ Telecenter sustainability .324 .000
Mediation ModelUnderstanding community_ Telecenter sustainability .300 .000Standardized Indirect Effect (SIE) .022 .306 -.021 .078
Individual FactorDirect Model
Individual factors- Telecenter sustainability .163 .016
Mediation ModelIndividual factors- Telecenter sustainability .100 .129Standardized Indirect Effect (SIE) .062 .020 .010 .140
MODERATION EFFECTA moderator variable M is a variable that alters the strength of thecausal relationship between independent and dependent variables.For instance, psychotherapy may reduce depression more for menthan for women, and so we would say that gender (M) moderatesthe causal effect of psychotherapy (X) on depression (Y) (David& Kenny, 1986).
Relevant questions for moderation relate to "when" and "forwhom" a variable most strongly predicts or causes an outcomevariable (Frazier &Tix 2004). The effect of a moderator is reflectedby the change in direction or magnitude of the relationship betweenpredictor and criterion variables (Baron & Kenny 1986; Holmbeck1997; Rose et al. 2004). The decision to establish any variable as amoderator should be based on the theory used and adequate supportfrom the literature.
11160
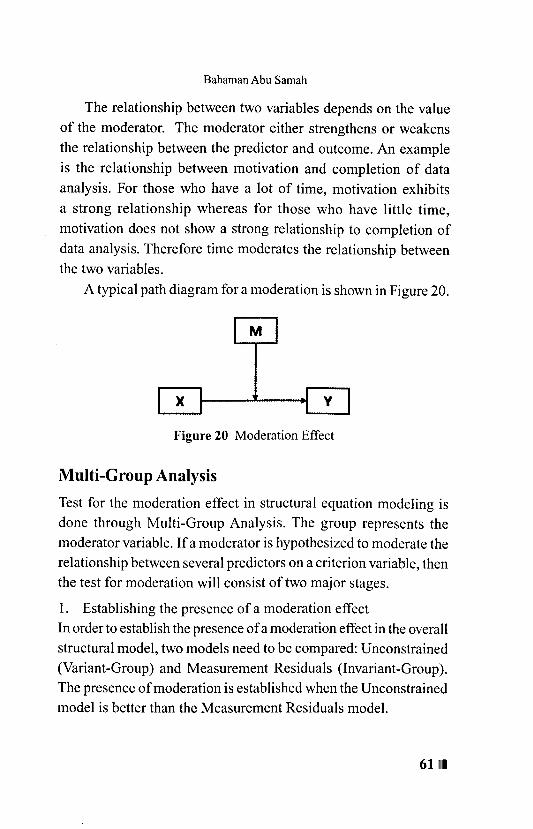
Bahaman Abu Samah
The relationship between two variables depends on the valueof the moderator. The moderator either strengthens or weakensthe relationship between the predictor and outcome. An exampleis the relationship between motivation and completion of dataanalysis. For those who have a lot of time, motivation exhibitsa strong relationship whereas for those who have little time,motivation does not show a strong relationship to completion ofdata analysis. Therefore time moderates the relationship betweenthe two variables.
A typical path diagram for a moderation is shown in Figure 20.
Figure 20 Moderation Effect
Multi-Group Analysis
Test for the moderation effect in structural equation modeling isdone through Multi-Group Analysis. The group represents themoderator variable. If a moderator is hypothesized to moderate therelationship between several predictors on a criterion variable, thenthe test for moderation will consist of two major stages.
1. Establishing the presence of a moderation effectIn order to establish the presence of a moderation effect in the overallstructural model, two models need to be compared: Unconstrained(Variant-Group) and Measurement Residuals (Invariant-Group).The presence of moderation is established when the Unconstrainedmodel is better than the Measurement Residuals model.
61111

Enhancing Extension Research using Structural Equation Modeling
In order to establish the presence of a moderation effect in theoverall structural model, the Unconstrained model is compared withthe Measurement Residuals model. If the Unconstrained modelis found to be better than the Measurement Residuals model, amoderation effect is present.
The first step is to compare the chi-square values of the twomodels. The model with the lower chi-square value is deemed tobe the better model. The next step is to test for the significance ofthe chi-square difference for the two models. To do this using thesoftware click on View Text and then on Model Comparison. Thenlook at the Measurement Residuals.
Ifthe reported sig-X2 is less than alpha, the difference in X2 issignificant. If the X2 for the Unconstrained model is smaller thanthat for the Measurement Residuals model, the difference in X2is significant and it can be concluded that a moderation effect ispresent in the overall structural model.
The second and the final step in the moderation effect test isto assess whether the moderator moderates the relationship for theindividual paths. Three different decision criteria can be employedin the tests for the individual paths:
1. The first criterion is proposed by Hair (2010 ) and is based onthe value of the standardized path coefficient (Beta). According toHair, the path X ~ Y is moderated by the moderator if:
Beta for Group 1 is significant while for Group 2 it is non-significant, orBeta for both groups (Group 1 and 2) are significant.Nevertheless, one is positive while the other is negative.
2. The second criterion comes from Robert Ho (2006). Thedecision on the moderation effect is based on the value of the criticalratio (CR) for the difference for a specific path between the twogroups. At a .05 level of significance, the cut-off point for the CRis 1.96.
11162

Bahaman Abu Samah
Significant moderation effect if CR ~ 1.96No significant moderation effect ifCR < l.96
3. The third criteria is proposed by Chin (2000) in which at-statistic is computed based on sample size, unstandardizedregression coefficients and standard errors for the two groups ofthe mediator. The decision will based on comparison of sig-t tothe level of significance (a).
Significant moderation effect if sig-t s aNo significant moderation effect if sig-t > a
This analysis was done to test the moderation of gender on therelationships between the four independent variables and telecentersustainability. Data were analyzed using the multi-group analysiswhich resulted in two structural models that represent the twogroups of the moderating variable - male (Figure 21) and female(Figure 22). Results for the structural models are presented in thefollowing figures.
~mOf..,._ CI»-Sq «5.01*2.011.. 000Ofl (l"•. O). S2eAGFI(":,9) •. 780Cfl (>•.$)._ 901
~ 1F1(-.9)·802Nfl (~ • .la) -.828TlI~_Q)._M3RMSEA(ca .08) •. 055Ate ~ bMW>-1t38.G:2V(~~)
Figure 21 Structural model for Male
63111

Enhancing Extension Research using Structural Equation Modeling
In the multi-group analysis, test for moderation effect is bycomparing the results of individual paths of the male and femalegroups using anyone of the three criteria - 1) Hair; 2) Robert Ho;or 3) Chin. Decisions can be facilitated using SLT 3 (StatisticalLearning Tool for SEM).
~0211OF..,.,fWIIrve QIt.Sq (<5.O~.oe'.. 000OFI (>a.Q) •. 820AGA (-.8) -.710CFt <-.a, •.901
not Ifl (_.,' •. 902NFl (>-.8) •. 128TU (_.8) •.M3RMSEA (e. .(8) -.055Ne po.. beDer'_,,38 fI:2SI:(~~)
Figure 22 Structural model for Female
The summary of results for the moderation analysis arepresented in Table 9. Based on the decision criteria by Hair (2010),only one path is being moderated by gender. Gender moderates therelationship between individual factors and telecenter sustainabilityin which the beta for male is positive while beta for female isnegative. In addition, beta for male is significant while beta forfemale is non significant.
The results based on Robert Ho's (2016) criteria also revealsidentical decisions. Consistently, only the relationship betweenindividual factors and telecenter sustainability is found to be
11164

Bahaman Abu Samah
moderated by gender and the critical ratio for the difference (1-2.083[)is bigger than 1.96.
Table 9 Results of Moderation Effect of Gender on Relationshipbetween Predictors and Sustainability (Hair and Robert Ho)
Paths b SE Beta p eR/orDifference
Leadership competency---+ Telecenter Sustainability 1.048
Male .326 .086 .302 .000Female .469 .106 .418 .000
Telecenter characteristics---+ TelecenterSustainability 0.535
Male -.005 .099 -.005 .959Female .076 .114 .075 .506
Understanding community---+ Telecenter sustainability 0.465
Male .294 .099 .261 .003Female
Individual Factors---+ Telecenter sustainability -2.083
Male .252 .104 .209 .016
.262 .106 .406 .000
Female -.083 .122 -.071 .498
The summary results of the test for moderation effect of genderon the relationship between the four independent variables andtelecenter sustainability are displayed in Table 10. Using the criteriaby Chin (2000), t-statistic is computed and recorded alongside itssignificant value. Consistent with the other two decision criteria,only one path (relationship between individual factor and telecentersustainability) is found to be moderated by gender (t=2.071,p<.05).
65111

Enhancing Extension Research using Structural Equation Modeling
Table 10 Results of Moderation Effect of Gender on Relationshipbetween Predictors and Sustainability (Chin)
Paths n b SE Beta t p
Leadership competency-+ Telecenter Sustainability -1.05 .301
Male 170 .326 .086 .302Female 190 .469 .106 .418
Telecenter characteristics-+ TelecenterSustainability -.532 .595
Male 170 -.005 .099 -.005Female 190 .076 .114 .075
Understanding community-+ Telecenter sustainability .220 .826
Male 170 .294 .099 .261Female 190 .262 .106 .406
Individual Factors-+ Telecenter sustainability 2.071 .039
Male 170 .252 .104 .209Female 190 -.083 .122 -.071
CONCLUSIONIn this lecture, I have provided an overview of extension and theimportance of research in extension. I have humbly shared onhow Structure Equation Modeling (SEM) can enhance extensioneducation research and ultimately enrich evidence-based extensionwork practices Statistical analyses represent an integral componentin any extension education research. Various appropriate statisticalanalyses were/are employed to respond to research objectives andhypotheses. In addition to the existing commonly used statisticalanalyses, extension education researchers can incorporate use ofStructural Equation Modeling to further enhance extension research
11166

Bahaman Abu Samah
analyses and results. With the various advantages of using this SEManalyses, the least that an extension education researcher can dois to test for construct validity of study instrument which can beeasily performed in SEM. Subsequently ensuring the validity ofresearch instrument used.
Comparable to multiple linear regression, SEM generallyprovides a better statistical estimation as SEM utilizes latentvariables that incorporate measurement errors. In addition multiplemodels can be compared simultaneously as in testing for mediationand moderation effects. Testing of mediation effect using multi-group analysis or bootstrap method can be easily done in SEM.The same is also true for test of moderation effect which can bedone effectively in SEM.
To end my lecture, I humbly would like to pose several questionsfor consideration among extension education researchers andorganizations in UPM, Malaysia and the World:
• Have extension education researchers taken advantage of thepowerful statistical analyses provided by structural equationmodeling in their research projects?
• Do extension education researchers possess the adequateknowledge and skill in using SEM and the ability to make theright interpretations of SEM output?
• How can incorporation of structural equation modeling analysesbe linked to better development of extension programs?
How can we develop expertise among researchers in extensioneducation organizations to promote use of structure equationmodeling?
67111
Enhancing Extension Research using Structural Equation Modeling
REFERENCESAddison. H. M (1972). Agricultural Extension: A Reference Manual. Food
and Agricultural Organization of the United Nations. Rome
Alwin DF, Hauser RM (1975). The Decomposition of Effects in PathAnalysis. Am. Sociol. Rev. 40,37-47.
Arbuckle JL (2007). AMOS 16 User's Guide. Chicago, IL: SPSS Inc.
Azimi Hamzah. (2007). Agricultural Extension Responsiveness inMalaysia. In 50Years of Malaysian Agriculture (pp. 740-752). Serdang:Universiti Putra Malaysia Press.
Bahaman Abu Samah & Mohamad Badsar (A draft). Practical Guide toStructural Equation Modeling using AMOS
Bahaman Abu Samah, Hayrol Azril Mohammed Shaffril, Md SallehHassan, Musa Abu Hassan & Narimah Ismail. (2009). Contributionof Information and Communication Technology in Increasing Agro-based Entrepreneurs Productivity in Malaysia. Journal of Agriculture& Social Sciences, 5,93-97.
Bahaman Abu Samah, Hayrol Azril Mohammed Shaffril, Musa AbuHassan & Jeffrey Lawrence D'Silva. (201Ia). Can TechnologyAcceptance Model be Applied on the Rural Setting: The Case ofVillage Development and Security Committee in Malaysia. Journalof Social Sciences, 7(92), 113-119.
Bahaman Abu Samah, HayrolAzril Mohammed Shaffril, Jeffrey LawrenceD'Silva & Jegak Uli. (20 II b). The Negative Environmental Changeson the Sea and its Impact on the Aspects of Economic, Social andHealth of the Fishermen Living in the East Coast Zone of PeninsularMalaysia. American Journal of Environmental Sciences, 7(6),534-541.
Bahaman Abu Samah, Jeffrey Lawrence D'Silva, HayrolAzril MohammedShaffril, Norsida Man & Azmariana Azman. (2012). MalaysianContract Farmers' Attitude towards Sustainable Agriculture. Journalof Basic and Applied Scientific Research, 2(9), 9205-9210.
Bahaman Abu Samah, Mohamad Badsar, Musa Abu Hassan, NizamOsman & Hayrol Azril Mohammed Shaffril. (2013). Youth andTelecentres in Community Building in Rural Peninsular Malaysia.Pertanika Journal of Social Science & Humanities, 2 J (S), 67-78.
11168

Bahaman Abu Samah
Baig, M. B., & Aldosari, F. (2013). Agricultural Extension in Asia:Constraints and Options for Improvement. The Journal of Animal &Plant Sciences, 23(2),619-632
Baron RM, Kenny DA (1986). The Moderator-Mediator variableDistinction in Social Psychological Research: Conceptual, Strategic,and Statistical Considerations. Journal Personal Social Psychology,51,1173-1182.
Braverman, M. T, & Engle, M. (2009). Theory and rigor in Extensionprogram evaluation planning. Journal of Extension [On-line), 47(3)Article 3FEAl
Brown, T.A. (2006). Confirmatory Factor Analysis for Applied Research.New York: The Guilford Press.
Bryne, B.M. (2010). Structural Equation Modeling with AMOS: Basicconcepts, application and programing. London: Lawrence ErlbaumAssociates.
Carvalho, J.D, Chima, EO. (2014). Applications of Structural EquationModeling in Social Sciences Research. American InternationalJournal of Contemporary Research 4(1): 6-1l.
Cheng, E. W L (2001). SEM being more effective than multiple regressionin parsimonious model testing for management development research.Journal of Management Development, 20(7), 650-667. http://dx.doi.orgll 0.11 08/0262171 0 110400564
Cooperative Extension History. (n.d.). Retrieved August 31, 2016, fromhttps:llnifa.usda.gov/cooperative-extension-history
Dunifon, R., Duttweiler, M., Pillemer, K., Tobias, D., & Trochim, WM. K.(2004). Evidence-Based Extension. Journal of Extension, 42 (2): 1-16.
Efron B (1979). Bootstrap Method: Another Look at the Jackknife. Annalsof Statistics, 7, 1-26.
Fetsch, R. J., MacPhee, D. & Boyer, L. K (2012). Evidence-BasedProgramming: What Is a Process an Extension Agent Can Use toEvaluate a Program's Effectiveness. Journal of Extension, 50(5), 1-14.
69111

Enhancing Extension Research using Structural Equation Modeling
Fornell, C.& D.F. Larcker (1981). Evaluating Structural Equation Modelswith Unobservable Variables and Measurement Error. Journal ofMarketing Research, 18(1),41-54.
Frazier PA & Tix AP (2004). Testing Moderator and Mediator Effects inCounseling Psychology Research. Journal of Counseling Psychology,51(1),115-134.
Gagnon, R. J, Garst, B. A, & Franz, N. K. (2015). Looking Ahead:Envisioning the Future of the Extension Program Development Model.Education Publications, Paper 10. School of Education, Iowa StateUniversity
Hair, IF., Black WC., Babin, BJ., Anderson, R.E., Tatham, R.L. & (200).Multivariate Data Analysis, 7th Edition. Upper Saddle River, NewJersey: Pearson Prentice Hall.
Hair, IF., Anderson, R.E., Tatham, R.L. & Black »ic: (2010). MultivariateData Analysis: A Global Perspective (7th Edition). Upper SaddleRiver, New Jersey: Pearson Prentice Hall.
Hayes Andrew H. (2009). Beyond Baron and Kenny: Statistical MediationAnalysis in the New Millennium. Communication Monographs, 76(4),408-420.
Holmbeck G.N. (1997). Towards Terminological, Conceptual, andStatistical Clarity in the Study of Mediators and Moderators: Examplesfrom the Child-Clinical and Pediatric Psychology Literatures. Journalof Consulting and Clinical Psychology, 65,599-610
Hox, 1.1. & Bechger, T.M. (1998). An Introduction to Structural EquationModeling. Family Science Review, 11, 354-373
Kelsey, L.D. and Hearne c.c. (1966). Co-operative Extension Work. NewYork: Constock Publishing Associates.
Kline, R. (2005). Principles and Practices of Structural Equation Modeling(2nd.edition). New York: Guilford Press.
Kline, R.B. (2011). Principles and Practice of Structural EquationModeling. (3rd ed.). New York: The Guilford Press
Leagan, LP. (1961). Extension Education for Community Development.Directorate of Extension, Ministry of Food and AgricultureGovernment of India, New Delhi
11170

Bahaman Abu Samah
MacCallum, E.W.L., Austin, 1. (2000). Applications of Structural EquationModeling in Psychological Research. Annu. Rev. Psychol, 51,201-226
MacKinnon D.P., Dwyer 1.H. (1993). Estimation of Mediated Effects inPrevention Studies. Eval. Review, 17, 144-158.
MacKinnon D.P. (2000). Contrasts in Multiple Mediator Models. InMultivariate Applications in Substance Use Research: New Methodsfor New Questions, ed. JS Rose, L Chassin, C.C. Presson, SJ Sherman,pp. 141-160. Mahwah, NJ: Erlbaum.
MacKinnon D.P., Fairchild AJ., Fritz M.S. (2007). Mediation Analysis.Annual Review of Psychology, 593-614.
Maimunah Ismail (1989). Pengembangan: Implikasi ke atas PembangunanMasyarakat. Kuala Lumpur: Dewan Bahasa dan Pustaka
Radhakrishna,R, Tobin, D., Foley, C. (2014). Integrating Extension andResearch Activities: An Exploratory Study. Journal of Extension[On-line], 52(1) Article IFEAI
Rahim M. Sail (1992). Extension Programmes and Services in PovertyRedressal: The Case of Kuala Langat District, Selangor. In Issues inRural Development in Malaysia (pp. 207-227). Kuala Lumpur: DewanBahasa dan Pustaka.
Rose BM, Holmbeck GN, Coaklet RM, & Frankss EA (2004). Mediatorand Moderator Effects in Developmental and Behavioral PediatricResearch. Developmental and Behavioral Pediatrics, 25(1), 58-67.
Schumacker, E.E, Lomax, R.G. (2010). A Beginner's Guide to StructuralEquation Modeling: 3rd. Ed. New York: Routledge.
Suvedi, M & Kaplowitz, M. (2016). What Every Extension Worker ShouldKnow. Michigan: MEAS.
Westland, C. 1. (2010). Lower bounds on sample size in structural EquationModeling. Electronic Commerce Research and Applications, 9(6),476-487. http.r/dx.doi.org/I 0.1 0 16/j.elerap.20 I0.07.003
71111

Enhancing Extension Research using Structural Equation Modeling
STATISTICAL LEARNING TOOL (SLT 3)Sample of Screen Captures
The Interface Page
List and Link to Applications
Construct Validity and Reliability
11172

Bahaman Abu Samah
Mediation TestUsing Bootstrap Procedure
Moderation TestUsing Multi-group Analysis
~~---E::JI ~ Li__ _~~'
73111

Bahaman Abu Samah
BIOGRAPHYBahaman Abu Samah is a Professor of Extension Education atthe Department of Professional Development and ContinuingEducation, Faculty of Educational Studies, Universiti PutraMalaysia (UPM).
He was born on the 3rd of December, 1956, in Batu Gajah, Perak,Malaysia. He is the fourth of seven siblings in his family. He ismarried to Hajjah Faridah Hj. Mohd Idris and they are blessed withtwo sons, Haniff and Ahmad Auzuddin, as well as 5 grandchildren,Anas Naufal, Safa Maisarah, Afif Faisal, Aiman Lutfi and AkidDaniel.
Bahaman completed his primary and secondary education atSekolah Kebangsaan, Sekolah Menengah Rendah and SekolahMenengah Sultan Yusuff, Batu Gajah, Perak. He obtained hisMalaysian Certificate of Education in 1974. He then graduated witha Diploma in Agriculture (Universiti Pertanian Malaysia) in 1978.After having completed his Bachelor of Science in Crop Sciencein May 1980 and Master of Science in Extension Education inDecember 1981, both from Louisiana State University, he joinedUPM as a lecturer in 1982. Subsequently, while pursuing his Ph.D.study at Iowa State University, he was awarded the Gamma SigmaDelta, the Honour Society of Agriculture and the Honour Societyof Phi Kappa Phi in 1991. He completed his Doctor of Philosophyin Extension Education in December 1992.
Bahaman's research, teaching and extension experiences spanthe fields of extension education, program planning, participationstudies, statistics and computer applications in human resourcedevelopment. To date, as a main supervisor, Bahaman has graduated12 Doctoral, 57 Master and 25 Bachelor students. Additionally,as an inventor, he has developed several statistical analysis and
75111

Enhancing Extension Research using Structural Equation Modeling
publication tools to facilitate student learning and understandingof statistics and academic writing.
Further, as a researcher, Bahaman has completed 54 researchand consultancy projects funded by local and internationalagencies in the areas of Extension Education, Youth Development,Community Development, Human Resource Development and ICTapplications, 11 of them as the principal researcher. His researchprojects have won 4 Gold, 3 Silver and 6 Bronze medals at UPMResearch Innovation and Invention Exhibitions, from 2005 to 2014.His research findings have had an impact on revitalising extensionand communication work practices in Malaysia and abroad. Hisresearch has received funding from various agencies which include,among other, the Malaysian Rubber Research and DevelopmentBoard, Palm Oil Research and Development Board, RISDA,KEMAS, Multimedia Development Corporation (MDEC),Department of National Unity and Integration, Prime Minister'sDepartment, UNESCO, Nippon Foundation and AMIC.
His research projects entitled 'Assessment of farmers'participation in Integrated Agricultural Development Projects inPeninsular Malaysia' and 'Farmers participation in Group Projectsin Selangor' as well as 'A review of extension activities of rubbersmallholders' transformed the practices of the Ministry and agro-communities in enhancing participation in extension, which is oneof the core factors that drives productivity across all agriculturalactivities.
Bahaman's significant work also focused on enhancingcommunity social well-being. His research projects entitled'University students' perception on National Unity' and'Effectiveness of Volunteering Patrol Scheme and Pattern of Urbanand Rural Community Participation' provided policy strategieson how to transform communities' commitment to enhance their
11176

Bahaman Abu Samah
participation and contribution to national unity. His other projectswhich looked into how community kindergartens contribute tothe overall community development ecosystem synergy, involvingparents and other stakeholders, enabled government, private andNGO organizations to review their existing practices and launchesome 'game-changing' initiatives to enhance healthy participationfrom communities across sectors and cultures.
In addressing the rapid changes generated by globalisation thatalso affects the Malaysian lifestyles and well-being, his researchprojects looking into rural community leT participation entitled'Gerakan Desa Wawasan Village Development Committee Members'(VDCM) Commitment, Participation and Competencies' and'Gerakan Desa Wawasan Village Development Committee Members'(VDCM) ICT Usage: The Creation of an e-Community' transformedthe way VDeM works and paved the way for the creation of activeMalaysian e-communities that embrace leT in their daily lives.
His work with youth in projects like' i-Th.ink PilotProject Achievement Status' and 'Setting the context for youthentrepreneurship through ICT: Exploring how ICT influenceYouth Entrepreneurship in Malaysian Rural Community',"Conceptualising the Critical Issues in Development of ICTProjects: towards understanding the role of ICT on Youth sSustainable Livelihood' and 'Selangor Youth Policy Development'provided indicators for policy changes in enhancing youth IC]'penetration and their participation as partners in nation building.His recent project also looked into developing an instrument thatmeasures Malaysian urban youth's subjective well-being.
Another community which significantly interests Bahaman is the'at-risk' community. His research which covers prison-communityparticipation to address recidivism entitled 'Effectiveness of PrisonDepartment s Rehabilitation Program in Addressing Recidivism'
77111

Enhancing Extension Research using Structural Equation Modeling
provides a new look into how communities at all levels cancollaborate and support to help prisoners and ex-convicts make asuccessful comeback into the community and lead a more positivelife.
To date, Bahaman has authored and co-authored 124 lSI!Thomson/Scopus and peer reviewed journal articles, 8 books and17 book chapters, 8 teaching and training modules, 84 conferenceproceeding papers and 17 technical research reports. His co-authored paper entitled 'Working conditions and predictors ofquality of working life: A psychological analysis of MalaysianInformation System Personnel', won the best paper award at theAsian Conference of the Academy ofHRD in Seoul, Korea in 2004.He has been invited as an expert master trainer and conducted 90technical trainings for local and international participants, rangingfrom statistical analyses using SPSS and Structural EquationModelling using AMOS to extension program planning, extensionand development communication, leadership and motivation. Hehas also been involved in editing journal and proceeding articles aswell as textbooks and book chapters during his stint at the Institutefor Social Science Studies and Faculty of Educational Studies,UPM. He has also attended and presented papers at national andinternational conferences, workshops and seminars related to hisfields of interest.
His sits in a number of professional committees including theImplementation Committee ofIntegratedAgricultural DevelopmentProject (IADP) and Training Organizing Committee of IntegratedAgricultural Development Project (IADP), Penang, as well asthe Oil Palm Training Committee of Palm Oil Research InstituteMalaysia (PORIM).
Bahaman has held several important posts in UPM such as,the Head of the Continuing Education Unit, Centre for Extension
11178
Bahaman Abu Samah
and Continuing Education; Program Head, Institute for DistanceEducation and Learning; Laboratory Head, Institute for Communityand Peace Studies; and Deputy Director and eventually Directorof the Institute for Social Science Studies. Currently, he servesas the Head of the Department of Professional Development andContinuing Education, Faculty of Educational Studies.
He was promoted to Associate Professor in 2000, and Professorin 2014. He was awarded Excellent Service Awards by UPM in2003, 2004, 2005 and 2006. In 2005, he was awarded the ViceChancellor Fellowship for excellence in teaching.
All in all, Bahaman Abu Samah enjoys his work in UPM, isgrateful to Allah SWT for His blessings and divine assistance, andis thankful to be surrounded by inspiring colleagues and mentors,loving family members as well as caring friends. As a passionateextension professional, Bahaman will continue to contributesignificantly to UPM, the nation and the world.
79111

Bahaman Abu Samah
ACKNOWLEDGEMENTIn the name of Allah, the Most Gracious and Most Merciful, I amsincerely grateful to Allah the Al-Mighty for His guidance andblessings in shaping my academic career.
I would like to express my profound appreciation and gratitudeto Prof. Datin Paduka Dr. Aini Ideris, the Vice Chancellor ofUniversiti Putra Malaysia, and Prof. Dato' Dr. Mohd Fauzi HajiRamlan, the former Vice Chancellor, for their continuous supportthroughout my career development.
I am indebted to the Perak State Government for providing mewith the financial support to undertake my diploma studies and theGovernment of Malaysia for the financial support that enabled meto undertake my bachelor, master's and PhD degrees. Without theirsupport, I would not have been able to complete my studies.
My heartfelt gratitude and appreciation to all former Directorsof the then Center for Extension and Continuing Education, Prof.Dr. Aida Suraya Md Yunus, Dean, Faculty of Educational Studiesand Prof. Dr. Ab. Rahim Bakar, former Dean, Faculty of EducationalStudies, for their constant support and encouragement.
I would like to convey my special appreciation and gratitudeto all my co-researchers, both in the Department of ProfessionalDevelopment and Continuing Education and the Institute forSocial Science Studies, for their commitment and diligence incollectively acquiring research funds, conducting research projectsand disseminating the results of our work. A special thanks to Dr.Hayrol Azril Mohamed Shaffril and Dr. Jeffrey Lawrence D'Silvafor their dedication in this regard.
Similar appreciation and gratitude to all my graduate studentswho have been so committed in undertaking their Master's and Ph.Dresearch, as well as in their contributions to publications. Specialappreciation goes to Dr. Mohamad Badsar, for it was through his
81111
Enhancing Extension Research using Structural Equation Modeling
Ph.D research that I first explored the power of structural equationmodeling. Through a series of subsequent training workshops, wemanaged to further develop our expertise in using this statistical
tool.I would like to convey my appreciation to all academic and
support staff of the Department of Professional Development andContinuing Education, Faculty of Educational Studies and theInstitute for Social Science Studies, for their continuous supportand for making my academic career a success. Special thanks toAssoc. Prof. Dr. Ismi Arif Ismail, Assoc. Prof. Dr. Abdul LateefKrauss Abdullah, Prof. Dr. Turiman Suandi, Assoc. Prof. Dr. AzahariIsmail, Dr. Siti Raba'ah Harnzah, Prof. Dr. Maimunah Ismail andDr. Zoharah Omar.
Last but not least, my sincere gratitude and appreciation tomy wife, Hjh. Faridah Hj. Mohd Idris, my beloved mother - Hjh.Aishah Hj. Pandak Simun, my late father - Hj. Abu Samah KulopMuhammad, my two sons - Haniff and Ahmad Aizuddin, mydaughters-in-law - Najihah Hj. Abdul Rahman and Wan RusilaWan Zulkifeli, my grandchildren - Anas Naufal, Safa Maisarah,Afif Faisal, Aiman Lutfi and Akid Daniel, and all my brothers andsisters, for their endless do 'a, encouragement, moral support andunderstanding.
11182

Bahaman Abu Samah
LIST OF INAUGURAL LECTURES
1. Prof. Dr. Sulaiman M. Yassin 9. Prof. Ir. Dr. Mohd. Zohadie BardaieThe Challenge to Communication Engineering TechnologicalResearch in Extension Developments Propelling Agriculture
22 July 1989 into the 21st Century28 May 1994
2. Prof. Ir. Abang Abdullah Abang AliIndigenous Materials and Technology 10. Prof. Dr. Shamsuddin Jusopfor Low Cost Housing Rock. Mineral and Soil30 August 1990 18 June 1994
3. Prof. Dr. Abdul Rahman Abdul Razak II. Prof. Dr. Abdul Salam AbdullahPlant Parasitic Nematodes. Lesser Natural Toxicants Affecting AnimalKnown Pests of Agricultural Crops Health and Production
30 January 1993 29 June 1994
4. Prof. Dr. Mohamed Suleiman 12. Prof. Dr. Mohd. Yusof HusseinNumerical Solution of Ordinary Pest Control: A Challenge in AppliedDifferential Equations: A Historical Ecology
Perspective 9 July 1994
II December 199313. Prof. Dr. Kapt. Mohd. Ibrahim Haji
5. Prof. Dr. Mohd. AriffHussein Mohamed
Changing Roles of Agricultural Managing Challenges in Fisheries
Economics Development through Science and
5 March 1994 Technology23 July 1994
6. Prof. Dr. Mohd. Ismail AhmadMarketing Management: Prospects 14. Prof. Dr. Hj. Amat luhari Moain
and Challenges for Agriculture Sejarah Keagungan Bahasa Melayu
6 April1994 6 August 1994
7. Prof. Dr. Mohamed Mahyuddin Mohd. 15. Prof. Dr. Law Ah Theem
Dahan Oil Pollution in the Malaysian Seas
The Changing Demand for Livestock 24 September 1994
Products20 April 1994 16. Prof. Dr. Md. Nordin Hj. Lajis
Fine Chemicals from Biological
8. Prof. Dr. Ruth Kiew Resources: The Wealthfrom Nature
Plant Taxonomy. Biodiversity and 21 January 1995
ConservationII May 1994 17. Prof. Dr. Sheikh Omar Abdul Rahman
Health. Disease and Death inCreatures Great and Small25 February 1995
83111

Enhancing Extension Research using Structural Equation Modeling
18. Prof. Dr. Mohamed Shariff MohamedDinFish Health: An Odyssey through theAsia - Pacific Region25 March 1995
19. Prof. Dr. Tengku Azmi Tengku IbrahimChromosome Distribution andProduction Performance ofltaterBuffaloes6 May 1995
20. Prof. Dr. Abdul Hamid MahmoodBahasa Melayu sebagai Bahasa Ilmu-Cabaran dan Harapan10 June 1995
21. Prof. Dr. Rahim Md. SailExtension EducationforIndustrialising Malaysia: Trends.Priorities and Emerging Issues22 July 1995
22. Prof. Dr. Nik Muhammad Nik Abd.MajidThe Diminishing Tropical Rain Forest:Causes. Symptoms and Cure19 August 1995
23. Prof. Dr. Ang Kok JeeThe Evolution of an EnvironmentallyFriendly Hatchery Technology forUdang Galah, the King of FreshwaterPrawns and a Glimpse into the Futureof Aquaculture in the 2 I st Century14 October 1995
24. Prof. Dr. Sharifuddin Haji AbdulHamidManagement of Highly Weathered AcidSoilsfor Sustainable Crop Production28 October 1995
25. Prof. Dr. Yu Swee YeanFish Processing and Preservation:Recent Advances and FutureDirections9 December 1995
11184
26. Prof. Dr. Rosli MohamadPesticide Usage: Concern and Options10 February 1996
27. Prof. Dr. Mohamed Ismail AbdulKarimMicrobial Fermentation andUtilization of AgriculturalBioresources and mlstes in Malaysia2 March 1996
28. Prof. Dr. Wan Sulaiman Wan HarunSoil Physics: From Glass Beads toPrecision Agriculture16 March 1996
29. Prof. Dr. Abdul Aziz Abdul RahmanSustained Growth and SustainableDevelopment: Is there a Trade-Off I orMalaysia13April1996
30. Prof. Dr. Chew Tek AnnSharecropping in PerfectlyCompetitive Markets: A Contradictionin Terms27 April 1996
31. Prof. Dr. Mohd. Yusuf SulaimanBack to the Future with the Sun18 May 1996
32. Prof. Dr. Abu Bakar SallehEnzyme Technology: The BasisforBiotechnological Development8 June 1996
33. Prof. Dr. Kamel Ariffin Mohd. AtanThe Fascinating Numbers29 June 1996
34. Prof. Dr. Ho Yin WanFungi: Friends or Foes27 July 1996
35. Prof. Dr. Tan Soon GuanGenetic Diversity of Some SoutheastAsian Animals: Of Buffaloes andGoats and Fishes Too10 August 1996

Bahaman Abu Samah
36. Prof. Dr. Nazaruddin Mohd. JaliWill Rural Sociology Remain Relevantin the 21st Century?21 September 1996
37. Prof. Dr. Abdul Rani BahamanLeptospirosis-A Model [orEpidemiology, Diagnosis and Controlof Infectious Diseases16 November 1996
38. Prof. Dr. Marziah MahmoodPlant Biotechnology - StrategiesforCommercialization21 December 1996
39. Prof. Dr. Ishak Hj. OmarMarket Relationships in the MalaysianFish Trade: Theory and Application22 March 1997
40. Prof. Dr. Suhaila MohamadFood and Its Healing Power12April1997
41. Prof. Dr. Malay Raj MukerjceA Distributed CollaborativeEnvironmentfor Distance LearningApplications17 June 1998
42. Prof. Dr. Wong Kai ChooAdvancing the Fruit Industry inMalaysia: A Need to Shi/i ResearchEmphasisIS May 1999
43. Prof. Dr. Aini IderisAvian Respiratory andImmunosuppressive Diseases- A FatalAttraction10 July 1999
44. Prof. Dr. Sariah MconBiological Control of Plant Pathogens:Harnessing the Richness of MicrobialDiversity14 August 1999
45. Prof. Dr. Azizah HashimThe Endomvcorrhi:a: A FutileInvestment?23 October 1999
46. Prof. Dr. Noraini Abdul SamadMolecular Plant Virology: The WayForward2 February 2000
47. Prof. Dr. Muhamad AwangDo We Have Enough Clean Air toBreathe?7 April2000
48. Prof. Dr. Lee Chnoong KhcngGreen Environment, Clean Power24 June 2000
49. Prof. Dr. Mohd. Ghazali MohayidinManaging Change in the AgricultureSector: The Need/or InnovativeEducational Initiatives12 January 2002
50. Prof. Dr. Fatimah Mohd. ArshadAnalisis Pemasaran Pertaniandi Malaysia: Keperluan AgendaPembaharuan26 January 2002
SI. Prof. Dr. Nik Mustapha R. AbdullahFisheries Co-Management: AnInstitutional Innovation TowardsSustainable Fisheries Industry28 February 2002
52. Prof. Dr. Gulam Rusul Rahmat AliFood Safety: Perspectives andChallenges23 March 2002
53. Prof. Dr. Zaharah A. RahmanNutrient Management StrateglesforSustainable Crop Production in AcidSoils: The Role of Research UsingIsotopes13 April2002
85111

Enhancing Extension Research using Structural Equation Modeling
54. Prof. Dr. Maisom AbdullahProductivity Driven Growth: Problems& Possibilities27 April 2002
55. Prof. Dr. Wan Omar AbdullahImmunodiagnosis and Vaccination forBrugian Filariasis: Direct Rewardsfrom Research Investments6 June 2002
56. Prof. Dr. Syed Tajuddin Syed HassanAgro-ento Bioinformation: Towardsthe Edge of Reality22 June 2002
57. Prof. Dr. Dahlan IsmailSustainability of Tropical Animal-Agricultural Production Systems:Integration of Dynamic ComplexSystems27 June 2002
58. Prof. Dr. Ahmad ZubaidiBaharumshahThe Economics of Exchange Rates inthe East Asian Countries26 October 2002
59. Prof. Dr. Shaik Md. Noor Alam S.M.HussainContractual Justice in Asean: AComparative View of Coercion31 .October 2002
60. Prof. Dr. Wan Md. Zin Wan YunusChemical Modification of Polymers:Current and Future Routes forSynthesizing New PolymericCompounds9 November 2002
61. Prof. Dr. Annuar Md. NassirIs the KLSE Efficient? Efficient MarketHypothesis vs Behavioural Finance23 November 2002
11186
62. Prof. Ir. Dr. Radin Umar Radin SohadiRoad Safety Interventions in Malaysia:How Effective Are They?21 February 2003
63. Prof. Dr. Shamsher MohamadThe New Shares Market: RegulatoryIntervention, Forecast Errors andChallenges26 April 2003
64. Prof. Dr. Han Chun KwongBlueprint for Transformation orBusiness as Usual? A StructurationalPerspective of the Knowledge-BasedEconomy in Malaysia31 May 2003
65. Prof. Dr. Mawardi RahmaniChemical Diversity of MalaysianFlora: Potential Source of RichTherapeutic Chemicals26 July 2003
66. Prof. Dr. Fatimah Md. YusoffAn Ecological Approach: A ViableOption for Aquaculture Industry inMalaysia9 August 2003
67. Prof. Dr. Mohamed Ali RajionThe Essential Fatty Acids-Revisited23 August 2003
68. Prof. Dr. Azhar Md. ZainPsychotheraphyfor Rural Malays -Does it fforP13 September 2003
69. Prof. Dr. Mohd. Zamri SaadRespiratory Tract Infection:Establishment and Control27 September 2003
70. Prof. Dr. Jinap SelamatCocoa-Wonders/or Chocolate Lovers14 February 2004

Bahaman Abu Samah
71. Prof. Dr. Abdul Halim ShaariHigh Temperature Superconductivity:Puzzle & Promises13 March 2004
72. Prof. Dr. Yaakob Che ManOils and Fats Analysis - RecentAdvances and Future Prospects27 March 2004
73. Prof. Dr. Kaida KhalidMicrowave Aquametry: A GrowingTechnology24 April 2004
74. Prof. Dr. Hasanah Mohd. GhazaliTapping the Power of Enzymes-Greening the Food IndustryII May 2004
75. Prof. Dr. YusoflbrahimThe Spider Mite Saga: Quest forBiorational Management Strategies22 May 2004
76. Prof. Datin Dr. Sharifah Md. NorThe Education of At-Risk Children:The Challenges Ahead26 June 2004
77. Prof. Dr. Ir. Wan Ishak Wan IsmailAgricultural Robot: A New TechnologyDevelopment fill' Agro-Based Industry14 August 2004
78. Prof. Dr. Ahmad Said SajapInsect Diseases: ResourcesforBiopesticide Development28 August 2004
79. Prof. Dr. Aminah AhmadThe Interface ofwork and FamilyRoles: A Quest for Balanced LivesII March 2005
80. Prof. Dr. Abdul Razak AlimonChallenges in Feeding Livestock:From nastes to Feed23 April 2005
81. Prof. Dr. HajiAzimi Hj. HamzahHelping Malaysian YOlllhMoveForward: Unleashing the PrimeEnablers29 April 2005
82. Prof. Dr. Rasedee AbdullahIn Search of An Early Indicator ofKidney Disease27 May 2005
83. Prof. Dr. Zulkifli Hj. ShamsuddinSmart Partnership: Plant-Rhizobacteria Associations17 June 2005
84. Prof. Dr. Mohd KhanifYusopFrom the Soil to the TableI July 2005
85. Prof. Dr. Annuar KassimMaterials Science and Technology:Past, Present and the Future8 July 2005
86. Prof. Dr. Othman MohamedEnhancing Career DevelopmentCounselling and the Beauty of CareerGames12 August 2005
87. Prof. Ir. Dr. MohdAmin Mohd SoomEngineering Agricultural WaterManagement Towards PrecisionFraming26 August 2005
88. Prof. Dr. Mohd Arif SyedBioremediation-A Hope Yetfor theEnvironment?9 September 2005
89. Prof. Dr. Abdul Hamid Abdul RashidThe Wonder of Our NeuromotorSystem and the TechnologicalChallenges They Pose23 December 2005
87111
Enhancing Extension Research using Structural Equation Modeling
90. Prof. Dr. Norhani AbdullahRumen Microbes and Some of TheirBiotechnological Applications27 January 2006
91. Prof. Dr. Abdul Aziz SahareeHaemorrhagic Septicaemia in Cattleand Buffaloes: Are We ReadyforFreedom?24 February 2006
92. Prof. Dr. Kamariah Abu BakarActivating Teachers' Knowledge andLifelong Journey in Their ProfessionalDevelopment3 March 2006
93. Prof. Dr. Borhanuddin Mohd. AliInternet Unwired24 March 2006
94. Prof. Dr. Sundararajan ThilagarDevelopment and Innovation in theFracture Management of Animals31 March 2006
95. Prof. Dr. Zainal Aznam Md. JelanStrategic Feedingfor a SustainableRuminant Farming19 May 2006
96. Prof. Dr. Mahiran BasriGreen Organic Chemistry: Enzyme atrfork14 July 2006
97. Prof. Dr. Malik Hj. Abu HassanTowards Large Scale UnconstrainedOptimization20 April 2007
98. Prof. Dr. Khalid Abdul RahimTrade and Sustainable Development:Lessons from Malaysia :5 Experience22 June 2007
11188
99. Prof. Dr. Mad Nasir ShamsudinEconometric Modelling forAgricultural Policy Analysis andForecasting: Between Theory andReality13 July 2007
100. Prof. Dr. Zainal Abidin MohamedManaging Change - The Fadsand The Realities: A Look atProcess Reengineering, KnowledgeManagement and Blue OceanStrategy9 November 2007
101. Prof. Ir. Dr. Mohamed DaudExpert Systems for EnvironmentalImpacts and Ecotourism Assessments23 November 2007
102. Prof. Dr. Saleha Abdul AzizPathogens and Residues; How Safeis Our Meat?30 November 2007
103. Prof. Dr. Jayum A. JawanHubungan Sesama Manusia7 December 2007
104. Prof. Dr. Zakariah Abdul RashidPlanning for Equal IncomeDistribution in Malaysia: A GeneralEquilibrium Approach28 December 2007
lOS. Prof. Datin Paduka Dr. KhatijahYusoffNewcastle Disease virus: A Journevfrom Poultry to Cancer 'II January 2008
106. Prof. Dr. Dzulkefly Kuang AbdullahPalm Oi/: Still the Best ChoiceI February 2008
107. Prof. Dr. Elias SaionProbing the Microscopic Worlds byLonizing Radiation22 February 2008

Bahaman Abu Samah
lOS. Prof. Dr. Mohd Ali HassanWaste-to-Wealth ThroughBiotechnology: For Profit. Peopleand Planet2S March 200S
109. Prof. Dr. Mohd MaarofH. A. MoksinMetrology at Nanoscale: ThermalWave Probe Made It SimpleII April 200S
110. Prof. Dr. Dzolkhifli OmarThe Future of Pesticides Technologyin Agriculture: Maximum Target Killwith Minimum Collateral Damage25 April 200S
III. Prof. Dr. Mohd. Yazid Abd. ManapProbiotics: YOllrFriendly GutBacteria9 May 200S
112. Prof. Dr. Hamami SahriSustainable Supply of Wood andFibre: Does Malaysia have Enough?23 May 200S
113. Prof. Dato' Dr. Makhdzir MardanConnecting the Bee Dots20 June 200S
114. Prof. Dr. Maimunah IsmailGender & Career: Realities andChallenges25 July 200S
115. Prof. Dr. Nor Aripin SharnaanBiochemistry of Xenobiotics:Towards a Healthy Lifestyle and SafeEnvironmentI August 200S
116. Prof. Dr. Mohd Yunus AbdullahPenjagaan Kesihatan Primer diMalaysia: Cabaran Prospek danImplikasi dalam Latihan danPenyelidikan Perubatan sertaSains Kesihatan di Univcrsiti PutraMalaysia8 August 200S
117. Prof. Dr. MusaAbu HassanMemanfaatkan Teknologi Maklumat& Komunikasi ICT untuk Semua15 August 200S
lIS. Prof. Dr. Md. Sallch Hj. HassanRole of Media in Development:Strategies, Issues & Challenges22 August 200S
119. Prof. Dr. Jariah MasudGender in Everyday Life10 October 2008
120 Prof. Dr. Mohd Shahwahid HajiOthmanMainstreaming Environment:Incorporating Economic Valuationand Market-Based Instruments inDecision Making24 October 200S
121. Prof. Dr. Son RaduBig Questions Small Worlds:Following Diverse Vistas31 October 2008
122. Prof. Dr. Russly Abdul RahmanResponding to Changing Lifestyles:Engineering the Convenience Foods2S November 200S
123. Prof. Dr. Mustafa Kamal MohdShariffAesthetics in the Environment anExploration of Environmental:Perception Through LandscapePreference9 January 2009
124. Prof. Dr. Abu Daud SilongLeadership Theories, Research& Practices: Farming FutureLeadership Thinking16 January 2009
89111

Enhancing Extension Research using Structural Equation Modeling
125. Prof. Dr. Azni Idris 135. Prof. Dr. W. Mahmood MatYunusWaste Management. What is the Photothermal and Photoacoustic:Choice: Land Disposal or Biofuel? From Basic Research to Industrial23 January 2009 Applications
10 July 2009126. Prof. Dr. Jamilah Bakar
Freshwater Fish: The Overlooked 136. Prof. Dr. Taufiq Yap Yun HinAlternative Catalysis for a Sustainable World30 January 2009 7 August 2009
127. Prof. Dr. Mohd. Zobir Hussein 137 Prof. Dr. Raja Noor Zaliha RajaThe Chemistry of Nanomaterial and Abd. RahmanNanobiomaterial Microbial Enzymes: From Earth to6 February 2009 Space
9 October 2009128. Prof. Ir. Dr. Lee Teang Shui
Engineering Agricultural: Water 138 Prof. Ir. Dr. Barkawi SahariResources Materials. Energy and CNGDI20 February 2009 Vehicle Engineering
6 November 2009
129. Prof. Dr. Ghizan SalehCrop Breeding: Exploiting Genes for 139. Prof. Dr. Zulkifti IdrusFood and Feed Poultry Welfare in Modern6 March 2009 Agriculture: Opportunity or Threat?
13 November 2009
130. Prof. Dr. Muzafar Shah HabibullahMoney Demand 140. Prof. Dr. Mohamed Hanafi Musa27 March 2009 Managing Phosphorus: Under Acid
Soils Environment131. Prof. Dr. Karen Anne Crouse 8 January 2010
In Search of Small Active Molecules3 ApriI2009 141. Prof. Dr. Abdul Manan Mat Jais
Haman Channa striatus a Drug
132. Prof. Dr. Turiman Suandi Discovery in an Agro-IndustryVolunteerism: Expanding the SettingFrontiers of Youth Development 12 March 201017 April 2009
142. Prof. Dr. Bujang bin Kim Huat
133. Prof. Dr. Arbakariya ArifT Problematic Soils: In Search forIndustrializing Biotechnology: Roles Solutionof Fermentation and Bioprocess 19 March 2010
Technology8 May 2009 143. Prof. Dr. Samsinar Md Sidin
Family Purchase Decision Making:134. Prof. Ir. Dr. Desa Ahmad Current Issues & Future Challenges
Mechanics of Tillage Implements 16April20IO12 June 2009
11190
Bahaman Abu Samah
144. Prof. Dr. Mohd Adzir MahdiLightspeed: Catch Me If You Can4 June 2010
145. Prof. Dr. Raha Hj. Abdul RahimDesigner Genes: Fashioning MissionPurposed Microbes18 June 2010
146. Prof. Dr. Hj. Hamidon Hj. BasriA Stroke of Hope, A New Beginning2 July 2010
147. Prof. Dr. Hj. Kamaruzaman JusoffGoing Hyperspectral: The "Unseen"Captured?16 July 2010
148. Prof. Dr. Mohd Sapuan SalitConcurrent Engineering forComposites30 July 2010
149. Prof. Dr. Shattri MansorGoogle the Earth: What's Next?15 October 2010
150. Prof. Dr. Mohd Basyaruddin AbdulRahmanHaute Couture: Molecules &Biocatalysts29 October 2010
151. Prof. Dr. Mohd. Hair BejoPoultry Vaccines: An Innovation forFood Safety and Security12 November 2010
152. Prof. Dr. Umi Kalsom YusufFern of Malaysian Rain Forest3 December 2010
153. Prof. Dr. Ab. Rahim BakarPreparing Malaysian Youths for ThemJ/M of Work: Roles of Technicaland Vocational Education andTraining (TVET)14 January 2011
154. Prof. Dr. Seow Heng FongAre there "Magic Bullets "forCancer Therapy?11 February 2011
155. Prof. Dr. MohdAzmi Mohd LilaBiopharmaceuticals: Protection,Cure and the Real Winner18 February 2011
156. Prof. Dr. Siti Shapor SirajGenetic Manipulation in FarmedFish: Enhancing AquacultureProduction25 March 2011
157. Prof. Dr. Ahmad IsmailCoastal Biodiversity and Pollution:A Continuous Conflict22 April2011
158. Prof. Ir. Dr. Norman MariunEnergy Crisis 2050? GlobalScenario and Way Forward forMalaysia10 June 2011
159. Prof. Dr. Mohd Razi IsmailManaging Plant Under Stress: AChallenge for Food Security15 July 2011
160. Prof. Dr. Patimah IsmailDoes Genetic Polymorphisms AffectHealth?23 September 2011
161. Prof. Dr. Sidek Ab. Azizfl'<mders of Glass: Synthesis.Elasticity and Application7 October 20 II
162. Prof. Dr. Azizah OsmanFruits: Nutritious. Colourful, YetFragile Gifts of Nature14 October 20 II
91111

Enhancing Extension Research using Structural Equation Modeling
163. Prof. Dr. Mohd. Fauzi Ramlan 172. Prof. Dr. Norlijah OthmanClimate Change: Crop Performance Lower Respiratory Infections inand Potential Children: New Pathogens, OldII November 2011 Pathogens and The Hay Forward
19April2013164. Prof. Dr. Adem Kilicrnan
Mathematical Modeling with 173. Prof. Dr. Jayakaran MukundanGeneralized Function Steroid-like Prescriptions English25 November 2011 Language Teaching Can Ill-afford
26 April 2013165. Prof. Dr. Fauziah Othman
My Small World: In Biomedical 174. Prof. Dr. Azmi ZakariaResearch Photothermals Affect Our Lives23 December 2011 7 June 2013
166. Prof. Dr. Japar Sidik Bujang 175. Prof. Dr. Rahinah IbrahimThe Marine Angiosperms, Seagrass Design Informatics23 March 2012 21 June2013
167. Prof. Dr. Zailina Hashim 176. Prof. Dr. Gwendoline Ee ChengAir Quality and Children's Natural Products from MalaysianEnvironmental Health: Is Our RainforestsFuture Generation at Risk? I November 201330 March 2012
177. Prof. Dr. Noor Akma Ibrahim168. Prof. Dr. Zainal Abidin Mohamed The Many Facets of Statistical
Where is the Beef? Van/age Point Modelingform the Livestock Supply Chain 22 November 201327 April2012
178. Prof. Dr. Paridah Md. Tahir169. Prof. Dr. Jothi Malar Panandam Bonding with Natural Fibres
Genetic Characterisation of Animal 6 December 2013Genetic Resourcesfor SustaninableUtilisation and Development 179. Prof. Dr. Abd. Wahid Haron30 November 2012 Livestock Breeding: The Past, The
Present and The Future170. Prof. Dr. Fatimah Abu Bakar 9 December 2013
The Good The Bad & Ugly of FoodSafety: From Molecules to Microbes 180. Prof. Dr. Aziz Arshad7 December 2012 Exploring Biodiversity & Fisheries
Biology: A Fundamental Knowledge171. Prof. Dr. Abdul Jalil Nordin for Sustainabale Fish Production
My Colourful Sketches from Scratch: 24 January 2014Molecular Imaging5 April2013 181. Prof. Dr. Mohd Mansor Ismail
Competitiveness of BeekeepingIndustry in Malaysia21 March 2014
11192

Bahaman Abu Samah
182. Prof. Dato' Dr. Tai Shzee YewFood and Wealth from the Seas:Health Check for the MarineFisheries of Malaysia25 April2014
183. Prof. Darin Dr. Rosenani Abu BakarHaste to Health: Organic Was!«Management jar Sustainable SoilManagement and Crop Production9 May 2014
184. Prof. Dr. Abdul Rahman OmarPoultry Viruses: From Threat toTherapy23 May 2014
185. Prof. Dr. Mohamad Pauzi ZakariaTracing the Untraceable:Fingerprinting Pollutants throughEnvironmental Forensics13 June 2014
186. Prof. Dr. -Ing. Ir. RenuganthVaratharajooSpace System Trade-offs: TowardsSpacecraft Synergisms15 August 2014
187. Prof. Dr. LatiffahA. LatitfTranformasi Kesihatan Wanita keArali Kcsejahteraan Komuniti7 November 2014
188. Prof. Dr. Tan Chin PingFat and Oilsfin a HealThier Future:Makro, Micro and Nanoscales21 November 2014
189. Prof. Dr. Suraini Abd. AzizLignocellulosic Bio/itel: A HifyForward28 November 2014
190. Prof. Dr. Robiah YunusBiobascd Lubricants: Harnessingthe Richness of AgricultureResources30 January 2015
191. Prof. Dr. Khozirah ShaariDiscovering Future CuresfromPhytochemistry to Metabolomics13 February 2015
192. Prof. Dr. Tengku Aizan Tengku AbdulHamidPopulation Ageing in Malaysia: AMosaic of Issues, Challenges andProspects13 March 2015
193. Prof. Datin Dr. Faridah HanumIbrahimForest Biodiversity: Importance ofSpecies Composition Studies27 March 2015
194. Prof. Dr. Mohd Salleh KamarudinFeeding & Nutritional RequirementsofYoung FishIOApril2015
195. Prof. Dato' Dr. Mohammad ShararSabranMoney Boy: Masalah Sosial EraGenerasi Y8 Mci 2015
196. Prof. Dr. Aida Suraya Md. YunusDeveloping Students' MathematicalThinking: How Far Have lie Come?5June2015
197. Prof. Dr. Amin IsmailMalaysian Cocoa or Chocolates: ASunv of Antioxidants and More ...14August2015
198. Prof. Dr. Shamsuddin SulaimanCasting Technology: Sustainable"fetal Forming Process21 August 2015
199. Prof. Dr. Rozita RosliJourney into Genetic: Taking theTwist and Turns ofLife23 October 2015
93111

Enhancing Extension Research using Structural Equation Modeling
200. Prof. Dr. Nor Aini Ab ShukorThe Un(Straight) Truth About Trees6 November 2015
201. Prof. Dato' Dr. Ir Mohd Saleh JaafarAdvancing Concrete Materials andSystems: The Search Continues13 November 2015
202. Prof. Dr. Maznah IsmailGerminated Brown Rice andBioactive Rich Fractions: OnGoing Journey form R&D toCommercialisation29 April 2016
203. Prof. Dr. Habshah MidiAmazing Journey to Robust StatisticsDiscovering Outliers for EfficientPrediction6 May 2016
204. Prof. Dr. Mansor Ahmad @ AyobGoing Green with Bionanocomposites27 May 2016
205. Prof. Dr. Fudziah IsmailExploring Efficient Numerical Methodsfor DifJerental Equations23 September 2016
206. Prof. Dr. Noordin Mohamed MustaphaMeandering Through the SuperbScientific Worldof Pathology: ExploringIntrapolations30 September 2016
207. Prof. Dr. Mohd. Majid KontingTeachingfor Quality Learning: ALeadership Challenge21 October 2016
208. Prof. Dr. Ezhar TamamAre University Students Gelling EnoughInterethnic Communication andDiversity Engagement Experiences?Concerns and ConsiderationsII November 2016
11194