r il e effi irailway energy efficiency through …s/spring10/100226...1 r il e effi irailway energy...
TRANSCRIPT

1
R il E Effi iRailway Energy Efficiency through Monitoring,
O ti i ti d I tiOptimization and Innovation
Dr Clive RobertsDirector of Railway Research
1
Director of Railway ResearchBirmingham Centre for Railway Research and Education

2
P t ti O iPresentation Overview
Bi i h C t f R il R hBirmingham Centre for Railway Research and EducationRailway Energy SimulationRailway Energy SimulationOptimisation MethodsN A h t R il T tiNew Approaches to Railway TractionHybrid Traction System Integration LaboratoryLaboratoryCondition MonitoringC l iConclusions

3
U i it f Bi i hUniversity of Birmingham
Founded in 1900Founded in 190026,000 postgraduate and undergraduate studentsPlaced 5th in the UK for quality of researchOne of only 11 UK institutions listed in the top 100 universities of the worldFive Nobel Prize winners among staff and alumnialumniRailway research since 1968

4

5
Birmingham Centre for Railway Research and Education
Currently covers research interests in theCurrently covers research interests in the schools of:– Electronic, Electrical and Computer
Engineering– Civil Engineering
Metallurgy and Materials– Metallurgy and Materials– Mechanical Engineering– Computer ScienceComputer Science– Geography

6
Birmingham Centre for Railway Research and Education
Director - Professor Chris Baker (Civil)– Group income of £1.6 million/year– 10 Academic Staff10 Academic Staff
Director of Research - Dr Clive Roberts (EECE)– 22 Research Staff
20 PhD St d t– 20 PhD Students– 2 Support Staff
Director of Education – Assoc. Prof. Felix Schmid (Civil)– ~70 Postgraduate Students– 2 Support Staff

7
MSc in Railway Systems y yEngineering and Integration
Railway Operations and ManagementMechanical Aspects of Railway SystemsFundamentals of Railway Traction SystemsSystems Engineering and DependabilityTrack Design and Infrastr ct re S stemsTrack Design and Infrastructure SystemsSignalling and Train Control SystemsRailway Strategy and EconomicsRailway Strategy and EconomicsHuman Factors and Ergonomics

8
Railway Research UK (RRUK)Centre of Excellence in Railway Systems ResearchCentre of Excellence in Railway Systems ResearchCollaboration between 8 universities£7m funding from UK government research agencyLed jointly by Birmingham and Southampton Universities, with:– Loughborough UniversityLoughborough University– University of Leeds– Imperial College London– Manchester Metropolitan University– University of Nottingham
University of Newcastle– University of Newcastle

9
R il R h UKRailway Research UKUniversity of Birmingham – condition monitoring, y g g,systems engineering, energy, traffic management, geotechnics, aerodynamics, metallurgy University of Leeds – transport economicsUniversity of Leeds – transport economicsImperial College London – metal fatigue, novel technologiesLoughborough University - mechatronicsManchester Metropolitan University – vehicle dynamicsyUniversity of Newcastle – metallurgy, safety, policyUniversity of Nottingham – human factorsU i it f S th t t h i i dUniversity of Southampton – geotechnics, noise and vibration, policy and regulation

10
University of Birminghamy gResearch Areas
AerodynamicsAsset managementCondition monitoring *
Network capacityNon-destructive testingPower and traction *Condition monitoring *
EnvironmentGeotechnical
Power and traction *Risk and safetySignalling and train
engineeringMaterials and metallurgy
g gcontrolSystems engineering *
metallurgyModelling and computation

11
K R h P tKey Research Partners
Collaborators and Funders– Network Rail, Grant Rail, Serco, SNCF,
D t h B h (DB) Si Al tDeutsche Bahn (DB), Siemens, Alstom, Bombardier, Arup, Atkins, DeltaRail, Corus Voelst Alpine UNIFE UICCorus, Voelst Alpine, UNIFE, UIC, Railway Safety and Standards Board, Department for Transport, EPSRC, p p , ,European Commission.

12
Overview of Energy gyResearch at Birmingham
At Birmingham we are considering the following issues:– Energy consumption of new rolling stock (diesel and electric)– Energy consumption and practicalities of new traction
technologiestechnologiesHybrid trains (diesel hybrids, onboard storage for electric…)Hydrogen trains
– Power system requirements for new metro systems– Power system requirements for new metro systems– Consideration of train trajectories (energy/time trade-off)– Optimisation of train system movements– Headway regulation (train control)y g ( )– System wide optimisation for energy efficiency– Driving style improvements (driver support)– Energy monitoring

13
Current Projects injPower and traction
Department for Transport – Calculation of Energy Consumptionp p gy p– Phase 1 – Intercity Express Project (IEP) – Phase 2 - DMU (Class 150 and Pacer replacement)
Department for Transport – Discontinuous electrificationDepartment for Transport – Novel train propulsionMersey Rail – Evaluation of Energy Saving Strategies (inc. driver variance)EC – Environmental Management Tools for Infrastructure Managers (InfraGuider)(InfraGuider)Atkins – Multi-train Simulator DevelopmentKTP (Atkins) – AC railway power network simulatorPhD Student – Improving Regenerative Braking SystemsPhD Student Improving Regenerative Braking SystemsPhD Student – Optimised Supervisory Control for Hybrid Rail VehiclesPhD Student – Cost modelling for future propulsion systemsMPhil Student – Measurement and monitoring of battery systems

14
Motivation for Railway yEnergy Research
Energy accounts on average for around 15% of the operational costs for railway companies, and it is growing In 5 years the cost of energy for SNCB (B l i T i O t ) b 30%(Belgium Train Operator) grew by 30%Nowadays, the energy costs during the life
l f t i i th UK i l t hcycle of a train in the UK is almost as much as the original investment costs

15
F l C ti i UK ilFuel Consumption in UK railways
45% of vehicle km are diesel poweredElectricity can be produced with significantly reduced CO2 through nuclear power, renewable energy (wind, solar, hydroelectric), coal carbon capturecoal carbon capture

16
F l C ti i UK ilFuel Consumption in UK railways
Diesel (G )
Electricity (consumed) (GWh)
Total (G )(GWh) (GWh) (GWh)
4450 2763 7213

17

18
University of Birmingham Train Simulators
University of Birmingham MTS (with Atkins)F ll t i l ti– Full power system simulation
– Multi-train operation– Configurable to specific applications/outputs– Used by Hong Kong Metro, London Underground,
Singapore Metro, Docklands Light RailwayUniversity of Birmingham STSy g– Matlab based– Simple to configure
Quick simulation time for optimisation processes– Quick simulation time for optimisation processes– Extremely modular and able to deal with a range
of traction systemsUsed by UK Department for Transport Singapore– Used by UK Department for Transport, Singapore Metro

19
E Si l tiEnergy Simulation
Vehicle specRoute information
Traction Braking PhysicalTraction BrakingSpeed limits Gradient Physical properties
Vehicle simulator
Driving style
Power vs time

20
Si l hi l i l tSingle vehicle simulator2CVBVAR ++=
( )fA
Traction
( )carspower trailers n,nfA =
( )totalcarspower trailerstrain P,n,n,mfB =
( )panographsbogiebogieD,tailD,headD, n ,n ,c s, p, A, ,c,cfC =
Resistance
( )panographsbogiebogieD, tailD,head D,
Acceleration =1/mass*(Traction – Resistance – slope)

21
1Gradient profile
20
25Velocity profile
1200
1400running diagram
0
0.5
adie
nt s
lope
10
15
20
eloc
ity (m
/s)
600
800
1000
stan
ce (m
)
0 500 1000 1500-1
-0.5
gra
0 500 1000 15000
5
ve
0 0 5 1 1 50
200
400
di
0 500 1000 1500distance (m)
0 500 1000 1500distance (m)
0 0.5 1 1.5time (m)
1.4specific traction, resistance and acceleration curve
specific traction1.5
acceleration2
Traction/Braking Power
Traction
0.8
1
1.2
ces
(m/s
2 )
specific tractionresistanceacceleration
0
0.5
1
on (m
/s2 )
0.5
1
1.5
(MW
)
TractionBraking
0.2
0.4
0.6
spec
ific
forc
-1
-0.5
0
acce
lera
tio
-1
-0.5
0
pow
er (
0 5 10 15 20 250
velocity (m/s)0 500 1000 1500
-1.5
distance (m)0 500 1000 1500
-1.5
time (s)

22
H b id T iHybrid Trains
1. Capture and reuse of braking energy2. Able to operate prime mover at optimum efficiency
Hybridisation degree is dependent on the type of duty cycle– High speed – no downsizing but energy saving– Sub-urban – moderate downsizing possible
Shunting loco significant downsizing possible– Shunting loco – significant downsizing possible

23
24
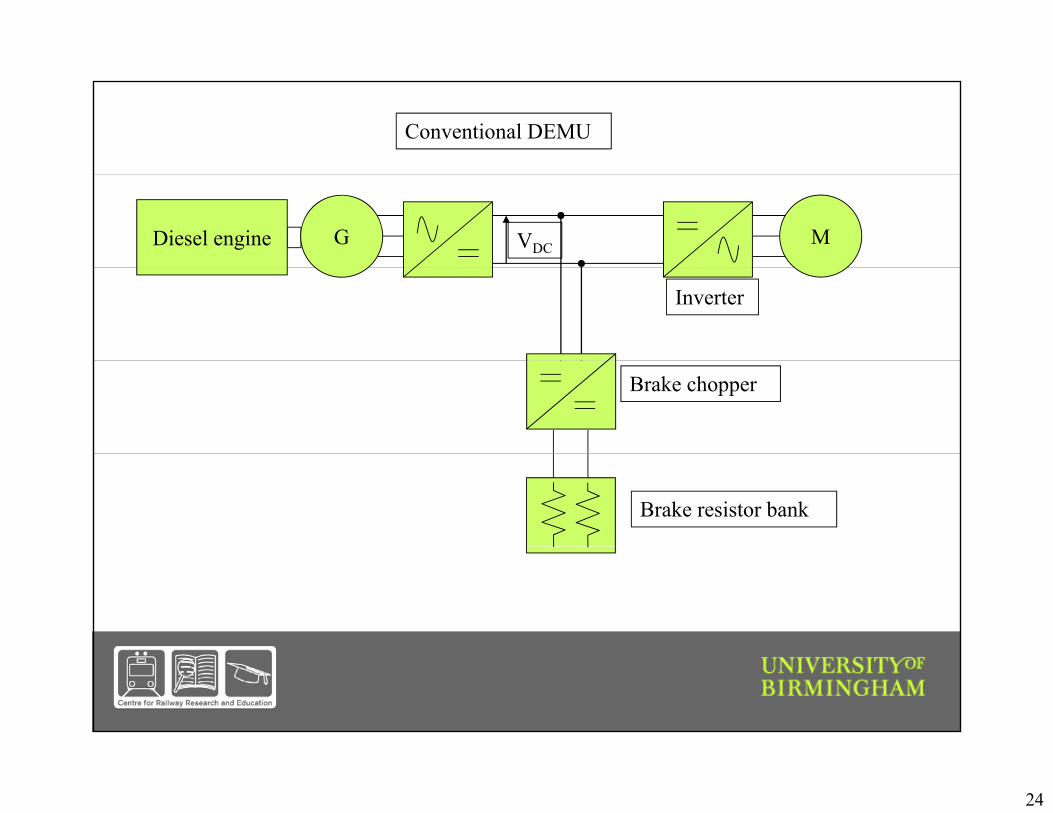
Conventional DEMU
MVDCGDiesel engine
Inverter
Brake chopper
Brake resistor bank

25
Hybrid DEMU
MVDCGDiesel engine
Inverter
DC/DC converter
Energy storage device

26
0 7
0.8
0.5
0.6
0.7
al
0.3
0.4
hybr
id p
oten
tia
0.1
0.2
020
40
60 4050
6070
0
6080
1002030
40
speed limit m/sdistance km

27
0
0.02Gradient profile
50
60Velocity profile
2x 10
5 running diagram
-0.04
-0.02
adie
nt s
lope
30
40
eloc
ity (m
/s)
1
1.5
stan
ce (m
)
0 0 5 1 1 5 2-0.1
-0.08
-0.06gra
0 0 5 1 1 5 20
10
20ve
0 20 40 60 800
0.5
di
0 0.5 1 1.5 2
x 105distance (m)
0 0.5 1 1.5 2
x 105distance (m)
0 20 40 60 80time (m)
1specific traction, resistance and acceleration curve
specific traction1
acceleration3
Traction/Braking Power
Traction
0.6
0.8
ces
(m/s
2 )
specific tractionresistanceacceleration
0
0.5
on (m
/s2 )
1 5
2
2.5
(MW
)
TractionBraking
0.2
0.4
spec
ific
forc
-0.5
0
acce
lera
tio
0.5
1
1.5
pow
er (
0 20 40 600
velocity (m/s)0 0.5 1 1.5 2
x 105
-1
distance (m)0 0.5 1 1.5 2
x 105
0
distance (m)

28
Offi i l R t f UK G tOfficial Report for UK Government
HST hybrid – 8-16% saving (depending on route)DMU saving – up to 26% saving (depending on route)route)
See for full reports http://www.railway.bham.ac.uk/documents/Hybird_concept_final_5.pdfhttp://www.railway.bham.ac.uk/documents/Hybrid Rap y y _il_Report_DMU_V1.pdf

29
Train Control and Scheduling gEnergy Efficiencies
Initially single train trajectory optimisationInitially single train trajectory optimisationIncreasing the opportunity for reuse of regenerative energy by making adjustmentsregenerative energy by making adjustments in the timetableCan be considered at both the timetableCan be considered at both the timetable design stage and dynamicallyIn DC electrification areas, consideration ofIn DC electrification areas, consideration of system receptivity improvements

30
T i T j t S l ti STrain Trajectory Solution SpaceNon-linear system optimisationy pDriver ‘input’ can only be acceleration, coasting or deceleration

31
Single Train SimulationSingle Train Simulation
Input Output– Coasting rate, Kv
– Motoring rate, Kf
– Braking rate, Kbr
– Journey time, Trun
– Energy consumption, E– Train trajectory

32
Assessment of solutionsAssessment of solutionsFuzzy functions provides a non-binary assessment of a particular solutionFuzzy functions can be designed to suit a railway’s KPIs
Energy consumption fuzzy set: Running time fuzzy set:
TrunErun TETE ωμωμμ ⋅+⋅= )()(),(

33
T i T j t O ti i tiTrain Trajectory Optimisation
I O R ki
Solutions feasible space:Case study for:
6km section; ωE=0.5; ωT=0.5
Inputs Outputs Ranking
Kv Kf Kbr E,kWh
Trun, min
μ(E,Trun) Rank
0.86 1 0.85 36.13 6.50 0.8626 1
0.87 0.85 1 36.95 6.50 0.8141 2
0.92 0.75 0.8 36.84 6.57 0.7972 3
0.98 0.75 0.7 37.82 6.53 0.7623 4
0.89 0.85 0.5 35.94 6.73 0.7361 5
1 1 1 42.48 6.03 0.0000 n/a

34
Simulated Train TrajectoriesSimulated Train Trajectories
-> Train trajectory j yfor fastest journey 6 i 26 min 2 sec42.48 kWh
->Train trajectory for energy efficient solution6 min 30 sec36 13 kWh36.13 kWh
34

35
E S i O t itiEnergy Saving Opportunities
System Receptivity ImprovementsSystem Receptivity Improvements– Building on train trajectory optimisation
I i th t it f f– Increasing the opportunity for reuse of regenerative energy by making adjustments in the timetableadjustments in the timetable
– Can be considered at both the timetable design stage and dynamicallydesign stage and dynamically
– For optimum results a number of trains must be considered resulting in a high level g gof data interchange

36
System Receptivity ImprovementsSystem Receptivity Improvements
Simulation between 6.25-Case studies:
1: train trajectories for fastest7.30am
Maximum net energy
1: train trajectories for fastest journey
2: optimised train trajectories with highest rankgy
saving up to 30%highest rank
3: timetable changed for better reuse of regenerative energy
4: train trajectories with 10% journey time increase
Case 1 Case 2 Case 3 Case 4Total energy Consumption (kWh)
405.8 325.1 305.4 283.7
Energy saving 0% 19.9% 24.7% 30.0%Energy saving (kWh) 0 80.7 100.4 122.1 36

37
Hybrid Traction LaboratoryHybrid Traction LaboratoryBattery Cycler
D i l i l iDynamic cycle simulationVoltage: 8 VDC ~ 420 VDCCurrent: -640 ADC ~ +530 ADCPower: 170 kW ~ +125 kWPower: -170 kW ~ +125 kW
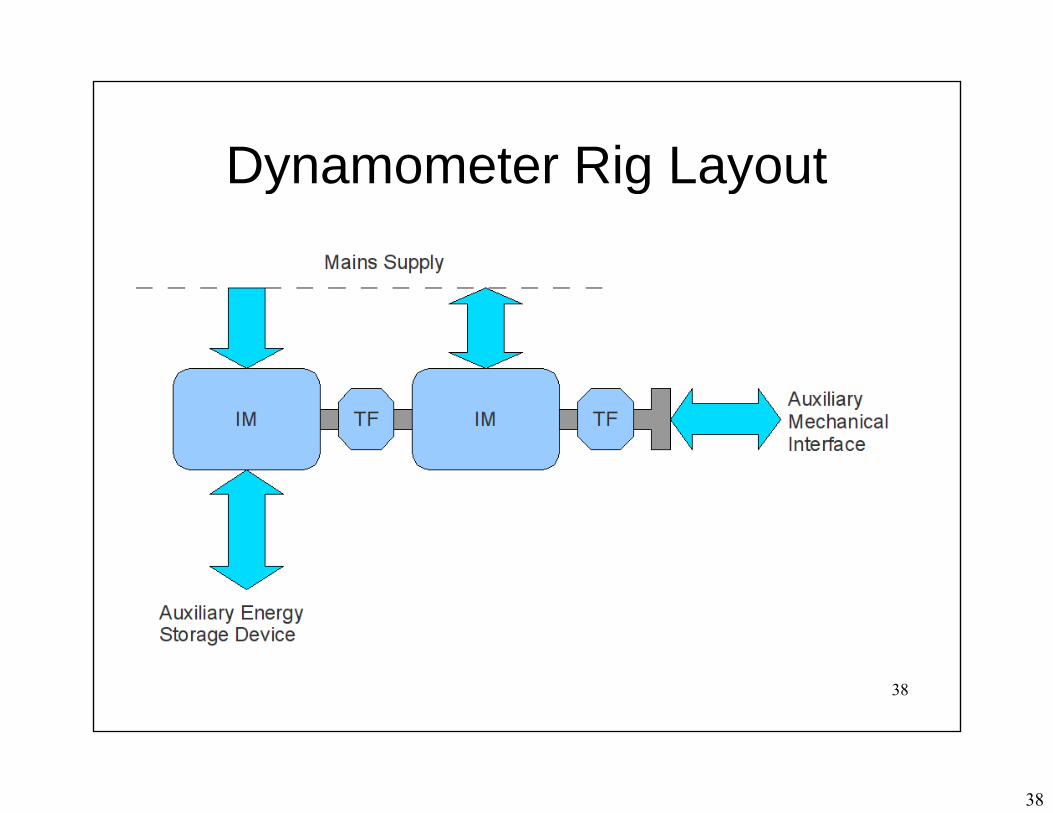
Dynamometer RigDynamic Load SimulationDynamic Load SimulationPower (+/- 110 kW)Torque (<700 Nm)Speed (<3000 rpm)Speed (<3000 rpm)
37
38
Dynamometer Rig LayoutDynamometer Rig Layout
38

39
Current Projects in jSystems Engineering
EC Integrated Railway Data Management (InteGRail)EC – Integrated Railway Data Management (InteGRail)EC – Innovative track technologies (InnoTrack)EC – Safer European Level Crossing Assessments and Technology (SELCAT)Technology (SELCAT)EPSRC (RRUK) – Cost Modelling New Railway Technology (with Leeds and Imperial)Network Rail – Thameslink and CrossRail Train ControlNetwork Rail Thameslink and CrossRail Train ControlNetwork Rail – Railway Capacity MetricsPhD Students – Dynamic Re-scheduling of TrainsPhD Student – Safety Critical Design Processes usingPhD Student Safety Critical Design Processes using Constraint Satisfaction (with TRW Conekt)PhD Student – Benefits of Adopting Systems Integration Approaches in Rail Projectsj

40
Distributed railway traffic controlThe physical railway infrastructure need not be changedchanged
Each junction or station can be an intelligent “agent” in the software environment for real-timeagent in the software environment for real-time train traffic control (making decision individually)
A group of “agents” can work together forA group of agents can work together for collaborative rescheduling (multi-agent)
Coordination mechanisms / rules among agentsCoordination mechanisms / rules among agents must be developed

41
Individual junction optimisationbest train
order through this
best train order
through this
Junction 2
junction?through this
junction?
Junction 1
Different weights for different train types (Express, semi-fast, local …)Different delay minute penalty fees for different train operating companiesLocal delay cost minimisationLocal delay cost minimisation
41

42
Applying the IFC method to a larger networkto a larger network
IFA-12 IFA-23
Junction 3
JCA 1 JCA 2 JCA 3iteration iteration
Junction 1 Junction 2
NS
JCA-1 JCA-2 JCA-3
N
0_ =CostIFA
IFA-21 IFA-32

43
ECML track layout
Hatfield17.75
Welwyn Garden City17.75
Welwyn North22
Knebworth25
Stevenage27.5
Hitchin31.75
Arlesey37
Biggleswade41
flat junction
Langley Cambridge
Woolmer Green
junction
London PeterboroughLetchworth Garden
City34.75
junction26.5 (28)
Cambridgejunction
32
junction23.5
bottleneckWatton-At-Stone
(23.5)
Hertford North(19.5)
Baldock36.75
Ashwell & Morden41
(19.5)
CambridgeCambridge58

44
To build or not to build a flyover?
Bishton flyover: photo by Jamie Squibbs (http://jamie7354.fotopic.net/)
ECML Cambridge junction
N b t k M h i St tt tBishton flyover: photo by Jamie Squibbs (http://jamie7354.fotopic.net/) Neubaustrecke Mannheim-Stuttgart

45
Result analysis
460048005000520054005600
3200340036003800400042004400
Penalty fee
GNER: £192/min.
18002000220024002600280030003200
FCC: £39/min.
600800
10001200140016001800
0200400
1 2 3 4 5 6 7 8 9 10 11 12 13 14 15 16 17 18 19 20 21 22 23 24 25 26 27 28 29 30 31 32 33 34 35 36 37 38 39 40
Results from 40 test scenariosResults from 40 test scenariosRescheduling with optimisation searching & IFC method lead to less delay cost in most cases

46
Comparison of total cost of delay for a representative scenario (No. 40)a representative scenario (No. 40)
Comparison of delay cost (£) with flat junction / flyover 1600
1100
1200
1300
1400
1500
GNER:FCC=3.2:0.65
1389600
700
800
900
1000
Del
ay C
ost (
£)
598.5771
405100
200
300
400
500
A fl t j ti ith b tt j ti t l t t b
0
100
1 2 3 4
A flat junction with a better junction control strategy can bemore economical than a flyover using the FCFS strategy

47
Current Projects in jRemote Condition Monitoring
EC Innovative track technologies (InnoTrack)EC – Innovative track technologies (InnoTrack)EPSRC (RRUK) – Condition monitoring of vehicle/track (with Loughborough and Southampton)Network Rail – Intelligent infrastructureNetwork Rail Intelligent infrastructureNetwork Rail – TI21 track circuit monitoringNetwork Rail – Test and Simulation to Understand Conductor Shoe DynamicsShoe DynamicsNetwork Rail – Intelligent Infrastructure data analysisPhD Student – DC power system monitoringPhD Student - Hybrid qualitative/quantitative monitoringPhD Student Hybrid qualitative/quantitative monitoring algorithmsPhD Student – Fault detection and diagnosis of pneumatic railway assetsy

48
Railway Industry
• Two main subsystems:– InfrastructureInfrastructure
• Signalling, Electricity Supply, Track, Substructure...• Parallels with highways, power and water
– Rolling stock• Traction motors, Bogies, Doors, Air Con...• Parallels with aerospace and automotive
48

49
Infrastructure monitoring infrastructure
• There are a large number of simple, distributed assets used in the railway yindustry which are critical to successful movement of trains (e.g. point machines)( g p )
• There are many different designs, operating in varying environmental conditionsin varying environmental conditions
49

50
Points Monitoring Current Practice
• Acquires both analogue and digital signals• Includes hardware and data anaylsis• Currently requires data signatures to be interpreted by an
expert user on a daily basis in order to pre-empt a failure• Limited success with many false alarms and missed faults• Limited success with many false alarms and missed faults
50

51
PracticalPoint ConditionPoint Condition Monitoringg
• Research at the University has focussed on distributed instrumentation, sensor selection, algorithm development and costdevelopment and cost benefit
• Future work will consider data visualisation and human factors
51

52
P ti l P i t M it iPractical Point Monitoring• Features of theFeatures of the
throw are observed• All instances of the
same type of point machine (asset) will perform differentlyperform differently
• Features relate to an intuitiveintuitive understanding of the operation of the
tasset52

53
Simple fault detection and S p e u de ec o ddiagnosis
• Th h t i ti• The characteristics of a particular feature can be seen to change
• The position, i dconsistency and
magnitude provide diagnosisdiagnosis
• Symptoms will be similar for all assets of the same type
53

54
SignalMagnitudeg
Throw
Sample54

55
More sophisticated fault diagnosis• We are now using a qualitative trend• We are now using a qualitative trend
analysis technique • We have found this works with manyWe have found this works with many
different asset
x
yD=σ
x
Xτ Yτ 55

56
O tp ts from Siemens machineOutputs from Siemens machine 0: no fault1: LH tight lock2: LH loose lock3: RH tight lock3: t g t oc4: RH loose lock5: fulcrum point
Direction: Right to left
56

57
Potter’s Bar (UK)2002May 2002
G i (UK)Grayrigg (UK)February 2007
57

58
Track CircuitsT k i i f f h i l• Track circuits form part of the train control system
• Each railway has many thousand circuits
C hCurrent Path
Insulated
Track Relay
Insulated Rail Joints
Series RegulatingResistor
Track Relay Energized/De-energized Indicating Track Clear/Occupied
Source of Electrical Voltage 58

59
Track Circuit Right Side FailureFailure Failure Mode Failure Rate/Year
Track circuit erroneously h i
IBJ insulation failure 0.0856Receiver failure 0.0635
shows section occupied Ballast low resistance 0.0468
Transmitter failure 0.0419Track tuning unit failure 0 0269Track tuning unit failure 0.0269Bonding failure at rail joint 0.0241Impedance bond failure 0.0241
Loose/broken side leads 0.0197Broken rail 0.00844Power supply unit failure 0.00675Power supply unit failure 0.00675

60
Track Circuit Wrong Side FailureFailure Failure Mode Failure Rate/Year
Track circuit erroneously
Receiver failure 0.00857Relay fails closed circuit 0.00016
shows section clear
yTrain shunt high resistance 0.0000333Interference from adjacent instrumentation
0.0000324instrumentation
Track circuit intermittently shows section
Train shunt high resistance 0.0000333
shows section clear when train moving along the track
Poor contact between train shunt and rails
?
g
60

61
Track circuit conditionTrack circuit condition monitoring• Using a model based approach for condition
monitoring, transmitter, receiver, g, , ,termination bond, track (ballast) and shunt faults can be detected and diagnosed.g
61

62
Track circuit conditionAA
A A
A AAA
A A
A ATrack circuit condition monitoringV
A A
V
A AAA
14
8
10
12
T2TBT2 Failure
4
6
8
ITB
T
TXC Failure
510
1520
2505
1015
202
ITXITBT1
TBT1 Failure
62

63
Vehicles monitoring infrastructure
• Using bogie mounted instrumentation we are able to assess:– Track geometry from in-service vehicles– Third rail positionThird rail position– Switch and crossing health
• The challenge is to move this technology• The challenge is to move this technology off of dedicated trains, for in-service autonomous inspectionautonomous inspection
63

64
Bogie pitch rate gyroscopeg p gy p
Bogie pitch varies along track – measure with pitch rate gyro;observe vertical alignment
Works at lower speeds (1 m/s) than an equivalent accelerometer
Sensor location is unimportantSensor location is unimportant
Shortest measurable wavelength defined by bogie wheelbase and primary suspension resonances (with vehicle speed)primary suspension resonances (with vehicle speed)
64

65
Left and right axlebox-mountedaccelerometers
L ft d i ht il ti l t ti t h tLeft and right rail vertical reconstruction at shorter wavelengths – where pitch rate gyro cannot go
Corrugation; dipped joints; other short wavelength irregularities
65

66
Bogie yaw rate gyroscopeBogie yaw rate gyroscopeBogie yaw varies along track – measure with yaw rate gyro;observe response to lateral alignment
Works at lower speeds (1 m/s) than an equivalent accelerometer
I d d t f b i ll t t l t l l tIndependent of bogie roll – contrast lateral accelerometer
Shortest measurable wavelength defined by bogie wheelbase and i i ( ith hi l d)primary suspension resonances (with vehicle speed)
Bogie kinematic mode response 66

67
Track Monitoring Current Practice
67

68
bdy
by
2wΨ&bΨ&1wΨ&
1wy 2wy
by
sry
0.06
Axleboxsensors0.03
0.04
0.05
-0.01
0
0.01
0.02
9550 9600 9650 9700 9750
-0.03
-0.02
0.01
68

69
In-service infrastructure inspectionMonitor vertical and lateral trajectories at various wavelengths
C i di
e.g. using versines
8 iContinuous gradient
1 m versine – small
8 m versine
Discontinuous gradient e g joints crossings8 m versine – slightly increased
Discontinuous gradient. e.g. joints, crossings.
1 m versine – large69

70
70

71
Vehicles monitoring vehicles
• Fault detection and diagnosis of vehicles is more advanced
• Increasingly sensors are manufactured or retro-fitted into vehiclesretro fitted into vehicles
• Critical subsystems include:T i d– Train doors
– Bogie suspension components C d h– Conductor shoes
71

72
Train door monitoringTrain door monitoring
72

73
Train door monitoringTrain door monitoring
73

74
Train Door Incipient Failures
35
3
4
5
rent
Normal Reduced Lubrication
20
25
30
age
Actual Prediction
1
2
Cur
r
5
10
15Vol
ta
0 0.5 1 1.5 2 2.5 30
Time(s)
Reduced Lubrication Drop in Supply Voltage
0 0.5 1 1.5 2 2.5 30
Time(s)
p pp y g
74

75
V hi l D i C diti M it iVehicle Dynamic Condition Monitoring
Slide 75from Bruni et al 2007

76
Energy monitoring
• The group have been working on power simulation software for over 30 yearsy
• The work is focussing on variation in driver performance and fault detection andperformance and fault detection and diagnosis of the traction drives
• The results of the simulator can be validated• The results of the simulator can be validated using monitoring data
76

77
MerseyRail InstrumentationMerseyRail InstrumentationTrain based:• Traction and auxiliary
voltages and currentsC h ft iti• Cam shaft position
• Driver’s handle position• Position on trackPosition on track• Inertial measurement• TemperaturepSub-station based:• Traction and voltages and
currents77

78
ConclusionConclusion...My research is about a system solution that delivers value (e.g. Energy Savings High dependability)Savings, High dependability)This includes people, processes and tools. This means it’s a businessproblem, not just a computer or electronics problem…
Raw Data Processed Active DynamicAssetData
Data Processedin
IT SystemsKnowledge
Management
yDecision-Support
Capability
Delivering tailoredData gathering,
transmission and storage
Data processingand visualisation
Deriving and automating knowledge
Delivering tailored, dynamic decision-
support information78

79
Contact details:Dr Clive RobertsDr Clive Roberts
<[email protected]>htt // il bh khttp://www.railway.bham.ac.uk
Th t ti i l d th k f thThe presentation includes the work of many others including:Stuart Hillmansen, Yury Bocharnikov, Shaofeng Lu,Stuart Hillmansen, Yury Bocharnikov, Shaofeng Lu,Dan Meegahawatte, Gavin Hull, Joe Silmon, Edd Stewart, Paul Weston