r e s i l i e n t - johannesburg stock exchange - jse · lodestone properties limited. barry daniel...
TRANSCRIPT

R E S I L I E N TProperty Income Fund
2013 INTEGRATED REPORT

w HIGHVELD MALL w 65 785 m2 w MPUMALANGA

R e s i l i e n t P R o P e R t y i n c o m e F u n d INTEGRATED REPORT 2013 1
CONTENTS
2 Chairman’s statement
4 Board of directors
10 Scope of the integrated report
12 Strategy
14 Directors’ report
20 Remuneration report
22 Unit performance
23 Analysis of linked unitholders
24 Risk management and key risk factors
26 Corporate governance review
32 Sustainability reporting
38 Five year review
39 Portfolio statistics
42 Directors’ responsibility for the annual
financial statements
42 Declaration by company secretary
43 Independent auditors’ report
44 Statements of financial position
45 Statements of comprehensive income
46 Reconciliation of profit for the period to headline
earnings and distributable income
47 Statements of changes in equity
48 Statements of cash flows
49 Notes to the annual financial statements
80 Schedule of properties
84 Administrative information
85 Corporate diary
86 Notice of annual general meeting of
shareholders and debenture holders
91 Form of proxy
92 Notes to the form of proxy
93 Fact sheet

R e s i l i e n t P R o P e R t y i n c o m e F u n d INTEGRATED REPORT 2013 2
ChairmaN’S STaTEmENT
w HIGHVELD MALL w 65 785 m2 w MPUMALANGA

R e s i l i e n t P R o P e R t y i n c o m e F u n d INTEGRATED REPORT 2013 3
REsIlIENT PROPERTy INcOmE fuND (“REsIlIENT”)
WITh REsIlIENT chANGING ITs fINANcIAl yEAR- END TO JuNE, IT Is ONly sIx mONThs sINcE my lAsT chAIRmAN’s sTATEmENT. fROm A mAcRO-EcONOmIc PERsPEcTIvE, hOWEvER, ThE sOuTh AfRIcAN lANDscAPE hAs chANGED cONsIDERAbly.
the major driver for the change has been the rise in us treasuries, which in turn
has impacted on interest rates throughout the world. emerging market currencies
and bonds have been sold down and listed property prices, often a proxy for bonds,
have been negatively affected. this also resulted in increased cost of hedging interest
rate risk.
Resilient is in the fortunate position of being conservatively geared and hedged.
this together with Resilient’s long lease and corporate tenant profile will continue to
insulate Resilient from the changing local economic environment.
Both Resilient and the Resilient education trust accelerated their financial
contribution to their initiatives which focus on the development of education for
previously disadvantaged groups. the various initiatives undertaken are covered in
the sustainability report on page 32. in addition to the financial contribution, such
initiatives involve considerable time and effort by management and reflect a genuine
commitment to improving the prospects for our future generations.
marthin Greyling, Barry van Wyk and myself have served on the Resilient board since
2002. our independence has been evaluated by the board and all three of us will again
stand for re-election at the annual general meeting (“AGm”).
my thanks go to fellow directors for their time and commitment to the continued
success of Resilient. thanks also to management for their passion and hard work in
achieving these outstanding results.
JJ Njeke
Independent non-executive chairman
6 August 2013

R e s i l i e n t P R o P e R t y i n c o m e F u n d INTEGRATED REPORT 2013 4
BOard Of dirECTOrS
dESmONd (dES) dE BEEr (52)
Managing director and chief executive
officer
BProc MAPDate of appointment: July 2002
des spent the first part of his career
in the banking industry, first with
Barclays Bank in south Africa and
later with syfrets that was merged
into nedcor investment Bank (“niB”).
He was appointed General manager
corporate equity and served on the
bank’s executive committee. He has
served on the boards of a number of
listed property companies and he is
currently a director of new europe
Property investments plc (“nepi”) and
chairs its investment committee.
mfuNdiSO JOhNSON NTaBaNkulu (JJ) NJEkE (54)Independent non-executive chairman
BCompt (Hons), HDip Tax, CA(SA)Date of appointment: November 2002
JJ was an audit partner at Pwc
and is the past chairman of the
south African institute of chartered
Accountants (“sAicA”). in addition to
serving on the board of Resilient, he
serves on the boards of mmi Holdings
limited, mtn Group limited, sasol
limited and Adcorp Holdings limited.
INDEPENDENT NON-ExEcuTIvEJJ Njeke (chairman), Marthin Greyling, Bryan Hopkins, Spiro Noussis, Umsha Reddy, Barry van Wyk
NON-INDEPENDENT NON-ExEcuTIvEThembi Chagonda
ExEcuTIvEDes de Beer, Andries de Lange, Nick Hanekom, Johann Kriek

R e s i l i e n t P R o P e R t y i n c o m e F u n d INTEGRATED REPORT 2013 5
aNdriES dE laNgE (40)
Executive director and chief operating
officer
CA(SA), CFADate of appointment: November 2006
After completing his articles, Andries
joined the industrial development
corporation of south Africa limited
(“idc”) and then nedbank limited
where he gained experience in
debt finance, debt and equity
restructurings and private equity.
He joined the Resilient group in
2004 and is a director of Rockcastle
Global Real estate company limited
(“Rockcastle”) and Property Fund
managers limited (“PFm”), the
manager of capital Property Fund
(“capital”).
ThEmBakazi (ThEmBi) iriS ChagONda (42)Non-independent non-executive
director
BSoc Sci (Rhodes University), Diploma in Labour LawDate of appointment: August 2008
thembi’s career has been in human
capital management for the last
17 years. she is currently managing
director of Global Business solutions,
a labour law, Bee consultancy and
training and development company.
marThiN PETruS grEyliNg (46)
Independent non-executive director
BCom (Acc) (Hons), CA(SA)Date of appointment: July 2002
marthin started his career in financial
services in 1993 when he joined the
idc. during his tenure he was, inter
alia, involved in debt and project
finance and business turnarounds.
He joined niB in 2001 and is currently
a Principal in the nedbank capital
Private equity team.

R e s i l i e n t P R o P e R t y i n c o m e F u n d INTEGRATED REPORT 2013 6
BOard Of dirECTOrS (CONTiNuEd)
BryaN dOuglaS hOPkiNS (66)
Independent non-executive director
BCom (Hons) Accounting and Tax, CA(SA)Date of appointment: May 2011
Bryan is a non-executive director
of Holdsport limited, makalani
Holdings limited and Kagiso Asset
management Proprietary limited.
He was a professor of Accounting
at the university of cape town
and served on the Accounting
standards committee of the sAicA
and co-authored with professor
GK everingham Generally Accepted
Accounting Practice – A South
African Viewpoint.
NiCOlaaS (NiCk) WillEm haNEkOm (34)Financial director
BAcc (Hons), CA(SA)Date of appointment: May 2011
nick completed his articles with
Pwc in Johannesburg where after he
joined Pwc london. on his return to
south Africa in August 2005 he was
employed by Resilient as company
secretary.
JaCOBuS JOhaNN kriEk (48)
Executive director
Stanford Executive ProgrammeDate of appointment: June 2004
Johann has been involved in retail
property management, development
and letting for 28 years with a
strong emphasis on development
and redeveloping underperforming
shopping centres.

R e s i l i e n t P R o P e R t y i n c o m e F u n d INTEGRATED REPORT 2013 7
umSha rEddy (43)
Independent non-executive director
BSc Eng (Electrical)Date of appointment: March 2012
umsha’s 20 years of work experience
spans both the engineering and
it environments across energy,
telecommunications, manufacturing,
retail, government and financial
industries. Her longest tenures
were with HP and microsoft, five
years and eight years respectively.
she is currently employed at sABmiller
as executive head of programme
management and solution delivery
for the Business information systems
division.
SPirO NOuSSiS (42)
Independent non-executive director
BCom, BAcc, CA(SA)Date of appointment: August 2012
spiro has experience in private equity
and investment management. He
was previously managing director of
an information technology company
providing business solutions for the
financial services industry. since 2005
he has been involved in property,
focusing on commercial, industrial
and retail opportunities and is
currently an executive director of
lodestone Properties limited.
Barry daNiEl vaN Wyk (47)Independent non-executive director
BCom, BAcc, CA(SA)Date of appointment: November 2002
Barry heads up Renlia developments
Proprietary limited, a property
investment and development
company primarily focused on
office, industrial and residential
opportunities. He was previously
an executive director of Group Five
limited and managing director of
Group Five developments.

R e s i l i e n t P R o P e R t y i n c o m e F u n d INTEGRATED REPORT 2013 8
BOard Of dirECTOrS (CONTiNuEd)
aTTENdaNCE aT BOard aNd SuB-COmmiTTEE mEETiNgS
Director boardInvestmentcommittee
Auditcommittee
Riskcommittee
Nominationcommittee
Remunerationcommittee
socialand ethicscommittee
JJ njeke (chairman of the board and
nomination committee) 3/3 2/2
thembi chagonda (chairperson of the
remuneration committee) 3/3 2/2 2/2 1/1
Jorge da costa (1) 1/2
des de Beer (2) 3/3 1/1 1/1 0/0
Andries de lange 3/3
marthin Greyling (3) 3/3 2/2 2/2 1/1
nick Hanekom 3/3
Bryan Hopkins (4) (chairman of the audit
committee) 3/3 2/2 2/2 2/2 1/1
Johann Kriek 3/3
david lewis (5) 2/2
Phumelele msweli (6) 2/2
spiro noussis (7) 3/3 1/1 1/1
umsha Reddy (8) (chairperson of the risk
and social and ethics committees) 2/3 1/1 2/2 1/1
Barry van Wyk (chairman of the investment
committee) 3/3 1/1 2/2 1/1
(1) Jorge da costa retired as a member of the investment committee, risk committee, remuneration committee and social and ethics committee on
6 February 2013 and from the board on 26 April 2013.(2) des de Beer was appointed as a member of the social and ethics committee on 20 may 2013.(3) marthin Greyling retired as a member of the remuneration committee on 6 February 2013 and from the nomination committee on 20 may 2013. (4) Bryan Hopkins retired as a member of the social and ethics committee on 20 may 2013.(5) david lewis retired from the board on 26 April 2013.(6) Phumelele msweli retired from the investment committee and risk committee on 6 February 2013 and from the board on 26 April 2013.(7) spiro noussis was appointed as a member of the risk committee on 6 February 2013.(8) umsha Reddy was appointed chairperson of the risk committee on 6 February 2013 and of the social and ethics committee on 20 may 2013.

R e s i l i e n t P R o P e R t y i n c o m e F u n d INTEGRATED REPORT 2013 9
BENEfiCial uNiThOldiNg Of dirECTOrS aNd OffiCErS
At 30 June 2013Direct
holdingIndirectholding
Totalunits held
Percentage of issued
units
thembi chagonda – 225 135 225 135 0,1%des de Beer 3 256 000 19 744 000 23 000 000 7,9%Andries de lange 639 183 3 139 358 3 778 541 1,3%nick Hanekom 600 000 1 105 000 1 705 000 0,6%Bryan Hopkins – 45 059 45 059 –Johann Kriek 1 890 000 962 196 2 852 196 1,0%JJ njeke 30 500 – 30 500 –Rajeshree sookdeyu 61 000 – 61 000 –
6 476 683 25 220 748 31 697 431 10,9%
At 31 December 2012
Direct holding
Indirectholding
Total unitsheld
Percentage of issued
units
thembi chagonda – 225 135 225 135 0,1%
Jorge da costa – 81 463 81 463 –
des de Beer 3 256 000 18 305 570 21 561 570 7,5%
Andries de lange 639 183 2 689 358 3 328 541 1,2%
nick Hanekom 600 000 905 000 1 505 000 0,5%
Bryan Hopkins – 45 059 45 059 –
Johann Kriek 1 890 000 812 196 2 702 196 0,9%
david lewis 1 370 822 2 663 025 4 033 847 1,4%
Phumelele msweli – 270 270 270 270 0,1%
JJ njeke 30 500 – 30 500 –
Rajeshree sookdeyu 36 000 – 36 000 –
7 822 505 25 997 076 33 819 581 11,7%
the unitholding of directors and officers has not changed between the end of the financial year and one month prior to the date of the notice of the AGm.
R e s i l i e n t P R o P e R t y i n c o m e F u n d INTEGRATED REPORT 2013 10
SCOPE Of ThE iNTEgraTEd rEPOrT
Resilient is pleased to present its third integrated report to
stakeholders in accordance with the King Report on Governance
for south Africa (“King iii”). Resilient’s integrated report aims to
provide stakeholders with an understanding of the group’s strategic
objectives, challenges to which Resilient is exposed as well as the
group’s governance framework.
the information included in the integrated report has been provided
in accordance with international Financial Reporting standards
(“iFRs”), the south African companies Act, 2008 (“companies Act”),
the Jse listings Requirements, King iii, the guidance provided in the
integrated Reporting committee of south Africa’s Framework for
integrated Reporting and the integrated Report discussion Paper
(Framework) released on 25 January 2011.
this integrated report covers the financial and non-financial
performance of operating subsidiaries over whose operating policies
and practices Resilient exercises control or significant influence,
as indicated in note 10 on page 60. Resilient’s operations are currently
in south Africa.
in determining what disclosure should be made in the integrated
report, the board considered what stakeholders would consider
material. the sustainability reporting guidelines issued by the Global
Reporting initiative define materiality as “information in a report
that should cover topics and indicators that reflect the organisation’s
significant economic, environmental and social impacts or that
would substantively influence the assessments and decisions of
stakeholders.” the board has applied this definition in determining
the contents of this integrated report.

R e s i l i e n t P R o P e R t y i n c o m e F u n d INTEGRATED REPORT 2013 11
STakEhOldErPrOfilE
• employees
• co-owners
ORGANISATIONAL STAkEHOLDERS
• communities
• Government
• local authorities
• Regulatory bodies
• industry organisations
SOCIETAL STAkEHOLDERS
• tenants
• suppliers
• Property managers
• Financiers
• investors
ECONOMIC STAkEHOLDERS
w HIGHVELD MALL w 65 785 m2 w MPUMALANGA

R e s i l i e n t P R o P e R t y i n c o m e F u n d INTEGRATED REPORT 2013 12
STraTEgy
Our uNiThOldErSWe strive to deliver both capital and distribution growth to our
unitholders.
Our TENaNTSResilient’s management team fosters long-term relationships with
the major national retailers and other smaller tenants, recognising
that there is an important symbiotic relationship between their
success and ours.
Our ShOPPiNg CENTrESWe oversee the effective management of our shopping centres
through our managing agents ensuring, through our experienced
and dedicated asset managers, that the centres are well maintained
and that tenant issues are handled quickly and professionally. We are
constantly assessing opportunities for upgrades, refurbishments and
redevelopments of our centres.
Our iNvESTmENTSour management team is constantly investigating potential
investments that will provide sustainable, long-term growth
that exceeds industry norms, whether in the form of a potential
development, purchase of an existing property or through investment
in listed property stocks.
iNTErNaTiONal divErSifiCaTiON Of Our POrTfOliOthe board approved the investment of R600 million in nigeria via
the Resilient Africa structure. Resilient has a substantial investment
in nepi of R1 422 million and an investment of R817 million in
Rockcastle (see note 4 on page 58) both of which provide exposure to
different segments of offshore markets. the intention is to diversify
the geographic spread of the portfolio and to invest in markets with
high growth expectations.
fuNdiNg Our BuSiNESSWe manage our financing costs and concentration risk by utilising
a diversity of funding sources and through hedging our exposure to
interest rate risk.
Our BuSiNESS ParTNErSWe enter into developments with reputable partners with whom we
share values and goals.

R e s i l i e n t P R o P e R t y i n c o m e F u n d INTEGRATED REPORT 2013 13
w HIGHVELD MALL w 65 785 m2 w MPUMALANGA

R e s i l i e n t P R o P e R t y i n c o m e F u n d INTEGRATED REPORT 2013 14
dirECTOrS’ rEPOrT
1 uNiT STruCTurEResilient’s capital structure comprises linked units. each linked unit consists of one ordinary share that is indivisibly linked to one subordinated variable
rate debenture.
2 NaTurE Of ThE BuSiNESSResilient is an internally asset managed property company listed on the Jse limited. its strategy is to invest in dominant regional retail centres with a
minimum of three anchor tenants and let predominantly to national retailers.
3 diSTriBuTaBlE EarNiNgS aNd COmmENTary ON rESulTSResilient declared a distribution of 136,23 cents per linked unit for the six months ended June 2013. this represents an increase of 12,83% over the
120,74 cents per linked unit distributed for the comparable prior period. notwithstanding indirect exposure to platinum mining in the north West,
Resilient’s property portfolio performed ahead of budget. Resilient benefited from the strong performance of its listed holdings, particularly the offshore
holdings where dividends benefited from the decline of the Rand exchange rate.
the comparable retail sales for the period January to June grew by 8,5% in Resilient’s retail centres. this figure compares favourably with the growth in
national retail sales and Resilient’s in-force rental escalations of 7,3%. A portion of this differential will be received through turnover rentals, however,
there is further potential for upward rental reversions on expiry of leases.
the following table indicates the January to June growth in retail sales achieved by Resilient per province, but excludes the parcel of properties sold to
Fortress income Fund limited (“Fortress”):
eastern cape (2,1%)
mpumalanga 7,9%
KwaZulu-natal 8,2%
limpopo 8,7%
Gauteng 8,9%
northern cape 10,1%
north West 12,1%
the negative growth in the eastern cape was the result of the redevelopment and extension of circus triangle mthatha. Highveld mall’s retail sales
were adjusted to exclude tenants occupying the new extensions. in limpopo Province, mall of the north performed strongly, however, turnover growth
at limpopo mall and tzaneng mall was negatively impacted. northam Plaza’s growth was affected by the depressed conditions of platinum mining.
in north West province, turnover growth of 17% was achieved at Brits mall which compensated for limited growth at Pick n Pay Hypermarket Klerksdorp.
in Gauteng, turnover at the Grove grew by 12,2% and this should accelerate once the entertainment extension is open.
4 rEal ESTaTE iNvESTmENT TruST (“rEiT”) STaTuS on 10 may 2013 Resilient announced that it was changing its financial year-end from 31 december to 30 June to facilitate its application of Reit status.
Resilient’s application for Reit status was approved by the Jse limited with effect from 1 July 2013.
the major advantage of Reit status is tax certainty regarding the flow-through of pre-tax income to investors. Also important is the relief from capital
gains tax on the disposal of investment property and investments. Resilient has, however, provided deferred tax at the income tax rate on the recoupment
of capital allowances claimed on investment property as well as the fair value adjustments on the investments in capital, nepi and Rockcastle. the current
enacted legislation does not exempt profits on these investments from capital gains tax. it is anticipated that the remaining deferred tax provision will be
reversed when the proposed taxation laws Amendment Bill is finalised and enacted.
5 PrOPErTy dEvElOPmENTS
Secunda MallResilient has a 40% interest in this development and sasol Pension Fund and local consortiums own 40% and 20% respectively. the 56 800 m2 GlA mall is
scheduled to open in october 2013 and is projected to achieve a yield of 9% on the cost of R276 million for Resilient’s portion. the mall will be anchored
by checkers Hypermarket, edgars, Game, Pick n Pay and Woolworths and will include all major national clothing retailers.
Soshanguve Crossingthis 34 000 m2 GlA mall will be anchored by Game, edgars, shoprite and spar. Resilient has a 55% interest in this development which is budgeted to
achieve a yield of 8% on Resilient’s cost of R253 million. the mall is scheduled to open in April 2014.
Tubatse Crossingthe first and second phases of tubatse crossing in Burgersfort opened within budget on 23 may 2013 and 25 July 2013 respectively. the mall is anchored
by edgars, Game, Pick n Pay and shoprite and includes all major national retailers. A further phase to accommodate building supplies and motor related
retailers is being considered.
Resilient sold a 10% interest in the property at cost to a BBBee consortium which includes Falcon Forest (Resilient’s partner in Highveld mall and
soshanguve crossing) as well as youth, women and business groupings from tubatse and surrounding areas.

R e s i l i e n t P R o P e R t y i n c o m e F u n d INTEGRATED REPORT 2013 15
w HIGHVELD MALL w 65 785 m2 w MPUMALANGA
6 PrOPErTy EXTENSiONSCircus Triangle Mthathathe first of three planned phases for the extension and redevelopment of the mall opened in may 2013. this 5 333 m2 GlA extension is let to Ackermans,
Jet mart, mr Price and other national retailers. the second phase which will accommodate edgars and will provide for the expansion of Foschini, shoprite,
truworths and Woolworths, is currently in progress and will be completed by october 2014. the board approved a third phase to accommodate Game.
subject to local authority approval, construction will commence in september 2013 with completion 10 months later. the three phases are projected to
achieve an 8% return on a total cost of R250 million.
The Grovethe 11 600 m2 GlA extension to the Grove to accommodate ster Kinekor (eight screens), an ice rink and a family entertainment centre is currently in
progress. this extension which is scheduled to open at the end of november 2013 will achieve a yield of 6% prior to potential benefits from increased
footfall and resulting higher trading densities.
Highveld Mallthe extension to increase the size of edgars and truworths opened in July 2013 at an initial yield of 9%. the Woolworths store is currently being extended
by 1 055 m2 at a yield of 9% and a cost of R9 million for Resilient’s 60% interest.

R e s i l i e n t P R o P e R t y i n c o m e F u n d INTEGRATED REPORT 2013 16
dirECTOrS’ rEPOrT (CONTiNuEd)
Jabulani MallAn extension of 2 350 m2 GlA to accommodate Food lovers market and shoprite liquor will open in november 2013. this extension is projected to yield
11% on the cost of R12 million for Resilient’s 55% interest.
Northam Plazathe 8 100 m2 GlA extension to northam Plaza to accommodate Game is on schedule for completion in october 2013. this extension is projected to achieve
a yield of 8% on the cost of R103 million.
Village Mall kathuthis mall is being extended by 7 300 m2 GlA to accommodate Game and additional clothing retailers. Resilient was successful in obtaining an additional
2 mVA of electricity from the local authority. the extension is scheduled to open in september 2013 and is projected to yield 8% on the cost of
R110 million.
Rivonia Villagethe 2 200 m2 GlA extension to accommodate checkers is on schedule to open in november 2013. excluding the income from an additional 64 parking
bays, the projected yield is 7% on the cost of R65 million.
7 PrOPErTy diSPOSalS
Resilient sold the following properties to Fortress with effect from 1 July 2013:
Property name sales price (R)
nelspruit Plaza 312 500 000 Rustenburg Plaza 260 000 000 new Redruth Village 151 000 000 central Park Bloemfontein 163 000 000 sterkspruit Plaza including land (82% interest) 105 544 287 tzaneen lifestyle centre including land (25% interest) 49 946 406
1 041 990 693
Fortress will also acquire the loan advanced to Resilient’s partner in sterkspruit Plaza totalling R20 595 291.
the total purchase price of R1 062 585 984 will be settled 50% in cash and 50% in Fortress A and Fortress
B units issued at R13,80 and R7,06 (ex distribution) respectively. the sale of these properties is in line with
Resilient’s strategy of owning dominant retail centres with a minimum of three anchor tenants.
8 rESiliENT afriCa
the board has committed R600 million to this initiative with standard Bank and shoprite checkers
as partners.
construction of a closed mall with an initial GlA of 12 819 m2 and anchored by shoprite has commenced
in Warri, delta state (nigeria). memoranda of understanding have been concluded for the acquisition of
four further sites in nigeria.

R e s i l i e n t P R o P e R t y i n c o m e F u n d INTEGRATED REPORT 2013 17
w HIGHVELD MALL w 65 785 m2 w MPUMALANGA
9 iNvESTmENTS
Jun 2013 Dec 2012
Investment
Number of units/
shares
carrying value
R’000
Number of units/
shares
Carrying valueR’000
capital (cPl) 153 850 000 1 636 964 181 300 000 1 916 341
Fortress B (FFB) 63 000 000 535 500 63 000 000 441 000
nepi (neP) 21 220 000 1 421 527 21 517 635 1 140 434
Rockcastle (Roc) 60 775 000 817 423 22 000 000 222 200
4 411 414 3 719 975
Resilient sold the management company of its etF business, Proptrax, to Grindrod Bank limited for R4 million. Resilient is no longer involved in the
management of the business but will retain a 50% economic interest. the sale is subject to suspensive conditions.
As announced by way of sens published on 5 April 2013, the board has in principle agreed to the disposal of capital’s manager, PFm, to capital. the board
of PFm considers it optimal to implement the conversion of capital to a corporate Reit simultaneously with the internalisation of PFm. this transaction
is subject to various regulatory and unitholder approvals. the timing of this process is currently uncertain and unitholders will be kept updated by sens
announcements.

R e s i l i e n t P R o P e R t y i n c o m e F u n d INTEGRATED REPORT 2013 18
dirECTOrS’ rEPOrT (CONTiNuEd)
10 vaCaNCiESVacancies increased from 1,7% at december 2012 to 1,8% at June 2013. the largest vacancy was at tubatse crossing which was 6,6% vacant at June 2013.
this has since reduced to 3,3%. Rivonia Village was 9,8% vacant. of this vacancy, 60% relates to offices which are proving difficult to let. the remainder
is retail space which was created for the redevelopment to accommodate checkers.
11 BOrrOWiNgS
Resilient renewed the R785 million facility from standard Bank for a further five years. in addition Resilient raised R190 million through its unsecured
dmtn programme for a period of five years. the intention is to finance 50% of Resilient’s borrowings on an unsecured basis.
12 faCiliTiES aNd iNTErEST raTE dErivaTivES
facility expiry R’million
Averagemargin
over Jibar
Jun 2014 995 0,63%
Jun 2015 350 1,55%
Jun 2016 275 1,29%
Jun 2017 1 776 1,69%
Jun 2018 1 284 1,64%
Jun 2019 1 312 1,62%
Jun 2020 253 1,60%
6 245 1,46%
Interest rate swaps expiry R’millionAverage
swap rate
Jun 2014 300 6,35%
Jun 2015 550 7,17%
Jun 2016 450 7,73%
Jun 2017 700 7,67%
Jun 2018 600 7,52%
Jun 2019 700 7,34%
Jun 2020 780 6,22%
Jun 2021 120 6,53%
4 200 7,14%
Interest rate caps expiry R’millionAverage cap rate
Jun 2018 400 5,90%
the all-in weighted average cost of funding of Resilient was 8,24% at 30 June 2013.
variable rate instruments R’000
loans to Bee partners (448 765)
loans to development partners (214 927)
cash and cash equivalents (1 597)
interest-bearing borrowings 4 791 706
capital commitments contracted for 637 800
4 764 217
total interest rate derivatives 4 600 000
% hedged 96,6%

R e s i l i e n t P R o P e R t y i n c o m e F u n d INTEGRATED REPORT 2013 19
13 Summary Of fiNaNCial PErfOrmaNCEJun 2013 Dec 2012 Jun 2012 Dec 2011
# # #
distribution per linked unit (cents) 136,23 134,93 120,74 121,35units in issue 289 544 070 285 744 070 280 536 070 280 536 070Property operations net asset value* R41,75 R34,51 R30,55 R29,32 Gearing ratio** 26,50% 26,60% 28,30% 28,80%units in issue 289 544 070 285 744 070 280 536 070 280 536 070consolidated net asset value* R41,75 R33,92 R30,13 R29,17 Gearing ratio** 26,50% 27,90% 29,90% 30,50%units in issue 289 544 070 274 933 259 269 725 259 269 725 259
* Net asset value includes total equity attributable to equity holders and linked debentures. June 2013 includes the effect of the reversal of deferred tax as a result
of REIT status.
**The gearing ratio is calculated by dividing the total interest-bearing borrowings by the total assets.
# To comply with financial reporting requirements the group will account for entities that do not form part of its operations, do not operate under its operating policies
and whose businesses, risk profiles and debt levels are not comparable with its own. Disclosure under “Property operations” excludes Eagle’s Eye Investments
Proprietary Limited (“BEE SPV”).
On 27 June 2006 10 810 811 linked units were issued to BEE SPV and Resilient is standing surety for the funding obligations of BEE SPV in acquiring these units.
In terms of IFRS the issue did not take place and the essence of the transaction was that the BEE shareholders received a right/option to acquire linked units in
Resilient at a future date at a predetermined price. As a consequence, the issue of linked units has been eliminated in the preparation of the financial statements.
This BEE transaction matures in three equal tranches on 30 June 2014, 30 June 2015 and 30 June 2016. Due to the positive equity in this scheme and the minimal
residual risk resulting from Resilient’s surety, the board has taken the view that the units are in issue and has therefore reversed the effect of the option/right in the
2013 financial statements and deconsolidated BEE SPV.
14 NET rENTal aNd rElaTEd rEvENuEnet rental and related revenue consists of:
for the six months
ended Jun 2013
R’000
For the year
ended Dec 2012
R’000
Basic contractual income 458 642 838 142 straight-lining of rental revenue adjustment 11 387 51 115 turnover rental 2 259 22 052 net recovery – electricity 9 617 14 946 Recovery – other 15 598 27 671 net refuse, rates, water and sewerage charges (12 326) (21 108)Repairs and maintenance, cleaning and security costs (37 447) (61 025)Property management fee (11 156) (20 987)marketing (3 836) (8 436)staff costs (7 488) (13 273)insurance (1 945) (3 724)letting commission (998) (1 289)tenant installation costs (5 006) (8 233)tenant arrears written off (1 578) (2 477)other expenses (9 103) (19 597)
406 620 793 777
15 PrOSPECTSdistributions are forecast to increase by between 12% and 16% for the 2014 financial year. the forecast assumes exchange rates of R12,00 and R9,00 to
the euro and us dollar respectively. the growth is further based on the assumptions that a stable macro-economic environment will prevail, no major
corporate failures will occur and that tenants will be able to absorb the recovery of rising utility costs. Budgeted rental income was based on contractual
escalations and market related renewals. this forecast has not been audited or reviewed by Resilient’s auditors.

R e s i l i e n t P R o P e R t y i n c o m e F u n d INTEGRATED REPORT 2013 20
rEmuNEraTiON rEPOrT
the remuneration committee determines the remuneration policy of Resilient and is mandated by the board to set the remuneration and incentivisation
of all employees, including executive directors. in addition, the remuneration committee recommends directors’ fees payable to non-executive directors
and members of board sub-committees for unitholder approval at the AGm. the remuneration committee members are thembi chagonda, Bryan Hopkins
and umsha Reddy. Attendance of directors at the various board and sub-committee meetings is disclosed on page 8.
the remuneration policy is aligned with the strategic objectives of the company to create long-term, sustainable value for stakeholders. Remuneration is
a combination of salary, short-term incentivisation and long-term incentivisation in order to attract and retain motivated, high-calibre executives whose
interests are aligned with the interests of unitholders. King iii stipulates that the yearly remuneration policy should be put to a non-binding advisory vote.
the remuneration policy has not been presented to the unitholders for a non-binding vote as the policy itself, although reviewed annually, has remained
substantially the same over the past few years.
executive salaries are competitive relative to the market and increases are determined with reference to individual performance, inflation and market-
related factors on a total cost-to-company basis. Annual increases are effective 1 January each year. executive directors do not receive directors’ or sub-
committee fees. there is no retirement fund for employees or executive directors.
Bonuses based on individual and group performance are an effective means of short-term incentivisation. these are awarded based on the performance
of the individual and the group taking into account market conditions.
the long-term incentivisation aligns to the company’s strategic objective of promoting sustainable growth in distribution. long-term incentivisation is
achieved through the allocation of units to employees through the Resilient unit Purchase trust. the remuneration committee decides on the number
of units to be allocated based on individual performance. Resilient Property income Fund issues units to the Resilient unit Purchase trust. on acceptance
of the units by the individual, the Resilient unit Purchase trust provides loan financing to acquire the units.
due to the management contract between Resilient and PFm, the management company of capital, Resilient employees are responsible for managing capital.
rEmuNEraTiON Of NON-EXECuTivE dirECTOrSnon-executive directors’ remuneration consists of an annual fee plus sub-committee membership fees. the non-executive directors’ remuneration
is approved by unitholders at the AGm.for services as a director
(paid by the company)Jun 2013
(6 months)R’000
For services as a director(paid by the company)
Dec 2012(12 months)
R’000
JJ njeke (chairman of the board and the nomination committee)& 173 273
thembi chagonda (chairperson of the remuneration committee)&@* 193 273
Jorge da costa (1) 98 436
marthin Greyling (2)$* 191 354
Bryan Hopkins (chairman of the audit committee) (3)$&@ 230 305
Phumelele msweli (4) 85 354
spiro noussis (5) # 181 109
umsha Reddy (chairperson of the risk and social and ethics committees) (6) @* 213 222
Rory turner (7) – 102
Barry van Wyk (chairman of the investment committee)$#^ 233 436
1 597 2 864
(1) Jorge da costa retired as a member of the investment committee, risk committee, remuneration committee and social and ethics committee on
6 February 2013 and from the board on 26 April 2013.
(2) marthin Greyling retired as a member of the remuneration committee on 6 February 2013 and from the nomination committee on 20 may 2013.
(3) Bryan Hopkins retired as a member of the social and ethics committee on 20 may 2013.
(4) Phumelele msweli retired from the investment committee and risk committee on 6 February 2013 and from the board on 26 April 2013.
(5) spiro noussis was appointed as a member of the risk committee on 6 February 2013.
(6) umsha Reddy was appointed chairperson of the risk committee on 6 February 2013 and of the social and ethics committee on 20 may 2013.
(7) Rory turner retired from the board on 16 may 2012.
$Member of the audit committee.
Member of the risk committee. #Member of the investment committee.@Member of the remuneration committee. &Member of the nomination committee. *Member of the social and ethics committee.
R e s i l i e n t P R o P e R t y i n c o m e F u n d INTEGRATED REPORT 2013 21
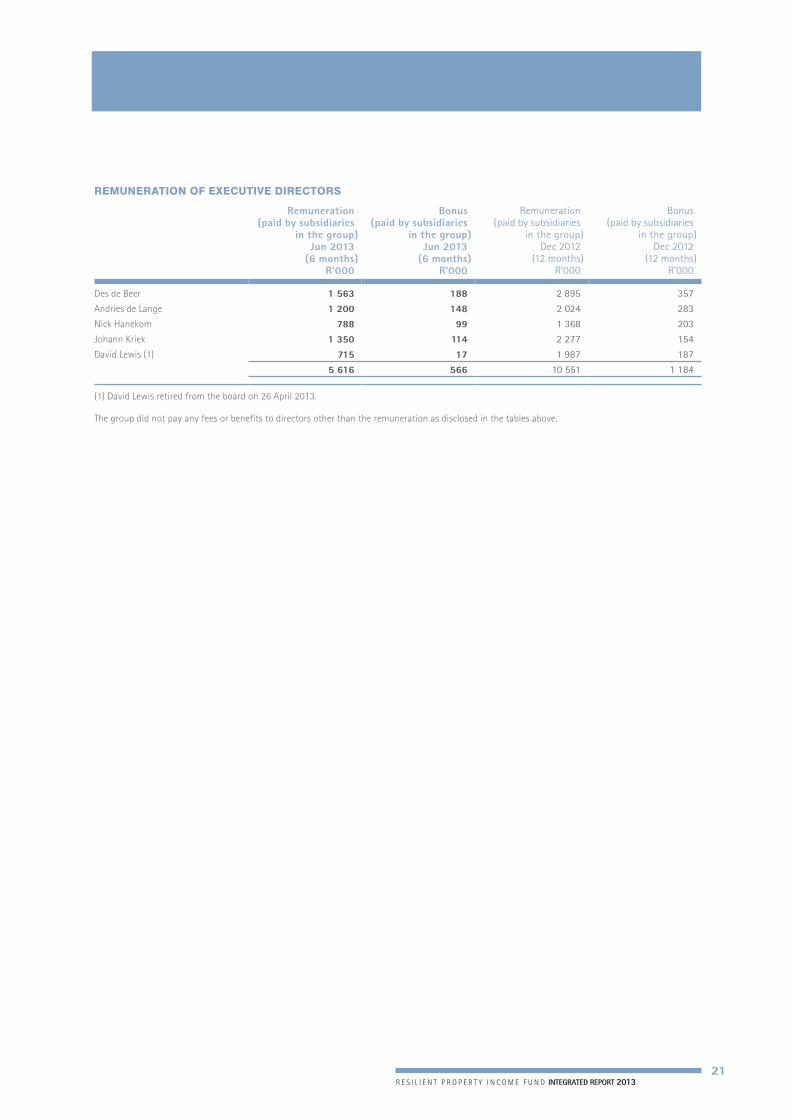
rEmuNEraTiON Of EXECuTivE dirECTOrS
Remuneration(paid by subsidiaries
in the group)Jun 2013
(6 months)R’000
bonus(paid by subsidiaries
in the group)Jun 2013
(6 months)R’000
Remuneration(paid by subsidiaries
in the group)Dec 2012
(12 months)R’000
Bonus(paid by subsidiaries
in the group)Dec 2012
(12 months)R’000
des de Beer 1 563 188 2 895 357
Andries de lange 1 200 148 2 024 283
nick Hanekom 788 99 1 368 203
Johann Kriek 1 350 114 2 277 154
david lewis (1) 715 17 1 987 187
5 616 566 10 551 1 184
(1) david lewis retired from the board on 26 April 2013.
the group did not pay any fees or benefits to directors other than the remuneration as disclosed in the tables above.

R e s i l i e n t P R o P e R t y i n c o m e F u n d INTEGRATED REPORT 2013 22
uNiT PErfOrmaNCE
0
200
400
600
800
1 000
1 200
1 400
1 600
1 800
2 000
2 200
2 400
2 600
0
500
1 000
1 500
2 000
2 500
3 000
3 500
4 000
4 500
5 000
5 500
6 000
0
200
400
600
800
1 000
1 200
1 400
1 600
1 800
2 000
2 200
2 400
2 600
0
500
1 000
1 500
2 000
2 500
3 000
3 500
4 000
4 500
5 000
5 500
6 000
the board of directors is committed to creating sustainable stakeholder value by managing the portfolio and by maximising returns on the core assets.
the graphs below indicate the unit price performance of Resilient as well as the performance of Resilient units compared to the Jse south African Property
loan stock index on both a price return and total return basis. the performance of the Resilient units are indexed using a base of 100 on 1 January 2003.
closing price (cents)
Jun 2013 5 374
dec 2012 5 175
dec 2011 3 475
dec 2010 3 245
dec 2009 2 600
dec 2008 2 400
dec 2007 2 700
dec 2006 1 940
dec 2005 1 400
dec 2004 985
dec 2003 760cent
s
CLOSING PRICE
value traded (R’million)
2013 (6 months) 2 426,5
2012 2 995,2
2011 2 486,8
2010 1 991,0
2009 1 837,5
2008 1 583,6
2007 1 440,1
2006 1 018,8
2005 666,4
2004 391,0
2003 (13 months) 361,5
volume traded (million)
2013 (6 months) 44,92012 69,1
2011 79,0
2010 68,3
2009 76,9
2008 74,8
2007 59,4
2006 59,8
2005 59,4
2004 51,1
2003 (13 months) 64,2
%
RELatIvE PERFORmaNCE
■ RESILIENt total return ■ PLS total return ■ RESILIENt price ■ PLS price
2003 2004 2005 2006 2007 2008 2009 2010 2011 2012 2013
2003 2004 2005 2006 2007 2008 2009 2010 2011 2012 2013

R e s i l i e n t P R o P e R t y i n c o m e F u n d INTEGRATED REPORT 2013 23
aNalySiS Of liNkEd uNiThOldErS
uNiThOldEr SPrEad aT 30 JuNE 2013 aS dEfiNEd iN TErmS Of ThE JSE liSTiNgS rEQuirEmENTS
Number ofunitholders
Percentageof unitholders
Number ofunits held
Percentage ofissued units
Public 3 742 96,7% 239 190 955 82,6%
directors and employees 128 3,3% 50 353 115 17,4%
3 870 100,0% 289 544 070 100,0%
size of holdingNumber ofunitholders
Number ofunits held
Percentage ofissued units
up to 2 500 units 2 152 2 325 205 0,8%
2 501 to 10 000 units 980 4 925 581 1,7%
10 001 to 100 000 units 481 15 359 843 5,3%
100 001 to 1 000 000 units 198 76 440 048 26,4%
1 000 001 to 3 500 000 units 42 71 908 201 24,8%
more than 3 500 000 units 17 118 585 192 41,0%
3 870 289 544 070 100,0%
Registered unitholders owning 5% or more of issued units
Number ofunits held
Percentage ofissued units
capital Property Fund 16 200 000 5,6%
16 200 000 5,6%
control of more than 5% of issued units Number of
units controlledPercentage of
issued units
stAnliB 31 523 724 10,9%
des de Beer 25 600 000* 8,8%
investec 16 624 854 5,7%
capital Property Fund 16 200 000 5,6%
89 948 578 31,0%
* Includes the 50% non-beneficial holding of Optimprops 3 Proprietary Limited.

R e s i l i e n t P R o P e R t y i n c o m e F u n d INTEGRATED REPORT 2013 24
riSk maNagEmENT aNd kEy riSk faCTOrS
Risk is the volatility of unexpected outcomes. Within the Resilient framework, this would specifically relate to the adverse impact on the value of its assets,
equity or earnings. Risk management is the discipline by which these risks are identified, assessed and prioritised. it is essential to understand the multiple
dimensions of risk in order to manage these effectively, with the aim of increasing unitholder value and gaining a competitive advantage.
Risk management is essential for improved performance, growth and sustainable value creation. the process for identifying and managing risks has been
set by the board. the board of directors has overall responsibility for risk management but has delegated the responsibility for monitoring risk management
processes and activities to Resilient’s risk committee. the day-to-day responsibility for risk management, including maintaining an appropriate internal
control framework, remains the responsibility of Resilient’s executive management.
Risk management is an integral part of the group’s strategic management and is the mechanism through which risks associated with the group’s activities
are addressed. the key objectives of the risk management system include:
• theidentification,assessmentandmitigationofrisksonatimelybasis;
• theprovisionoftimelyinformationonrisksituationsandappropriateriskresponses;
• theidentificationofpotentialopportunitieswhichwouldresultinincreasingfirmvalue;and
• theinstillationofacultureofriskmanagementthroughouttheResilientgroup.
Risks are monitored via the risk management framework in terms of which management identifies risks, documents these in the risk matrix and assesses
the probability of their occurrence as well as the potential impact of the risk on the organisation. each identified risk is then managed and, where
possible, mitigated. due to the dynamic nature of the economic environment in which Resilient operates, risks, and the impact thereof, change constantly.
Accordingly, risk management is a dynamic and ongoing discipline which is continuously adapted to its environment.
the risk management framework is presented to the risk committee on an annual basis.
KEy RIsK busINEss ImPAcT mITIGATION Of ThE RIsK
south Africa is experiencing significant
increases in administered prices including
electricity, rates and municipal levies.
Resilient is bearing the increased cost of
utilities that cannot be recovered from tenants.
this reduces distributable income.
energy saving technologies are being
implemented throughout the portfolio in order
to reduce utility costs.
the ability of tenants to absorb the increasing
cost of occupancy is limited.
the increased cost of occupancy may result in
more tenant business failures and legal action
leading to higher vacancies and increased legal
costs and bad debts.
tenant arrears are closely monitored. Asset
managers meet with tenants on a regular basis
in order to mitigate legal action and bad debts.
local authorities’ service delivery is
deteriorating and many local authorities
are not billing correctly. A number of local
authorities no longer read electricity or water
meters timeously.
Resilient is not being billed the correct utility
amounts on a monthly basis.
Resilient has installed its own meters and
employed third party meter readers. Recoveries
from tenants are based on this information
rather than the billings received from local
authorities.
the difficult economic climate makes the
letting of vacant space challenging.
Vacant space reduces rental income and
expenses are incurred regardless of whether
the property is tenanted. this results in less
distributable income.
Asset managers meet with tenants on a
regular basis to ensure that their concerns are
addressed. Rentals are offered at market related
rates and incentives are offered to brokers in
order to let the vacancies. Buildings are well
maintained.
deterioration in the company’s credit profile, a
decline in debt market conditions or a general
rise in interest rates could impact the cost and
availability of funding.
the cost of financing increases substantially
reducing distributable income.
the group monitors its key financial ratios and
seeks to maintain a strong investment grade
credit rating. interest rate risk is mitigated
through the use of interest rate swaps and caps.
development projects fail to deliver expected
returns due to increased costs or delays.
Resilient may suffer reputational damage as
well as financial loss if developments are not
completed timeously and within budget. the
majority of developments are done via joint
ventures and delays may lead to legal disputes.
Resilient has an in-house development team
that closely monitors the progress and costs of
each of its developments. Fixed price contracts
are entered into with reputable construction
companies.
the underperformance of property managers
may result in inaccurate recovery of revenue
and incorrect reporting.
inaccurate billing of tenants and reporting. compliance with service level agreements is
monitored regularly. management reviews
monthly reports and meets with the property
managers on a regular basis.
R e s i l i e n t P R o P e R t y i n c o m e F u n d INTEGRATED REPORT 2013 25
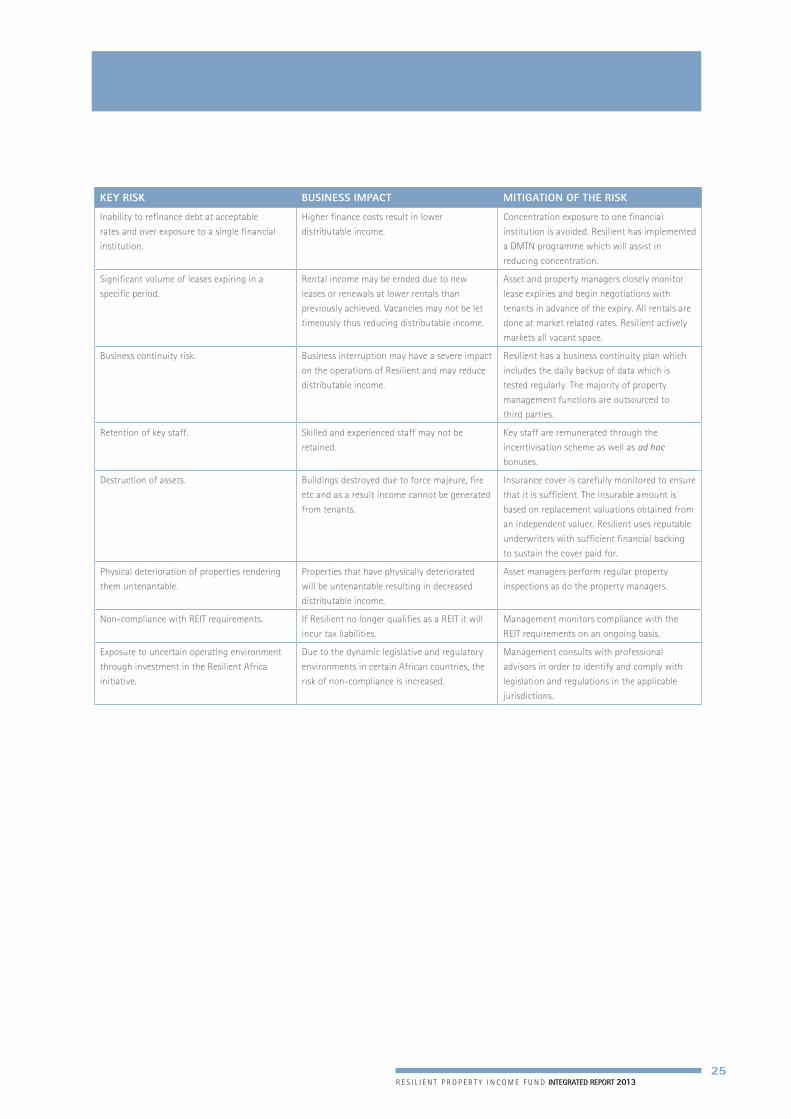
KEy RIsK busINEss ImPAcT mITIGATION Of ThE RIsK
inability to refinance debt at acceptable
rates and over exposure to a single financial
institution.
Higher finance costs result in lower
distributable income.
concentration exposure to one financial
institution is avoided. Resilient has implemented
a dmtn programme which will assist in
reducing concentration.
significant volume of leases expiring in a
specific period.
Rental income may be eroded due to new
leases or renewals at lower rentals than
previously achieved. Vacancies may not be let
timeously thus reducing distributable income.
Asset and property managers closely monitor
lease expiries and begin negotiations with
tenants in advance of the expiry. All rentals are
done at market related rates. Resilient actively
markets all vacant space.
Business continuity risk. Business interruption may have a severe impact
on the operations of Resilient and may reduce
distributable income.
Resilient has a business continuity plan which
includes the daily backup of data which is
tested regularly. the majority of property
management functions are outsourced to
third parties.
Retention of key staff. skilled and experienced staff may not be
retained.
Key staff are remunerated through the
incentivisation scheme as well as ad hoc bonuses.
destruction of assets. Buildings destroyed due to force majeure, fire
etc and as a result income cannot be generated
from tenants.
insurance cover is carefully monitored to ensure
that it is sufficient. the insurable amount is
based on replacement valuations obtained from
an independent valuer. Resilient uses reputable
underwriters with sufficient financial backing
to sustain the cover paid for.
Physical deterioration of properties rendering
them untenantable.
Properties that have physically deteriorated
will be untenantable resulting in decreased
distributable income.
Asset managers perform regular property
inspections as do the property managers.
non-compliance with Reit requirements. if Resilient no longer qualifies as a Reit it will
incur tax liabilities.
management monitors compliance with the
Reit requirements on an ongoing basis.
exposure to uncertain operating environment
through investment in the Resilient Africa
initiative.
due to the dynamic legislative and regulatory
environments in certain African countries, the
risk of non-compliance is increased.
management consults with professional
advisors in order to identify and comply with
legislation and regulations in the applicable
jurisdictions.

R e s i l i e n t P R o P e R t y i n c o m e F u n d INTEGRATED REPORT 2013 26
COrPOraTE gOvErNaNCE rEviEW
the board of directors (“the board”) endorses the code of corporate practices and conduct as set out in the King iii report and confirms that the group is
compliant with the provisions thereof. the board has been addressed by independent consultants to ensure that all directors are fully conversant with best
practice and current thinking with regard to corporate governance. A list of all 75 King iii principles and the extent of the company’s compliance therewith
is available on the company’s website at www.resilient.co.za.
COmPOSiTiON Of ThE BOard Of dirECTOrSthe board comprises four executive directors, six independent non-executive directors and one non-independent non-executive director. All directors
serve for a maximum period of three years and are subject to retirement by rotation and re-election by members in general meeting. Board appointments
are made in terms of the policy on nominations and appointments, such appointments are transparent and a matter for the board as a whole.
there are no fixed term contracts for executive directors and the notice period for termination or resignation is one calendar month. there is no restraint
of trade period for executive directors.
Jorge da costa, david lewis and Phumelele msweli retired from the board on 26 April 2013.
rOlE Of ThE dirECTOrSultimate control of the company rests with the board of directors while the executive management is responsible for the operational management of the
company. to achieve this, the board is responsible for establishing the objectives of the company and setting a philosophy for investments, performance
and ethical standards. Although quarterly board meetings are arranged every year, additional meetings are called should circumstances require it.
three board meetings were called during the 2013 financial year.
in 2013, the chairman with the assistance of the company secretary, led a formal review of the effectiveness of the board and its committees.
each director completed a detailed evaluation questionnaire and an analysis of the findings was presented to the board. there was agreement that the
board was operating effectively. the results were positive and action plans were agreed upon where required.
fuNCTiONS Of ThE BOardthe board acknowledges that it is responsible for ensuring the following functions as set out in the board charter:
• goodcorporategovernanceandimplementationofthecodeofcorporatepracticesandconductassetoutintheKingIIIreport;
• thatthegroupperformsatanacceptablelevelandthatitsaffairsareconductedinaresponsibleandprofessionalmanner;and
• theboardrecognisesitsresponsibilitiestoallstakeholders.
rESPONSiBiliTiES Of ThE BOardAlthough certain responsibilities are delegated to committees or management executives, the board acknowledges that it is not discharged from its
obligations in regard to these matters.
the board acknowledges its responsibilities as set out in the board charter in the following areas:
• theadoptionofstrategicplansandensuringthattheseplansarecarriedoutbymanagement;
• monitoringoftheoperationalperformanceofthebusinessagainstpredeterminedbudgets;
• monitoringtheperformanceofmanagementatbothoperationalandexecutivelevel;
• ensuringthatthegroupcomplieswithalllaws,regulationsandcodesofbusinesspractice;and
• ensuringacleardivisionofresponsibilitiesatboardleveltoensureabalanceofpowerandauthorityintermsofgrouppolicies.
iNdEPENdENCE Of ThE dirECTOrSthe board of directors’ independence from the executive management team is ensured by the following:
• separationoftherolesofchairmanandmanagingdirector,withthechairmanbeingindependent;
• theboardbeingdominatedbyindependentnon-executivedirectors;
• theaudit,investment,nomination,risk,remunerationandsocialandethicscommitteeshavingamajorityofindependentdirectors;
• non-executivedirectorsnotholdingservicecontracts;
• alldirectorshavingaccesstotheadviceandservicesofthecompanysecretary;and
• withprioragreementfromthechairman,alldirectorsareentitledtoseekindependentprofessionaladviceconcerningtheaffairsofthecompanyat
the company’s expense.
the following non-executive directors chair the various sub-committees of the board:
• Audit BryanHopkins(independent)
• Investment BarryvanWyk(independent)
• Nomination JJNjeke(independent)
• Risk UmshaReddy(independent)
• Remuneration ThembiChagonda(non-independent)
• Socialandethics UmshaReddy(independent)
the independence of the non-executive directors was assessed and six are considered to be independent in terms of the requirements of King iii.
independence evaluations are done annually.

R e s i l i e n t P R o P e R t y i n c o m e F u n d INTEGRATED REPORT 2013 27
w TUBATSE CROSSING w 44 184 m2 w MPUMALANGA
marthin Greyling, JJ njeke and Barry van Wyk have served on the board as independent non-executive directors for 11 years. A rigorous assessment of the
independence of these directors has been completed and the criteria used to assess their independence were as set out in King iii as follows:
• whetherthedirectorisarepresentativeofashareholderwhohastheabilitytocontrolorsignificantlyinfluencemanagementortheboard;
• whetherthedirectorhasadirectorindirectinterestinthecompany(includinganyparentorsubsidiaryinaconsolidatedgroupwiththecompany)
whichexceeds5%ofthegroup’stotalnumberofsharesinissue;
• whetherthedirectorhasadirectorindirectinterestinthecompanywhichislessthan5%ofthegroup’stotalnumberofsharesinissue,butis
materialtothedirector’spersonalwealth;
• whetherthedirectorhasbeenemployedbythecompanyorthegroupofwhichitcurrentlyformspartofinanyexecutivecapacity,orappointedas
thedesignatedauditororpartnerinthegroup’sexternalauditfirm,orseniorlegaladviserfortheprecedingthreefinancialyears;
• whetherthedirectorisamemberoftheimmediatefamilyofanindividualwhoisorhasduringtheprecedingthreefinancialyearsbeenemployedby
thecompanyorthegroupinanexecutivecapacity;

R e s i l i e n t P R o P e R t y i n c o m e F u n d INTEGRATED REPORT 2013 28
COrPOraTE gOvErNaNCE rEviEW (CONTiNuEd)
• whetherthedirectorisaprofessionaladvisertothecompanyorgroupotherthaninthecapacityasadirector;
• whether the director is free from any business or other relationship (contractual or statutory) which could be seen by an objective outsider to interfere
materiallywiththedirector’scapacitytoactinanindependentmanner,suchasbeingadirectorofamaterialcustomerorsuppliertothecompany;and
• whetherthedirectorreceivesremunerationcontingentupontheperformanceofthecompany.
the board assessed the independence of the non-executive directors and all of these three directors complied with the above independence criteria.
the assessments indicated that the independence of character and judgement of marthin Greyling, JJ njeke and Barry van Wyk is not impaired or in any
way affected by length of service. independent directors who have served on the board for nine years or longer will stand for re-election on an annual basis.
dirECTOrS’ iNTErESTSA full list of directors’ interests is maintained and directors certify that the list is correct at each board meeting.
directors recuse themselves from any discussion and decision on matters in which they have a material financial interest.
audiT COmmiTTEEthe primary role of the audit committee is to ensure the integrity of financial reporting and the audit process. in pursuing these objectives, the audit
committee oversees relations with the external auditors. the committee also assists the board in discharging its duties relating to the safeguarding of
assets, the operation of adequate systems and internal control processes, overseeing the preparation of accurate financial reports and statements in
compliance with all applicable legal requirements and accounting standards, ensuring compliance with good governance practices and nomination of
external auditors. the role of the audit committee has been codified in the audit committee charter which has been approved by the board. this charter
has been aligned with the requirements of King iii and the companies Act.
the audit committee presently comprises: marthin Greyling (appointed 13 november 2002), Bryan Hopkins (chairman) (appointed 17 may 2011) and
Barry van Wyk (appointed 1 december 2010), all of whom are independent non-executive directors. the managing director, financial director and company
secretary attend the committee meetings as invitees. the committee members have unlimited access to all information, documents and explanations
required in the discharge of their duties, as do the external auditors.
the board, in consultation with the audit committee chairman, makes appointments to the committee to fill vacancies. members of the audit committee
are subject to re-election by members in general meeting on an annual basis. the board has determined that the committee members have the skills and
experience necessary to contribute meaningfully to the committee’s deliberations. in addition, the chairman has requisite experience in accounting and
financial management.
the committee met two times during the financial year.
the audit committee has satisfied itself that no breakdown in accounting controls, procedures and systems has occurred during the year under review.
in fulfilling its responsibility of monitoring the integrity of financial reports to unitholders, the audit committee has reviewed accounting principles,
policies and practices adopted in the preparation of financial information and has examined documentation relating to the annual integrated report.
the clarity of disclosures included in the financial statements was reviewed by the audit committee, as was the basis for significant estimates and
judgements. the audit committee is further satisfied that the financial director, nick Hanekom, is sufficiently competent and that the finance function
has adequate resources and sufficient expertise.
it is the function of the committee to review and make recommendations to the board regarding interim financial results and the integrated report prior
to approval by the board.
the audit committee has complied with its legal, regulatory and other responsibilities. the audit committee recommended the integrated report to the
board for approval.
EXTErNal audiTA key factor that may impair auditors’ independence is a lack of control over non-audit services provided by the external auditors. in essence, the external
auditors’ independence is deemed to be impaired if the auditors provide a service which:
• resultsinauditingofownworkbytheauditors;
• resultsintheauditorsactingasamanageroremployeeofthegroup;
• putstheauditorsintheroleofadvocateforthegroup;or
• createsamutualityofinterestbetweentheauditorsandthegroup.
the company addresses this issue through three primary measures, namely:
• disclosureoftheextentandnatureofnon-auditservices;
• theprohibitionofselectedservices;and
• priorapprovalbytheauditcommitteeofnon-auditservices.
other safeguards encapsulated in the policy include:
• theexternalauditorsarerequiredtoassessperiodically,intheirprofessionaljudgement,whethertheyareindependentofthegroup;
• theauditcommitteeensuresthatthescopeoftheauditors’workissufficientandthattheauditorsarefairlyremunerated;and
• theauditcommitteehasprimaryresponsibilityformakingrecommendationstotheboardontheappointment,reappointmentandremovalofthe
external auditors.

R e s i l i e n t P R o P e R t y i n c o m e F u n d INTEGRATED REPORT 2013 29
the committee reviews audit plans for external audits and the outcome of the work performed in executing these plans. they further ensure that
items identified for action are followed up. the external auditors report annually to the audit committee to confirm that they are and have remained
independent from the group during the financial year.
the audit committee considered information pertaining to the balance between fees for audit and non-audit work for the group in 2013 and concluded
that the nature and extent of non-audit fees do not present a threat to the external auditors’ independence. Furthermore, after reviewing a report from
the external auditors on all their relationships with the company that might reasonably have a bearing on the external auditors’ independence and the
audit engagement partner and staff’s objectivity, and the related safeguards and procedures, the committee has concluded that the external auditors’
independence was not impaired. the audit committee approved the external auditors’ terms of engagement, scope of work, the annual audit and the
applicable levels of materiality. Based on written reports submitted, the committee reviewed, with the external auditors, the findings of their work and
confirmed that all significant matters had been satisfactorily resolved. the committee determined that the 2013 audit was completed without any
restriction on its scope.
the audit committee has satisfied itself as to the suitability of the external auditors for reappointment for the ensuing year.
iNTErNal audiTthe company does not have a formalised internal audit department. this is primarily due to the fact that the majority of the property management
functions are outsourced to external property managers who are subjected to annual external audits. the audit committee continually examines the
appropriateness of utilising independent internal auditors to periodically review activities of the company and service providers.
during 2013, Resilient engaged Grant thornton to perform reviews on controls over specific key areas. the areas for testing were discussed with the audit
committee who engaged directly with Grant thornton in this regard. the report to the audit committee indicated that the controls at the selected property
managers were generally adequate and effective.
EThiCal PErfOrmaNCEthe board of directors forms the core of the values and ethics subscribed to by the company through its various bodies and committees. these values and
ethics are sustained by the directors’ standing and reputation in the business community and their belief in free and fair dealings in utmost good faith
and respect for laws and regulations. Resilient has a code of ethics communicated to all staff. the code of ethics stipulates, among other things, that all
stakeholders are expected to act in good faith, that bribery in any form is not tolerated, all conflicts of interest need to be declared and that compliance
with all legislation is of utmost importance. the code of ethics is reviewed by the social and ethics committee on an annual basis.
the board is not aware of any transgressions of the code of ethics during the financial year.
no issues of non-compliance, fines or prosecutions have been levied against Resilient.
iNTErNal fiNaNCial aNd OPEraTiNg CONTrOlSA framework of financial reporting, internal and operating controls has been established by the board to ensure reasonable assurance as to accurate and
timeous reporting of business information, safeguarding of group assets, compliance with laws and regulations, financial information and general operation.
the board reviewed and was satisfied with the effectiveness of the internal financial and operating controls, the process of risk management and the
monitoring of legal governance compliance within the company.
iNvESTmENT COmmiTTEEAll acquisitions, disposals and capital expenditure are considered by the investment committee. the investment committee approves acquisitions, disposals
and capital expenditure up to preset limits.
the investment committee consists of two independent non-executive directors and one executive director. All members of this committee have extensive
experience and technical expertise in the property industry.
the investment committee’s responsibilities and duties are governed by a charter that was reviewed by the board in 2013.
NOmiNaTiON COmmiTTEEthe nomination committee is mandated by the board to identify suitable candidates to be appointed to the board, identify suitable board candidates in
order to fill vacancies, ensure there is a succession plan in place for key management, assess the independence of non-executive directors and assess the
composition of the board sub-committees. the nomination committee recommends the individuals to the board for appointment.
the nomination committee presently comprises: JJ njeke (chairman), thembi chagonda and Bryan Hopkins.
the nomination committee’s responsibilities and duties are governed by a charter that was reviewed by the board in 2013.
rEmuNEraTiON COmmiTTEEthe remuneration committee is mandated by the board to set the remuneration and incentivisation of all employees, including executive directors.
in addition, the remuneration committee recommends directors’ fees payable to non-executive directors and members of board sub-committees.
Further details are provided in the remuneration report on page 20.
the remuneration committee’s responsibilities and duties are governed by a charter that was reviewed by the board in 2013.

R e s i l i e n t P R o P e R t y i n c o m e F u n d INTEGRATED REPORT 2013 30
COrPOraTE gOvErNaNCE rEviEW (CONTiNuEd)
riSk COmmiTTEEthe risk committee is mandated by the board to ensure that a sound risk management system is maintained, to assist the board in discharging its duties
relating to the safeguarding of assets, ensuring that the sustainability reporting is comprehensive, timely and relevant and to ensure that the company
has implemented an effective plan for risk management that will enhance the company’s ability to achieve its strategic objectives.
the risk committee consists of three independent non-executive directors and one executive director.
the risk committee’s responsibilities and duties are governed by a charter that was reviewed by the board in 2013.
SOCial aNd EThiCS COmmiTTEEthe social and ethics committee is a statutory committee whose focus is to monitor compliance with labour legislation as well as corporate social
responsibilities and corporate citizenship.
the social and ethics committee consists of two independent non-executive directors, one non-independent non-executive director and one executive
director.
the social and ethics committee’s responsibilities and duties are governed by a charter that was reviewed by the board in 2013.
COmPaNy SECrETarythe board considered the competence, qualifications and experience of the company secretary, Rajeshree sookdeyu, and she is deemed fit to continue in
the role as company secretary for Resilient. Rajeshree is not a director of Resilient and her relationship with the board has been assessed and is considered
to be at arm’s length.
iNfOrmaTiON TEChNOlOgy (“iT”) gOvErNaNCEthe board is ultimately responsible for it governance. the Resilient it function is outsourced to a third party service provider and is governed by a
service level agreement. compliance with the service level agreement is monitored by management and the terms are reviewed on a regular basis.
there is a dedicated member of the Resilient management team who oversees the it function, attends the executive committee meetings and reports to
the managing director. the risks and controls over it assets and data are considered by the risk committee.
dEaliNg iN SECuriTiES By ThE dirECTOrSdealing in the company’s securities by directors and company officials is regulated and monitored as required by the Jse listings Requirements.
in addition, Resilient maintains a closed period from the end of a financial period to the date of publication of the financial results.
PrOmOTiON Of aCCESS TO iNfOrmaTiON aCTthere were no requests for information lodged with the company in terms of the Promotion of Access to information Act, no 2 of 2000.
SPECial rESOluTiONS PaSSEdFive special resolutions were passed during 2013:
1 Approval of directors’ remuneration for their services as directorsit was resolved that, in accordance with section 66 of the companies Act, fees to be paid by the company to the non-executive directors for their services
as directors be and are hereby approved, as follows: for the year ended 31 December 2013
Rand
For the year ended 31 December 2014
Rand
chairman * 325 000
non-executive director * 225 000
Audit committee member (including chairman) * 100 000
investment committee member (including chairman) * 100 000
Remuneration committee member (including chairman) * 100 000
nomination committee member (including chairman) 45 000 50 000
Risk committee member (including chairman) * 50 000
social and ethics committee member (including chairman) 45 000 50 000
*Fees were approved at the annual general meeting of 16 May 2012.
2 Approval of financial assistance to related or inter-related companiesit was resolved that, to the extent required by the companies Act, the board of directors of the company may, subject to compliance with the requirements
of the company’s memorandum of incorporation, the companies Act and the Jse listings Requirements, each as presently constituted and as amended
from time to time, authorise the company to provide direct or indirect financial assistance in terms of section 45 of the companies Act by way of loans,
guarantees, the provisions of security or otherwise, to any of its present or future subsidiaries and/or any other company or corporation that is or becomes
related or inter-related (as defined in the companies Act) to the company for any purpose or in connection with any matter, such authority to endure until
the annual general meeting of the company to be held in 2014.
A similar special resolution was passed at subsidiary level.

R e s i l i e n t P R o P e R t y i n c o m e F u n d INTEGRATED REPORT 2013 31
3 Approval of financial assistance to directors and prescribed officers for the purpose of acquiring securities in Capital Property Fundit was resolved that, to the extent required by the companies Act, the board of directors of the company may, subject to compliance with the requirements
of the company’s memorandum of incorporation, the companies Act and the Jse listings Requirements, each as presently constituted and as amended
from time to time, authorise the company to provide direct or indirect financial assistance in terms of section 45 of the companies Act by way of loans,
guarantees, the provisions of security or otherwise, to any of its present or future directors or prescribed officers or to any present or future directors
or prescribed officers of any of its present or future subsidiaries and/or of any other company or corporation that is or becomes related or inter-related
(as defined in the companies Act) to the company for the purpose of acquiring securities in capital Property Fund, a collective investment scheme in
property, the securities of which are listed on the Jse under share code ‘cPl’, such authority to endure until the annual general meeting of the company
to be held in 2014. this authority is further subject to a maximum of R15 million per such person.
4 Approval of the repurchase of linked unitsit was resolved that, subject to the companies Act, the memorandum of incorporation of the company, the Jse listings Requirements and the restrictions
set out below, the repurchase of linked units of the company, either by the company or by any subsidiary of the company, is hereby authorised, on the
basis that:
a) this authority will only be valid until the company’s next annual general meeting or for 15 months from the date of this resolution, whichever period
isshorter;
b) the number of linked units which may be acquired pursuant to this authority in any financial year may not in the aggregate exceed 20%, or 10% where
suchacquisitionsareeffectedbyasubsidiary,ofthecompany’sunitcapitalasatthedateofthisnoticeofannualgeneralmeeting;
c) the repurchase of linked units must be effected through the order book operated by the Jse trading system and done without any prior arrangement
betweenthecompanyandthecounter-party;
d) the repurchase of linked units may not be made at a price greater than 10% above the weighted average of the market value for the linked units for
thefivebusinessdaysimmediatelyprecedingthedateonwhichthetransactioniseffected;
e) atanypointintime,thecompanywillonlyappointoneagenttoeffectrepurchasesonitsbehalf;
f) the company or its subsidiary may not repurchase linked units during a prohibited period as defined in paragraph 3.67 of the Jse listings Requirements
unless there is a repurchase programme in place and the dates and quantities of linked units to be repurchased during the prohibited period are fixed
andfulldetailsthereofhavebeendisclosedinanannouncementoverSENSpriortocommencementoftheprohibitedperiod;
g) a resolution by the board of directors is passed that the board of directors of the company authorises the repurchase, that the company and the
relevant subsidiaries have passed the solvency and liquidity test as set out in section 4 of the companies Act and that, since the test was performed,
therehavebeennomaterialchangestothefinancialpositionofthegroup;and
h) the company’s sponsor will confirm the adequacy of the company’s working capital, for the purposes of undertaking linked unit repurchases, in writing
to the Jse prior to the repurchase of any linked units.
5 Approval of provision of financial assistance for the purchase of linked unitsit was resolved that the company, either as lender or as surety or guarantor for a lender, or otherwise, is hereby authorised, from time to time, to provide
financial assistance for the purchase of or subscription for its linked units to any company or trust, the majority of whose shareholders or beneficiaries
(directly or indirectly) are ‘black persons’ as defined in the Broad-based Black economic empowerment Act, 2003 (or any successor thereto) on the
following terms:
a) the maximum additional capital amount (excluding interest, costs, charges, fees and expenses) of any such amounts lent or for which suretyships or
guaranteesaregivenmaynotexceedR500million;
b) the maximum period for the repayment of any loan provided or for which suretyships or guarantees are given in terms hereof may not exceed
10years;and
c) the minimum interest rate to be applied to any loan provided may not be less than the prime overdraft rate of interest from time to time publicly
quoted as such by the standard Bank of south Africa limited.
uNiT iSSuESthere was one unit issue during the year: on 7 march 2013, 3 800 000 linked units were issued at R51,86 per linked unit as staff incentivisation through
the Resilient unit Purchase trust.
COmmuNiCaTiONS WiTh STakEhOldErSResilient is committed to ensuring timeous, effective and transparent communication with unitholders and other stakeholders through annual integrated
and interim financial reports, presentations to analysts, press releases etc. Resilient’s major stakeholders are presented on page 11.

R e s i l i e n t P R o P e R t y i n c o m e F u n d INTEGRATED REPORT 2013 32
SuSTaiNaBiliTy rEPOrTiNg
At Resilient, our approach to the concept of sustainability relates to the maintenance and enhancement of environmental, social and economic resources,
in order to meet the needs of current and future generations. this is founded in a commitment to being a good corporate citizen, operating in a
commercially sensible and socially responsible manner.
ENvirONmENTalenergy efficiency is foremost in our sustainability endeavours and to this end the need to practically and efficiently measure the use of utilities within our
buildings. We are currently engaged with various service providers on the metering of the buildings to provide us with the metrics to make meaningful
and informed decisions. the results of these metrics have and will continue to inform our approach to new developments, refurbishments and extensions
in order to maximise the return on implemented solutions.
in respect of all works there is a focus on the fundamental architectural principles, one of which is building aspect, which helps to passively address the
heat loads and natural lighting options available in the buildings. since HVAc constitutes the largest percentage of energy consumption, in the region of
60%, in the majority of buildings new and retrofit systems will incorporate improved standards of insulation, shading, glazing, ventilation and efficient
air-conditioning plant.
the approach to enhance efficiency will also incorporate dealing with education and adjustment of personal habits of people occupying the buildings,
these include sensor switching, night flushing and changing set points according to seasonal changes. on new and replacement plant we are utilising
variable speed drive compressors and staged units to best balance demand and supply of air-conditioned space. Building management systems (“Bms”)
are steadily improving and are currently used in specific applications where their cost benefit may justify their implementation.
Where possible we are utilising the newer and more efficient lighting systems and incorporating rational design principles to maximise the lighting levels
whilst reducing energy consumption on new works. We will be retrofitting older buildings on a replacement basis with more efficient technologies and
these include cFl, led and t5 replacement lamps. Here too education of users is paramount in adapting to sensor switching systems and reduced ambient
lighting when areas are not occupied.
Water is a precious resource and, in order to manage the utilisation, Resilient is focusing on the comprehensive measurement thereof. Furthermore all new
gardens and landscaping will be done on an indigenous basis to limit the need for irrigation. As standard practice new and refurbishment works are being
fitted with low flushing mechanisms and metered discharge taps to reduce consumption and limit waste. timers on existing geysers and solar geysers are
all part of the arsenal in reducing consumption and more recently the utilisation of heat pumps to reduce energy consumption.
Resilient is engaging with eskom on an ongoing basis in terms of their demand side management programmes and attends the green building conferences
and other forums to remain abreast of international best practice, legal requirements and technical improvements. sAns 204 energy efficiency in
buildings regulations have been released which has a significant impact on new buildings’ efficiency and hence sustainability into the future.
Resilient systematically conducts audits at its malls to ascertain the lighting efficiency and electric consumption in order to formulate plans to improve
our energy efficiency. We have successfully completed the installation of energy efficient lighting at diamond Pavilion, the Grove and the basement
parking at Boardwalk shopping centre. We are working with eskom to take advantage of the rebate programme currently under way. We continue to
investigate the potential for the economic utilisation of photovoltaic installations to further reduce our demand on the eskom grid and make use of
renewable sources.
ECONOmiCResilient’s black economic empowerment (“Bee”) initiatives include the broad-based schemes undertaken through eagle’s eye investments Proprietary
limited (“eagle’s eye”), Amber Peek investments Proprietary limited (“Amber Peek”) and the Resilient education trust (“the trust”). eagle’s eye, which owns
10 810 811 Resilient linked units, has shareholders comprising the trust and three women groupings based in mthatha, Polokwane and Johannesburg,
each with a 25% interest. this broad-based-Bee scheme matures in three equal tranches in June 2014, June 2015 and June 2016. eagle’s eye is financed
with a nedbank loan which is currently supported by a suretyship provided by Resilient in the amount of R235 million. this initiative has been very
successful to date.
Amber Peek, a Resilient group Bee initiative, owns inter alia 10 238 351 linked units in Resilient. the shareholders of Amber Peek are Aquarella investments
553 Proprietary limited (26%), celtic Rose investments 10 Proprietary limited (26%) and the trust (48%). Aquarella investments 553 Proprietary limited is
owned by 50 black businesspeople from thohoyandou whilst celtic Rose investments 10 Proprietary limited is owned by nine black businesspeople from
Johannesburg. Amber Peek is financed by the short-selling of government bonds and with loans from Resilient and Fortress.
the Resilient education trust is a charitable trust and is registered as a public benefit organisation. it owns 5 486 743 Resilient linked units.
Resilient obtained a level 5 BBBee rating in 2012. the verification was performed by Premier Verification Proprietary limited.
SOCialWe believe that the best way to empower people is through education. our social initiatives thus centre around the improvement of facilities at various
schools and the provision of education.
Resilient continues to sponsor the saturday school programme at Beaulieu college in Kyalami which is attended by scholars from diepsloot. the saturday
school provides the children with the opportunity to learn from some of Johannesburg’s top teachers and gives them access to the school’s facilities.

R e s i l i e n t P R o P e R t y i n c o m e F u n d INTEGRATED REPORT 2013 33
w CHRIS HANI SECONDARy SCHOOL
w FLORIDA PRIMARy SCHOOL
w kIRIyATSwANE SECONDARy SCHOOL

R e s i l i e n t P R o P e R t y i n c o m e F u n d INTEGRATED REPORT 2013 34
SuSTaiNaBiliTy rEPOrTiNg (CONTiNuEd)
the trust was established with the exclusive purpose of promoting black education in south Africa. the trust grants bursaries to students from previously
disadvantaged backgrounds and communities. it also provides computer equipment and infrastructure, for example secured computer facilities, to schools
in underprivileged communities. the major initiatives undertaken by the trust during this period include:
Nedbank: My Future, My Career projectthe trust partnered with nedbank to sponsor the nedbank my Future, my career national educational initiative, which is dedicated to helping young south
Africans with their academic development. the collaborative effort championed the importance of career guidance and career opportunities. the goal of
the project was to help improve the country’s skills development and growth. showcased over five provinces in selected ster Kinekor theatres, the initiative
reached over 24 000 learners in three months in the form of 16 career-based educational videos. the trust sponsored the production of the property video,
which showcased some of our industry professionals. the film was shown in theatres at two of our shopping centres.
The Zululand Spelling BEEBased on the scripps national spelling Bee hosted in the united states, the annual district-based spelling competition offers rural learners the opportunity
to exercise their competitive stance and to improve their knowledge of the english language. this competition is hosted in Richards Bay, KwaZulu-natal.
the Zululand Fever and the ulundi Fever (media24 publications) published a 6 000 english word insert for the learners to conquer. Geared exclusively
towards rural secondary schools, each school was invited to enter one learner for the competition, with a total of over 400 learners entering on the day
of the event. the winning word was “minuscule” but the achievement of the winner, grade 10 learner thabiso mbatha from ikhandlela High in esikhawini
township, was huge.
the prize sponsored by the trust was the installation of an electronic library at the winner’s school.
Jacaranda FM: Good Morning Angels projectmelba shika wrote a letter to Jacaranda Fm’s Good morning Angels project, asking for financial assistance in order to further her studies. she and her sister
lost their mother at a very young age, leaving them financially stricken with little hope of being able to study after they matriculated. the trust approached
Jacaranda Fm’s Good morning Angels team and offered its assistance with an education based project. the Jacaranda team put the trust in contact with
melba. melba’s dream is to qualify as a nurse and the trust is paying for her Auxiliary nursing course studies. the trust remains in contact with melba to
offer academic encouragement and emotional support. the project was aired on Jacaranda Fm and featured on the kyknet programme – Vat my Hand.
Vela Secondary Schoolmthatha is located in the heart of the nelson mandela Route, which was established to give structure to the area for tourists who want to explore the
history of this south African icon. Vela secondary school is situated in mthatha and is a respected high school which shares an exchange programme
annually with a school in canada and has achieved remarkable grade 12 results in maths and science with limited resources. this rural school lacked
updated computer facilities and thus the school was unable to offer computer classes successfully.
the Resilient education trust upgraded their computer class with 26 new computers, a multifunction laser printer, a projector, a projector screen and an
air conditioner. the computer classes have restarted for all of the high school grades and Vela secondary school looks forward to a competitive 2014
examination period.
Fumana Comprehensive Schoollistening to engineering student, Albert Zithe deliver his heartfelt testimonial at the nedbank my Future, my career launch was inspirational. As a former
learner at the Fumana comprehensive school in Katlehong who had taken part in the nedbank initiative in 2012, he described himself as a dedicated
learner who achieved good results due to the support of his educators. inspired by his story representatives from the trust visited his former high school
and sat down with the educators to relay Albert’s speech. the trust donated and installed 20 new computers to support the school’s commitment to
its learners.
Florida Primary SchoolWith the aid of basic facilities, Florida Primary school has achieved outstanding academic results on an ongoing basis. the school’s dream was to acquire
new computers and to have internet access installed for their learners in order to help prepare the learners for their national exams and life beyond
their classrooms. the educators approached the trust for assistance and the trust paid for a complete upgrade of the existing 45 computer laboratory,
including the donation of a multifunction laser printer and air conditioner.
Setlopo Science and Commercial Secondary Schoolthe setlopo science and commercial secondary school is located in setlopo Village, mafikeng. the school faced a number of challenges. some of
the problems were easy to see, while others were much more difficult, as they stemmed from the poverty and unemployment in the community.
the challenges ranged from inadequately heated classrooms, poor and crumbling physical infrastructure, broken windows and dilapidated toilet facilities
for the learners. the school’s principal explained that it was hard to be proud of their school when it looked the way it did. the trust assisted the school
by upgrading their two toilet blocks with new units and basins, repainting all the classrooms, repairing the damaged ceilings, replacing all the notice and
black boards as well as the classroom doors. the principal has noted a boost in morale from the educators and learners since the completion of the project.

R e s i l i e n t P R o P e R t y i n c o m e F u n d INTEGRATED REPORT 2013 35
w JACARANDA FM: GOOD MORNING ANGELS PROJECT
w CHRIS HANI SECONDARy SCHOOL
w BEVERLy HILLS HIGH

R e s i l i e n t P R o P e R t y i n c o m e F u n d INTEGRATED REPORT 2013 36
SuSTaiNaBiliTy rEPOrTiNg (CONTiNuEd)
Beverly Hills Highestablished in 1991 and originally called “maroti secondary school”, Beverly Hills High is the pride of the evaton community. in 2011 the school was the
national winner of the eskom enterprise education simama Ranta (an entrepreneurial competition) and in 2012 the school achieved a 94,5% pass rate
for their grade 12 learners. With over 1 400 learners at the school, the basic facilities were in dire need of an upgrade. the school had limited funds for
maintenance. in order to support the already excellent results the school was achieving, the trust provided the school with 25 new computers, a projector,
a screen, a multifunction laser printer and furniture for the computer laboratory.
Swana School and Assessment Centrethe swana school and Assessment centre (registered with the department of education) caters for children from the age of 6 to 21 years old with physical
or learning disabilities. situated in empangeni, a small town in KwaZulu-natal, the school has on-site social workers and speech therapists. since its
inception in 2005, the school has hosted a specially designed programme called sniP (special needs inclusive Programme) offering short courses in life
orientation skills, numeracy and literacy which help to prepare the learners for their lives after their graduation. With over a 100 learners, the school was
at full capacity and was unable to extend its classrooms due to lack of funds. there was also no electrical supply to the classrooms.
the trust sponsored the construction of a new classroom for the school, connection of electricity and installation of lights in the classrooms.
Pick n Pay and The Grove Mall’s annual Family Day Run/walk for LifePick n Pay and the Grove mall (situated in the east of Pretoria) hosted their fourth annual family fun day, in aid of sungardens Hospice on 1 April 2013.
Associated with tshwane Beeld and Jacaranda 94.2 Fm as media partners, the event (in conjunction with Run/Walk for life) consisted of a 5km, 10km and
21km run/walk with over 4 500 participants taking part. the Resilient owned shopping centre event, collected over R100 000 for the sungardens Hospice.
Ngingakusiza, I Love to Help eventBoardwalk inkwazi shopping centre is a regional mall owned by Resilient and is situated in Richards Bay, KwaZulu-natal. Hosted during February 2013,
the ngingakusiza, i love to Help campaign offered homage to all the non-profit organisations situated in the Zululand area. the area is one of the
11 district municipalities of the province. the word, “ngingakusiza” means “How can i help you” in Zulu, which is the dominant African language spoken
in the area. media sponsor, the Zululand observer, assisted the non-profit organisations with a quarter page advert in their publication where they could
showcase their best 2012 community campaign. With the assistance of an exhibition weekend at the shopping centre, the public was able to interact with
the 16 organisations that took part in the initiative and vote for their favourite 2012 community project. Assisted by mrs. united nations south Africa
2013, monique erasmus, the winners were announced. the top three winners received a monetary sponsorship for refurbishment work of their choice to
be done at their organisation.
Educators High Schoolsituated in Klerksdorp, north West Province, educator High school has been a part of the community since 1994 and currently has almost 700 learners
ranging from grade R to grade 12. the school building and office area was originally a residential home and was converted into a school after the moyo
family purchased the land. since its inception, the moyo family has extended the school by purchasing the two plots neighbouring the building to help
cater for more children. the school was recommended to the trust by the editor of the Klerksdorp Record, salome Kotze. the trust assisted the school by
upgrading their toilet facilities with new equipment, adding a railing to their first floor balcony and upgrading their plumbing system.
Tetlanyo Secondary SchoolBetter known as the best performing school for grade 12 maths and science results in their district, tetlanyo secondary school boasts 1 060 learners and
a passion to succeed. situated 20 minutes from the Resilient owned diamond Pavilion, the school was in dire need of upgraded computers to facilitate
their newly built it facility and big learner complement. the trust sponsored 47 new computers and chairs, blinds for the classroom windows, a printer
and an air conditioner for the school.
kimberley Boys Highthe smart Board (better known as an interactive whiteboard) functions as part of a system which commands the interactive whiteboard, a computer
system, a projector and white-boarding software. this software is either smart notebook collaborative learning software for education, or smart meeting
Pro software for business. the items are connected wirelessly, with a usB or serial cables. A projector connected to the computer images, displays the
desktop images on the interactive whiteboard. the whiteboard accepts touch input from a finger, pen or other solid object. Four smart Boards were
sponsored and installed at Kimberley Boys High.
kiriyatswane Secondary Schoolestablished in 1991, the secondary school was listed as the best performing rural school in mpumalanga by the department of education in 2000.
With consistent good results in grade 12 maths and science, the secunda based school did not have a dedicated practical science laboratory.
After consultation with edutrade (a company distributing a full range of educational products catering for school curricula requirements), the trust
sponsored a fully equipped practical science laboratory to the school. the laboratory caters for 60 learners at a time and is complete with everything
required to support all the necessary experiments and lessons.

R e s i l i e n t P R o P e R t y i n c o m e F u n d INTEGRATED REPORT 2013 37
Selowe Primary Schooldubbed by the media as the “tree school”, selowe Primary school in silvermine Village is near senwabarwana in limpopo. For years the educators were
teaching their learners under trees in the village and with even their basic facilities in poor supply, the school was in dire need of assistance in all areas.
After visiting the village, the trust assisted the school by building a new office for the principal and providing him with complete computer and internet
facilities, five new toilets for the learners, a kitchen and assisting the school with adequate electrical supply for the facilities.
krause Farm Primary Schoolthe trust adopted a coordinated approach to supporting their community development project in northam. After extensive consultation with the town’s
community leaders, the Krause Farm Primary school was identified as the school most deserving of support. the trust embarked on a refurbishment
project with the school and repaired the school’s ceilings and roofs, installed a new water tank with additional taps and upgraded the learners’ 16 toilets.
New Jerusalem Children’s Homedescribed as a “small entity with a big vision” the new Jerusalem children’s Home provides integrated quality care to orphaned and HiV positive children.
Founded in 2000 by Advocate Anna mojapelo, the current facilities based in midrand comprise baby nurseries, dormitories for the older children,
communal kitchen and dining facilities, a crèche, a montessori pre-school, play and sports facilities and a substantial vegetable garden. After reading
articles about the school in the Visi and skyways magazines regarding their unique container-made dormitories, the trust visited the establishment to
learn of their successes. the trust donated eight new computers and internet facilities to the school’s dormitory for the learners to use for study and
homework purposes.
kamagugu Inclusive SchoolKamagugu senior secondary school is a special needs school located in nelspruit in mpumalanga and caters for every disability except visual impairment.
the school supports its 270 learners with vocational studies such as nail and beauty classes for the girls and woodwork craft classes for the boys.
the learners also partake in the school’s sustainable vegetable garden project, host a weekly fund raising carwash and sell their woodwork products to the
community from their school’s tuck shop. the computer classes promote basic typing, spelling and computer skills to the learners by means of a specially
designed software program. in order to support the good work the school does with the learners, the trust donated 20 new computers to the school.
Chris Hani Secondary Schoolestablished in 1993, the chris Hani secondary school is located in Khayelitsha, a township on the outskirts of cape town. in 2006 the Western cape
education department designated it as one of 10 “Arts and culture focus schools” to be rolled out in the province. With a complement of 1 390 learners
and 57 educators, the school boasts with a consistent impressive grade 12 pass rate, as well as local and international acclaimed visual art performances.
the trust visited the school and, after consultation with the principal, 30 new computers, internet access, a printer and an air conditioner was donated
to the chris Hani secondary school.
Mohlakaneng Senior Secondary Schoolmohlakaneng senior secondary school was opened in 1968 and is situated in seshego, an area north-west of Polokwane. Although the school has
only 650 learners, the 32 educators often have up to 60 learners at the same time in their classes. the school received recognition in 2012 for the most
improved overall grade 12 pass rate in limpopo and for the past 10 years achieved the best marks for english in their district. the school’s practical
science laboratory was in need of an upgrade and chemicals had to be replenished. From a safety aspect, the laboratory needed to be remodelled. the
trust donated a complete practical science laboratory to the school, fully equipped to safely cater for learners.
Our employeesour employees are as intrinsic to our business as our properties. We strive to create a productive working environment and our success in doing so is
evidenced by our low staff turnover. the remuneration of our employees is elaborated on in the remuneration report on page 20.
As discussed in note 22 to the financial statements, Resilient has a unit purchase trust in terms of which loans are granted to employees to enable them
to purchase units in Resilient. We believe that empowering our employees in this way aligns their interests even closer to those of unitholders.
We maintain open channels of communication with our employees that include weekly meetings with our asset managers and monthly and ad hoc staff
meetings for all employees. our employees have access to Resilient’s policies and procedures via the intranet. none of Resilient’s employees engage in
collective bargaining processes.
Resilient has implemented an employment equity plan. our focus is on developing our employees such that there are suitable internal candidates to lead
Resilient in the future. We encourage our employees to attend job-related training such as industry specific conferences and courses.

R e s i l i e n t P R o P e R t y i n c o m e F u n d INTEGRATED REPORT 2013 38
fivE yEar rEviEW
Jun 2013 R'000
Dec 2012 R'000
Dec 2011 R'000
Dec 2010 R'000
Dec 2009 R'000
SummariSEd STaTEmENT Of fiNaNCial POSiTiON
AssETsinvestment property 10 969 170 10 069 746 8 881 736 5 853 648 4 186 416 investment property under development 1 209 139 824 660 346 376 792 810 516 416 investments 4 411 414 3 719 975 2 769 300 2 216 200 707 576 investment in associate companies – – – 425 728 1 983 864 intangible asset 26 422 26 422 26 422 26 422 26 422 Resilient unit Purchase trust loans 494 146 374 587 420 320 272 303 265 751 loans to employees to acquire capital units 144 661 245 897 279 249 9 608 –loans to Bee partners 448 765 415 947 221 632 97 716 97 423 loans to development partners 190 060 137 758 125 250 160 265 307 501 Property, plant and equipment – – – – 1 471 current assets 193 745 83 538 40 183 91 034 137 305
Total assets 18 087 522 15 898 530 13 110 468 9 945 734 8 230 145
EQuITy AND lIAbIlITIEstotal equity attributable to equity holders 10 698 505 8 006 714 6 573 956 5 216 765 4 182 749 linked debentures 1 389 812 1 319 680 1 294 681 1 186 003 1 176 355 interest-bearing borrowings 4 791 706 4 437 502 3 997 222 2 566 839 2 173 532 Bee instrument – 337 640 150 350 118 900 65 784 deferred tax 550 565 1 065 688 545 166 411 320 267 465 linked debenture interest payable 394 446 370 967 327 312 274 831 251 495 current liabilities 262 488 360 339 221 781 171 076 112 765
Total equity and liabilities 18 087 522 15 898 530 13 110 468 9 945 734 8 230 145
net asset value per unit (Rand) 41,75 33,92 29,17 25,91 21,87 Gearing 26,5% 27,9% 30,5% 25,8% 26,4%Average cost of funding at year-end 8,24% 8,62% 8,78% 9,44% 9,65%
SummariSEd STaTEmENT Of COmPrEhENSivE iNCOmE (6 months) (12 months) (12 months) (12 months) (12 months)Recoveries and contractual rental revenue 614 250 1 140 230 843 738 572 097 530 417 Property operating expenses (219 017) (397 568) (273 076) (183 777) (158 411)distributable income from investments 113 775 210 718 181 283 161 502 88 656 Fair value gain on investment property and investments 1 301 674 2 006 665 966 087 1 211 703 395 541 Administrative expenses (46 755) (78 616) (71 353) (29 475) (32 846)income from associates – – 13 959 56 493 133 174 Fair value loss on Bee instrument – (187 290) (31 450) (53 116) (37 474)management fees received from PFm 42 821 79 065 63 609 32 267 25 617 Profit on sale of subsidiaries and joint ventures – – – 36 868 15 550 deconsolidation of Bee sPV 6 733 – – – –Profit before net finance costs 1 813 481 2 773 204 1 692 797 1 804 562 960 224 net finance costs (289 070) (1 036 608) (788 702) (661 116) (489 437)Profit before income tax 1 524 411 1 736 596 904 095 1 143 446 470 787 income tax 513 090 (525 127) (133 955) (149 587) (74 216)
Profit for the period attributable to equity holders 2 037 501 1 211 469 770 140 993 859 396 571
Property expenses as a % of revenue 35,7% 34,9% 32,4% 32,1% 29,9%
uNiT STaTiSTiCSlinked units in issue 289 544 070 274 933 259* 269 725 259* 247 084 021* 245 074 021*distribution per linked unit (cents) 136,23 255,67 230,71 211,83 194,13 distribution growth 12,83% 10,82% 8,91% 9,12% 14,21%closing price per Resilient linked unit (cents) 5 374 5 175 3 475 3 245 2 600 total return on units 6,5% 56,3% 14,2% 33,0% 16,4%
PrOPErTy STaTiSTiCStotal number of properties 39 40 37 35 31 total GlA 930 457 878 875 853 690 695 975 563 717 Vacancy % 1,8% 1,7% 1,9% 3,1% 3,2%
*Excludes 10 810 811 units issued to BEE SPV.

R e s i l i e n t P R o P e R t y i n c o m e F u n d INTEGRATED REPORT 2013 39
POrTfOliO STaTiSTiCS
the total portfolio consists of retail assets.
TENANT PROFILE
lEAsE ExPIRy PROfIlE
Rentable area
Vacant 1,8%Jun 14 13,2%Jun 15 14,9%Jun 16 16,1%Jun 17 10,0%Jun 18 17,9%>Jun 18 26,1%
Gross rentals
Vacant Jun 14 13,3%Jun 15 16,7%Jun 16 17,9%Jun 17 11,3%Jun 18 20,5%>Jun 18 20,3%
GEOGRAPhIcAl PROfIlE
Rentable area
Eastern Cape 4,9%Free State 1,8%Gauteng 14,1%kwaZulu-Natal 13,5%Limpopo 27,7%Mpumalanga 18,5%North west 12,4%Northern Cape 7,1%
Property value
Eastern Cape 3,8%Free State 1,3%Gauteng 15,5%kwaZulu-Natal 14,6%Limpopo 28,4%Mpumalanga 20,9%North west 9,5%Northern Cape 6,0%
Gross rentals
Eastern Cape 4,8%Free State 1,3%Gauteng 14,7%kwaZulu-Natal 13,7%Limpopo 28,7%Mpumalanga 20,1%North west 10,5%Northern Cape 6,2%
TENANT PROfIlE
A large national tenants, large listed tenants and government. these include, inter alia, shoprite checkers, edcon, Pick n Pay, Pepkor, Woolworths,
mr Price Group, the Foschini Group, Jd Group and truworths.
B national tenants, listed tenants, franchisees and medium to large professional firms. these include, inter alia, KFc, nando’s and spur.
c other (this comprises 595 tenants).
Rentable area
A 79,8%B 12,5%C 7,7%
Gross rentals
A 69,9%B 18,9%C 11,2%

R e s i l i e n t P R o P e R t y i n c o m e F u n d INTEGRATED REPORT 2013 40
POrTfOliO STaTiSTiCS (CONTiNuEd)
OThEr iNfOrmaTiONthe weighted average rental escalation by rentable area is 7,3% for 2014.
the average annualised property yield is 7,7% at 30 June 2013.
■ Rentable area ■ Gross rentals
NATIONAl TENANT GROuPs As A PERcENTAGE Of RENTAblE AREA AND GROss RENTAls As AT 30 JuNE 2013
Edco
n
Pick n
Pay
Shop
rite C
heck
ers
Massm
art
The F
osch
ini G
roup
Pepk
or
Woo
lwort
hs
Mr Pr
ice G
roup
Truwo
rths
JD G
roup
The S
par G
roup
New
Click
s
Stand
ard Ba
nk
FirstR
and
Afric
an Ba
nk
Studio
88 G
roup
y
0%
1%
2%
3%
4%
5%
6%
7%
8%
9%
10%

R e s i l i e n t P R o P e R t y i n c o m e F u n d INTEGRATED REPORT 2013 41
F O R T H E S I x M O N T H S E N D E D 3 0 J u N E 2 0 1 3
aNNual fiNaNCial STaTEmENTS
CONTENTS
42 Directors’ responsibility for the annual
financial statements
42 Declaration by company secretary
43 Independent auditors’ report
44 Statements of financial position
45 Statements of comprehensive income
46 Reconciliation of profit for the period to headline
earnings and distributable income
47 Statements of changes in equity
48 Statements of cash flows
49 Notes to the annual financial statements
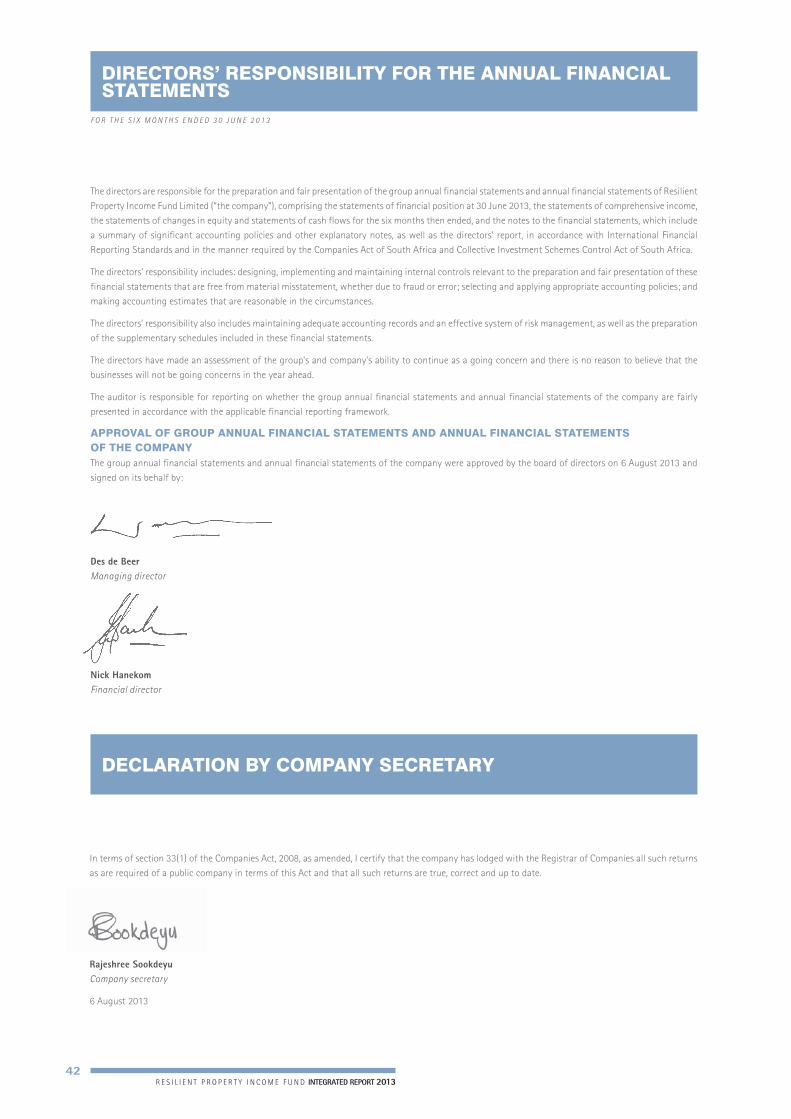
R e s i l i e n t P R o P e R t y i n c o m e F u n d INTEGRATED REPORT 2013 42
F O R T H E S I x M O N T H S E N D E D 3 0 J u N E 2 0 1 3
dirECTOrS’ rESPONSiBiliTy fOr ThE aNNual fiNaNCial STaTEmENTS
dEClaraTiON By COmPaNy SECrETary
the directors are responsible for the preparation and fair presentation of the group annual financial statements and annual financial statements of Resilient
Property income Fund limited (“the company”), comprising the statements of financial position at 30 June 2013, the statements of comprehensive income,
the statements of changes in equity and statements of cash flows for the six months then ended, and the notes to the financial statements, which include
a summary of significant accounting policies and other explanatory notes, as well as the directors’ report, in accordance with international Financial
Reporting standards and in the manner required by the companies Act of south Africa and collective investment schemes control Act of south Africa.
the directors’ responsibility includes: designing, implementing and maintaining internal controls relevant to the preparation and fair presentation of these
financialstatementsthatarefreefrommaterialmisstatement,whetherduetofraudorerror;selectingandapplyingappropriateaccountingpolicies;and
making accounting estimates that are reasonable in the circumstances.
the directors’ responsibility also includes maintaining adequate accounting records and an effective system of risk management, as well as the preparation
of the supplementary schedules included in these financial statements.
the directors have made an assessment of the group’s and company’s ability to continue as a going concern and there is no reason to believe that the
businesses will not be going concerns in the year ahead.
the auditor is responsible for reporting on whether the group annual financial statements and annual financial statements of the company are fairly
presented in accordance with the applicable financial reporting framework.
aPPrOval Of grOuP aNNual fiNaNCial STaTEmENTS aNd aNNual fiNaNCial STaTEmENTS Of ThE COmPaNythe group annual financial statements and annual financial statements of the company were approved by the board of directors on 6 August 2013 and
signed on its behalf by:
Des de beerManaging director
Nick hanekomFinancial director
in terms of section 33(1) of the companies Act, 2008, as amended, i certify that the company has lodged with the Registrar of companies all such returns
as are required of a public company in terms of this Act and that all such returns are true, correct and up to date.
Rajeshree sookdeyuCompany secretary
6 August 2013

R e s i l i e n t P R o P e R t y i n c o m e F u n d INTEGRATED REPORT 2013 43
iNdEPENdENT audiTOrS’ rEPOrT
TO ThE uNiThOldErS Of rESiliENT PrOPErTy iNCOmE fuNd limiTEdWe have audited the consolidated and separate financial statements of Resilient Property income Fund limited set out on pages 44 to 79, which comprise the statements of financial position as at 30 June 2013, and the statements of comprehensive income, statements of changes in equity and statements of cash flows for the six months then ended, and the notes, comprising a summary of significant accounting policies and other explanatory information.
dirECTOrS’ rESPONSiBiliTy fOr ThE CONSOlidaTEd fiNaNCial STaTEmENTSthe company’s directors are responsible for the preparation and fair presentation of these consolidated and separate financial statements in accordance with international Financial Reporting standards, the requirements of the companies Act of south Africa and the requirements of the collective investment schemes control Act, 45 of 2002, and for such internal control as the directors determine is necessary to enable the preparation of consolidated and separate financial statements that are free from material misstatement, whether due to fraud or error.
audiTOr’S rESPONSiBiliTyour responsibility is to express an opinion on these consolidated and separate financial statements based on our audit. We conducted our audit in accordance with international standards on Auditing. those standards require that we comply with ethical requirements and plan and perform the audit to obtain reasonable assurance about whether the consolidated and separate financial statements are free from material misstatement.
An audit involves performing procedures to obtain audit evidence about the amounts and disclosures in the financial statements. the procedures selected depend on the auditor’s judgement, including the assessment of the risks of material misstatement of the financial statements, whether due to fraud or error. in making those risk assessments, the auditor considers internal control relevant to the entity’s preparation and fair presentation of the financial statements in order to design audit procedures that are appropriate in the circumstances, but not for the purpose of expressing an opinion on the effectiveness of the entity’s internal control. An audit also includes evaluating the appropriateness of accounting policies used and the reasonableness of accounting estimates made by management, as well as evaluating the overall presentation of the financial statements.
We believe that the audit evidence we have obtained is sufficient and appropriate to provide a basis for our audit opinion.
OPiNiONin our opinion, the consolidated and separate financial statements present fairly, in all material respects, the consolidated and separate financial position of Resilient Property income Fund limited as at 30 June 2013, and its consolidated and separate financial performance and its consolidated and separate cash flows for the six months then ended in accordance with international Financial Reporting standards, the requirements of the companies Act of south Africa and the collective investment schemes control Act, 45 of 2002.
As part of our audit of the consolidated and separate financial statements for the six months ended 30 June 2013, we have read the directors’ report, the audit committee’s report and the company secretary’s certificate for the purpose of identifying whether there are material inconsistencies between these reports and the audited consolidated and separate financial statements. these reports are the responsibility of the respective preparers. Based on reading these reports we have not identified material inconsistencies between these reports and the audited consolidated and separate financial statements. However, we have not audited these reports and accordingly do not express an opinion on these reports.
Deloitte & ToucheRegistered Auditors Per: Patrick Kleb Partner
6 August 2013
deloitte & toucheRegistered Auditors Audit – JohannesburgBuildings 1 and 2deloitte Placethe Woodlands office Park20 Woodlands driveWoodmead sandton docex 10 Johannesburgtel: +27 (0)11 806 5000Fax: +27 (0)11 806 5111www.deloitte.com
national executive: ll Bam chief executive Ae swiegers chief operating officer Gm Pinnock Audit dl Kennedy Risk Advisory nB Kader tax tP Pillay consulting K Black clients & industries JK mazzocco talent & transformation cR Beukman Finance m Jordan strategy s Gwala special Projects tJ Brown chairman of the Board mJ comber deputy chairman of the Board
A full list of partners and directors is available on request
B-BBee rating: level 2 contributor in terms of the chartered Accountancy Profession sector code
member of deloitte touche tohmatsu limited
Private Bag X6Gallo manor 2052south Africa

R e s i l i e n t P R o P e R t y i n c o m e F u n d INTEGRATED REPORT 2013 44
A T 3 0 J u N E 2 0 1 3
STaTEmENTS Of fiNaNCial POSiTiON
grOuP COmPaNyJun 2013 Dec 2012 Jun 2013 Dec 2012
Note R’000 R’000 R’000 R’000
AssETsNon-current assets 16 851 786 15 810 690 867 328 749 360
investment property 3 9 754 842 9 896 272
straight-lining of rental revenue adjustment 3 172 337 173 474
investment property under development 3 1 209 139 824 660
investments 4 4 411 414 3 719 975
intangible asset 5 26 422 26 422
Resilient unit Purchase trust loans 6 494 146 374 587 493 510 373 951
loans to employees to acquire capital units 7 144 661 245 897
loans to Bee partners 8 448 765 415 947
loans to development partners 9 190 060 133 456
interest in subsidiaries and joint ventures 10 373 818 375 409
current assets 1 235 736 87 840 7 209 259 5 513 034
investment property held for sale 3 1 029 467 –
straight-lining of rental revenue adjustment 3 12 524 –
loans to development partners 9 24 867 4 302
trade and other receivables 11 167 281 82 412
Amounts owing by subsidiaries and joint ventures 10 7 209 259 5 513 034
cash and cash equivalents 1 597 1 126
Total assets 18 087 522 15 898 530 8 076 587 6 262 394
EQuITy AND lIAbIlITIEsTotal equity attributable to equity holders 10 698 505 8 006 714 4 277 185 2 376 733
share capital 12 2 895 2 749 2 895 2 749
share premium 12 3 031 257 2 712 168 3 031 257 2 712 168
non-distributable reserves 13 7 664 353 5 291 797 1 243 033 (338 184)
Retained earnings – – – –
Total liabilities 7 389 017 7 891 816 3 799 402 3 885 661
Non-current liabilities 5 727 403 5 677 981 2 399 481 2 701 228
linked debentures 14 1 389 812 1 319 680 1 389 812 1 319 680
interest-bearing borrowings 15 3 787 026 2 954 973 1 009 669 1 043 908
Bee instrument 16 – 337 640 – 337 640
deferred tax 17 550 565 1 065 688
current liabilities 1 661 614 2 213 835 1 399 921 1 184 433
trade and other payables 18 261 481 359 021 645 986
linked debenture interest payable 394 446 370 967 394 446 370 967
income tax payable 1 007 1 318
Amounts owing to subsidiaries and joint ventures 10 150 33 213
interest-bearing borrowings 15 1 004 680 1 482 529 1 004 680 779 267
Total equity and liabilities 18 087 522 15 898 530 8 076 587 6 262 394

R e s i l i e n t P R o P e R t y i n c o m e F u n d INTEGRATED REPORT 2013 45
STATEMENTS OF COMPREHENSIVE INCOME
f o r t h e s i x m o n t h s e n d e d 3 0 J u n e 2 0 1 3
GROuP COMPANyFor the
six monthsended
Jun 2013
For the year
endedDec 2012
For the six months
ended Jun 2013
For the year
endedDec 2012
Note R’000 R’000 R’000 R’000
Net rental and related revenue 406 620 793 777
Recoveries and contractual rental revenue 614 250 1 140 230
Straight-lining of rental revenue adjustment 11 387 51 115
Rental revenue 625 637 1 191 345
Property operating expenses (219 017) (397 568)
Distributable income from investments 113 775 210 718
Fair value gain on investment property and investments 1 290 287 1 955 550
Fair value gain on investment property 760 185 1 061 731
Adjustment resulting from straight-lining of rental revenue (11 387) (51 115)
Fair value gain on investments 541 489 944 934
Fair value loss on BEE instrument – (187 290) – (187 290)
Management fees received from PFM 42 821 79 065
Administrative expenses (46 755) (78 616) (2 389) (5 180)
Deconsolidation of BEE SPV (refer note 16) 6 733 –
Dividends received from group companies 1 246 162 –
Profit/(loss) before net finance costs/income 1 813 481 2 773 204 1 243 773 (192 470)
Net finance (costs)/income (289 070) (1 036 608) 2 389 5 180
Finance income 257 488 93 479 457 480 801 441
Interest from loans 39 622 75 975 19 367 34 502
Fair value adjustment on interest rate derivatives 216 004 13 910
Interest on linked units issued cum distribution 1 862 3 594 1 862 3 594
Interest received from group companies 436 251 763 345
Finance costs (546 558) (1 130 087) (455 091) (796 261)
Interest on borrowings (185 231) (365 137) (60 645) (99 628)
Capitalised interest 33 119 37 697
Fair value adjustment on interest rate derivatives – (106 014)
Interest to linked debenture holders
– interim (325 666) (325 666)
– final (394 446) (370 967) (394 446) (370 967)
Profit/(loss) before income tax expense 19 1 524 411 1 736 596 1 246 162 (187 290)
Income tax expense 20 513 090 (525 127)
Profit/(loss) for the period attributable to equity holders 2 037 501 1 211 469 1 246 162 (187 290)
Total comprehensive income/(loss) for the period 2 037 501 1 211 469 1 246 162 (187 290)
Basic earnings per share (cents) 703,69 444,85
Basic earnings per linked unit (cents) 839,92 700,66
Diluted earnings per share (cents) 703,69 427,87
Diluted earnings per linked unit (cents) 839,92 673,91

R e s i l i e n t P R o P e R t y i n c o m e F u n d INTEGRATED REPORT 2013 46
f o r t h e s i x m o n t h s e n d e d 3 0 J u n e 2 0 1 3
RECONCIlIATION OF PROFIT FOR THE PERIOd TO HEAdlINE EARNINGS ANd dISTRIbuTAblE INCOME
GROuPFor the
six monthsended
Jun 2013
For theyear
endedDec 2012
R’000 R’000
Basic earnings (shares) – profit for the period attributable to equity holders 2 037 501 1 211 469
– interest to linked debenture holders 394 446 696 633
Basic earnings (linked units) 2 431 947 1 908 102
Adjusted for: (1 494 470) (661 218)
– fair value gain on investment property (748 798) (1 010 616)
– income tax effect (745 672) 349 398
Headline earnings (linked units) 937 477 1 246 884
Straight-lining of rental revenue adjustment (11 387) (51 115)
Fair value gain on investments (541 489) (944 934)
Fair value loss on BEE instrument – 187 290
Fair value adjustment on interest rate derivatives (216 004) 92 104
Interest paid by BEE SPV (refer note 16) – 18 315
Income received by BEE SPV (refer note 16) – (27 640)
Deconsolidation of BEE SPV (refer note 16) (6 733) –
Income tax effect 232 582 175 729
Distributable income 394 446 696 633
Less: distribution declared (394 446) (696 633)
Income not distributed – –
Headline earnings per share (cents) 187,55 202,05
Headline earnings per linked unit (cents) 323,78 457,86
Diluted headline earnings per share (cents) 187,55 194,34
Diluted headline earnings per linked unit (cents) 323,78 440,38
Basic earnings per share, basic earnings per linked unit, headline earnings per share and headline earnings per linked unit are based on the weighted
average of 289 544 070 (2012: 272 329 259) shares/linked units in issue during the period.
Resilient has no dilutionary instruments in issue. For 2012 the diluted earnings per share, diluted earnings per linked unit, diluted headline earnings
per share and diluted headline earnings per linked unit were based on the weighted average of 283 140 070 shares/linked units in issue during
the year.
This is calculated as follows: GROuP
Jun 2013 Dec 2012
Weighted average number of shares and linked units in issue for basic earnings per share
and linked unit calculation 289 544 070 272 329 259
Potential dilutionary impact of the BEE transaction
(right to acquire shares in future at a predetermined price (refer note 16)) – 10 810 811
289 544 070 283 140 070

R e s i l i e n t P R o P e R t y i n c o m e F u n d INTEGRATED REPORT 2013 47
STATEMENTS OF CHANGES IN EquITy
f o r t h e s i x m o n t h s e n d e d 3 0 J u n e 2 0 1 3
Non-Share Share distributable Retained
capital premium reserves earnings TotalGROuP R’000 R’000 R’000 R’000 R’000
Balance at 31 December 2011 2 697 2 490 931 4 080 328 – 6 573 956
Issue of units 52 221 237 221 289
Total comprehensive income for the year 1 211 469 1 211 469
Transfer to non-distributable reserves 1 211 469 (1 211 469) –
Balance at 31 December 2012 2 749 2 712 168 5 291 797 – 8 006 714 Issue of 3 800 000 units on 7 March 2013 38 176 819 176 857 Recognition of units issued to BEE SPV (refer note 16) 108 142 270 (2 585) 139 793 Derecognition of BEE instrument (refer note 16) 337 640 337 640 Total comprehensive income for the period 2 037 501 2 037 501 Transfer to non-distributable reserves 2 037 501 (2 037 501) –Balance at 30 June 2013 2 895 3 031 257 7 664 353 – 10 698 505
Non-Share Share distributable Retained
capital premium reserves earnings TotalCOMPANy R’000 R’000 R’000 R’000 R’000
Balance at 31 December 2011 2 697 2 490 931 (150 894) – 2 342 734
Issue of units 52 221 237 221 289
Total comprehensive loss for the year (187 290) (187 290)
Transfer to non-distributable reserves (187 290) 187 290 –
Balance at 31 December 2012 2 749 2 712 168 (338 184) – 2 376 733 Issue of 3 800 000 units on 7 March 2013 38 176 819 176 857 Recognition of units issued to BEE SPV (refer note 16) 108 142 270 (2 585) 139 793 Derecognition of BEE instrument (refer note 16) 337 640 337 640 Total comprehensive income for the period 1 246 162 1 246 162 Transfer to non-distributable reserves 1 246 162 (1 246 162) –Balance at 30 June 2013 2 895 3 031 257 1 243 033 – 4 277 185

R e s i l i e n t P R o P e R t y i n c o m e F u n d INTEGRATED REPORT 2013 48
f o r t h e s i x m o n t h s e n d e d 3 0 J u n e 2 0 1 3
STATEMENTS OF CASH FlOwS
GROuP COMPANyFor the
six monthsended
Jun 2013
For the year
endedDec 2012
For the six months
ended Jun 2013
For the year
endedDec 2012
Note R’000 R’000 R’000 R’000
Operating activitiesCash generated from operations 21.1 541 154 957 512 433 521 758 808
Interest received on loans 39 622 75 975 19 367 34 502
Interest paid on borrowings (185 231) (365 137) (60 645) (99 628)
Interest paid to linked debenture holders 21.2 (370 967) (652 978) (370 967) (652 978)
Dividends received from group companies 1 246 162 –
Income tax paid 21.3 (2 344) (4 163)
Cash inflow from operating activities 22 234 11 209 1 267 438 40 704
Investing activitiesDevelopment and improvement of investment property (493 084) (570 592)
Unit purchase trust loans advanced (197 068) – (197 068) –
Unit purchase trust loans repaid 77 509 45 733 77 509 45 737
Loans to employees to acquire units in Capital repaid 101 236 33 352
Loans advanced to BEE partners (32 818) (194 315)
Development partner loans advanced (77 169) (12 508)
Acquisition of investments (541 668) (603 154)
Proceeds on disposal of investments 391 718 597 413
Increase in loans to subsidiaries (1 828 574) (1 530 496)
Decrease in loans to subsidiaries 292 562 793 998
Cash outflow from investing activities (771 344) (704 071) (1 655 571) (690 761)
Financing activitiesIncrease in interest-bearing borrowings 552 622 440 280 191 174 400 175
Raising of linked unit capital 196 959 249 882 196 959 249 882
Cash inflow from financing activities 749 581 690 162 388 133 650 057
Increase/(decrease) in cash and cash equivalents 471 (2 700) – –
Cash and cash equivalents at beginning of period 1 126 3 826 – –
Cash and cash equivalents at end of period 1 597 1 126 – –
Cash and cash equivalents consist of:
Current accounts 1 597 1 126 – –
The group has a total of R4 251 million (2012: R4 251 million) in secured property finance facilities and an approved domestic medium term note
(“DMTN”) programme of R3 000 million (2012: R2 000 million).
In total R2 798 million (2012: R2 419 million) of the secured property finance facilities and R1 994 million (2012: R1 804 million) of the DMTN
programme have been utilised. This disclosure excludes BEE SPV for 2012.

R e s i l i e n t P R o P e R t y i n c o m e F u n d INTEGRATED REPORT 2013 49
f o r t h e s i x m o n t h s e n d e d 3 0 J u n e 2 0 1 3
NOTES TO THE ANNuAl FINANCIAl STATEMENTS
REPORTING ENTITyResilient Property Income Fund Limited (the “company”) is a company domiciled in South Africa. The consolidated financial statements of the
company for the six months ended 30 June 2013 comprise the company, its subsidiaries, joint ventures, The Resilient Unit Purchase Trust and BEE SPV
(together referred to as the “group”). The financial statements were authorised for issue by the directors on 6 August 2013.
bASIS OF PREPARATIONBasis of measurementThe consolidated and separate financial statements (“financial statements”) are prepared on the historical-cost basis, except for investment property,
derivative financial instruments and financial instruments, designated as financial instruments at fair value through profit or loss, which are measured
at fair value.
Statement of complianceThe annual financial statements have been consistently prepared in accordance with International Financial Reporting Standards (“IFRS”) and its
interpretations adopted by the Independent Accounting Standards Board, the SAICA Financial Reporting Guides as issued by the Accounting Practices
Committee and Financial Reporting Pronouncements as issued by the Financial Reporting Standards Council and the requirements of the Companies
Act, 2008 (“the Act”) of South Africa.
The accounting policies are consistent with those applied in the prior periods with the exception of Standards and Interpretations that become
effective in the current period (mainly the amendments to IAS 1 and IFRS 10 to IFRS 13) and the disclosure regarding BEE SPV as described in note 16.
This report was compiled under the supervision of Nick Hanekom CA(SA), the financial director. These financial statements have been audited in
compliance with all applicable requirements of the Act.
FuNCTIONAl ANd PRESENTATION CuRRENCyThe financial statements are presented in Rand, which is also the functional currency of the group, rounded to its nearest thousand (R’000) unless
otherwise indicated.
uSE OF ESTIMATES ANd judGEMENTSThe preparation of financial statements in conformity with IFRS requires management to make judgements, estimates and assumptions that affect
the application of policies and reported amounts of assets and liabilities, income and expenses. The estimates and associated assumptions are based
on historical experience and various other factors that are believed to be reasonable under circumstances, the results of which form the basis of
making judgements about carrying amounts of assets and liabilities that are not readily apparent from other sources. Actual results may differ from
these estimates.
The estimates and underlying assumptions are reviewed on an ongoing basis. Revisions to accounting estimates are recognised in the period in which
the estimate is revised if the revision affects only that period, or the period of the revision and future periods if the revision affects both current and
future periods.
Judgements made by management in the application of IFRS that have a significant effect on the financial statements and estimates with a
significant risk of material adjustment in the next year are set out in note 29.
1 ACCOuNTING POlICIES The accounting policies set out below have been applied in preparing the financial statements for the six months ended 30 June 2013 and the
comparative information presented in these financial statements for the year ended 31 December 2012.
1.1 Basis of consolidation Subsidiaries Subsidiaries are those entities over which the group has the ability, either directly or indirectly, to govern the financial and operating policies so
as to obtain benefits from their activities.
In assessing control, potential voting rights that are presently exercisable are taken into account.
The group financial statements incorporate the assets, liabilities, operating results and cash flows of the company and its subsidiaries.
The results of subsidiaries acquired or disposed of during the period are included from the effective dates of acquisition and up to the effective dates
of disposal.
The accounting policies of the subsidiaries are consistent with those of the holding company.
In the company’s separate financial statements, investments in subsidiaries are stated at cost less accumulated impairment losses.
Special purpose entities The group has established special purpose entities (“SPEs”) for BEE and staff incentivisation purposes. The group does not have any direct or
indirect shareholdings in these entities. An SPE is consolidated if, based on an evaluation of the substance of its relationship with the group
and the SPEs risks and rewards, the group concludes that it controls the SPE. SPEs controlled by the group were established under terms that
impose strict limitations on the decision-making powers of the SPE management and that result in the group being exposed to risks incident to
the SPEs activities, and retaining the majority of the residual or ownership risks related to the SPE or its assets.

R e s i l i e n t P R o P e R t y i n c o m e F u n d INTEGRATED REPORT 2013 50
NOTES TO THE ANNuAl FINANCIAl STATEMENTS (CONTINuEd)
f o r t h e s i x m o n t h s e n d e d 3 0 J u n e 2 0 1 3
Joint ventures Joint ventures are those entities over whose activities the group has joint control, established by contractual agreement. The consolidated
financial statements include the group’s share of the assets and liabilities and total recognised gains and losses of joint arrangements on
a proportionately consolidated basis.
Transactions eliminated on consolidation Intragroup balances and any unrealised gains and losses arising from intragroup transactions are eliminated in preparing the consolidated
financial statements.
1.2 Investment property Investment property Investment properties are those held either to earn rental income or for capital appreciation or both but not for sale in the ordinary course of
business or for administration purposes.
The cost of investment property comprises the purchase price and directly attributable expenditure. Subsequent expenditure relating to
investment property is capitalised when it is probable that there will be future economic benefits from the use of the asset. All other subsequent
expenditure is recognised as an expense in the period in which it is incurred.
After initial recognition, investment properties are measured at fair value. Fair values are determined annually by external independent
professional valuers with appropriate and recognised professional qualifications and recent experience in the location and category of property
being valued. Valuations are done on the open market value basis and the valuers use either the discounted cash flow method or the capitalisation
of net income method or a combination of the methods. Gains or losses arising from changes in the fair values are included in profit or loss for
the period in which they arise. Unrealised gains, net of deferred tax, are transferred to a non-distributable reserve in the statement of changes in
equity. Unrealised losses, net of deferred tax, are transferred to a non-distributable reserve to the extent that the decrease does not exceed the
amount held in the non-distributable reserve.
Immediately prior to disposal of investment property the investment property is revalued to the net sales proceeds and such revaluation is
recognised in profit or loss during the period in which it occurs.
When the group redevelops an existing investment property for continued future use as investment property, the property remains classified as
investment property. The investment property is not reclassified as investment property under development during the redevelopment.
Investment property under development Property that is being constructed or developed for future use as investment property is classified as investment property under development
until construction or development is complete, at which time it is reclassified and subsequently accounted for as investment property. To the
extent that developments can be accurately fair valued, developments are carried at fair value.
All costs directly associated with the purchase and construction of a property, and all subsequent capital expenditures for the development
qualifying as acquisition costs, are capitalised.
Borrowing costs are capitalised to the extent that they are directly attributable to the acquisition, construction or production of a qualifying asset.
Capitalisation of borrowing costs commences when the activities to prepare the asset are in progress and expenditures and borrowing costs are being
incurred. Capitalisation of borrowing costs may continue until the assets are substantially ready for their intended use. If the resulting carrying amount
of the asset exceeds its recoverable amount, an impairment loss is recognised. The capitalisation rate is arrived at by reference to the actual rate
payable on borrowings for development purposes or, with regard to that part of development cost financed out of general funds, the weighted average
cost of borrowings.
Investment property held for sale Immediately before classification as held for sale, the measurement of the investment property is brought up to date in accordance with
applicable IFRS. Then, on initial classification as held for sale, the investment property continues to be recognised at fair value.
Leased property Leases in terms of which the group assumes substantially all the risks of ownership are classified as finance leases. The property acquired by way of
finance lease is stated at an amount equal to the lower of its fair value and the present value of the minimum lease payments at inception of the lease.
The property held under finance leases and leased out under operating leases is classified as investment property and stated at fair value.
Leases in terms of which the group does not assume substantially all the risks and rewards of ownership are classified as operating leases.
1.3 Financial instruments Financial instruments include cash and cash equivalents, investments in listed property securities, trade and other receivables, trade and other
payables and interest-bearing borrowings.
Recognition Financial instruments are initially measured at fair value which, except for financial instruments measured at fair value through profit and loss,
include directly attributable transaction costs.

R e s i l i e n t P R o P e R t y i n c o m e F u n d INTEGRATED REPORT 2013 51
Subsequent to initial recognition, financial instruments are measured as follows:
Cash and cash equivalents – Carried at amortised cost.
Investments – Carried at fair value, being the quoted closing price at the statement of financial position date, through profit
and loss.
Loans – Carried at amortised cost using the effective interest method net of impairment losses.
Trade and other receivables – Carried at amortised cost using the effective interest method net of impairment losses.
Trade and other payables – Carried at amortised cost using the effective interest method.
Interest-bearing borrowings – Carried at amortised cost using the effective interest method.
Derecognition
A financial asset (or, where applicable, a part of a financial asset or part of a group of similar financial assets) is derecognised where:
– the contractual rights to receive cash flows from the asset have expired;
– the group or company has transferred its rights to receive cash flows from the asset and either has transferred substantially all the risks and
rewards of the asset, or has neither transferred nor retained substantially all the risks and rewards of the asset, but has transferred control
of the asset.
A financial liability is derecognised when the obligation under the liability is discharged or cancelled or expires. Where an existing liability
is replaced by another from the same lender on substantially different terms, or the terms of an existing liability are substantially modified,
such an exchange or modification is treated as a derecognition of the original liability and the recognition of a new liability, and the difference
in the respective carrying amounts is recognised in profit or loss.
Offset
Financial assets and financial liabilities are offset and the net amount reported in the statement of financial position when the group and/or
company has a legally enforceable right to set off the recognised amounts, and intends either to settle on a net basis or to realise the asset and
settle the liability simultaneously.
1.4 Derivative financial instruments The group uses derivative financial instruments to hedge its exposure to interest rate risks arising from financing activities. In accordance with
its treasury policy, the group does not hold or issue derivative financial instruments for trading purposes. Derivatives used as hedges which do
not qualify as such in terms of hedge accounting rules, are accounted for as trading instruments.
In addition, the issue of shares to the BEE SPV has been classified as an option and dealt with as such in the financial statements (refer note 16).
Derivative financial instruments are recognised initially at fair value. Subsequent to initial recognition, derivative financial instruments are
measured at fair value, and changes therein are accounted for through profit or loss. Directly attributable transaction costs are recognised in profit
and loss when incurred.
The fair value of derivatives is the estimated amount that the group would receive or pay to terminate the derivative at the statement of
financial position date, taking into account the current relevant market conditions.
1.5 Intangible assets Intangible assets with finite useful lives are stated at cost less accumulated amortisation and accumulated impairment losses. Amortisation is
recognised in profit and loss on a straight-line basis over the estimated useful lives from the date they are available for use.
Intangible assets with an indefinite useful life are stated at cost less accumulated impairment losses and are tested for impairment annually.
1.6 Goodwill All business combinations are accounted for by applying the purchase method. Goodwill represents amounts arising on acquisition of subsidiaries
or businesses and comprises the difference between the cost of the acquisition and the fair value of the net identifiable assets, liabilities and
contingent liabilities acquired.
Goodwill is stated at cost less any accumulated impairment losses. Goodwill is allocated to cash-generating units and is tested annually for
impairment. A cash-generating unit is the smallest identifiable asset group that generates cash flows that are largely independent from other
assets and groups. Negative goodwill arising on acquisition is recognised directly in profit or loss.
Expenditure on internally generated goodwill and brands is recognised in profit or loss as incurred.
1.7 Impairment Non-financial assets
The carrying amounts of the group’s non-financial assets, other than investment property and deferred tax assets, are reviewed at each
statement of financial position date to determine whether there is any indication of impairment. If any such indication exists, the asset’s
recoverable amount is estimated.

R e s i l i e n t P R o P e R t y i n c o m e F u n d INTEGRATED REPORT 2013 52
NOTES TO THE ANNuAl FINANCIAl STATEMENTS (CONTINuEd)
f o r t h e s i x m o n t h s e n d e d 3 0 J u n e 2 0 1 3
The recoverable amount is estimated at each statement of financial position date for goodwill and intangible assets that have an indefinite
useful life and intangible assets that are not yet available for use.
An impairment loss is recognised whenever the carrying amount of an asset or its cash-generating unit exceeds its recoverable amount and is
recognised in profit or loss.
Impairment losses recognised are allocated first to reduce the carrying amount of any goodwill allocated to the cash-generating unit and then
to reduce the carrying amounts of the other assets in the unit on a pro rata basis.
The recoverable amount of an asset or a cash-generating unit is the greater of their fair value less cost to sell and their value in use. In assessing
value in use, the estimated future cash flows are discounted to their present value using the original effective pre-tax discount rate. For any asset
that does not generate largely independent cash flows, the recoverable amount is determined for the cash-generating unit to which the asset
belongs.
An impairment loss in respect of goodwill is not reversed. In respect of other assets, an impairment loss is reversed if there has been a change
in the estimates used to determine the recoverable amount and there is an indication that the impairment loss no longer exists.
An impairment loss is reversed only to the extent that the carrying amount of the asset does not exceed the carrying amount that would have
been determined, net of depreciation or amortisation, if no impairment loss had been recognised.
Financial assets A financial asset is considered to be impaired if objective evidence indicates that one or more events have had a negative effect on the estimated
future cash flows of that asset.
An impairment loss in respect of a financial asset measured at amortised cost is calculated as the difference between its carrying amount and
the present value of the estimated future cash flows discounted at the pre-tax discount rate that reflects current market assessments of the
time value of money and the risks specific to the asset. An impairment loss in respect of an available-for-sale financial asset is calculated by
reference to its current fair value.
Individually significant financial assets are tested for impairment on an individual basis. The remaining financial assets are assessed collectively
in groups that share similar credit characteristics.
All impairment losses are recognised in profit and loss.
An impairment loss is reversed if the subsequent increase in recoverable amount can be related objectively to an event occurring after the
impairment loss was recognised.
1.8 Cash and cash equivalents Cash and cash equivalents include cash balances, call deposits and short-term, highly liquid investments that are readily convertible to known amounts
of cash and which are subject to an insignificant risk of changes in value. Bank overdrafts that are repayable on demand and form an integral part
of the group’s cash management, are included as a component of cash and cash equivalents for the purpose of the statement of cash flows.
1.9 Share capital and share premium Ordinary shares are classified as equity. External costs directly attributable to the issue of new shares are shown as a deduction in equity from
the proceeds.
When share capital recognised as equity is repurchased, the amount of the consideration paid, including directly attributable costs, is recognised
as a change in equity. Repurchased shares are classified as treasury shares and presented as a deduction from total equity.
1.10 Linked debentures Linked debentures are designated as financial liabilities measured at amortised cost and are initially recognised at fair value.
1.11 Provisions Provisions are recognised when the group has legal or constructive obligations arising from past events, from which outflows of economic
benefits are probable, and where reliable estimates can be made of the amounts of the obligations. Where the effect of discounting is material,
provisions are discounted. The discount rate is a pre-tax rate that reflects current market assessments of the time value of money and,
where appropriate, the risks specific to the liability.
1.12 Revenue Revenue comprises rental revenue and recovery of expenses, excluding VAT. Rental revenue from investment property is recognised in profit or
loss on a straight-line basis over the term of the lease. Lease incentives granted are recognised as an integral part of the total rental revenue
over the lease period.
1.13 Expenses Service costs and property operating expenses Service costs for service contracts entered into and property operating expenses are expensed as incurred.

R e s i l i e n t P R o P e R t y i n c o m e F u n d INTEGRATED REPORT 2013 53
Lease payments Payments made under operating leases are recognised in profit or loss on a straight-line basis over the term of the lease. Lease incentives
received are recognised in profit or loss as an integral part of the total lease expense on a straight-line basis.
Payments under finance leases are apportioned between the finance charge and the reduction of the outstanding liability. The finance charge
is allocated to each period during the lease term so as to produce a constant periodic rate of interest on the remaining balance of the liability.
Contingent rents are charged as expenses in the periods in which they are incurred.
1.14 Finance income and finance costs Finance income comprises interest received on funds invested and loans advanced and is recognised in profit or loss as it accrues, taking into
account the effective yield on the asset.
Finance costs comprise interest payable on borrowings calculated using the effective interest method.
1.15 Dividend/distribution income Dividend/distribution income is recognised in the statement of comprehensive income on the date the group’s or company’s right to receive
payment is established, which in the case of quoted securities is usually the ex dividend date.
1.16 Income tax Income tax on the profit or loss for the year comprises current and deferred tax. Income tax is recognised in profit or loss except to the extent
that it relates to items recognised directly in equity, in which case it is recognised in equity.
Current tax is the expected tax payable on the taxable income for the year, using tax rates enacted or substantively enacted at the statement
of financial position date, and any adjustment to tax payable in respect of previous years.
Deferred tax is provided using the statement of financial position method, based on temporary differences between the carrying amounts of
assets and liabilities for financial reporting purposes and their tax bases. The amount of deferred tax provided is based on the expected manner
of realisation or settlement of the carrying amount of assets and liabilities, using tax rates enacted or substantively enacted at the statement
of financial position date.
The following temporary differences are not provided for: goodwill not deductible for tax purposes; the initial recognition of assets or liabilities
that affect neither accounting nor taxable profit; and differences relating to investments in subsidiaries to the extent that they will probably
not reverse in the foreseeable future.
A deferred tax asset is recognised only to the extent that it is probable that future taxable profits will be available against which the asset can
be utilised. Deferred tax assets are reduced to the extent that it is no longer probable that the related tax benefit will be realised.
1.17 Segmental reporting A segment is a distinguishable component of the group that is engaged either in providing services (business segment), or in providing services within
a particular economic environment (geographical segment), which is subject to risks and returns that are different from those of other segments.
The group’s primary segment is based on business segments. There are no secondary segments. The business segments are determined based on
the group’s management and internal reporting structure.
On a primary basis, the group operates in the retail segment.
The group will from time to time invest in/divest from certain primary segments, in which case segmental reporting will be adjusted to reflect
only the relevant operating segments.
Segment results include revenue and expenses directly attributable to a segment and the relevant portion of group revenue and expenses that
can be allocated on a reasonable basis to a segment. Segmental assets comprise those assets that are directly attributable to the segment or
can be allocated to the segment on a reasonable basis.
1.18 Employee benefits The cost of all short-term employee benefits is recognised during the period in which the employee renders the related service on an undiscounted
basis. The accrual for employee entitlements to salaries and annual leave represents the amount which the group has a present obligation to
pay as a result of employees’ services provided to the statement of financial position date. The group does not provide any retirement or post-
retirement benefits.
1.19 Related parties Related parties in the case of the group include any shareholder who is able to exert a significant influence on the operating policies of the group. Directors,
their close family members and any employee who is able to exert significant influence on the operating policies of the group are also considered to
be related parties. In the case of the company, related parties would also include subsidiaries, the BEE SPV and The Resilient Unit Purchase Trust.
1.20 Earnings per share and per linked unit The group presents basic and diluted earnings per share and per linked unit. It also presents headline and diluted headline earnings per share
and per linked unit.

R e s i l i e n t P R o P e R t y i n c o m e F u n d INTEGRATED REPORT 2013 54
NOTES TO THE ANNuAl FINANCIAl STATEMENTS (CONTINuEd)
f o r t h e s i x m o n t h s e n d e d 3 0 J u n e 2 0 1 3
Basic earnings per share is calculated by dividing profit for the year attributable to equity holders by the weighted average number of shares in
issue during the year.
Basic earnings per linked unit is calculated by dividing profit for the year attributable to equity holders plus interest paid to linked debenture
holders by the weighted average number of units in issue during the year.
Headline earnings per share is calculated by dividing headline earnings minus interest paid to linked debenture holders by the weighted average
number of linked units in issue during the year.
Headline earnings per linked unit is calculated by dividing headline earnings by the weighted average number of linked units in issue during the year.
Diluted earnings per share is calculated by dividing profit for the year attributable to equity holders by the weighted average number of shares
in issue, adjusted for the potential dilutive impact of outstanding shareholder options.
Diluted earnings per linked unit is calculated by dividing profit for the year attributable to equity holders plus interest paid to linked debenture
holders by the weighted average number of linked units in issue, adjusted for the potential dilutive impact of outstanding shareholder options.
Diluted headline earnings per share is calculated by dividing headline earnings minus interest paid to linked debenture holders by the weighted
average number of linked units in issue, adjusted for the potential dilutive impact of outstanding shareholder options.
Diluted headline earnings per linked unit is calculated by dividing headline earnings by the weighted average number of linked units in issue,
adjusted for the potential dilutive impact of outstanding shareholder options.
1.21 Accounting for black economic empowerment (“BEE”) transactions Where equity instruments are issued in terms of BEE transactions and the fair value of the equity instruments granted is greater than the fair
value of cash and other assets acquired, the difference between the fair value of the equity instruments and the fair value of cash and other
assets received is recognised in profit and loss.
2 FINANCIAl RISk MANAGEMENT The group has exposure to the following risks from its use of financial instruments:
– credit risk
– liquidity risk
– market risk
This note presents information about the group’s exposure to each of the above risks, the group’s objectives, policies and processes for measuring
and managing risk, and the group’s management of capital. Further quantitative disclosures are included throughout these financial statements.
The board of directors has overall responsibility for the establishment and oversight of the group’s risk management framework. The board has
delegated the responsibility for developing and monitoring the group’s risk management policies to the risk committee. The committee reports
to the board of directors on its activities. The group risk committee oversees how management monitors compliance with the group’s risk
management policies and procedures and reviews the adequacy of the risk management framework in relation to the risks faced by the group.
The group’s risk management policies are established to identify and analyse the risks faced by the group, to set appropriate risk limits and
controls and to monitor risks and adherence to limits. Risk management policies and systems are reviewed regularly to reflect changes in market
conditions and the group’s activities.
Credit risk Credit risk is the risk of financial loss to the group if a tenant or counterparty to a financial instrument fails to meet its contractual obligations, and
arises principally from the group’s receivables from tenants, loans, loans to development partners, investment securities and cash and cash equivalents.
Trade and other receivables The group’s exposure to credit risk is influenced mainly by the individual characteristics of each tenant. The group’s wide-spread customer base
reduces credit risk.
The majority of rental revenue is derived from retail properties situated in Gauteng, KwaZulu-Natal, Limpopo and Mpumalanga but there is no
concentration of credit risk.
Management has established a credit policy under which each new customer is analysed individually for creditworthiness before the group’s
standard payment terms and conditions are offered. When available, the group’s review includes external ratings.
Trade and other receivables relate mainly to the group’s tenants and deposits with municipalities. In monitoring customer credit risk, customers
are grouped according to their credit characteristics, including whether they are an individual or legal entity, industry, size of business and
existence of previous financial difficulties.
The group establishes an allowance for impairment that represents its estimate of incurred losses in respect of trade and other receivables and
investments. The main components of this allowance are a specific loss component that relates to individually significant exposures.

R e s i l i e n t P R o P e R t y i n c o m e F u n d INTEGRATED REPORT 2013 55
Resilient Unit Purchase Trust loans and loans to employees to acquire Capital units The group’s exposure to credit risk is influenced by the security provided for the loan and also the characteristics of all borrowers who are
employees of the group.
The group establishes an allowance for impairment that represents its estimate of specific losses to be incurred in the event of the borrowers’
inability to meet their commitments.
Loans to development partners In reducing credit risk attributable to loans to development partners, the group will register bonds over the properties as security for the
development partners’ outstanding loans.
Investments The group limits its exposure to credit risk by only investing in liquid securities and only with counterparties that are listed on a recognised stock
exchange.
Cash and cash equivalents The group’s exposure to credit risk is limited through the use of financial institutions of good standing for investment and cash handling purposes.
Sureties The group’s policy is to provide sureties with regard to subsidiaries to the extent required in the normal course of business. Such sureties are
provided to enable the subsidiaries to obtain the funding necessary to enable them to acquire investment property or investments. The company
provided a surety to the financiers of BEE SPV (refer note 16).
Liquidity risk Liquidity risk is the risk that the group will not be able to meet its financial obligations comprising linked debentures, interest-bearing borrowings
and trade and other payables, as they fall due. The group’s approach to managing liquidity is to ensure, as far as possible, that it always has
sufficient liquidity to meet its liabilities when due, under both normal and stressed conditions, without incurring unacceptable losses or risking
damage to the group’s reputation.
The group receives rental on a monthly basis and uses it to reduce its borrowings. Typically the group ensures that it has sufficient cash on
demand to meet expected operational expenses, including the servicing of financial obligations. This excludes the potential impact of extreme
circumstances that cannot reasonably be predicted, such as natural disasters.
Market risk Market risk is the risk that changes in market prices, such as foreign exchange rates, interest rates and equity prices will affect the group’s
income or the value of its holdings of financial instruments. The objective of market risk management is to manage and control market risk
exposures within acceptable parameters, while optimising the return.
The group enters into derivatives and also incurs financial liabilities in order to manage market risks. All such transactions are carried out within
the guidelines set by the risk committee.
Currency risk The group is indirectly exposed to currency risk through its investments in Nepi and Rockcastle. This exposure is partially hedged as the currency
position is considered to be long term in nature.
Interest rate risk The group is exposed to interest rate risk on its interest-bearing borrowings and cash and cash equivalents.
Interest-bearing borrowings and cash and cash equivalents bear interest at rates linked to prime/jibar. However, the group adopts a policy of
ensuring that at least 80% of its exposure to interest rates on borrowings is hedged. This is achieved by entering into interest rate swaps and
caps.
Equity price risk The group is exposed to equity price risk on its investments. It limits its exposure to equity price risk by only investing in liquid securities that
are listed on a recognised stock exchange and where the directors are in agreement with the business strategy implemented by such companies.
Fair values A number of the group’s accounting policies and disclosures require the determination of fair value, for both financial and non-financial assets
and liabilities. Fair values have been determined for measurement and/or disclosure purposes based on the following methods. When applicable,
further information about the assumptions made in determining fair values is disclosed in the notes specific to that asset or liability.

R e s i l i e n t P R o P e R t y i n c o m e F u n d INTEGRATED REPORT 2013 56
NOTES TO THE ANNuAl FINANCIAl STATEMENTS (CONTINuEd)
f o r t h e s i x m o n t h s e n d e d 3 0 J u n e 2 0 1 3
Investment property
An external, independent valuation company, having appropriate recognised professional qualifications and recent experience in the location
and category of property being valued, values the group’s investment property portfolio every year. The fair values are based on market values,
being the estimated amount for which a property could be exchanged on the date of the valuation between a willing buyer and a willing seller in
an arm’s length transaction after proper marketing wherein the parties had each acted knowledgeably, prudently and without compulsion. In the
absence of current prices in an active market, the valuations are prepared by considering the aggregate of the estimated cash flows expected to
be received from renting out the property. A yield that reflects the specific risks inherent in the net cash flows is then applied to the net annual
cash flows to arrive at the property valuation.
Valuations reflect, when appropriate: the type of tenants actually in occupation or responsible for meeting lease commitments or likely to be in
occupation after letting vacant accommodation, and the market’s general perception of their creditworthiness; the allocation of maintenance
and insurance responsibilities between the group and the lessee; and the remaining economic life of the property.
Investments
The fair value of financial assets at fair value through profit or loss is determined by reference to their quoted closing price at the reporting date.
Trade and other receivables
The fair value of trade and other receivables is estimated as the present value of future cash flows, discounted at the market rate of interest at
the reporting date.
Derivatives
The fair value of derivates is based on broker quotes. Those quotes are tested for reasonableness by discounting estimated future cash flows
based on the terms and maturity of each contract and using market interest rates for a similar instrument at the measurement date.
Non-derivative financial liabilities
Fair value, which is determined for disclosure purposes, is calculated based on the present value of future principal and interest cash flows,
discounted at the market rate of interest at the reporting date.
Capital management The group considers both the equity attributable to equity holders and linked debentures as the permanent capital of the group.
The board’s policy is to maintain a strong capital base so as to maintain investor, creditor and market confidence and to sustain future
development of the business. The board of directors also monitors the level of distributions to unitholders. The board seeks to maintain a balance
between the higher returns that might be possible with higher levels of borrowings and the advantages and security afforded by a sound capital
position. There were no changes in the group’s approach to capital management during the year. With the exception of PFM and Proptrax, which
have minimum capital adequacy requirements as determined by the Financial Services Board, neither the company nor any of its subsidiaries are
subject to externally imposed capital requirements.

R e s i l i e n t P R o P e R t y i n c o m e F u n d INTEGRATED REPORT 2013 57
GROuPJun 2013 Dec 2012
R'000 R'000
3 INVESTMENT PROPERTy, STRAIGHT-lINING OF RENTAl REVENuE AdjuSTMENT, INVESTMENT PROPERTy uNdER dEVElOPMENT ANd INVESTMENT PROPERTy HEld FOR SAlEInvestment in property comprises:Investment property 9 754 842 9 896 272
Straight-lining of rental revenue adjustment 172 337 173 474
9 927 179 10 069 746
Investment property held for sale 1 029 467 –
Straight-lining of rental revenue adjustment 12 524 –
10 969 170 10 069 746
Investment property under development 1 209 139 824 660
Total investment property 12 178 309 10 894 406
Details of the investment property are as follows:At cost 6 253 570 5 982 878
Cumulative revaluation 4 530 739 3 913 394
Straight-lining of rental revenue adjustment 184 861 173 474
Investment property at fair value 10 969 170 10 069 746
Movement in investment property is as follows:Carrying amount at beginning of period 10 069 746 8 881 736
Transfer from investment property under development 268 552 126 279
Revaluation adjustment 619 485 1 010 616
Straight-lining of rental revenue adjustment 11 387 51 115
10 969 170 10 069 746
Transfer to investment properties held for sale (at fair value) (1 041 991) –
9 927 179 10 069 746
Details of investment property under development are as follows:Carrying amount at beginning of period 824 660 346 376
Cost capitalised 490 599 566 866
Interest capitalised 33 119 37 697
Revaluation adjustment 129 313 –
Transfer to investment property (268 552) (126 279)
1 209 139 824 660
A register of investment property is available for inspection at the registered office of the company (refer pages 80 to 83).
There are no restrictions on the ability of the group to realise its investment property.
Investment property with a market value of R9 704 million (2012: R9 146 million) is mortgaged to secure borrowing facilities (refer note 15).
Commitments in respect of property developments and extensions are set out in note 23.
Investment properties were externally valued by Peter Parfitt of Quadrant Properties (Pty) Ltd, a professional associated valuer (Dip Val MIV (SA)).
The valuations were done on an open market basis and with consideration to the future earnings potential and an appropriate capitalisation rate for each property.
The fair value of all investment property determined is supported by market evidence. The valuations provided by the external valuer have been recorded without
adjustment.
Investment properties held for sale were valued at the net sale price, which is considered to be the fair value.
The valuation of investment property is classified as a level 3 fair value measurement and there has been no transfer between levels in the current period
(refer note 29 for the estimates used and judgements made).

R e s i l i e n t P R o P e R t y i n c o m e F u n d INTEGRATED REPORT 2013 58
NOTES TO THE ANNuAl FINANCIAl STATEMENTS (CONTINuEd)
f o r t h e s i x m o n t h s e n d e d 3 0 J u n e 2 0 1 3
Fortress RockcastleCapital Income New Europe Global Real
Property Fund Property EstateFund (B units) Investments Company Total
4 INVESTMENTSGroup Jun 2013Holding 9,57% 19,88%# 13,32% 17,36%
Price at 30 June (cents per unit) 1 064 850 6 699 1 345
R'000 R'000 R'000 R'000 R'000
Historical cost 834 887 63 153 548 076 670 984 2 117 100 Revaluation 744 632 463 565 842 800 134 914 2 185 911 Accrued distribution 57 445 8 782 30 651 11 525 108 403
1 636 964 535 500 1 421 527 817 423 4 411 414 Group Dec 2012Holding 11,28% 21,03%# 14,91% 15,71%
Price at 31 December (cents per unit) 1 057 700 5 300 1 010
R'000 R'000 R'000 R'000 R'000
Historical cost 985 837 63 153 542 778 186 724 1 778 492
Revaluation 861 176 369 770 571 360 29 978 1 832 284
Accrued distribution 69 328 8 077 26 296 5 498 109 199
1 916 341 441 000 1 140 434 222 200 3 719 975
#the effective voting rights in fortress are 9,94% (2012: 10,51%) in fortress B units.
None of the investments are pledged to secure borrowing facilities.
GROuPJun 2013 Dec 2012
R’000 R’000
5 INTANGIblE ASSETManagement contract
Cost 26 422 26 422
The intangible asset relates to the management contract of PFM, the management company of Capital Property Fund, and has an indefinite
useful life.
GROuP COMPANyJun 2013 Dec 2012 Jun 2013 Dec 2012
R’000 R’000 R’000 R’000
6 RESIlIENT uNIT PuRCHASE TRuST lOANSUnit purchase trust loans (refer note 22) 494 146 374 587 493 510 373 951
The unit purchase trust loans bear interest at the weighted average cost of funding of the group, being 8,24% (2012: 8,62%) at period end.
The loans are secured by 14 063 890 (2012: 13 809 400) linked units in Resilient with a fair value of R755,8 million (2012: R712,4 million).
The value of security held for each individual loan exceeds the amount of the related loan. The loans are repayable on the tenth anniversary of
the loans being granted.

R e s i l i e n t P R o P e R t y i n c o m e F u n d INTEGRATED REPORT 2013 59
GROuPJun 2013 Dec 2012
R’000 R’000
7 lOANS TO EMPlOyEES TO ACquIRE CAPITAl uNITSLoans to employees to acquire Capital units 144 661 196 829
Loans to directors to acquire Capital units – 49 068
144 661 245 897
The loans bear interest at the weighted average cost of funding of the group, being 8,24% (2012: 8,62%) at period end. The loans are secured
by 20 803 120 (2012: 35 943 420) units in Capital with a fair value of R221,3 million (2012: R379,9 million).
The value of security held for each individual loan exceeds the amount of the related loan. The loans are repayable on the tenth anniversary of
the loans being granted.
8 lOANS TO bEE PARTNERSLoan to Amber Peek Investments (Pty) Ltd (BEE vehicle) 107 687 99 541
Loan to Eagle's Eye Investments (Pty) Ltd (BEE vehicle – refer note 16) 6 461 –
Loan to The Resilient Education Trust (BEE charitable trust) 334 617 316 406
448 765 415 947
The loan to Amber Peek Investments (Pty) Ltd (BEE vehicle) bears interest at prime minus 1%, is unsecured and is repayable on 30 June 2019.
The loan to Eagle’s Eye Investments (Pty) Ltd (BEE vehicle) bears interest at prime minus 1,8%, is unsecured and is repayable on 30 June 2016.
The loan to The Resilient Education Trust (BEE charitable trust) bears interest at prime, is unsecured and R68,3 million (2012: R61,1 million) is
repayable on 30 June 2019 with the balance of R266,3 million (2012: R255,3 million) being repayable on 1 October 2022.
9 lOANS TO dEVElOPMENT PARTNERSLoans to development partners 214 927 137 758
Current portion included in current assets (24 867) (4 302)
190 060 133 456
The amounts owing by development partners are secured by mortgage bonds over investment property. The loans bear interest at rates of
between prime less 1,5% (2012: prime less 1,5%) and prime plus 3% (2012: prime plus 3%).

R e s i l i e n t P R o P e R t y i n c o m e F u n d INTEGRATED REPORT 2013 60
NOTES TO THE ANNuAl FINANCIAl STATEMENTS (CONTINuEd)
f o r t h e s i x m o n t h s e n d e d 3 0 J u n e 2 0 1 3
Effective interest Investment Amount owing by/(to)Jun 2013 Dec 2012 Jun 2013 Dec 2012 Jun 2013 Dec 2012
R’000 R’000 R’000 R’000
10 INTEREST IN SubSIdIARIES ANd jOINT VENTuRESSubsidiaries
Diversified Properties (Pty) Ltd# 100% 100%
Diversified Properties 2 (Pty) Ltd 100% 100% 353 264 353 264 1 938 922 745 876
Fortress Asset Managers (Pty) Ltd 100% 100% 1 1 (150) (33 213)
Indian Gold Investments (Pty) Ltd# 100% 100%
Property Fund Managers Ltd 100% 100% 3 687 3 687 – –
Property Index Tracker Managers (Pty) Ltd 100% 100% 1 261 1 261 – –
Quick Leap Investments 281 (Pty) Ltd 100% 100% 15 605 15 605 – –
Resilient Capital (Pty) Ltd# ## 100%
Resilient Mauritius Ltd# 100% –
Resilient Africa Real Estate Ltd#^ 100% –
Resilient Properties (Pty) Ltd 100% 100% * * 5 270 337 4 474 596
Resilient Properties 2 (Pty) Ltd 100% 100% * * – 292 562
373 818 373 818 7 209 109 5 479 821
Joint ventures
Arbour Town (Pty) Ltd# 10% 10%
Great Force Investments 112 (Pty) Ltd# 70% 70%
Maphumulo Investments (Pty) Ltd# 55% 55%
Pure Diamond Investments (Pty) Ltd 60%# 60% 1 591 – –
Southern Palace Investments 19 (Pty) Ltd# 66% 66%
– 1 591 – –
373 818 375 409 7 209 109 5 479 821
#share capital held through resilient Properties (Pty) Ltd, a wholly-owned subsidiary.##resilient Capital (Pty) Ltd was liquidated during the period (refer note 21.5). *Less than r1 000. ^standard Bank and shoprite Checkers will acquire 49% of this entity.
The company disposed of its interest in Pure Diamond Investments (Pty) Ltd (refer note 21.4).
The amounts owing by/(to) subsidiaries are unsecured, bear interest at rates agreed from time to time and the terms of repayment have not
been determined.
The company’s share of profits and losses of subsidiaries after tax amounts to R2 092,9 million (2012: R1 402,2 million) and R1 304,1 million
(2012: R3,4 million) respectively.

R e s i l i e n t P R o P e R t y i n c o m e F u n d INTEGRATED REPORT 2013 61
GROuP COMPANyJun 2013 Dec 2012 Jun 2013 Dec 2012
R’000 R’000 R’000 R’000
11 TRAdE ANd OTHER RECEIVAblESTrade and other receivables include the following:
Tenant arrears 11 422 8 454
Fair value of interest rate derivatives 81 700 14 140
Other receivables 49 686 40 202
142 808 62 796 – –
Unamortised interest rate derivative premium 15 538 18 290
VAT receivable 8 935 1 326
167 281 82 412 – –
12 SHARE CAPITAl ANd SHARE PREMIuMAuthorised
400 000 000 (2012: 400 000 000) ordinary shares of 1 cent each 4 000 4 000 4 000 4 000
issued
289 544 070 (2012: 274 933 259*) ordinary shares at 1 cent each 2 895 2 749 2 895 2 749
*excludes 10 810 811 shares issued to Bee sPV (refer note 16).
share premium 3 031 257 2 712 168 3 031 257 2 712 168
Each share is linked to a debenture, which together comprise a linked unit (refer note 14).
GROuP COMPANyJun 2013 Dec 2012 Jun 2013 Dec 2012
Shares Shares Shares Shares
Reconciliation of movement in issued shares:
Balance at beginning of period 274 933 259 269 725 259 274 933 259 269 725 259
Deconsolidation of BEE SPV (refer note 16) 10 810 811 – 10 810 811 –
Issued to The Resilient Unit Purchase Trust 3 800 000 – 3 800 000 –
Issued to The Resilient Education Trust (BEE charitable trust) – 5 208 000 – 5 208 000
289 544 070 274 933 259 289 544 070 274 933 259

R e s i l i e n t P R o P e R t y i n c o m e F u n d INTEGRATED REPORT 2013 62
NOTES TO THE ANNuAl FINANCIAl STATEMENTS (CONTINuEd)
f o r t h e s i x m o n t h s e n d e d 3 0 J u n e 2 0 1 3
13 NON-dISTRIbuTAblE RESERVESGroupNon-distributable reserves comprise those profits and losses that are not distributable to unitholders and are made up of revaluation adjustments
on investment property, investment property held for sale and investments, the share of post-acquisition reserves of associates, straight-lining
adjustments and other non-distributable balances.
CompanyNon-distributable reserves comprise those profits and losses that are not distributable or that will reduce future distributable profits to unitholders.
GROuP COMPANyJun 2013 Dec 2012 Jun 2013 Dec 2012
R’000 R’000 R’000 R’000
14 lINkEd dEbENTuRESSubordinated variable rate debentures of R4,80 each 1 389 812 1 371 572 1 389 812 1 371 572
Debentures issued to BEE SPV eliminated (refer note 16) – (51 892) – (51 892)
1 389 812 1 319 680 1 389 812 1 319 680
GROuP COMPANyJun 2013 Dec 2012 Jun 2013 Dec 2012
Debentures Debentures Debentures Debentures
Total debentures in issue 289 544 070 285 744 070 289 544 070 285 744 070
Debentures issued to BEE SPV eliminated (refer note 16) – (10 810 811) – (10 810 811)
289 544 070 274 933 259 289 544 070 274 933 259
The debentures bear interest at a rate of not less than 99% of the net profit as defined in the debenture trust deed. Interest is payable six monthly.
The debentures are redeemable:
– After 25 years from date of allotment subject to a special resolution with redemption taking place five years after the date of the special
resolution;
– At the option of the company subject to compliance with statutes and the requirements of the JSE Ltd, as applicable; or
– Immediately at the option of the trustee if the company fails to adhere to the terms of the debenture trust deed, commits an act of insolvency
or disposes of, or attempts to dispose of the whole or substantially the whole of its undertaking.
The rights of debenture holders to repayment are subordinated in favour of the claims of other creditors.
Each debenture is indivisibly linked to one ordinary share in the share capital of the company.

R e s i l i e n t P R o P e R t y i n c o m e F u n d INTEGRATED REPORT 2013 63
15 INTEREST-bEARING bORROwINGSThe group has entered into the following loan agreements which, together with linked unitholder capital, are used to fund its investment
activities. The Memorandum of Incorporation of the company allows the group to have borrowings of up to 60% of total asset value.
Interest-bearing loans and borrowings are measured at amortised cost. The group’s exposure to interest rate, foreign currency and liquidity risk
is discussed in note 28. Jun 2013 Dec 2012
Fair Carrying Fair CarryingNominal Date of value amount value amount
Group interest rate maturity R’000 R’000 R’000 R’000
DMTN programme:
3 months 3-month Jibar plus 0,23% January 2013 253 731 253 731
DMTN programme:
3 months (7) 3-month Jibar plus 0,22% February 2013 251 741 251 741
Standard Bank (1) 1-month Jibar plus 1,60% March 2013 390 000 390 000
Standard Bank (1) 1-month Jibar plus 1,61% March 2013 120 250 120 250
Standard Bank (1) Prime less 1,80% March 2013 193 012 193 012
DMTN programme:
3 months (7) 3-month Jibar plus 0,22% July 2013 253 039 253 039 – –
DMTN programme:
3 months (7) 3-month Jibar plus 0,22% August 2013 251 721 251 721 – –
DMTN programme: 1 year 3-month Jibar plus 0,69% October 2013 273 785 273 785 273 795 273 795
DMTN programme: 3 years 3-month Jibar plus 1,45% June 2014 226 135 226 135 226 175 226 175
DMTN programme: 3 years 3-month Jibar plus 1,55% October 2014 354 737 354 737 354 765 354 765
DMTN programme: 3 years 3-month Jibar plus 1,45% August 2015 166 248 166 248 166 239 166 239
Nedbank (4) Prime less 2,30% February 2016 110 000 110 000 109 972 109 972
Rand Merchant Bank (2) 3-month Jibar plus 1,69% March 2016 – – 524 279 524 279
Nedbank (5) Prime less 1,80% June 2016 – – 166 044 166 044
Rand Merchant Bank (2) 3-month Jibar plus 1,73% July 2016 582 000 582 000 – –
Rand Merchant Bank (2) Prime less 1,57% July 2016 69 674 69 674 – –
Rand Merchant Bank (2) 3-month Jibar plus 1,60% September 2016 – – 267 750 267 750
Rand Merchant Bank (2) 3-month Jibar plus 1,53% September 2016 269 324 269 324 – –
Standard Bank (1) Prime less 1,65% March 2017 – – 432 250 432 250
Standard Bank (1) Prime less 1,65% June 2017 432 250 432 250 – –
DMTN programme: 5 years (7) 3-month Jibar plus 1,70% November 2017 296 694 296 694 296 729 296 729
Standard Bank (6) Prime less 1,50% February 2018 – – 35 477 35 477
DMTN programme: 5 years (7) 3-month Jibar plus 1,70% February 2018 191 990 191 990 – –
Rand Merchant Bank (2) 3-month Jibar plus 1,60% June 2018 90 000 90 000 – –
Standard Bank (1) 3-month Jibar plus 1,65% August 2018 392 500 392 500 – –
Standard Bank (1) Prime less 1,75% August 2018 392 500 392 500 – –
Standard Bank (6) Prime less 1,50% August 2018 64 199 64 199 – –
Nedbank (3) Prime less 2,30% December 2018 52 980 52 980 52 980 52 980
Nedbank (3) Prime less 2,30% April 2019 74 160 74 160 74 160 74 160
Nedbank (3) Prime less 1,75% September 2019 68 970 68 970 69 353 69 353
Nedbank (3) Prime less 1,75% October 2019 178 800 178 800 178 800 178 800
4 791 706 4 791 706 4 437 502 4 437 502
Current portion included in current liabilities (1 004 680) (1 004 680) (1 482 529) (1 482 529)
3 787 026 3 787 026 2 954 973 2 954 973

R e s i l i e n t P R o P e R t y i n c o m e F u n d INTEGRATED REPORT 2013 64
NOTES TO THE ANNuAl FINANCIAl STATEMENTS (CONTINuEd)
f o r t h e s i x m o n t h s e n d e d 3 0 J u n e 2 0 1 3
15 INTEREST-bEARING bORROwINGS (CONTINuEd)
Investmentproperty Investments Total
R’000 R’000 R’000
Interest-bearing borrowings are secured by the following:Group Jun 2013Standard Bank (1) 3 830 700 – 3 830 700 Nedbank (3), (4) 1 838 360 – 1 838 360 Rand Merchant Bank (2) 4 035 100 – 4 035 100
9 704 160 – 9 704 160 Group Dec 2012Standard Bank (1) 3 489 800 – 3 489 800
Nedbank (3), (4) 1 502 370 – 1 502 370
Rand Merchant Bank (2) 4 153 650 – 4 153 650
9 145 820 – 9 145 820
The financial assets have been pledged under the following terms:
(1) – The total overall consolidated debt may not exceed 50% of total consolidated assets.
– Earnings before interest, tax, depreciation and amortisation (“EBITDA”) to net interest payable in respect of all debt on a consolidated
basis may not be less than 2 times.
– The loan-to-value (“LTV”) ratio may not exceed 60%.
– EBITDA from the properties serving as security for the loan, to net interest payable in respect of the loan facility, may not be less than
1,3 times.
(2) – The interest-bearing debt to asset ratio may not exceed 55%.
– The facility outstanding mortgaged asset value ratio may not exceed 50%.
– The total interest cover ratio may not be less than 2 times.
– The facility interest cover ratio may not be less than 1,75 times.
– A net asset value of R3,5 billion must be maintained at all times.
(3) – The LTV ratio may not exceed 60%.
– EBITDA, excluding revaluation gains on investment property, to net interest, excluding debenture interest, may not be less than 1,3 times.
(4) – The LTV ratio may not exceed 60%.
– EBITDA to net interest, excluding debenture interest, may not be less than 1,35 times.
(5) – The LTV ratio may not exceed 85%.
(6) – General banking facility.
(7) – The LTV ratio may not exceed 50%.
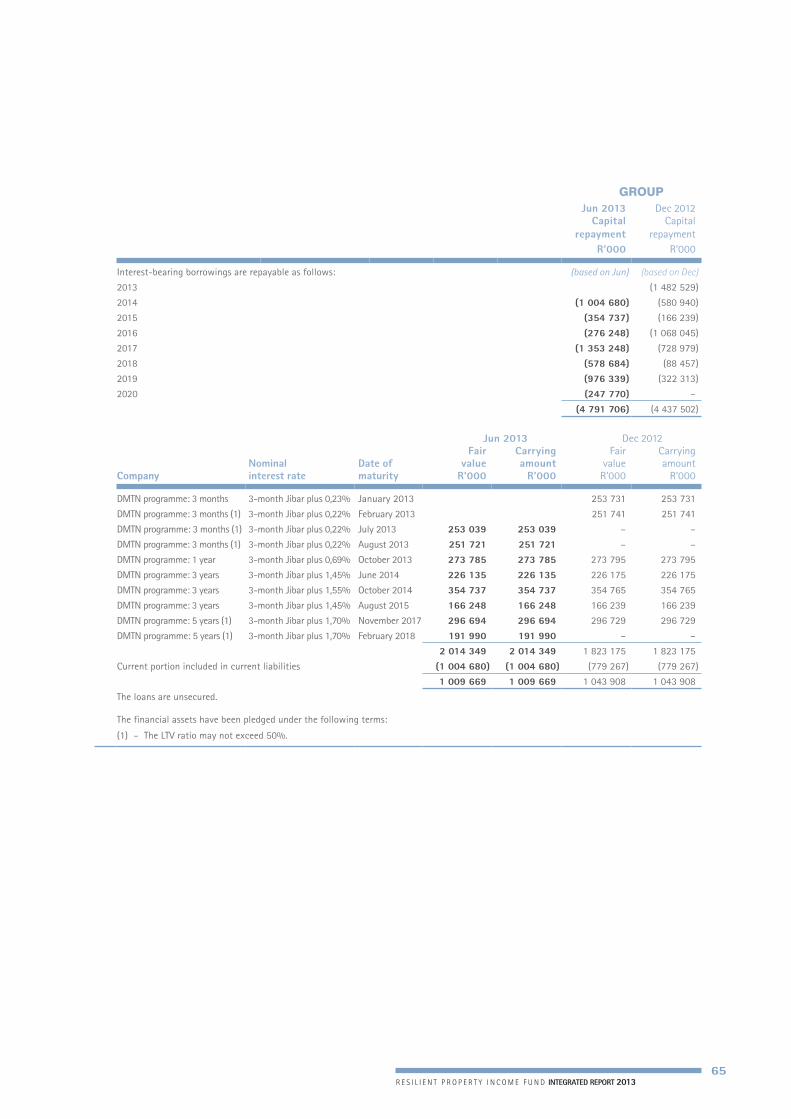
R e s i l i e n t P R o P e R t y i n c o m e F u n d INTEGRATED REPORT 2013 65
GROuPJun 2013 Dec 2012
Capitalrepayment
Capitalrepayment
R’000 R’000
Interest-bearing borrowings are repayable as follows: (based on Jun) (based on dec)
2013 (1 482 529)
2014 (1 004 680) (580 940)
2015 (354 737) (166 239)
2016 (276 248) (1 068 045)
2017 (1 353 248) (728 979)
2018 (578 684) (88 457)
2019 (976 339) (322 313)
2020 (247 770) –
(4 791 706) (4 437 502)
Jun 2013 Dec 2012Fair Carrying Fair Carrying
Nominal Date of value amount value amountCompany interest rate maturity R’000 R’000 R’000 R’000
DMTN programme: 3 months 3-month Jibar plus 0,23% January 2013 253 731 253 731
DMTN programme: 3 months (1) 3-month Jibar plus 0,22% February 2013 251 741 251 741
DMTN programme: 3 months (1) 3-month Jibar plus 0,22% July 2013 253 039 253 039 – –
DMTN programme: 3 months (1) 3-month Jibar plus 0,22% August 2013 251 721 251 721 – –
DMTN programme: 1 year 3-month Jibar plus 0,69% October 2013 273 785 273 785 273 795 273 795
DMTN programme: 3 years 3-month Jibar plus 1,45% June 2014 226 135 226 135 226 175 226 175
DMTN programme: 3 years 3-month Jibar plus 1,55% October 2014 354 737 354 737 354 765 354 765
DMTN programme: 3 years 3-month Jibar plus 1,45% August 2015 166 248 166 248 166 239 166 239
DMTN programme: 5 years (1) 3-month Jibar plus 1,70% November 2017 296 694 296 694 296 729 296 729
DMTN programme: 5 years (1) 3-month Jibar plus 1,70% February 2018 191 990 191 990 – –
2 014 349 2 014 349 1 823 175 1 823 175
Current portion included in current liabilities (1 004 680) (1 004 680) (779 267) (779 267)
1 009 669 1 009 669 1 043 908 1 043 908
The loans are unsecured.
The financial assets have been pledged under the following terms:
(1) – The LTV ratio may not exceed 50%.

R e s i l i e n t P R o P e R t y i n c o m e F u n d INTEGRATED REPORT 2013 66
NOTES TO THE ANNuAl FINANCIAl STATEMENTS (CONTINuEd)
f o r t h e s i x m o n t h s e n d e d 3 0 J u n e 2 0 1 3
16 bEE INSTRuMENTOn 27 June 2006 10 810 811 linked units were issued to Eagle’s Eye Investments (Pty) Ltd (“BEE SPV”) and Resilient is standing surety for the
funding obligations of BEE SPV in acquiring these units. In terms of IFRS the issue did not take place and the essence of the transaction was that
the BEE shareholders received a right/option to acquire linked units in Resilient at a future date at a predetermined price. As a consequence,
the issue of linked units has been eliminated in the preparation of the 2012 financial statements.
This BEE transaction matures in three equal tranches on 30 June 2014, 30 June 2015 and 30 June 2016. Due to the positive equity in this scheme
and the minimal residual risk resulting from Resilient’s surety, the board has taken the view that the units are in issue and has therefore reversed
the effect of the option/right in the 2013 financial statements.
GROuP COMPANyJun 2013 Dec 2012 Jun 2013 Dec 2012
R’000 R’000 R’000 R’000
Fair value of the option – 337 640 – 337 640
For 2012 the value of the option was calculated using the Black-Scholes call option valuation method (to price a European option) and was
based on the following assumptions:
– Option expiry date of 30 June 2014 (one third), 30 June 2015 (one third) and 30 June 2016 (one third).
– Volatility estimate of 3,95% per annum based on historic volatility of Resilient.
– Dividend assumption of 0%.
– The strike price was calculated using an interest rate of prime less 1,8% on the funding component.
The following table indicates the effect of the BEE transaction on the group financial statements (the column “Property operations” indicates
Resilient’s results had the BEE transaction been accounted for as an issue for value):Property
Consolidated BEE SPV operationsR’000 R’000 R’000
Group – Dec 2012Statement of comprehensive incomeFair value loss on BEE instrument (187 290) 187 290 –Finance costs– Interest on borrowings (365 137) 18 315 (346 822)– Interest to linked debenture holders (696 633) (27 640) (724 273)Income tax expense (525 127) 228 (524 899)Statement of financial positionCurrent assets – Trade and other receivables 82 412 (1 751) 80 661 Share capital 2 749 108 2 857 Share premium 2 712 168 142 270 2 854 438 Non-distributable reserves 5 291 797 341 788 5 633 585 Non-current liabilities– Linked debentures 1 319 680 51 892 1 371 572 – Interest-bearing borrowings (non-current and current) 4 437 502 (214 420) 4 223 082 BEE instrument 337 640 (337 640) –Current liabilities– Trade and other payables 359 021 (336) 358 685 – Linked debenture interest payable 370 967 14 587 385 554
The above has no effect on the group’s cash flow or the distribution payable to linked unitholders in terms of the Debenture Trust Deed.
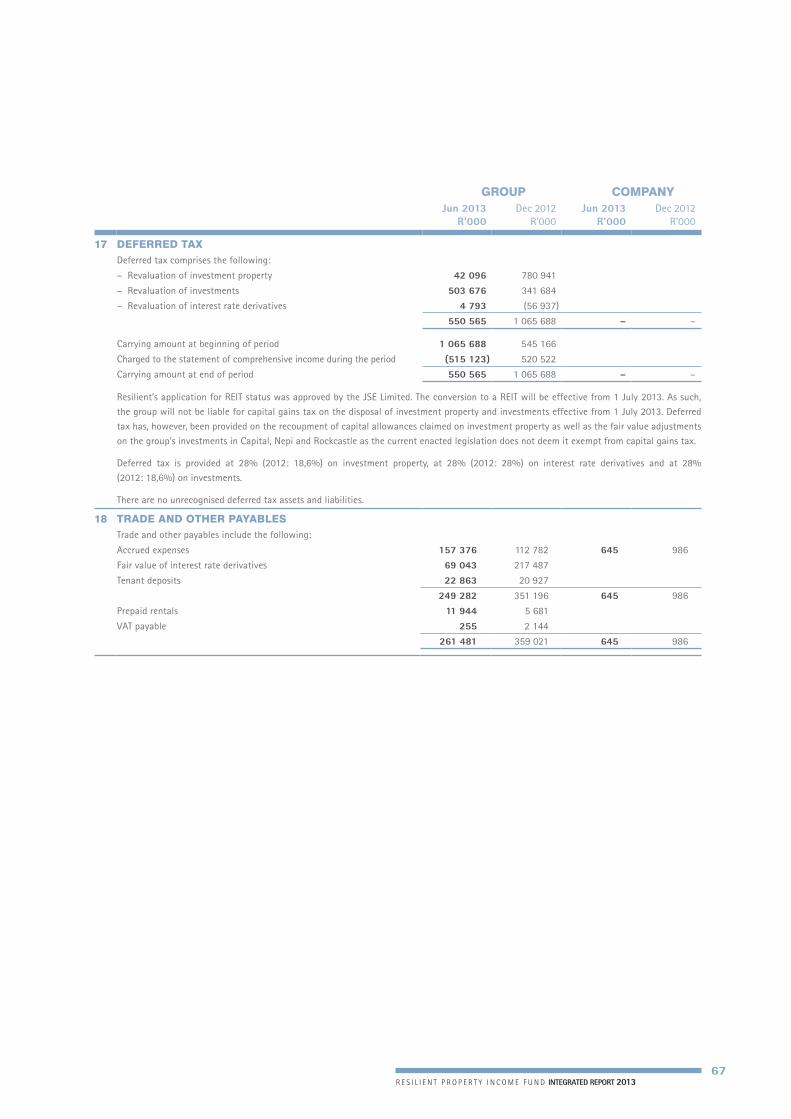
R e s i l i e n t P R o P e R t y i n c o m e F u n d INTEGRATED REPORT 2013 67
GROuP COMPANyJun 2013 Dec 2012 Jun 2013 Dec 2012
R’000 R’000 R’000 R’000
17 dEFERREd TAxDeferred tax comprises the following:
– Revaluation of investment property 42 096 780 941
– Revaluation of investments 503 676 341 684
– Revaluation of interest rate derivatives 4 793 (56 937)
550 565 1 065 688 – –
Carrying amount at beginning of period 1 065 688 545 166
Charged to the statement of comprehensive income during the period (515 123) 520 522
Carrying amount at end of period 550 565 1 065 688 – –
Resilient’s application for REIT status was approved by the JSE Limited. The conversion to a REIT will be effective from 1 July 2013. As such,
the group will not be liable for capital gains tax on the disposal of investment property and investments effective from 1 July 2013. Deferred
tax has, however, been provided on the recoupment of capital allowances claimed on investment property as well as the fair value adjustments
on the group’s investments in Capital, Nepi and Rockcastle as the current enacted legislation does not deem it exempt from capital gains tax.
Deferred tax is provided at 28% (2012: 18,6%) on investment property, at 28% (2012: 28%) on interest rate derivatives and at 28%
(2012: 18,6%) on investments.
There are no unrecognised deferred tax assets and liabilities.
18 TRAdE ANd OTHER PAyAblESTrade and other payables include the following:
Accrued expenses 157 376 112 782 645 986
Fair value of interest rate derivatives 69 043 217 487
Tenant deposits 22 863 20 927
249 282 351 196 645 986
Prepaid rentals 11 944 5 681
VAT payable 255 2 144
261 481 359 021 645 986

R e s i l i e n t P R o P e R t y i n c o m e F u n d INTEGRATED REPORT 2013 68
NOTES TO THE ANNuAl FINANCIAl STATEMENTS (CONTINuEd)
f o r t h e s i x m o n t h s e n d e d 3 0 J u n e 2 0 1 3
GROuP COMPANyJun 2013 Dec 2012 Jun 2013 Dec 2012
R’000 R’000 R’000 R’000
19 PROFIT/(lOSS) bEFORE INCOME TAx ExPENSEProfit/(loss) before income tax expense is stated after charging:
Auditors’ remuneration
– audit fee (830) (910) (46) (46)
– other services (23) (17) (7) –
Directors’ remuneration
– services as director (non-executive) (1 597) (2 864) (1 597) (2 864)
– other services (executive) (6 182) (11 735)
Amortisation of tenant installation (2 382) (3 511)
Amortisation of letting commission (103) (215)
Property administration fees (11 156) (20 987)
Employee cost (excluding executive directors) (31 748) (50 511)
20 INCOME TAx ExPENSESouth African normal tax– current tax current period (2 033) (4 605)
– deferred tax current period 515 123 (520 522)
513 090 (525 127) – –
Reconciliation of tax rateStandard tax rate 28,00% 28,00% 28,00% 28,00%
Capital gains tax rate differential (1,06)% (16,00)%
Capital gains tax rate differential – change in tax rate – 15,80%
Tax rate differential – REIT conversion (59,17)% –
BEE option – 3,02% (28,00)% (28,00)%
Permanent differences (1,43)% (0,87)%
Other – 0,29% – –
Effective tax rate (33,66)% 30,24% – –

R e s i l i e n t P R o P e R t y i n c o m e F u n d INTEGRATED REPORT 2013 69
GROuP COMPANyJun 2013 Dec 2012 Jun 2013 Dec 2012
R’000 R’000 R’000 R’000
21 NOTES TO THE STATEMENTS OF CASH FlOwS21.1 Cash generated from operations
Profit/(loss) before income tax expense 1 524 411 1 736 596 1 246 162 (187 290)
Adjusted for:
Fair value gain on investment property (760 185) (1 061 731)
Fair value gain on investments (541 489) (944 934)
Fair value loss on BEE instrument – 187 290 – 187 290
Deconsolidation of BEE SPV (6 733) –
Dividends received from group companies (1 246 162) –
Interest received on loans (39 622) (75 975) (19 367) (34 502)
Fair value adjustment on interest rate derivatives (216 004) 92 104
Interest on linked units issued cum distribution (1 862) (3 594) (1 862) (3 594)
Interest paid on borrowings 185 231 365 137 60 645 99 628
Capitalised interest (33 119) (37 697)
Interest to linked debenture holders 394 446 696 633 394 446 696 633
Amortisation of tenant installation 2 382 3 511
Amortisation of letting commission 103 215
507 559 957 555 433 862 758 165
Changes in working capital
Increase in trade and other receivables (17 309) (32 145) – –
Increase/(decrease) in trade and other payables 50 904 32 102 (341) 643
541 154 957 512 433 521 758 808
21.2 Interest paid to linked debenture holdersLinked debenture interest payable at beginning of period (370 967) (327 312) (370 967) (327 312)
Charged to statement of comprehensive income during the period (394 446) (696 633) (394 446) (696 633)
Linked debenture interest payable at end of period 394 446 370 967 394 446 370 967
(370 967) (652 978) (370 967) (652 978)
21.3 Income tax paidIncome tax payable at beginning of period (1 318) (876)
Charged to statement of comprehensive income during the period (2 033) (4 605)
Income tax payable at end of period 1 007 1 318
(2 344) (4 163)
21.4 Disposal of subsidiaryProceeds received 1 591 –
Decrease in loans to subsidiaries (1 591) –
– – – –
The company disposed of its interest in Pure Diamond Investments (Pty) Ltd.

R e s i l i e n t P R o P e R t y i n c o m e F u n d INTEGRATED REPORT 2013 70
NOTES TO THE ANNuAl FINANCIAl STATEMENTS (CONTINuEd)
f o r t h e s i x m o n t h s e n d e d 3 0 J u n e 2 0 1 3
22 THE RESIlIENT uNIT PuRCHASE TRuSTUnitholders adopted The Resilient Unit Purchase Trust (“the Trust”) Deed at a special meeting on 2 June 2004. In terms of the rules of the Trust,
the maximum number of linked units which may be granted to the participants shall be limited to 30 000 000 (2012: 30 000 000).
Jun 2013 Dec 2012
% of issued Number of % of issued Number of linked units linked units linked units linked units
Maximum linked units available to the Trust in terms of the Trust deed 10,4% 30 000 000 10,5% 30 000 000
Issued to the Trust through loan account 4,9% (14 063 890) 5,8% (16 653 000)
Previously issued to the Trust, repaid and not available for reissue 4,0% (11 627 910) 1,8% (5 238 800)
Units available but unissued 4 308 200 8 108 200
The participants in the Trust carry the risk associated with the linked units issued to them.
Details of the linked units granted to directors as at 30 June 2013 are as follows:Employee
asset asNumber Date Issue recorded inof units of price the Trust
issued issue Rand R’000
Des de Beer 110 000 12 Sep 08 20,05 2 206 240 000 11 May 09 22,04 5 290 200 000 8 Mar 10 25,18 5 036 240 000 9 Mar 11 28,80 6 912 600 000 10 Nov 11 33,36 20 016 500 000 7 Mar 13 51,86 25 930
Andries de Lange 40 000 12 Sep 08 20,05 802 32 000 11 May 09 22,04 705 80 000 8 Mar 10 25,18 2 014
150 000 9 Mar 11 28,80 4 320 498 890 10 Nov 11 33,36 16 643 400 000 7 Mar 13 51,86 20 744
Nick Hanekom 50 000 11 May 09 22,04 1 102 110 000 8 Mar 10 25,18 2 770 200 000 9 Mar 11 28,80 5 760 350 000 10 Nov 11 33,36 11 676 200 000 7 Mar 13 51,86 10 372
Johann Kriek 100 000 12 Sep 08 20,05 2 005 125 000 11 May 09 22,04 2 755 100 000 8 Mar 10 25,18 2 518 250 000 9 Mar 11 28,80 7 200 20 000 10 Nov 11 33,36 667
300 000 7 Mar 13 51,86 15 558
GROuP COMPANyJun 2013 Dec 2012 Jun 2013 Dec 2012
R’000 R’000 R’000 R’000
23 CAPITAl COMMITMENTSApproved and contracted for 637 800 884 387 – –Approved and not contracted for 158 400 522 707 – –
The expenditure relates to property developments and extensions to properties and will be funded by borrowings and the disposal of investments.

R e s i l i e n t P R o P e R t y i n c o m e F u n d INTEGRATED REPORT 2013 71
24 CONTINGENT lIAbIlITIESThere are no contingent liabilities.
GROuPJun 2013 Dec 2012
R’000 R’000
25 OPERATING lEASE RENTAlS (based on Jun) (based on dec)
Contractual rental revenue from tenants can be analysed as follows:
Within one year 922 313 799 877
Within two to five years 2 206 751 1 966 319
More than five years 711 507 660 692
3 840 571 3 426 888
Corporate Retail TotalR’000 R’000 R’000
26 SEGMENTAl REPORTINGSegmental statement of financial position at 30 June 2013Investment property and investment property under development – 11 136 318 11 136 318 Investments 4 411 414 4 411 414 Intangible asset 26 422 26 422 Resilient Unit Purchase Trust loans 494 146 494 146 Loans to employees to acquire Capital units 144 661 144 661 Loans to BEE partners 448 765 448 765 Loans to development partners 214 927 214 927 Investment property held for sale – 1 041 991 1 041 991 Trade and other receivables 155 859 11 422 167 281 Cash and cash equivalents 495 1 102 1 597 Total assets 5 896 689 12 190 833 18 087 522
Due to the pooling of funds, disclosure of segmental liabilities will all be included under corporate.
Segmental statement of comprehensive income for the six months ended 30 June 2013Recoveries and contractual rental revenue – 614 250 614 250 Straight-lining of rental revenue adjustment 11 387 11 387 Segment revenue – 625 637 625 637 Property operating expenses (219 017) (219 017)Net rental and related revenue – 406 620 406 620 Distributable income from investments 113 775 113 775 Fair value gain on investment property net of adjustment
resulting from straight-lining of rental revenue – 748 798 748 798 Fair value gain on investments 541 489 541 489 Management fees received from PFM 42 821 42 821 Administrative expenses (46 755) (46 755)Deconsolidation of BEE SPV 6 733 6 733 Total segment result 658 063 1 155 418 1 813 481
Segmental capital expenditure – 490 599 490 599

R e s i l i e n t P R o P e R t y i n c o m e F u n d INTEGRATED REPORT 2013 72
NOTES TO THE ANNuAl FINANCIAl STATEMENTS (CONTINuEd)
f o r t h e s i x m o n t h s e n d e d 3 0 J u n e 2 0 1 3
Corporate Retail TotalR’000 R’000 R’000
26 SEGMENTAl REPORTING (CONTINuEd)
Segmental statement of financial position at 31 December 2012Investment property and investment property under development – 10 894 406 10 894 406
Investments 3 719 975 3 719 975
Intangible asset 26 422 26 422
Resilient Unit Purchase Trust loans 374 587 374 587
Loans to employees to acquire Capital units 245 897 245 897
Loans to BEE partners 415 947 415 947
Loans to development partners 137 758 137 758
Trade and other receivables 73 958 8 454 82 412
Cash and cash equivalents 390 736 1 126
Total assets 4 994 934 10 903 596 15 898 530
Due to the pooling of funds, disclosure of segmental liabilities will all be included under corporate.
Segmental statement of comprehensive income for the year ended 31 December 2012Recoveries and contractual rental revenue – 1 140 230 1 140 230
Straight-lining of rental revenue adjustment 51 115 51 115
Segment revenue – 1 191 345 1 191 345
Property operating expenses (397 568) (397 568)
Net rental and related revenue – 793 777 793 777
Distributable income from investments 210 718 210 718
Fair value gain on investment property net of adjustment
resulting from straight-lining of rental income – 1 010 616 1 010 616
Fair value gain on investments 944 934 944 934
Fair value loss on BEE instrument (187 290) (187 290)
Management fees received from PFM 79 065 79 065
Administrative expenses (78 616) (78 616)
Total segment result 968 811 1 804 393 2 773 204
Segmental capital expenditure – 566 866 566 866
27 SubSEquENT EVENTSThe directors are not aware of any other events subsequent to 30 June 2013, not arising in the normal course of business, which are likely to
have a material effect on the financial information contained in this report, other than as disclosed in the directors’ report.
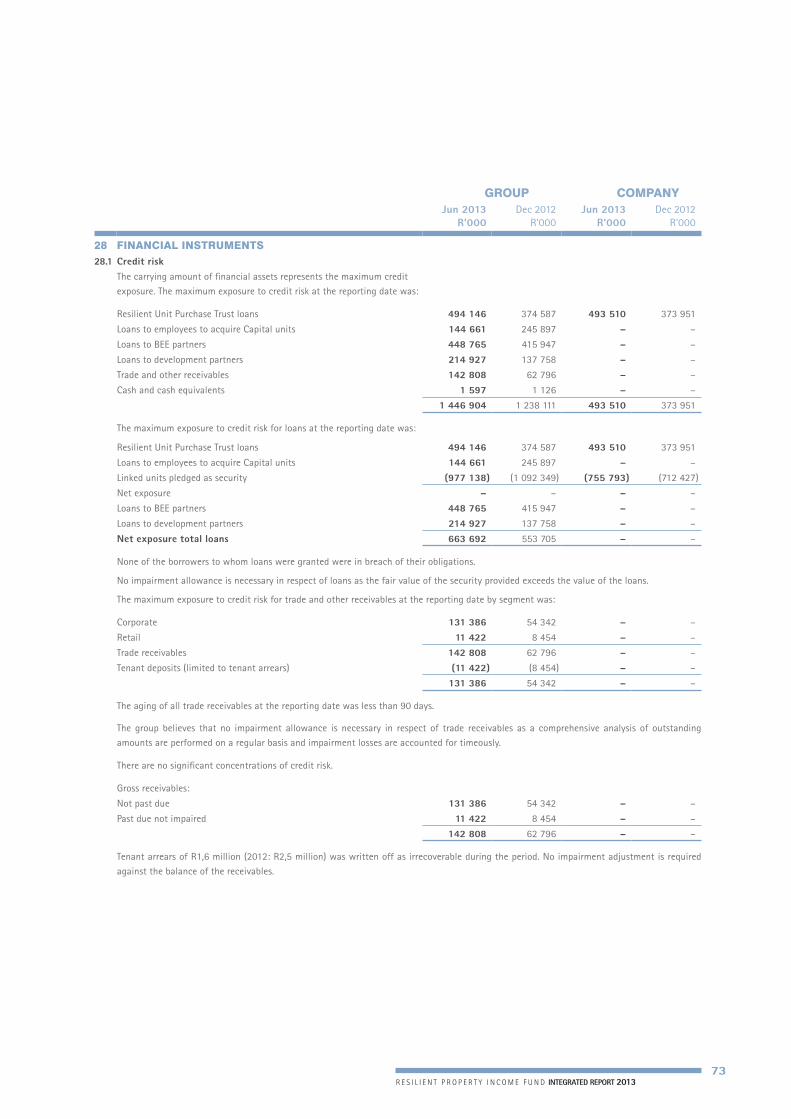
R e s i l i e n t P R o P e R t y i n c o m e F u n d INTEGRATED REPORT 2013 73
GROuP COMPANyJun 2013 Dec 2012 Jun 2013 Dec 2012
R’000 R’000 R’000 R’000
28 FINANCIAl INSTRuMENTS28.1 Credit risk
The carrying amount of financial assets represents the maximum credit
exposure. The maximum exposure to credit risk at the reporting date was:
Resilient Unit Purchase Trust loans 494 146 374 587 493 510 373 951
Loans to employees to acquire Capital units 144 661 245 897 – –
Loans to BEE partners 448 765 415 947 – –
Loans to development partners 214 927 137 758 – –
Trade and other receivables 142 808 62 796 – –
Cash and cash equivalents 1 597 1 126 – –
1 446 904 1 238 111 493 510 373 951
The maximum exposure to credit risk for loans at the reporting date was:
Resilient Unit Purchase Trust loans 494 146 374 587 493 510 373 951
Loans to employees to acquire Capital units 144 661 245 897 – –
Linked units pledged as security (977 138) (1 092 349) (755 793) (712 427)
Net exposure – – – –
Loans to BEE partners 448 765 415 947 – –
Loans to development partners 214 927 137 758 – –
Net exposure total loans 663 692 553 705 – –
None of the borrowers to whom loans were granted were in breach of their obligations.
No impairment allowance is necessary in respect of loans as the fair value of the security provided exceeds the value of the loans.
The maximum exposure to credit risk for trade and other receivables at the reporting date by segment was:
Corporate 131 386 54 342 – –
Retail 11 422 8 454 – –
Trade receivables 142 808 62 796 – –
Tenant deposits (limited to tenant arrears) (11 422) (8 454) – –
131 386 54 342 – –
The aging of all trade receivables at the reporting date was less than 90 days.
The group believes that no impairment allowance is necessary in respect of trade receivables as a comprehensive analysis of outstanding
amounts are performed on a regular basis and impairment losses are accounted for timeously.
There are no significant concentrations of credit risk.
Gross receivables:
Not past due 131 386 54 342 – –
Past due not impaired 11 422 8 454 – –
142 808 62 796 – –
Tenant arrears of R1,6 million (2012: R2,5 million) was written off as irrecoverable during the period. No impairment adjustment is required
against the balance of the receivables.

R e s i l i e n t P R o P e R t y i n c o m e F u n d INTEGRATED REPORT 2013 74
NOTES TO THE ANNuAl FINANCIAl STATEMENTS (CONTINuEd)
f o r t h e s i x m o n t h s e n d e d 3 0 J u n e 2 0 1 3
Carrying Contractual More thanvalue outflows 1-12 months 2-5 years 5 years
R’000 R’000 R’000 R’000 R’000
28 FINANCIAl INSTRuMENTS (CONTINuEd)
28.2 Liquidity riskThe following are the contractual maturities of financial liabilities, excluding interest payments and excluding the impact of netting agreements:
Group – Jun 2013Non-derivative financial liabilities
Linked debentures 1 389 812 1 389 812 – – 1 389 812 Interest-bearing borrowings – capital 4 791 706 4 791 706 1 004 680 2 562 917 1 224 109 Trade and other payables 249 282 249 282 249 282 – – Linked debenture interest payable 394 446 394 446 394 446 – –
Group – Dec 2012Non-derivative financial liabilities
Linked debentures 1 319 680 1 319 680 – – 1 319 680
Interest-bearing borrowings – capital 4 437 502 4 437 502 1 482 529 2 544 203 410 770
Trade and other payables 351 196 351 196 351 196 – –
Linked debenture interest payable 370 967 370 967 370 967 – –
Company – Jun 2013Non-derivative financial liabilities
Linked debentures 1 389 812 1 389 812 – – 1 389 812 Interest-bearing borrowings – capital 2 014 349 2 014 349 1 004 680 1 009 669 – Trade and other payables 645 645 645 – – Linked debenture interest payable 394 446 394 446 394 446 – – Amounts owing to subsidiaries and joint ventures 150 150 150 – –
Company – Dec 2012Non-derivative financial liabilities
Linked debentures 1 319 680 1 319 680 – – 1 319 680
Interest-bearing borrowings – capital 1 823 175 1 823 175 779 267 1 043 908 –
Trade and other payables 986 986 986 – –
Linked debenture interest payable 370 967 370 967 370 967 – –
Amounts owing to subsidiaries and joint ventures 33 213 33 213 33 213 – –
Cash flows are monitored on a regular basis to ensure that cash resources are adequate to meet funding requirements.
GROuPJun 2013 Dec 2012
R’000 R’000
Permitted borrowings for the group
Total assets 18 087 522 15 898 530
60% of total assets 10 852 513 9 539 118
Total borrowings (4 791 706) (4 437 502)
Unutilised borrowing capacity 6 060 807 5 101 616
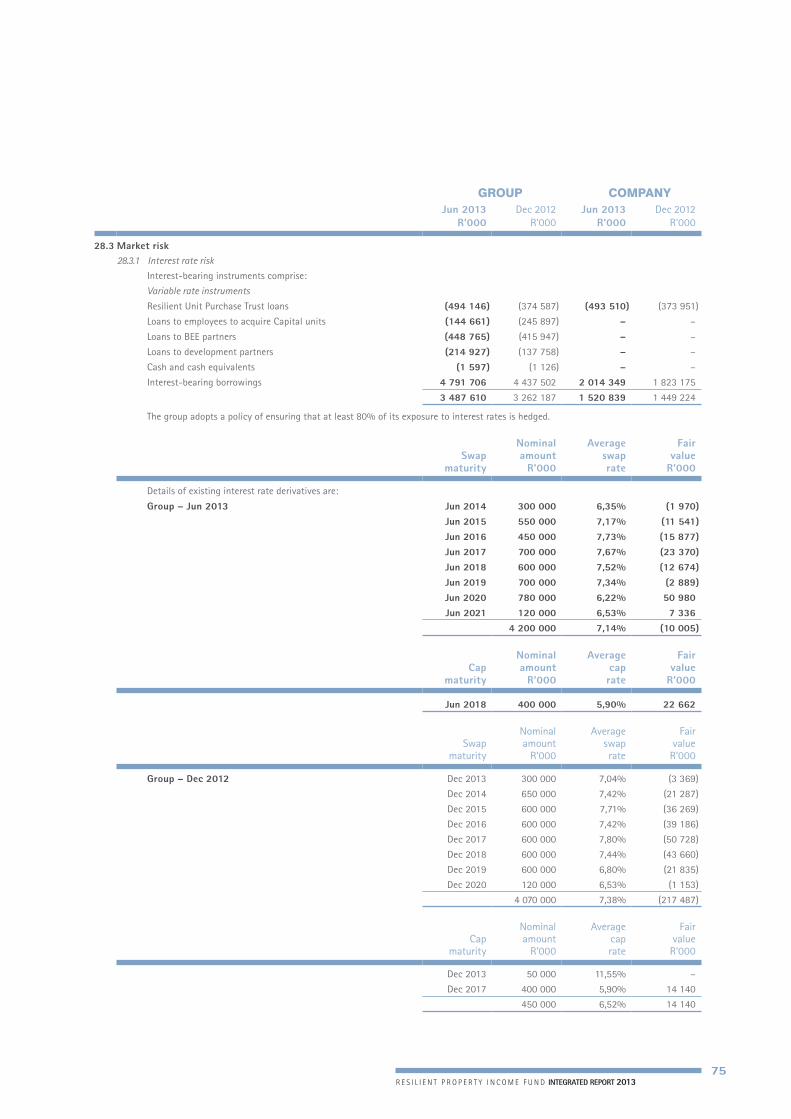
R e s i l i e n t P R o P e R t y i n c o m e F u n d INTEGRATED REPORT 2013 75
GROuP COMPANyJun 2013 Dec 2012 Jun 2013 Dec 2012
R’000 R’000 R’000 R’000
28.3 Market risk28.3.1 Interest rate risk
Interest-bearing instruments comprise:
Variable rate instruments
Resilient Unit Purchase Trust loans (494 146) (374 587) (493 510) (373 951)
Loans to employees to acquire Capital units (144 661) (245 897) – –
Loans to BEE partners (448 765) (415 947) – –
Loans to development partners (214 927) (137 758) – –
Cash and cash equivalents (1 597) (1 126) – –
Interest-bearing borrowings 4 791 706 4 437 502 2 014 349 1 823 175
3 487 610 3 262 187 1 520 839 1 449 224
The group adopts a policy of ensuring that at least 80% of its exposure to interest rates is hedged.
Nominal Average FairSwap amount swap value
maturity R’000 rate R’000
Details of existing interest rate derivatives are:
Group – Jun 2013 Jun 2014 300 000 6,35% (1 970)Jun 2015 550 000 7,17% (11 541)Jun 2016 450 000 7,73% (15 877)Jun 2017 700 000 7,67% (23 370)Jun 2018 600 000 7,52% (12 674)Jun 2019 700 000 7,34% (2 889)Jun 2020 780 000 6,22% 50 980 Jun 2021 120 000 6,53% 7 336
4 200 000 7,14% (10 005)
Nominal Average FairCap amount cap value
maturity R’000 rate R’000
Jun 2018 400 000 5,90% 22 662
Nominal Average FairSwap amount swap value
maturity R’000 rate R’000
Group – Dec 2012 Dec 2013 300 000 7,04% (3 369)
Dec 2014 650 000 7,42% (21 287)
Dec 2015 600 000 7,71% (36 269)
Dec 2016 600 000 7,42% (39 186)
Dec 2017 600 000 7,80% (50 728)
Dec 2018 600 000 7,44% (43 660)
Dec 2019 600 000 6,80% (21 835)
Dec 2020 120 000 6,53% (1 153)
4 070 000 7,38% (217 487)
Nominal Average FairCap amount cap value
maturity R’000 rate R’000
Dec 2013 50 000 11,55% –
Dec 2017 400 000 5,90% 14 140
450 000 6,52% 14 140

R e s i l i e n t P R o P e R t y i n c o m e F u n d INTEGRATED REPORT 2013 76
NOTES TO THE ANNuAl FINANCIAl STATEMENTS (CONTINuEd)
f o r t h e s i x m o n t h s e n d e d 3 0 J u n e 2 0 1 3
28 FINANCIAl INSTRuMENTS (CONTINuEd)28.3 Market risk (continued)
28.3.1 Interest rate risk (continued)effective interest rates and repricing
The effective interest rates at the statement of financial position date and the periods in which the borrowings reprice are reflected in
note 15.
Cash flow sensitivity analysis for variable rate instrumentsinterest
A change of 100 basis points in interest rates at the reporting date would have increased/(decreased) distribution by the amounts shown
below. This analysis assumes that all other variables remain constant. The analysis is performed on the same basis for 2012.
DistributionIncrease Decrease
R’000 R’000
Group – Jun 2013Loans to BEE partners 4 488 (4 488)Loans to development partners 2 149 (2 149)Cash and cash equivalents 16 (16)Interest-bearing borrowings (47 917) 47 917 Interest rate derivatives 42 000 (42 000)Cash flow sensitivity (net) 736 (736)
Company – Jun 2013Interest-bearing borrowings (20 143) 20 143
Group – Dec 2012Loans to BEE partners 4 159 (4 159)
Loans to development partners 1 378 (1 378)
Cash and cash equivalents 11 (11)
Interest-bearing borrowings (44 375) 44 375
Interest rate derivatives 40 700 (40 700)
Cash flow sensitivity (net) 1 873 (1 873)
Company – Dec 2012Interest-bearing borrowings (18 232) 18 232
GROuP COMPANyJun 2013 Dec 2012 Jun 2013 Dec 2012
R’000 R’000 R’000 R’000
28.3.2 Equity price risk
The carrying amount of financial assets represents the
maximum equity price risk exposure. The maximum exposure
to equity price risk at the reporting date was:
Investments 4 411 414 3 719 975 – –
A one percent change in the market value of investments would have increased/(decreased) equity and profit or loss by the amounts
shown below. This analysis assumes that all other variables remain constant. The analysis is performed on the same basis for 2012.
Profit or loss and equity1% increase 1% decrease
R’000 R’000
Group – Jun 2013Investments 44 114 (44 114)
Group – Dec 2012Investments 37 200 (37 200)

R e s i l i e n t P R o P e R t y i n c o m e F u n d INTEGRATED REPORT 2013 77
28.4 Fair values
The fair values of all financial instruments, with the exception of linked debentures, are substantially the same as the carrying amounts reflected on the statement of financial position.
Designated at fair value
Loans and
receivablesAmortised
cost
Total carrying amount
Fair value
R’000 R’000 R’000 R’000 R’000
Group – Jun 2013Investments (level 1) 4 411 414 4 411 414 4 411 414 Resilient Unit Purchase Trust loans 494 146 494 146 494 146 Loans to employees to acquire Capital units 144 661 144 661 144 661 Loans to BEE partners 448 765 448 765 448 765 Loans to development partners 214 927 214 927 214 927 Trade and other receivables 61 108 61 108 61 108 Interest rate derivatives debtor (level 2) 81 700 81 700 81 700 Cash and cash equivalents 1 597 1 597 1 597 Linked debentures (1 389 812) (1 389 812) (1 389 812)Interest-bearing borrowings (4 791 706) (4 791 706) (4 791 706)Trade and other payables (180 239) (180 239) (180 239)Interest rate derivatives creditor (level 2) (69 043) (69 043) (69 043)Linked debenture interest payable (394 446) (394 446) (394 446)
4 424 071 1 365 204 (6 756 203) (966 928) (966 928)
Group – Dec 2012Investments (level 1) 3 719 975 3 719 975 3 719 975 Resilient Unit Purchase Trust loans 374 587 374 587 374 587 Loans to employees to acquire Capital units 245 897 245 897 245 897 Loans to BEE partners 415 947 415 947 415 947 Loans to development partners 137 758 137 758 137 758 Trade and other receivables 48 656 48 656 48 656 Interest rate derivatives debtor (level 2) 14 140 14 140 14 140 Cash and cash equivalents 1 126 1 126 1 126 Linked debentures (1 319 680) (1 319 680) (1 319 680)Interest-bearing borrowings (4 437 502) (4 437 502) (4 437 502)BEE instrument (337 640) (337 640) (337 640)Trade and other payables (133 709) (133 709) (133 709)Interest rate derivatives creditor (level 2) (217 487) (217 487) (217 487)Linked debenture interest payable (370 967) (370 967) (370 967)
3 178 988 1 223 971 (6 261 858) (1 858 899) (1 858 899)
Company – Jun 2013Resilient Unit Purchase Trust loans 493 510 493 510 493 510 Linked debentures (1 389 812) (1 389 812) (1 389 812)Interest-bearing borrowings (2 014 349) (2 014 349) (2 014 349)Trade and other payables (645) (645) (645)Linked debenture interest payable (394 446) (394 446) (394 446)Amounts owing to subsidiaries and joint ventures (150) (150) (150)
– 493 360 (3 799 252) (3 305 892) (3 305 892)
Company – Dec 2012Resilient Unit Purchase Trust loans 373 951 373 951 373 951 Linked debentures (1 319 680) (1 319 680) (1 319 680)Interest-bearing borrowings (1 823 175) (1 823 175) (1 823 175)BEE instrument (337 640) (337 640) (337 640)Trade and other payables (986) (986) (986)Linked debenture interest payable (370 967) (370 967) (370 967)Amounts owing to subsidiaries and joint ventures (33 213) (33 213) (33 213)
(337 640) 340 738 (3 514 808) (3 511 710) (3 511 710)
Level 1 financial instruments are all investments in listed equities. Interest rate derivatives have been classified as level 2 financial instruments and have been fair valued externally.

R e s i l i e n t P R o P e R t y i n c o m e F u n d INTEGRATED REPORT 2013 78
29 ACCOuNTING ESTIMATES ANd judGEMENTS Management discusses with the audit committee the development, selection and disclosure of the group’s critical accounting policies and
estimates and the application of these policies and estimates.
Investment property The revaluation of investment property requires judgement in the determination of future cash flows from leases and an appropriate
capitalisation rate which may vary between 7,25% and 8,75% (2012: 7,50% and 9,00%). Changes in the capitalisation rate attributable
to changes in market conditions can have a significant impact on property valuations. A 25 basis points increase in the capitalisation rate
will decrease the value of investment property by R358,2 million (2012: R318,8 million). A 25 basis points decrease in the capitalisation rate
will increase the value of investment property by R382,1 million (2012: R339,6 million).
Impairment of assets The group tests whether assets have suffered any impairment in accordance with the accounting policy stated in note 1. The recoverable
amounts of cash-generating units and intangible assets have been determined based on future cash flows discounted to their present value
using appropriate rates. Estimates are based on interpretation of generally accepted industry based market forecasts.
Trade receivables Management identifies impairment of trade receivables on an ongoing basis. Impairment adjustments are raised against trade receivables
when the collectability is considered to be doubtful. Management believes that the impairment write-off is conservative and there are no
significant trade receivables that are doubtful and have not been written off. In determining whether a particular receivable could be doubtful,
the following factors are taken into consideration:
– age;
– customer current financial status;
– security held; and
– disputes with customer.
30 RElATEd PARTy TRANSACTIONS
Parent entityThe holding company is Resilient Property Income Fund Ltd.
Identity of related parties with whom material transactions have occurredThe subsidiaries and directors are related parties. The subsidiaries of the company are identified in note 10. The directors are set out on pages
4 to 7.
Material related party transactionsLoans to/from subsidiaries are set out in note 10.
Interest received from subsidiaries is set out in the statements of comprehensive income.
Remuneration paid to directors is set out on page 20 to 21 and in note 19.
Loans by The Resilient Unit Purchase Trust to directors are set out in note 22.
Interest paid by directors to The Resilient Unit Purchase Trust amounts to R8 176 000 (2012: R27 201 000).
Loans to directors to acquire units in Capital Property Fund are set out in note 7.
Interest paid by directors on loans to acquire units in Capital Property Fund amounts to R849 000 (2012: R5 028 000).
Director’s interestThembi Chagonda has an indirect holding in Resilient through her holding in BEE SPV.
NOTES TO THE ANNuAl FINANCIAl STATEMENTS (CONTINuEd)
f o r t h e s i x m o n t h s e n d e d 3 0 J u n e 2 0 1 3

R e s i l i e n t P R o P e R t y i n c o m e F u n d INTEGRATED REPORT 2013 79
31 STANdARdS ANd INTERPRETATIONS NOT yET EFFECTIVE Statement of compliance with IFRS The group applies all applicable IFRS as issued by the International Accounting Standards Board (“IASB”) in preparation of the financial
statements. Consequently, all IFRS statements that were effective at the date of issuing this report and are relevant to Resilient’s operations
have been applied.
At the date of authorisation of these financial statements, the following Standards and Interpretations were in issue but not yet effective:
IFRS 7 Financial Instruments: Disclosures
– Deferral of mandatory effective date of IFRS 9 and amendments to
transition disclosures
Annual periods beginning on or after 1 January 2015
IFRS 9 Financial Instruments
– Original issue (Classification and measurement of financial assets)
Annual periods beginning on or after 1 January 2013
(Effective date subsequently deferred, see below)
IFRS 9 Financial Instruments
– Reissue to include requirements for the classification and measurement
of financial liabilities and incorporate existing derecognition
requirements
Annual periods beginning on or after 1 January 2013
(Effective date subsequently deferred, see below)
IFRS 9 Financial Instruments
– Deferral of mandatory effective date of IFRS 9 and amendments to
transition disclosures
Annual periods beginning on or after 1 January 2015
IFRS 10 Consolidated Financial Statements
– Amendments for investment entities
Annual periods beginning on or after 1 January 2014
IFRS 12 Disclosure of Interests in Other Entities
– Amendments for investment entities
Annual periods beginning on or after 1 January 2014
IAS 27 Separate Financial Statements
– Amendments for investment entities
Annual periods beginning on or after 1 January 2014
IAS 32 Financial Instruments: Presentation
– Amendments relating to the offsetting of assets and liabilities
Annual periods beginning on or after 1 January 2014
IAS 36 Impairment of Assets
– Amendments arising from Recoverable Amount Disclosures for Non-
Financial Assets
Annual periods beginning on or after 1 January 2014
IAS 39 Financial Instruments: Recognition and Measurement
– Amendments for novations of derivatives
Annual periods beginning on or after 1 January 2014
International Financial Reporting Interpretations (“IFRIC”)
IFRIC 21 Levies Annual periods beginning on or after 1 January 2014
Management is assessing the impact that the adoption of these standards and interpretations will have on the financial statements.

R e s i l i e n t P R o P e R t y i n c o m e F u n d INTEGRATED REPORT 2013 80
SCHEdulE OF PROPERTIES
No Property name
Primaryuse
Geographical location
Grosslettable
area (m2) Vacancy
Weightedaverage
rate per m2 (R)
Acquisition date
Purchase price
R’000 Valuation
R’000 Address
1 Boardwalk Shopping Centre Retail KwaZulu-Natal 65 891 1,0% 125,83 1 Dec 11 1 028 347 1 324 000 Krugerrand Road Richards Bay
2 Mall of the North (Resilient has a 60% interest) Retail Limpopo 76 748 1,2% 151,01 20 Apr 07 633 878 1 008 000 Cnr future N1 (Ringroad) and R81 Modjadjis Kloof Road Bendor Polokwane
3 Highveld Mall (Resilient has a 60% interest) Retail Mpumalanga 65 785 0,2% 146,91 26 Apr 07 331 819 974 300 Cnr President Avenue and N4 Highway Witbank
4 The Grove Retail Gauteng 41 475 1,2% 141,02 20 Sep 06 626 924 796 500 Cnr Simon Vermooten Road and Lynnwood Road Equestria
5 Tzaneng Mall Retail Limpopo 40 924 1,8% 118,13 23 Dec 03 196 457 655 000 24 – 26 Danie Joubert Street (cnr Danie Joubert and Agatha Roads) Tzaneen
6 I’langa Mall (Resilient has a 70% interest) Retail Mpumalanga 49 222 1,0% 117,56 6 Sep 07 444 114 556 500 Cnr N4 and Graniet Street Nelspruit
7 Diamond Pavilion Retail Northern Cape 32 513 0,7% 115,89 21 Jul 05 305 172 487 000 Cnr Oliver Road and MacDougall Street Monument Heights Kimberley
8 Brits Mall (Resilient has a 93% interest) Retail North West 36 876 1,0% 101,63 22 Jan 08 360 333 483 600 Cnr Hendrik Verwoerd Avenue (R511) and Marthinus Ras Street Brits
9 Limpopo Mall and Taxi Centre Polokwane Retail Limpopo 27 803 – 119,31 1 Dec 02 110 464 471 000 Rissik Market Church Devenish and President Kruger Streets Polokwane
10 Jabulani Mall (Resilient has a 55% interest) Retail Gauteng 44 314 0,2% 130,31 1 Nov 06 214 727 465 600 2189 Bolani Road Jabulani Soweto
11 Tubatse Crossing (Resilient has a 90% interest) Retail Mpumalanga 44 184 6,6% 105,38 17 Jul 07 364 242 (4) 461 100 (2) Intersection Polokwane and Steelpoort Roads Burgersfort
12 Mvusuludzo Mall Thohoyandou Retail Limpopo 20 952 – 126,89 2 Dec 04 139 105 396 000 Tshanduko Street Thohoyandou
13 Circus Triangle Mthatha Retail Eastern Cape 26 050 1,2% 118,66 1 Dec 10 225 948 354 900 Cnr Chatham Elliot and Sutherland Streets Mthatha
14 Rivonia Village Retail Gauteng 22 591 9,8% 121,25 30 Jun 08 146 109 337 900 Cnr Rivonia Boulevard and Mutual Road Rivonia
15 Northam Plaza Retail Limpopo 20 026 – 98,00 20 Oct 05 96 026 315 400 Cnr Provincial Road P16 – 2 and Provincial Road P1235 Northam
16 Village Mall Kathu Retail Northern Cape 18 454 – 82,98 26 Nov 08 134 266 244 800 Cnr De Ben and Hendrik van Eck Streets Kathu
17 The Crossing Mokopane Retail Limpopo 18 733 1,4% 96,21 24 Oct 03 93 577 244 000 56 Thabo Mbeki Drive Mokopane
18 Murchison Mall Retail KwaZulu-Natal 17 992 0,4% 87,52 1 Mar 05 71 236 221 000 Cnr Murchison and Lyell Streets Ladysmith
19 Mafikeng Mall (Resilient has a 66% interest) Retail North West 22 896 0,4% 101,10 31 Jul 07 137 268 211 860 Cnr Carney and Carrington Streets Mafikeng
20 Tzaneen Crossing Retail Limpopo 14 303 2,5% 98,00 1 Dec 02 41 358 194 400 12 Lydenburg Road Tzaneen
21 The Galleria (Resilient has a 10% interest) Retail KwaZulu-Natal 88 443 13,3% 135,52 30 Nov 04 122 434 177 500 Cnr N2 Highway and Chamberlain Road Umbogintwini
22 Pick n Pay Hypermarket Klerksdorp Retail North West 18 926 0,3% 69,86 1 Dec 02 57 028 174 000 91 Buffelsdoorn Avenue (cnr Buffelsdoorn Road and Tom Avenue) Wilkoppies Klerksdorp
23 Tzaneen Lifestyle Centre (Resilient has a 45% interest)(1) Retail Limpopo 9 380 – 106,23 5 Sep 08 59 714 57 629 Cnr Voortrekker and the P43 – 3 Road Tzaneen
24 Arbour Crossing (Resilient has a 10% interest) Retail KwaZulu-Natal 39 786 8,7% 85,66 30 Nov 04 38 877 42 200 Cnr N2 Highway and Chamberlain Road Umbogintwini
Total direct property investment 864 267 1,7%(3) 118,19(3) 5 979 423 10 654 189

R e s i l i e n t P R o P e R t y i n c o m e F u n d INTEGRATED REPORT 2013 81
No Property name
Primaryuse
Geographical location
Grosslettable
area (m2) Vacancy
Weightedaverage
rate per m2 (R)
Acquisition date
Purchase price
R’000 Valuation
R’000 Address
1 Boardwalk Shopping Centre Retail KwaZulu-Natal 65 891 1,0% 125,83 1 Dec 11 1 028 347 1 324 000 Krugerrand Road Richards Bay
2 Mall of the North (Resilient has a 60% interest) Retail Limpopo 76 748 1,2% 151,01 20 Apr 07 633 878 1 008 000 Cnr future N1 (Ringroad) and R81 Modjadjis Kloof Road Bendor Polokwane
3 Highveld Mall (Resilient has a 60% interest) Retail Mpumalanga 65 785 0,2% 146,91 26 Apr 07 331 819 974 300 Cnr President Avenue and N4 Highway Witbank
4 The Grove Retail Gauteng 41 475 1,2% 141,02 20 Sep 06 626 924 796 500 Cnr Simon Vermooten Road and Lynnwood Road Equestria
5 Tzaneng Mall Retail Limpopo 40 924 1,8% 118,13 23 Dec 03 196 457 655 000 24 – 26 Danie Joubert Street (cnr Danie Joubert and Agatha Roads) Tzaneen
6 I’langa Mall (Resilient has a 70% interest) Retail Mpumalanga 49 222 1,0% 117,56 6 Sep 07 444 114 556 500 Cnr N4 and Graniet Street Nelspruit
7 Diamond Pavilion Retail Northern Cape 32 513 0,7% 115,89 21 Jul 05 305 172 487 000 Cnr Oliver Road and MacDougall Street Monument Heights Kimberley
8 Brits Mall (Resilient has a 93% interest) Retail North West 36 876 1,0% 101,63 22 Jan 08 360 333 483 600 Cnr Hendrik Verwoerd Avenue (R511) and Marthinus Ras Street Brits
9 Limpopo Mall and Taxi Centre Polokwane Retail Limpopo 27 803 – 119,31 1 Dec 02 110 464 471 000 Rissik Market Church Devenish and President Kruger Streets Polokwane
10 Jabulani Mall (Resilient has a 55% interest) Retail Gauteng 44 314 0,2% 130,31 1 Nov 06 214 727 465 600 2189 Bolani Road Jabulani Soweto
11 Tubatse Crossing (Resilient has a 90% interest) Retail Mpumalanga 44 184 6,6% 105,38 17 Jul 07 364 242 (4) 461 100 (2) Intersection Polokwane and Steelpoort Roads Burgersfort
12 Mvusuludzo Mall Thohoyandou Retail Limpopo 20 952 – 126,89 2 Dec 04 139 105 396 000 Tshanduko Street Thohoyandou
13 Circus Triangle Mthatha Retail Eastern Cape 26 050 1,2% 118,66 1 Dec 10 225 948 354 900 Cnr Chatham Elliot and Sutherland Streets Mthatha
14 Rivonia Village Retail Gauteng 22 591 9,8% 121,25 30 Jun 08 146 109 337 900 Cnr Rivonia Boulevard and Mutual Road Rivonia
15 Northam Plaza Retail Limpopo 20 026 – 98,00 20 Oct 05 96 026 315 400 Cnr Provincial Road P16 – 2 and Provincial Road P1235 Northam
16 Village Mall Kathu Retail Northern Cape 18 454 – 82,98 26 Nov 08 134 266 244 800 Cnr De Ben and Hendrik van Eck Streets Kathu
17 The Crossing Mokopane Retail Limpopo 18 733 1,4% 96,21 24 Oct 03 93 577 244 000 56 Thabo Mbeki Drive Mokopane
18 Murchison Mall Retail KwaZulu-Natal 17 992 0,4% 87,52 1 Mar 05 71 236 221 000 Cnr Murchison and Lyell Streets Ladysmith
19 Mafikeng Mall (Resilient has a 66% interest) Retail North West 22 896 0,4% 101,10 31 Jul 07 137 268 211 860 Cnr Carney and Carrington Streets Mafikeng
20 Tzaneen Crossing Retail Limpopo 14 303 2,5% 98,00 1 Dec 02 41 358 194 400 12 Lydenburg Road Tzaneen
21 The Galleria (Resilient has a 10% interest) Retail KwaZulu-Natal 88 443 13,3% 135,52 30 Nov 04 122 434 177 500 Cnr N2 Highway and Chamberlain Road Umbogintwini
22 Pick n Pay Hypermarket Klerksdorp Retail North West 18 926 0,3% 69,86 1 Dec 02 57 028 174 000 91 Buffelsdoorn Avenue (cnr Buffelsdoorn Road and Tom Avenue) Wilkoppies Klerksdorp
23 Tzaneen Lifestyle Centre (Resilient has a 45% interest)(1) Retail Limpopo 9 380 – 106,23 5 Sep 08 59 714 57 629 Cnr Voortrekker and the P43 – 3 Road Tzaneen
24 Arbour Crossing (Resilient has a 10% interest) Retail KwaZulu-Natal 39 786 8,7% 85,66 30 Nov 04 38 877 42 200 Cnr N2 Highway and Chamberlain Road Umbogintwini
Total direct property investment 864 267 1,7%(3) 118,19(3) 5 979 423 10 654 189

R e s i l i e n t P R o P e R t y i n c o m e F u n d INTEGRATED REPORT 2013 82
SCHEdulE OF PROPERTIES (CONTINuEd)
No Property name
Primaryuse
Geographical location
Grosslettable
area (m2) Vacancy
Weightedaverage
rate per m2 (R)
Acquisition date
Purchase price
R’000 Valuation
R’000 Address
25 Nelspruit Plaza Retail Mpumalanga 18 525 – 119,73 27 Nov 03 96 386 312 500 Cnr Henshall and Bester Streets Nelspruit
26 Rustenburg Plaza Retail North West 12 188 – 139,29 1 Dec 02 50 771 260 000 34 Fatima Bhayat Street Rustenburg
27 Central Park Bloemfontein Retail Free State 12 753 10,3% 108,70 29 Oct 10 74 012 163 000 Cnr Fichardt and Hanger Streets Bloemfontein
28 New Redruth Village Retail Gauteng 12 028 0,6% 98,91 30 Jun 08 106 522 151 000 St Austell Street New Redruth Alberton
29 Sterkspruit Plaza (Resilient has an 82% interest) Retail Eastern Cape 10 696 7,0% 90,23 30 Jun 08 86 647 105 545 Cnr Zastron and Voyizana Roads Sterkspruit
Tzaneen Lifestyle Centre (Resilient has a 25% interest)(1) Retail Limpopo 9 380 – 106,23 5 Sep 08 16 286 49 946 Cnr Voortrekker and the P43–3 Road Tzaneen
Total investment property held for sale 75 570 3,0%(3) 113,08 (3) 430 624 1 041 991
930 457 1,8%(3) 117,71 (3) 6 410 047 11 696 180
30 Secunda Mall (Resilient has a 40% interest) Development Mpumalanga n/a n/a n/a 7 Mar 12 159 545 (4) 192 000 (2) Cnr PDP Kruger and OR Tambo Streets Secunda
31 The Grove additional land Vacant land Gauteng n/a n/a n/a 13 Oct 08 85 179 (4) 85 179 Cnr Simon Vermooten and Lynnwood Roads Equestria
32 Checkers Burgersfort Vacant land Mpumalanga n/a n/a n/a 16 Jul 07 44 092 (4) 44 092 Lydenburg Road Burgersfort
33 Polokwane Value Centre (Resilient has a 60% interest) Vacant land Limpopo n/a n/a n/a 15 Mar 07 36 691 (4) 36 691 R81 Modjadjis Kloof Road Bendor Polokwane
34 Tzaneen Lifestyle Centre land (Resilient has a 45% interest) Vacant land Limpopo n/a n/a n/a 5 Sep 08 32 274 (4) 32 274 Cnr Voortrekker and the P43–3 Road Tzaneen
35 The Grove additional land Vacant land Gauteng n/a n/a n/a 6 Jul 10 31 083 (4) 31 083 Cnr Simon Vermooten and Lynnwood Roads Equestria
36 Soshanguve Crossing (Resilient has a 55% interest) Development Gauteng n/a n/a n/a 7 Jan 08 24 630 (4) 24 630 Ruth First Street (K–4) Soshanguve
37 The Village Klerksdorp (Resilient has a 50% interest) Vacant land North West n/a n/a n/a 10 Nov 06 13 363 (4) 13 363 Buffelsdoorn Avenue Klerksdorp
38 Brits Mall land Vacant land North West n/a n/a n/a 10 Aug 11 11 978 (4) 11 978 Cnr Hendrik Verwoerd Avenue (R511) and Marthinus Ras Street Brits
39 Arbour Town precinct land (Resilient has a 10% interest) Vacant land KwaZulu-Natal n/a n/a n/a 30 Nov 04 10 839 (4) 10 839 Cnr N2 Highway and Chamberlain Road Umbogintwini
Total developments and vacant land 449 674 (4) 482 129
Total 6 859 721 12 178 309
(1) resilient has a 70% interest in this property and will dispose of a 25% undivided share to fortress. (2) Adjusted for cost to complete the development. (3) Based on resilient’s pro rata interests. (4) Purchase price includes capitalised costs to date.

R e s i l i e n t P R o P e R t y i n c o m e F u n d INTEGRATED REPORT 2013 83
No Property name
Primaryuse
Geographical location
Grosslettable
area (m2) Vacancy
Weightedaverage
rate per m2 (R)
Acquisition date
Purchase price
R’000 Valuation
R’000 Address
25 Nelspruit Plaza Retail Mpumalanga 18 525 – 119,73 27 Nov 03 96 386 312 500 Cnr Henshall and Bester Streets Nelspruit
26 Rustenburg Plaza Retail North West 12 188 – 139,29 1 Dec 02 50 771 260 000 34 Fatima Bhayat Street Rustenburg
27 Central Park Bloemfontein Retail Free State 12 753 10,3% 108,70 29 Oct 10 74 012 163 000 Cnr Fichardt and Hanger Streets Bloemfontein
28 New Redruth Village Retail Gauteng 12 028 0,6% 98,91 30 Jun 08 106 522 151 000 St Austell Street New Redruth Alberton
29 Sterkspruit Plaza (Resilient has an 82% interest) Retail Eastern Cape 10 696 7,0% 90,23 30 Jun 08 86 647 105 545 Cnr Zastron and Voyizana Roads Sterkspruit
Tzaneen Lifestyle Centre (Resilient has a 25% interest)(1) Retail Limpopo 9 380 – 106,23 5 Sep 08 16 286 49 946 Cnr Voortrekker and the P43–3 Road Tzaneen
Total investment property held for sale 75 570 3,0%(3) 113,08 (3) 430 624 1 041 991
930 457 1,8%(3) 117,71 (3) 6 410 047 11 696 180
30 Secunda Mall (Resilient has a 40% interest) Development Mpumalanga n/a n/a n/a 7 Mar 12 159 545 (4) 192 000 (2) Cnr PDP Kruger and OR Tambo Streets Secunda
31 The Grove additional land Vacant land Gauteng n/a n/a n/a 13 Oct 08 85 179 (4) 85 179 Cnr Simon Vermooten and Lynnwood Roads Equestria
32 Checkers Burgersfort Vacant land Mpumalanga n/a n/a n/a 16 Jul 07 44 092 (4) 44 092 Lydenburg Road Burgersfort
33 Polokwane Value Centre (Resilient has a 60% interest) Vacant land Limpopo n/a n/a n/a 15 Mar 07 36 691 (4) 36 691 R81 Modjadjis Kloof Road Bendor Polokwane
34 Tzaneen Lifestyle Centre land (Resilient has a 45% interest) Vacant land Limpopo n/a n/a n/a 5 Sep 08 32 274 (4) 32 274 Cnr Voortrekker and the P43–3 Road Tzaneen
35 The Grove additional land Vacant land Gauteng n/a n/a n/a 6 Jul 10 31 083 (4) 31 083 Cnr Simon Vermooten and Lynnwood Roads Equestria
36 Soshanguve Crossing (Resilient has a 55% interest) Development Gauteng n/a n/a n/a 7 Jan 08 24 630 (4) 24 630 Ruth First Street (K–4) Soshanguve
37 The Village Klerksdorp (Resilient has a 50% interest) Vacant land North West n/a n/a n/a 10 Nov 06 13 363 (4) 13 363 Buffelsdoorn Avenue Klerksdorp
38 Brits Mall land Vacant land North West n/a n/a n/a 10 Aug 11 11 978 (4) 11 978 Cnr Hendrik Verwoerd Avenue (R511) and Marthinus Ras Street Brits
39 Arbour Town precinct land (Resilient has a 10% interest) Vacant land KwaZulu-Natal n/a n/a n/a 30 Nov 04 10 839 (4) 10 839 Cnr N2 Highway and Chamberlain Road Umbogintwini
Total developments and vacant land 449 674 (4) 482 129
Total 6 859 721 12 178 309
(1) resilient has a 70% interest in this property and will dispose of a 25% undivided share to fortress. (2) Adjusted for cost to complete the development. (3) Based on resilient’s pro rata interests. (4) Purchase price includes capitalised costs to date.

R e s i l i e n t P R o P e R t y i n c o m e F u n d INTEGRATED REPORT 2013 84
AdMINISTRATIVE INFORMATION
COMPANy dETAIlSResilient Property Income Fund Limited
(Registration number: 2002/016851/06)
Share code: RES
ISIN: ZAE000043642
4th Floor, Rivonia Village,
Rivonia Boulevard, Rivonia, 2191
(PO Box 2555, Rivonia, 2128)
COMMERCIAl bANkERSThe Standard Bank of South Africa Limited
(Registration number: 1962/000738/06)
Corporate and Investment Banking
7th Floor, 3 Simmonds Street,
Johannesburg, 2001
(PO Box 61029, Marshalltown, 2107)
TRANSFER SECRETARIESLink Market Services South Africa Proprietary Limited
(Registration number: 2000/007239/07)
13th Floor, Rennie House,
19 Ameshoff Street, Braamfontein, 2001
(PO Box 4844, Johannesburg, 2000)
SECRETARy ANd REGISTEREd OFFICERajeshree Sookdeyu
4th Floor, Rivonia Village,
Rivonia Boulevard, Rivonia, 2191
(PO Box 2555, Rivonia, 2128)
ExTERNAl AudITORSDeloitte & Touche
Deloitte Place, Woodlands Office Park,
20 Woodlands Drive, Woodmead, 2052
(Private Bag X6, Gallo Manor, 2052)
TRuSTEES FOR dEbENTuRE HOldERSEdward Nathan Proprietary Limited
(Registration number: 2004/005665/07)
3rd Floor, Corporate Law, 150 West Street,
Sandown, Sandton, 2196
(PO Box 783347, Sandton, 2146)
SPONSORJava Capital
(Registration number: 2006/005780/07)
2 Arnold Road, Rosebank, 2196
(PO Box 2087, Parklands, 2121)

R e s i l i e n t P R o P e R t y i n c o m e F u n d INTEGRATED REPORT 2013 85
CORPORATE dIARy
FINAl 2013
Financial year-end Sunday 30 June 2013
Publication of abridged results SENS Tuesday 6 August 2013
Press Wednesday 7 August 2013
Last day to trade units inclusive of distribution (cum distribution) Friday 23 August 2013
Units trade ex distribution from Monday 26 August 2013
Last day to update unit register for distribution (record date) Friday 30 August 2013
Distribution payment Monday 2 September 2013
Financial report and notice of annual general meeting posted on Monday 30 September 2013
Annual general meeting Wednesday 13 November 2013 at 14h00
INTERIM 2014
Interim period ends Tuesday 31 December 2013
Announcement of interim results Wednesday 5 February 2014
Payment of interim distribution Monday 3 March 2014

R e s i l i e n t P R o P e R t y i n c o m e F u n d INTEGRATED REPORT 2013 86
NOTICE OF ANNuAl GENERAl MEETING OF SHAREHOldERS ANd dEbENTuRE HOldERS (“MEMbERS”)
THIS DOCUMENT IS IMPORTANT AND REQUIRES YOUR IMMEDIATE ATTENTION
Resilient Property Income Fund Limited
(Incorporated in the Republic of South Africa)
(Registration number: 2002/016851/06)
Share code: RES ISIN: ZAE000043642
(Approved as a REIT by the JSE)
(“Resilient” or “the company”)
If you are in any doubt as to what action you should take arising from the following resolutions, please consult your stockbroker, banker, attorney,
accountant or other professional advisor immediately.
Notice is given of the twelfth annual general meeting of members of Resilient Property Income Fund Limited at the company’s registered office, 4th Floor, Rivonia Village, Rivonia Boulevard, Rivonia, 2191, on Wednesday, 13 November 2013 at 14h00 for the purpose of presenting the audited company and group financial statements for the six months ended 30 June 2013 together with the reports of the directors, the audit committee and the auditors and transacting the following business:
1 Re-electing the following directors, who retire in terms of article 15.1 of the company’s Memorandum of Incorporation and who offer themselves
for re-election:
1.1 Desmond (Des) de Beer (52)
managing director and chief executive officer
BProc mAP
Date of appointment: July 2002
Des spent the first part of his career in the banking industry, first with Barclays Bank in South Africa and later with Syfrets that was merged
into NIB. He was appointed General Manager Corporate Equity and served on the bank’s executive committee. He has served on the boards of a
number of listed property companies and he is currently a director of Nepi and chairs its investment committee.
1.2 Jacobus Johann Kriek (48)
executive director
stanford executive Programme
Date of appointment: June 2004
Johann has been involved in retail property management, development and letting for 28 years with a strong emphasis on development and
redeveloping underperforming shopping centres.
2 Re-electing the following directors who have served on the board for more than nine years and who voluntarily retire and offer themselves for
re-election:
2.1 Marthin Petrus Greyling (46)
independent non-executive director
BCom (Acc) (hons), CA(sA)
Date of appointment: July 2002
Marthin started his career in financial services in 1993 when he joined the IDC. During his tenure he was, inter alia, involved in debt and project
finance and business turnarounds. He joined NIB in 2001 and is currently a Principal in the Nedbank Capital Private Equity team.
2.2 Mfundiso Johnson Ntabankulu Njeke (54)
independent non-executive chairman
BCompt (hons), hdip tax, CA(sA)
Date of appointment: November 2002
JJ was an audit partner at PwC and is the past chairman of the SAICA. In addition to serving on the board of Resilient, he serves on the boards
of MMI Holdings Limited, MTN Group Limited, Sasol Limited and Adcorp Holdings Limited.
2.3 Barry Daniel van Wyk (47)
independent non-executive director
BCom, BAcc, CA(sA)
Date of appointment: November 2002
Barry heads up Renlia Developments Proprietary Limited, a property investment and development company primarily focused on office, industrial and
residential opportunities. He was previously an executive director of Group Five Limited and managing director of Group Five Developments.

R e s i l i e n t P R o P e R t y i n c o m e F u n d INTEGRATED REPORT 2013 87
3 Re-electing all the members of the audit committee, who offer themselves for re-election, in terms of Section 94(2) of the Companies Act,
namely:
3.1 Marthin Petrus Greyling
3.2 Bryan Douglas Hopkins
3.3 Barry Daniel van Wyk
4 Reappointing Deloitte & Touche as auditors of the group with Mr P Kleb currently being the designated audit partner.
5 Authorising the directors to determine the remuneration of the group’s auditors.
As special business to consider and, if deemed fit, pass with or without modification, which modification is capable of being substantive in nature, the following resolutions:
6 Consider as ordinary resolution number 6
“RESOLVED THAT the authorised but unissued linked unit capital be and is hereby placed under the control and authority of the directors of the
company which directors are hereby authorised and empowered to allot, issue and otherwise dispose of such linked unit capital to such person
or persons on such terms and conditions and at such times as the directors of the company may from time to time and in their discretion deem
fit, provided that:
– such allotment, issue or disposal shall not in aggregate be in excess of 10% (ten percent) of the company’s current issued linked unit capital;
– is subject to a maximum discount of 5% (five percent) of the weighted average traded price on the JSE of those linked units over the 10 (ten)
business days prior to the date of allotment, issue or disposal as the case may be; and
– subject further to the provisions of the Companies Act, any debenture trust deed entered into by the company, the Memorandum of
Incorporation of the company and the JSE Listings Requirements.”
7 Consider as ordinary resolution number 7
“RESOLVED THAT the directors of the company be and are hereby authorised by way of a general authority, to issue linked units in the capital
of the company for cash, as and when they in their discretion deem fit, subject to the Companies Act, the Memorandum of Incorporation of the
company, the JSE Listings Requirements, when applicable, and the following limitations, namely that:
– the linked units which are the subject of the issue for cash must be of a class already in issue, or where this is not the case, must be limited
to such securities or rights that are convertible into a class already in issue;
– any such issue will be made to “public shareholders” and not “related parties”, all as defined in the JSE Listings Requirements, unless the JSE
otherwise agrees; and
– the number of linked units issued for cash shall not in aggregate in any one financial year exceed 5% (five percent) of the company’s issued
linked unit capital.
The number of linked units which may be issued shall be based on the number of linked units in issue, added to those that may be issued in
future (arising from the conversion of options/convertibles) at the date of such application, less any linked units issued, or to be issued in future
arising from options/convertible linked units issued during the current financial year; plus any linked units to be issued pursuant to a rights issue
which has been announced, is irrevocable and is fully underwritten, or an acquisition which has had final terms announced:
– this authority shall be valid until the company’s next annual general meeting, provided that it shall not extend beyond 15 (fifteen) months
from the date that this authority is given;
– an announcement giving full details, including the impact on net asset value per linked unit, net tangible asset value per linked unit, earnings
per linked unit, headline earnings per linked unit and, if applicable, diluted earnings and headline earnings per linked unit, will be published
at the time of any issue representing, on a cumulative basis within 1 (one) financial year, 5% (five percent) of the number of linked units in
issue prior to the issue; and
– in determining the price at which an issue of linked units may be made in terms of this authority, the maximum discount permitted will be
5% (five percent) of the weighted average traded price on the JSE of those linked units over the 10 (ten) business days prior to the date that
the price of the issue is determined or agreed to by the directors of the company.”
Ordinary resolution number 7 is required, under the JSE Listings Requirements, to be passed by achieving a 75% majority of the votes cast in
favour of such resolution by all members present or represented by proxy and entitled to vote at the annual general meeting.
8 Consider as special resolution number 1: approval of financial assistance to related or inter-related companies
“RESOLVED THAT, to the extent required by the Companies Act, the board of directors of the company may, subject to compliance with
the requirements of the company’s Memorandum of Incorporation, the Companies Act and the JSE Listings Requirements, each as presently
constituted and as amended from time to time, authorise the company to provide direct or indirect financial assistance in terms of section 45
of the Companies Act by way of loans, guarantees, the provisions of security or otherwise, to any of its present or future subsidiaries and/or any
other company or corporation that is or becomes related or inter-related (as defined in the Companies Act) to the company for any purpose or
in connection with any matter, such authority to endure until the next annual general meeting of the company.”

R e s i l i e n t P R o P e R t y i n c o m e F u n d INTEGRATED REPORT 2013 88
NOTICE OF ANNuAl GENERAl MEETING OF SHAREHOldERS ANd dEbENTuRE HOldERS (“MEMbERS”) (CONTINuEd)
The reason for and effect of special resolution number 1
The company provides loans to and/or guarantees loans or other obligations of subsidiaries. The company believes it necessary that it continues
to have the ability to provide financial assistance to, inter alia, ensure that the company’s subsidiaries and other related and inter-related
companies and corporations have access to financing and/or financial backing from the company (as opposed to banks) and is accordingly
proposing special resolution number 1.
Therefore, the reason for, and effect of, special resolution number 1 is to permit the company to provide direct or indirect financial assistance
(within the meaning attributed to that term in section 45) to the entities referred to in special resolution number 1 above.
In terms of section 45, if the resolution is adopted, the board of directors will only be entitled to authorise such financial assistance if it is
satisfied that the terms under which the financial assistance is proposed to be given are fair and reasonable to the company and, immediately
after providing the financial assistance, the company would satisfy the solvency and liquidity test contemplated in the Companies Act.
9 Consider as special resolution number 2: approval of the repurchase of linked units
“RESOLVED THAT subject to the Companies Act, the Memorandum of Incorporation of the company, the JSE Listings Requirements and the
restrictions set out below, the repurchase of linked units of the company, either by the company or by any subsidiary of the company, is hereby
authorised, on the basis that:
(1) this authority will only be valid until the company’s next annual general meeting or for 15 months from the date of this resolution, whichever
period is shorter;
(2) the number of linked units which may be acquired pursuant to this authority in any financial year may not in the aggregate exceed 20%,
or 10% where such acquisitions are effected by a subsidiary, of the company’s unit capital as at the date of this notice of annual general
meeting;
(3) the repurchase of linked units must be effected through the order book operated by the JSE trading system and done without any prior
arrangement between the company and the counter-party;
(4) the repurchase of linked units may not be made at a price greater than 10% above the weighted average of the market value for the linked
units for the five business days immediately preceding the date on which the transaction is effected;
(5) at any point in time, the company will only appoint one agent to effect repurchases on its behalf;
(6) the company or its subsidiary may not repurchase linked units during a prohibited period as defined in paragraph 3.67 of the JSE Listings
Requirements unless there is a repurchase programme in place and the dates and quantities of linked units to be repurchased during the
prohibited period are fixed and full details thereof have been disclosed in an announcement over SENS prior to commencement of the
prohibited period;
(7) a resolution by the board of directors is passed that the board of directors of the company authorises the repurchase, that the company and
the relevant subsidiaries have passed the solvency and liquidity test as set out in section 4 of the Companies Act and that, since the test was
performed, there have been no material changes to the financial position of the group; and
(8) the company’s sponsor will confirm the adequacy of the company’s working capital, for the purposes of undertaking linked unit repurchases,
in writing to the JSE prior to the repurchase of any linked units.”
In accordance with the JSE Listings Requirements, the directors record that:
Although there is no immediate intention to effect a repurchase of linked units of the company, the directors would utilise the general authority
to repurchase securities as and when suitable opportunities present themselves, which opportunities may require expeditious and immediate
action.
The directors, after considering the effect of maximum repurchase, are of the opinion that for a period of 12 months after the date of the notice
of annual general meeting:
(a) the company and the group will be able, in the ordinary course of business, to pay its debts;
(b) the assets of the company and the group will be in excess of the liabilities of the company and the group;
(c) the linked unit capital and reserves of the company and the group will be adequate for ordinary business purposes; and
(d) the working capital of the company and the group will be adequate for ordinary business purposes.
After the company or its subsidiaries has cumulatively repurchased 3% of the initial number of linked units (the number of linked units in issue
at the time that the general authority from unitholders is granted) and for each 3% in aggregate of the initial number of that class acquired
thereafter, an announcement will be made in terms of the JSE Listings Requirements.
Reason for and effect of special resolution number 2
The reason for special resolution number 2 is to afford the company or a subsidiary of the company, a general authority to effect a repurchase
of the company’s linked units on the JSE. The effect of the resolution will be that the directors will have the authority, subject to the JSE Listings
Requirements and the Companies Act, to effect repurchases of the company’s linked units on the JSE, either through the company or through
any subsidiary of the company.

R e s i l i e n t P R o P e R t y i n c o m e F u n d INTEGRATED REPORT 2013 89
The following additional information, which appears elsewhere in the integrated report to which this notice of annual general meeting forms part, is provided in terms of paragraph 11.26/11.30 of the JSE Listings Requirements for purposes of special resolution number 2:
Directors and management – pages 4 to 7 Major linked unitholders – page 23 Directors’ interests in securities/shares/linked units – page 9 Share capital of the company – page 61
Material changes Other than the facts and developments reported on in the integrated report, there have been no material changes in the affairs or financial
position of the company and its subsidiaries between the date of signature of the audit report for the six months ended 30 June 2013 and the date of this notice of annual general meeting.
Litigation statement The directors, whose names appear on pages 4 to 7 of the integrated report of which this notice forms part, are not aware of any legal or
arbitration proceedings, including proceedings that are pending or threatened, that may have or have had in the recent past (being at least the previous 12 months) a material effect on the group’s financial position. The directors have considered the claim instituted against the company relating to the Clairwood Racecourse and, having regard to the legal advice provided to the company that the claim is without merit, do not consider these legal proceedings material.
Directors’ responsibility statement Directors, whose names appear on pages 4 to 7 of the integrated report, collectively and individually accept full responsibility for the accuracy
of the information pertaining to this special resolution and certify that, to the best of their knowledge and belief, there are no facts that have been omitted which would make any statement false or misleading, and that all reasonable enquiries to ascertain such facts have been made and that the special resolution contains all information required in terms of the JSE Listings Requirements.
10 Consider as special resolution number 3: approval of provision of financial assistance for the purchase of linked units “RESOLVED THAT, subject to compliance with the requirements of the Companies Act, the Memorandum of Incorporation and the JSE Listings
Requirements, the company, either as lender or as surety or guarantor for a lender, or otherwise, is hereby authorised, from time to time, to provide financial assistance for the purchase of or subscription for its linked units to any company or trust, the majority of whose shareholders or beneficiaries (directly or indirectly) are ‘black persons’ as defined in the Broad-based Black Economic Empowerment Act, 2003 (or any successor thereto) on the following terms:
(1) the maximum additional capital amount (excluding interest, costs, charges, fees and expenses) of any such amounts lent or for which suretyships or guarantees are given may not exceed R500 million;
(2) the maximum period for the repayment of any loan provided or for which suretyships or guarantees are given in terms hereof may not exceed 10 years; and
(3) the minimum interest rate to be applied to any loan provided may not be less than the prime overdraft rate of interest from time to time publicly quoted as such by The Standard Bank of South Africa Limited.”
Reason for and effect of special resolution number 3 The reason for special resolution number 3 is to afford the company authority to provide financial assistance for the purchase of its linked units
in terms of section 44 of the Companies Act for the purposes of effecting Black Economic Empowerment. The effect of the resolution will be that the directors will have the authority, subject to the Memorandum of Incorporation, the JSE Listings Requirements and the Companies Act, to grant financial assistance on the terms set out in this special resolution.
11 Consider as ordinary resolution 8 “RESOLVED THAT any director of the company or the company secretary be and is hereby authorised to do all such things and sign all such
documents as may be required to give effect to special resolutions numbers 1 to 3.”
Unless otherwise stated, in order for ordinary resolutions to be adopted, the support of more than 50% of the total number of votes exercisable by members, present in person or by proxy, is required and in order for special resolutions to be adopted, the support of at least 75% of the total number of votes exercisable by members, present in person or by proxy, is required to pass such resolution.
Important dates to note: Record date for receipt of notice purposes Friday, 20 September 2013 Last day to trade in order to be eligible to vote Friday, 1 November 2013 Record date for voting purposes (“voting record date”) Friday, 8 November 2013
Statement in terms of section 62(3)(e) of the Companies Act Members holding certificated linked units and members holding linked units in dematerialised form in “own name”: – may attend and vote at the general meeting; alternatively – may appoint an individual as a proxy (who need not also be a member of the company) to attend, participate in and speak and vote in your
place at the general meeting by completing the attached form of proxy (blue) and returning it to the registered office of Resilient or to the transfer secretaries, by no later than 14h00 on Monday, 11 November 2013. Alternatively, the form of proxy may be handed to the chairman of the annual general meeting at the annual general meeting or at any time prior to the commencement of the annual general meeting. Please note that your proxy may delegate his/her authority to act on your behalf to another person, subject to the restrictions set out in the attached form of proxy. Please also note that the attached form of proxy must be delivered to the registered office of Resilient or to the transfer secretaries or handed to the chairman of the annual general meeting, before your proxy may exercise any of your rights as a member of the company at the annual general meeting.

R e s i l i e n t P R o P e R t y i n c o m e F u n d INTEGRATED REPORT 2013 90
NOTICE OF ANNuAl GENERAl MEETING OF SHAREHOldERS ANd dEbENTuRE HOldERS (“MEMbERS”) (CONTINuEd)
Please note that any member of the company that is a company may authorise any person to act as its representative at the annual general
meeting.
Please also note that section 63(1) of the Companies Act requires that persons wishing to participate in the annual general meeting (including
the aforementioned representative) must provide satisfactory identification before they may so participate.
Notice to owners of dematerialised linked units
Please note that if you are the owner of dematerialised linked units held through a CSDP or broker (or their nominee) and are not registered as
an “own name” dematerialised linked unitholder, then you are not a registered linked unitholder of the company, but your CSDP or broker (or
their nominee) would be.
Accordingly, in these circumstances, subject to the mandate between yourself and your CSDP or broker as the case may be:
– if you wish to attend the annual general meeting you must contact your CSDP or broker, and obtain the relevant letter of representation from
it; alternatively
– if you are unable to attend the annual general meeting but wish to be represented at the annual general meeting, you must contact your
CSDP or broker, and furnish it with your voting instructions in respect of the annual general meeting and/or request it to appoint a proxy. You
must not complete the attached form of proxy. The instructions must be provided in accordance with the mandate between yourself and your
CSDP or broker, within the time period required by your CSDP or broker.
– CSDP’s, brokers or their nominees, as the case may be, recorded in the company’s sub-register as holders of dematerialised linked units should,
when authorised in terms of their mandate or instructed to do so by the owner on behalf of whom they hold dematerialised linked units, vote
by either appointing a duly authorised representative to attend and vote at the annual general meeting or by completing the attached form
of proxy (blue) in accordance with the instructions thereon and return it to the registered office of the company or to the transfer secretaries,
by no later than 14h00 on Monday, 11 November 2013. Alternatively, the form of proxy may be handed to the chairman of the annual general
meeting at the annual general meeting at any time prior to the commencement of the annual general meeting.
Voting at the annual general meeting
In order to more effectively record the votes and give effect to the intentions of members, voting on all resolutions will be conducted by way of
a poll.
Electronic participation
Linked unitholders or their proxies may participate in the meeting by way of telephone conference call. Linked unitholders or their proxies who
wish to participate in the annual general meeting via the teleconference facility will be required to advise the company thereof by no later than
14h00 on Monday, 11 November 2013 by submitting, by email to Rajeshree Sookdeyu at [email protected], or by fax to be faxed to
086 621 3400, for the attention of Rajeshree Sookdeyu relevant contact details including email address, cellular number and landline, as well as
full details of the linked unitholder’s title to the shares issued by the company and proof of identity, in the form of copies of identity documents
and share certificates (in the case of certificated linked unitholders), and (in the case of dematerialised linked unitholders) written confirmation
from the linked unitholder’s CSDP confirming the linked unitholder’s title to the dematerialised shares. Upon receipt of the required information,
the linked unitholder concerned will be provided with a secure code and instructions to access the electronic communication during the annual
general meeting.
Linked unitholders who wish to participate in the annual general meeting by way of telephone conference call must note that they will not be
able to vote during the annual general meeting. Such linked unitholders, should they wish to have their vote counted at the annual general
meeting, must, to the extent applicable, (i) complete the form of proxy; or (ii) contact their CSDP or broker, in both instances, as set out above.
Rajeshree SookdeyuCompany secretary
Johannesburg
6 August 2013
Address of registered office Address of transfer secretaries4th Floor, Rivonia Village, Link Market Services South Africa Proprietary Limited
Rivonia Boulevard, Rivonia, 2191 13th Floor, Rennie House, 19 Ameshoff Street, Braamfontein, 2001
(PO Box 2555, Rivonia, 2128) (PO Box 4844, Johannesburg, 2000)

R e s i l i e n t P R o P e R t y i n c o m e F u n d INTEGRATED REPORT 2013 91
FORM OF PROxy
2013
Resilient Property Income Fund Limited
(Incorporated in the Republic of South Africa)
(Registration number: 2002/016851/06)
Share code: RES ISIN: ZAE000043642
(Approved as a REIT by the JSE)
(“Resilient” or “the company”)
For use by the holders of the company’s certificated linked units (“certificated linked unitholders”) and/or dematerialised linked units held through a Central Securities Depository Participant (“CSDP”) or broker who have selected “own name” registration (“own–name dematerialised linked unitholders”), at the twelfth annual general meeting of members of the company to be held at the company’s registered office, 4th Floor, Rivonia Village, Rivonia Boulevard, Rivonia, 2191, on Wednesday, 13 November 2013 at 14h00, or at any adjournment thereof if required. Additional forms of proxy are available from the company’s registered office.
Not for use by dematerialised linked unitholders who have not selected “own name” registration. Such linked unitholders must contact their CSDP or broker timeously if they wish to attend and vote at the annual general meeting and request that they be issued with the necessary Letter of Representation to do so, or provide the CSDP or broker timeously with their voting instructions should they not wish to attend the annual general meeting in order for the CSDP or broker to vote in accordance with their instructions at the annual general meeting.
I/We (name/s in block letters)
of
being the holders of linked units in the capital of the company do hereby appoint:
1 or failing him/her,
2 or failing him/her,
3 the chairman of the annual general meeting
as my/our proxy to act for me/us on my/our behalf at the annual general meeting or any adjournment thereof, which will be held for purposes of considering and, if deemed fit, passing, with or without modification, the ordinary and special resolutions to be proposed thereat as detailed in the notice of annual general meeting; and to vote for and/or against such resolutions and/or to abstain from voting for and/or against the resolutions in respect of the linked units registered in my/our name in accordance with the following instructions:
For Against Abstain
Ordinary resolution number 1.1 (re-election of Desmond de Beer as director)
Ordinary resolution number 1.2 (re-election of Jacobus Johann Kriek as director)
Ordinary resolution number 2.1 (re-election of Marthin Petrus Greyling as director)
Ordinary resolution number 2.2 (re-election of Mfundiso Johnson Ntabankulu Njeke as director)
Ordinary resolution number 2.3 (re-election of Barry Daniel van Wyk as director)
Ordinary resolution number 3.1 (re-election of Marthin Petrus Greyling as a member of the audit committee)
Ordinary resolution number 3.2 (re-election of Bryan Douglas Hopkins as a member of the audit committee)
Ordinary resolution number 3.3 (re-election of Barry Daniel van Wyk as a member of the audit committee)
Ordinary resolution number 4 (reappointment of auditors)
Ordinary resolution number 5 (authorising directors to determine auditors’ remuneration)
Ordinary resolution number 6 (unissued shares under the control of the directors)
Ordinary resolution number 7 (general authority to issue securities for cash)
Special resolution number 1 (approval of financial assistance to related or inter-related companies)
Special resolution number 2 (approval of the repurchase of linked units)
Special resolution number 3 (approval of provision of financial assistance for the purchase of linked units)
Ordinary resolution number 8 (authority for directors or company secretary to implement resolutions)
Signed at on
Signature
Assisted by (where applicable)
(Indicate instructions to proxy in the spaces provided above). Unless otherwise instructed, my proxy may vote as he thinks fit.
Please read the notes on the reverse side hereof.

R e s i l i e n t P R o P e R t y i n c o m e F u n d INTEGRATED REPORT 2013 92
NOTES TO THE FORM OF PROxy
1 Any alteration or correction made to this form of proxy must be initialled by the signatory(ies).
2 Members that are certificated or own–name dematerialised unitholders entitled to attend and vote at the annual general meeting may
insert the name of a proxy or the names of two alternative proxies of the member’s choice in the space/s provided, with or without deleting
“the chairperson of the annual general meeting”, but any such deletion must be initialled by the unitholder(s). Such proxy/ies may participate
in, speak and vote at the annual general meeting in the place of that unitholder at the annual general meeting. The person whose name stands
first on the form of proxy and who is present at the meeting will be entitled to act as proxy to the exclusion of those whose names follow.
If no proxy is named on a lodged form of proxy the chairperson shall be deemed to be appointed as the proxy.
3 A member’s instructions to the proxy must be indicated by the insertion of the relevant number of votes exercisable by the member in the
appropriate box(es) provided. Failure to comply with the above will be deemed to authorise the proxy, in the case of any proxy other than the
chairperson, to vote or abstain from voting as deemed fit and in the case of the chairperson to vote in favour of the resolution.
4 A member or his/her proxy is not obliged to use all the votes exercisable by the member, but the total of the votes cast or abstained may not
exceed the total of the votes exercisable in respect of the linked units held by the member.
5 A member may revoke the proxy appointment by (i) cancelling it in writing, or making a later inconsistent appointment of a proxy; and (ii) delivering
a copy of the revocation instrument to the proxy, and to the company. The revocation of a proxy appointment constitutes a complete and
final cancellation of the proxy’s authority to act on behalf of the unitholder as at the later of the date stated in the revocation instrument,
if any; or the date on which the revocation instrument was delivered in the required manner.
6 A vote given in terms of an instrument of proxy shall be valid in relation to the annual general meeting notwithstanding the death of the
person granting it or the transfer of the linked units in respect of which the vote is given, unless an intimation in writing of such death or
transfer is received by the transfer secretaries not less than 48 hours before the commencement of the annual general meeting.
7 The chairperson of the annual general meeting may reject or accept any form of proxy which is completed and/or received otherwise than
in compliance with these notes, provided that, in respect of acceptances, the chairperson is satisfied as to the manner in which the member
concerned wishes to vote.
8 The completion and lodging of this form of proxy will not preclude the relevant member from attending the meeting and speaking and voting
in person thereat to the exclusion of any proxy appointed in terms hereof, should such member wish to do so.
9 Documentary evidence establishing the authority of a person signing this form of proxy in a representative capacity must be attached to
this form of proxy, unless previously recorded by the company or the transfer secretaries or waived by the chairperson of the annual general
meeting.
10 A minor or any other person under legal incapacity must be assisted by his/her parent or guardian, as applicable, unless the relevant
documents establishing his/her capacity are produced or have been registered by the company or the transfer secretaries.
11 Where there are joint holders of linked units, the vote of the first joint holder who tenders a vote, as determined by the order in which the
names stand in the register of members, will be accepted and only that holder whose name appears first in the register in respect of such
linked units need to sign this form of proxy.
12 The aforegoing notes contain a summary of the relevant provisions of section 58 of the Companies Act.
Forms of proxy must be lodged at, posted or faxed to the transfer secretaries, Link Market Services South Africa Proprietary Limited:
Hand deliveries to: Link Market Services South Africa Proprietary Limited
13th Floor, Rennie House,
19 Ameshoff Street,
Braamfontein, 2001
Postal deliveries to:
Link Market Services South Africa Proprietary Limited
PO Box 4844,
Johannesburg, 2000
Fax to: 086 674 2450
to be received by no later than 14h00 on Monday, 11 November 2013.

R E S I l I E N T P R O P E R T y I N c O M E F U N D integrated rePOrt 2013 93
FACT SHEET
company name Resilient Property Income Fund Limited
(Registration number: 2002/016851/06)
registered address 4th Floor, Rivonia Village,
Rivonia Boulevard, Rivonia, 2191
(PO Box 2555, Rivonia, 2128)
Website address www.resilient.co.za
Year-end 30 June
chairman of the board JJ Njeke
Board of directors JJ Njeke (chairman); Thembi Chagonda; Des de Beer; Andries de Lange;
Marthin Greyling; Nick Hanekom; Bryan Hopkins; Johann Kriek; Spiro Noussis;
Umsha Reddy; Barry van Wyk
Independent non-executive 6
Non-independent non-executive 1
Executive 4
11
managing director Des de Beer
company secretary Rajeshree Sookdeyu
corporate advisers Java Capital
external auditors Deloitte & Touche
date of listing 6 December 2002
units in issue 289 544 070 (2012: 285 744 070 inclusive of BEE SPV)
gearing ratio 26,5% (2012: 27,9%)
investment portfolio Direct property R12 178 million / 73,4% of portfolio
(2012: R10 894 million / 74,5% of portfolio)
Listed property securities R4 411 million / 26,6% of portfolio
(2012: R3 720 million / 25,5% of portfolio)
unit price (cents per unit) 2013 2012
High 6 120 5 600
Low 4 670 3 427
Closing 5 374 5 175
distributions (cents) 2013 2012 (6 months) (12 months)
Interim 120,74
Final 136,23 134,93
136,23 255,67
Volume traded 44,9 million units – 6 months (2012: 69,1 million units – 12 months)
Value traded R2 426,5 million – 6 months (2012: R2 995,2 million – 12 months)
annual general meeting 13 November 2013 at 14h00
(4th Floor, Rivonia Village, Rivonia Boulevard, Rivonia, 2191)
distribution calendar (final distribution for the 2013 financial year) Last day to trade cum distribution 23 August 2013
Record date 30 August 2013
Distribution payment 2 September 2013
3746 visual IGNITION 011 888 5511

www.resilient.co.za
RESILIENT PROPERTY INCOME FUND
4th Floor, Rivonia Village, Rivonia Boulevard, Rivonia, 2191
PO Box 2555, Rivonia, 2128
Tel +27 (0)11 612 6800 Fax +27 (0)11 612 6869
R E S I L I E N TProperty Income Fund