quickstart – 7050 series management fundamentals · quickstart – 7050 series management...
TRANSCRIPT

QuickStart – 7050 Series Management Fundamentals
Arista Whitepaper – June 2013
1
Summary
Several mechanisms exist to manage Arista Networks’ devices, ranging from industry standard SNMP counters to more Arista EOS or platform specific functionality and deep debugging capabilities. With specific regard to the 7050 family the following management tools are available:
1. Syslog and Console Logging
2. SNMP Versions 1,2 and 3
3. Hardware Specific ‘show’ Commands
4. System and Process Level Logging
5. VRF Aware Management
6. Arista EOS API
7. tcpdump
8. EOS Process Tracing
9. Advanced Event Management
10. Installing and removing EOS Extensions
11. sFLOW
12. Port Mirroring
This document serves to highlight the basic configuration required to automate monitoring of an EOS based device, while providing a high level overview of additional, more advanced functionality for low level troubleshooting and application specific monitoring.
Many of the topics in this document are discussed in greater detail at the Arista EOS Central webpage, eos.aristanetworks.com. EOS Central offers access to development tools, script examples, and interactive support in an open collaborative environment.

QuickStart – 7050 Series Management Fundamentals
Arista Whitepaper – June 2013
2
Configuring Syslog and Console Logging
For common system logging, EOS follows industry standard configuration semantics:
Console logging defaults to error and higher level messages:
Note: By default console/monitor logging will not be printed to the terminal (SSH/Telnet), it can be enabled using the command ‘terminal monitor’.
7050-1(config)#logging ? buffered Set buffered logging parameters console Set console logging parameters event Global events facility Set logging facility format Set logging format parameters host Set syslog server IP address and parameters level Configure logging severity on Enable logging to all supported destinations trap Set syslog server logging level 7050-1(config)#logging host logs.foo.com
7050-1(config)#logging console ? alerts Immediate action needed (severity=1) critical Critical conditions (severity=2) debugging Debugging messages (severity=7) emergencies System is unusable (severity=0) errors Error conditions (severity=3) informational Informational messages (severity=6) notifications Normal but significant conditions (severity=5) warnings Warning conditions (severity=4) <0-7> Logging severity level <cr>

QuickStart – 7050 Series Management Fundamentals
Arista Whitepaper – June 2013
3
SNMP Configuration and Overview
EOS supports a growing number of both Arista proprietary and standards based MIBs providing the ability to quickly integrate devices into 3rd party monitoring solutions. The current list of supported MIBs can be accessed at the following URL:
http://www.aristanetworks.com/en/support/aristasnmpmibs
Configuring SNMP support on the device follows industry standard syntax (e.g. for SNMPv2)
EOS also natively provides the ability to walk and search local MIBs enabling easy location of specific OIDs
7050-1>en 7050-1#conf t 7050-1(config)#snmp-server community public 7050-1(config)#snmp-server host trap.foo.com public
7050-1(config)#sh snmp mib ? get get one object get-next get the next object table get the contents of a table walk walk a subtree 7050-1(config)#sh snmp mib walk ? OID An object-ID (e.g., IP-MIB::ipAddrTable) > Redirect output to URL >> Append redirected output to URL | Output modifiers <cr> 7050-1(config)#sh snmp mib walk . | grep -i processor HOST-RESOURCES-MIB::hrDeviceType[1] = OID: HOST-RESOURCES-TYPES::hrDeviceProcessor HOST-RESOURCES-MIB::hrDeviceType[2] = OID: HOST-RESOURCES-TYPES::hrDeviceProcessor HOST-RESOURCES-MIB::hrDeviceType[3] = OID: HOST-RESOURCES-TYPES::hrDeviceProcessor HOST-RESOURCES-MIB::hrDeviceDescr[1] = STRING: AMD Turion(tm) II Neo N41H Dual-Core Processor HOST-RESOURCES-MIB::hrProcessorFrwID[1] = OID: SNMPv2-SMI::zeroDotZero HOST-RESOURCES-MIB::hrProcessorFrwID[2] = OID: SNMPv2-SMI::zeroDotZero HOST-RESOURCES-MIB::hrProcessorFrwID[3] = OID: SNMPv2-SMI::zeroDotZero HOST-RESOURCES-MIB::hrProcessorLoad[1] = INTEGER: 9 HOST-RESOURCES-MIB::hrProcessorLoad[2] = INTEGER: 10 HOST-RESOURCES-MIB::hrProcessorLoad[3] = INTEGER: 8 7050-1(config)#
QuickStart – 7050 Series Management Fundamentals
Arista Whitepaper – June 2013
4
Suggested SNMP OIDs for General System Health
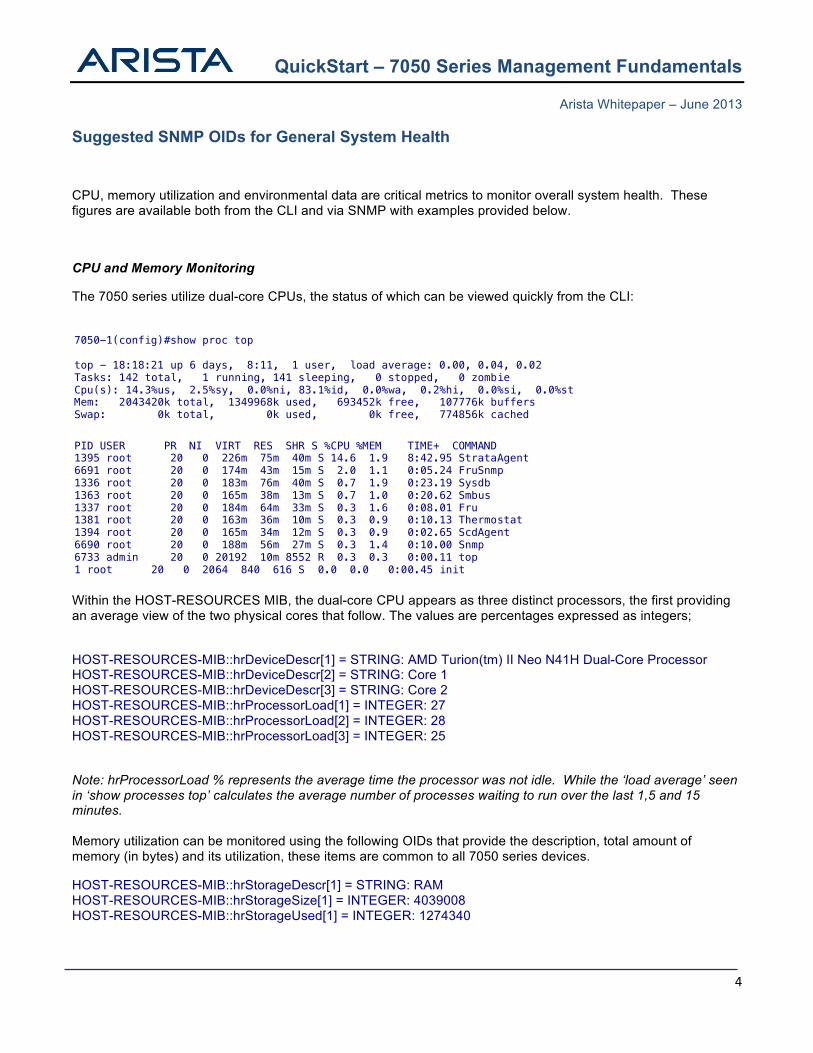
CPU, memory utilization and environmental data are critical metrics to monitor overall system health. These figures are available both from the CLI and via SNMP with examples provided below.
CPU and Memory Monitoring
The 7050 series utilize dual-core CPUs, the status of which can be viewed quickly from the CLI:
Within the HOST-RESOURCES MIB, the dual-core CPU appears as three distinct processors, the first providing an average view of the two physical cores that follow. The values are percentages expressed as integers;
HOST-RESOURCES-MIB::hrDeviceDescr[1] = STRING: AMD Turion(tm) II Neo N41H Dual-Core Processor HOST-RESOURCES-MIB::hrDeviceDescr[2] = STRING: Core 1 HOST-RESOURCES-MIB::hrDeviceDescr[3] = STRING: Core 2 HOST-RESOURCES-MIB::hrProcessorLoad[1] = INTEGER: 27 HOST-RESOURCES-MIB::hrProcessorLoad[2] = INTEGER: 28 HOST-RESOURCES-MIB::hrProcessorLoad[3] = INTEGER: 25
Note: hrProcessorLoad % represents the average time the processor was not idle. While the ‘load average’ seen in ‘show processes top’ calculates the average number of processes waiting to run over the last 1,5 and 15 minutes. Memory utilization can be monitored using the following OIDs that provide the description, total amount of memory (in bytes) and its utilization, these items are common to all 7050 series devices.
HOST-RESOURCES-MIB::hrStorageDescr[1] = STRING: RAM HOST-RESOURCES-MIB::hrStorageSize[1] = INTEGER: 4039008 HOST-RESOURCES-MIB::hrStorageUsed[1] = INTEGER: 1274340
7050-1(config)#show proc top top - 18:18:21 up 6 days, 8:11, 1 user, load average: 0.00, 0.04, 0.02 Tasks: 142 total, 1 running, 141 sleeping, 0 stopped, 0 zombie Cpu(s): 14.3%us, 2.5%sy, 0.0%ni, 83.1%id, 0.0%wa, 0.2%hi, 0.0%si, 0.0%st Mem: 2043420k total, 1349968k used, 693452k free, 107776k buffers Swap: 0k total, 0k used, 0k free, 774856k cached PID USER PR NI VIRT RES SHR S %CPU %MEM TIME+ COMMAND 1395 root 20 0 226m 75m 40m S 14.6 1.9 8:42.95 StrataAgent 6691 root 20 0 174m 43m 15m S 2.0 1.1 0:05.24 FruSnmp 1336 root 20 0 183m 76m 40m S 0.7 1.9 0:23.19 Sysdb 1363 root 20 0 165m 38m 13m S 0.7 1.0 0:20.62 Smbus 1337 root 20 0 184m 64m 33m S 0.3 1.6 0:08.01 Fru 1381 root 20 0 163m 36m 10m S 0.3 0.9 0:10.13 Thermostat 1394 root 20 0 165m 34m 12m S 0.3 0.9 0:02.65 ScdAgent 6690 root 20 0 188m 56m 27m S 0.3 1.4 0:10.00 Snmp 6733 admin 20 0 20192 10m 8552 R 0.3 0.3 0:00.11 top 1 root 20 0 2064 840 616 S 0.0 0.0 0:00.45 init

QuickStart – 7050 Series Management Fundamentals
Arista Whitepaper – June 2013
5
Environmental Factors
Each Arista Switch is equipped with an array of sensors for monitoring temperature, fan speed and power draw. The detailed information available through the CLI maps directly to a number of OIDs.
Note: If the temperature reaches the Alert threshold, all fans run at maximum speed and a warning message is logged. If the temperature reaches the critical threshold the component is immediately shut down with the status LED flashing orange, in order to prevent damage.
7050-1#sh environment all System temperature status is: Ok Alert Critical Sensor Description Temperature Threshold Threshold ------- ------------------------------------ ------------- ---------- ---------- 1 Cpu temp sensor 37.717C 95C 100C 2 Rear temp sensor 31.750C 55C 65C 3 Front-panel temp sensor 26.000C 65C 75C 4 Trident Bottom Right Outer 30.320C 100C 110C 5 Trident Bottom Left Outer 31.405C 100C 110C 6 Trident Top Left Outer 31.947C 100C 110C 7 Trident Top Right Outer 30.320C 100C 110C 8 Trident Bottom Right Inner 33.574C 100C 110C 9 Trident Bottom Left Inner 31.405C 100C 110C 10 Trident Top Left Inner 31.405C 100C 110C 11 Trident Top Right Inner 33.032C 100C 110C System cooling status is: Ok Ambient temperature: 26C Airflow: front-to-back Fan Tray Status Speed -------------- --------------- ------ 1 Ok 49% 2 Ok 49% 3 Ok 49% 4 Ok 49% PowerSupply1 Ok 52% PowerSupply2 Ok 52% Power Input Output Output Supply Model Capacity Current Current Power Status ------- -------------------- --------- -------- -------- -------- ------------- 1 PWR-460AC-F 460W 0.00A 0.00A 0.0W AC Loss 2 PWR-460AC-F 460W 0.39A 5.50A 67.0W Ok
QuickStart – 7050 Series Management Fundamentals
Arista Whitepaper – June 2013
6
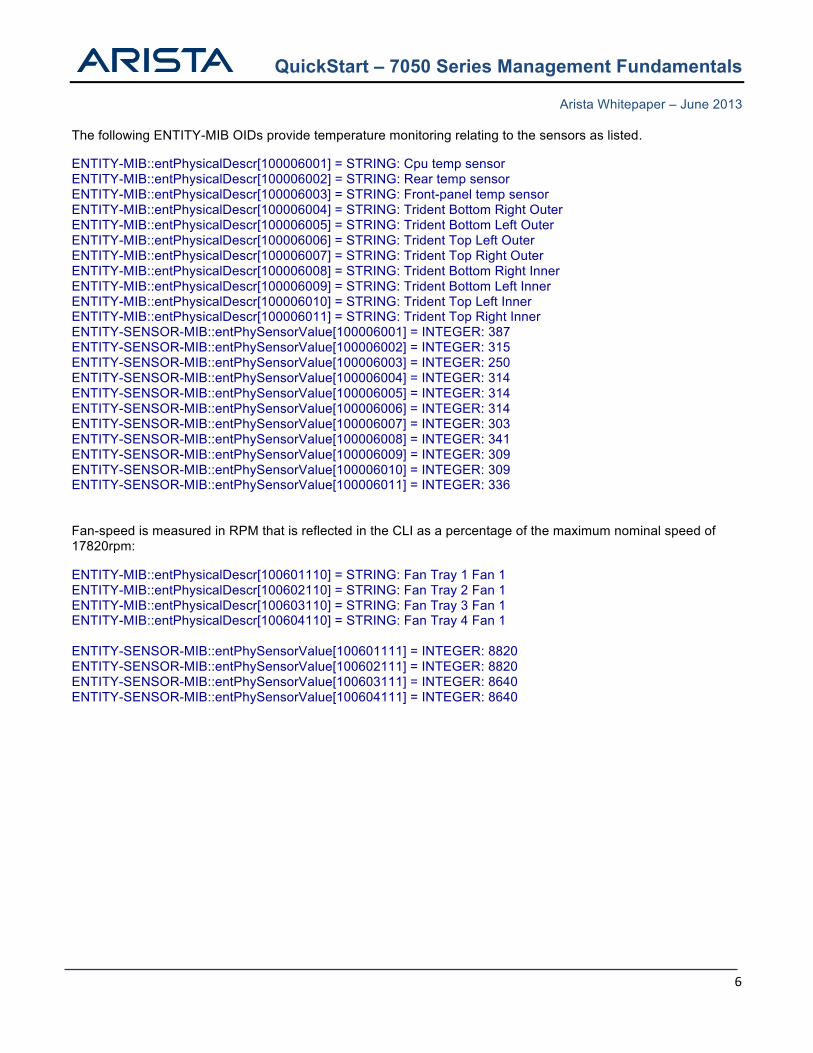
The following ENTITY-MIB OIDs provide temperature monitoring relating to the sensors as listed.
ENTITY-MIB::entPhysicalDescr[100006001] = STRING: Cpu temp sensor ENTITY-MIB::entPhysicalDescr[100006002] = STRING: Rear temp sensor ENTITY-MIB::entPhysicalDescr[100006003] = STRING: Front-panel temp sensor ENTITY-MIB::entPhysicalDescr[100006004] = STRING: Trident Bottom Right Outer ENTITY-MIB::entPhysicalDescr[100006005] = STRING: Trident Bottom Left Outer ENTITY-MIB::entPhysicalDescr[100006006] = STRING: Trident Top Left Outer ENTITY-MIB::entPhysicalDescr[100006007] = STRING: Trident Top Right Outer ENTITY-MIB::entPhysicalDescr[100006008] = STRING: Trident Bottom Right Inner ENTITY-MIB::entPhysicalDescr[100006009] = STRING: Trident Bottom Left Inner ENTITY-MIB::entPhysicalDescr[100006010] = STRING: Trident Top Left Inner ENTITY-MIB::entPhysicalDescr[100006011] = STRING: Trident Top Right Inner ENTITY-SENSOR-MIB::entPhySensorValue[100006001] = INTEGER: 387 ENTITY-SENSOR-MIB::entPhySensorValue[100006002] = INTEGER: 315 ENTITY-SENSOR-MIB::entPhySensorValue[100006003] = INTEGER: 250 ENTITY-SENSOR-MIB::entPhySensorValue[100006004] = INTEGER: 314 ENTITY-SENSOR-MIB::entPhySensorValue[100006005] = INTEGER: 314 ENTITY-SENSOR-MIB::entPhySensorValue[100006006] = INTEGER: 314 ENTITY-SENSOR-MIB::entPhySensorValue[100006007] = INTEGER: 303 ENTITY-SENSOR-MIB::entPhySensorValue[100006008] = INTEGER: 341 ENTITY-SENSOR-MIB::entPhySensorValue[100006009] = INTEGER: 309 ENTITY-SENSOR-MIB::entPhySensorValue[100006010] = INTEGER: 309 ENTITY-SENSOR-MIB::entPhySensorValue[100006011] = INTEGER: 336 Fan-speed is measured in RPM that is reflected in the CLI as a percentage of the maximum nominal speed of 17820rpm:
ENTITY-MIB::entPhysicalDescr[100601110] = STRING: Fan Tray 1 Fan 1 ENTITY-MIB::entPhysicalDescr[100602110] = STRING: Fan Tray 2 Fan 1 ENTITY-MIB::entPhysicalDescr[100603110] = STRING: Fan Tray 3 Fan 1 ENTITY-MIB::entPhysicalDescr[100604110] = STRING: Fan Tray 4 Fan 1 ENTITY-SENSOR-MIB::entPhySensorValue[100601111] = INTEGER: 8820 ENTITY-SENSOR-MIB::entPhySensorValue[100602111] = INTEGER: 8820 ENTITY-SENSOR-MIB::entPhySensorValue[100603111] = INTEGER: 8640 ENTITY-SENSOR-MIB::entPhySensorValue[100604111] = INTEGER: 8640
QuickStart – 7050 Series Management Fundamentals
Arista Whitepaper – June 2013
7
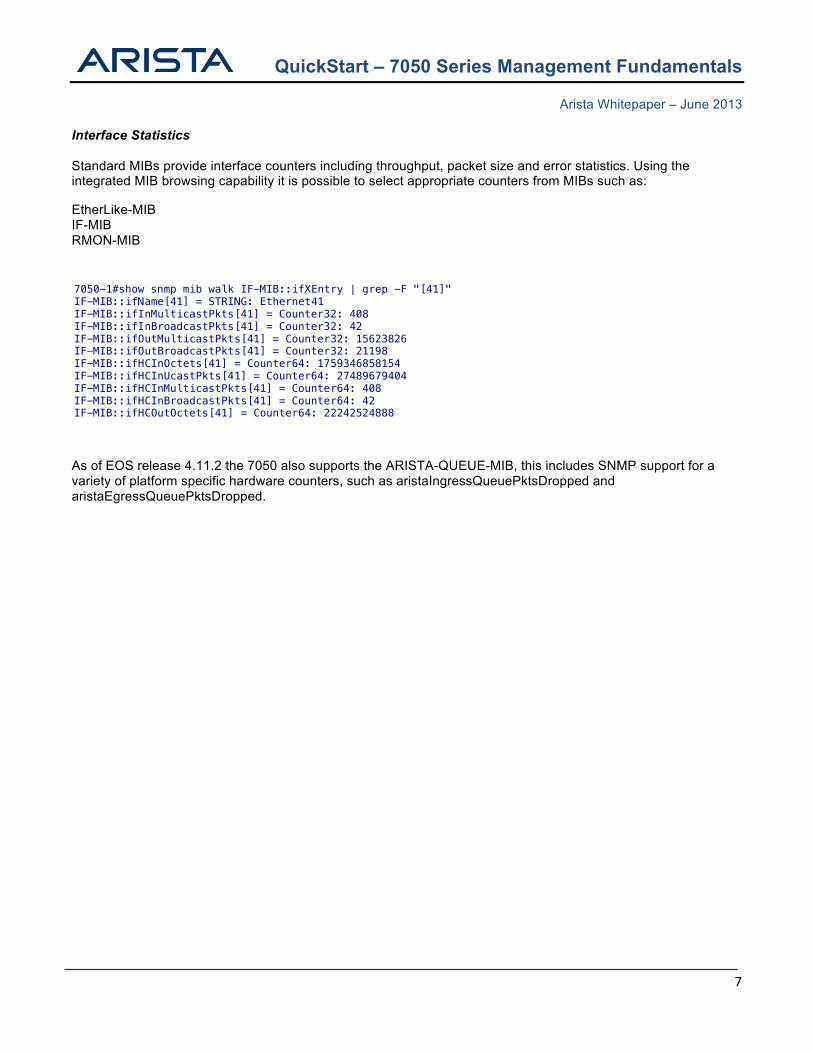
Interface Statistics Standard MIBs provide interface counters including throughput, packet size and error statistics. Using the integrated MIB browsing capability it is possible to select appropriate counters from MIBs such as:
EtherLike-MIB IF-MIB RMON-MIB
As of EOS release 4.11.2 the 7050 also supports the ARISTA-QUEUE-MIB, this includes SNMP support for a variety of platform specific hardware counters, such as aristaIngressQueuePktsDropped and aristaEgressQueuePktsDropped.
7050-1#show snmp mib walk IF-MIB::ifXEntry | grep -F "[41]" IF-MIB::ifName[41] = STRING: Ethernet41 IF-MIB::ifInMulticastPkts[41] = Counter32: 408 IF-MIB::ifInBroadcastPkts[41] = Counter32: 42 IF-MIB::ifOutMulticastPkts[41] = Counter32: 15623826 IF-MIB::ifOutBroadcastPkts[41] = Counter32: 21198 IF-MIB::ifHCInOctets[41] = Counter64: 1759346858154 IF-MIB::ifHCInUcastPkts[41] = Counter64: 27489679404 IF-MIB::ifHCInMulticastPkts[41] = Counter64: 408 IF-MIB::ifHCInBroadcastPkts[41] = Counter64: 42 IF-MIB::ifHCOutOctets[41] = Counter64: 22242524888 IF-MIB::ifHCOutUcastPkts[41] = Counter64: 1758550

QuickStart – 7050 Series Management Fundamentals
Arista Whitepaper – June 2013
8
Platform Specific Show Commands
Under the EOS CLI, a hierarchy of hardware specific show commands enable granular visibility into detailed hardware counters. The 7050 series utilizes the Broadcom Trident+ ASIC, which provides the naming convention in the command tree.
Reviewing the context help for ‘sh platform trident’ below there are a few areas of immediate interest for scripted monitoring and troubleshooting as well as access to the hardware MAC table, (m)route cache and tcam information.
‘show platform trident counters’ for example, provides a large number of metrics including a packet types, drop counters and errors. Outputs for all interfaces can be collected using ‘show platform trident counters ’ while the ‘| nz’ filter may be used to remove lines with zero value counters.
Understanding TCAM utilization may also be critical in planning for topology and configuration changes. The Broadcom Trident ASIC’s TCAM is shared between Control-Plane policing (CoPP), QoS classification, IGMP Snooping, storm control and ACL definitions and the balance between these and free space is available via the following command:
Note; The number of available entries for a TCAM Group includes all entries in the shared pool, these entries can be used by any TCAM group. Therefore the same entry may be included in the ‘free’ count for multiple TCAM groups.
7050-1#show platform trident ? counters Trident debug counters interface Show internal interface state mac-address-table Show hardware MAC address table mroutes Show internal multicast routes routes Show internal routes tcam Trident TCAM information
7050-1#show platform trident tcam detail === TCAM detail for switch trident0 === TCAM group 10 uses 14 entries and can use up to 882 more. ACL management uses 3 entries. 655360 0 hits - Port blocking entry for ACL updates 655362 0 hits - Drop marked ACL packets 655361 0 hits - Port blocking entry for ACL updates L2 Control Priority uses 3 entries. 655364 0 hits - LACPDU Priority Elevator 655365 0 hits - LLDPDU Priority Elevator 655363 0 hits - BPDU Priority Elevator Storm Control uses 3 entries. 655368 0 hits - Broadcast skip 655366 0 hits - STP BPDU no-drop 655367 0 hits - PVST BPDU no-drop L3 Routing reserves 5 entries (1 used). 655433 0 hits - IPv6 management TCAM group 9 uses 9 entries and can use up to 887 more. L3 Control Priority uses 2 entries. 589824 0 hits - RouterL3 Priority Elevator 589825 0 hits - L3 Miss Priority Elevator IGMP Snooping Flooding reserves 7 entries (1 used). 589826 0 hits - L2 Mcast Flooding

QuickStart – 7050 Series Management Fundamentals
Arista Whitepaper – June 2013
9
System and Process Logging
The current system log buffer can be viewed using the ‘show logging’ command:
The logging output can become large in size, so can be filtered with various command options.
In addition to the EOS log provided by the ‘show logging’ CLI command, EOS keeps detailed system-wide logs. These logs can be accessed using either the ‘show logging all’ command or retrieved from bash directly using the command ‘bash sudo tail /var/log/messages’:
Note – The addition of the ‘all’ argument in the above example will include the Kernel logs in as well as the additional agent logs.
7050-1#bash show logging all Sep 30 21:01:01 7050-1 CROND[6890]: (root) CMD (run-parts /etc/cron.hourly) Sep 30 21:01:01 7050-1 run-parts(/etc/cron.hourly)[6890]: starting 0anacron Sep 30 21:01:01 7050-1 anacron[6899]: Anacron started on 2011-09-30 Sep 30 21:01:01 7050-1 anacron[6899]: Normal exit (0 jobs run) Sep 30 21:01:01 7050-1 run-parts(/etc/cron.hourly)[6901]: finished 0anacron Sep 30 21:01:01 7050-1 run-parts(/etc/cron.hourly)[6890]: starting logrotate Sep 30 21:01:01 7050-1 run-parts(/etc/cron.hourly)[6908]: finished logrotate
7050S#show logging ? alerts Immediate action needed all Show all the lines in the logging buffer critical Critical conditions debugging Debugging messages emergencies System is unusable errors Error conditions informational Informational messages last Show messages in last <N> time-units notifications Normal but significant conditions system Show the contents of the system log buffer threshold Show only log messages at threshold level or above time-range Filter logs by begin and end time warnings Warning conditions <1-9999> Show last number of messages in the logging buffers
7050-1 #show logging Log Buffer: Apr 3 05:27:02 sq301 Stp: %SPANTREE-6-INTERFACE_STATE: Interface Ethernet9 instance MST0 moving from discarding to learning Apr 3 05:27:02 sq301 Stp: %SPANTREE-6-INTERFACE_STATE: Interface Ethernet9 instance MST0 moving from learning to forwarding Apr 3 05:27:15 sq301 Cli: %SYS-5-CONFIG_E: Enter configuration mode from console by admin on con0 (0.0.0.0) Apr 3 05:27:19 sq301 Cli: %SYS-5-CONFIG_I: Configured from console by admin on con0 (0.0.0.0)

QuickStart – 7050 Series Management Fundamentals
Arista Whitepaper – June 2013
10
Note - Bash shell commands may be executed directly from the CLI or alternatively a shell may be launched providing full access to familiar Linux tool sets for managing files:
Individual agent logs are available in ‘/var/log/agents’ multiple restarts of an agent will create multiple files, each suffixed with the new process ID.
Key Agents
• Rib – The Routing Information Base, a table of the best routes to all known destinations. • Ebra – Ethernet Bridging Agent – L2 interaction with the Kernel • Ira – IP Routing Agent – L3 interaction with the kernel. • StrataAgent – Interacts with the ASIC moving software configuration into hardware. • ProcMgr-worker – Monitors the health of other processes, and restarts any that fail. • SysDB – Contains state information for all running processes.
7050-1#bash Arista Networks EOS shell [admin@7050-1 ~]$ cd /var/log [admin@7050-1 log]$ sudo grep stp messages Sep 30 19:58:29 localhost Launcher: %LAUNCHER-6-PROCESS_START: Configuring process 'StpTopology' to start in role 'ActiveSupervisor' Sep 30 19:58:29 localhost Launcher: %LAUNCHER-6-PROCESS_START: Configuring process 'Stp' to start in role 'ActiveSupervisor' Sep 30 19:58:30 localhost ProcMgr-worker: %PROCMGR-6-PROCESS_STARTED: 'StpTopology' starting with PID=1367 (PPID=1334) -- execing '/usr/bin/StpTopology' Sep 30 19:58:30 localhost ProcMgr-worker: %PROCMGR-6-PROCESS_STARTED: 'Stp' starting with PID=1373 (PPID=1334) -- execing '/usr/bin/Stp' Sep 30 19:58:40 localhost ProcMgr-worker: %PROCMGR-7-PROCESSES_ADOPTED: ProcMgr (PID=1334) adopted running processes:
[admin@7050-1 log]$ cd /var/log/agents [admin@7050-1 agents]$ ls Aaa-1358 Lag-1359 Pmbus-1603 Stp-1373 Acl-1375 Launcher-1335 PowerManager-1365 StpTopology-1367 Arp-1379 LedPolicy-1357 PowerSupplyDetector-1371 StrataAgent-1378 Ebra-1386 Lldp-1351 ProcMgr-worker-1334 SuperServer-1353 FanDetector-1355 Lm73-1385 Rib-1389 Sysdb-1336 Fru-1337 Max6658-1352 Sb820-1361 Thermostat-1381 FruSnmp-6691 MirroringAgent-1368 Scd-1382 TopoAgent-1383 IgmpSnooping-1390 PciBus-1376 Smbus-1363 Ucd9012-1354 Ira-1356 PhyEthtool-1362 Snmp-6690 Xcvr-1372 [admin@7050-1 agents]$
QuickStart – 7050 Series Management Fundamentals
Arista Whitepaper – June 2013
11
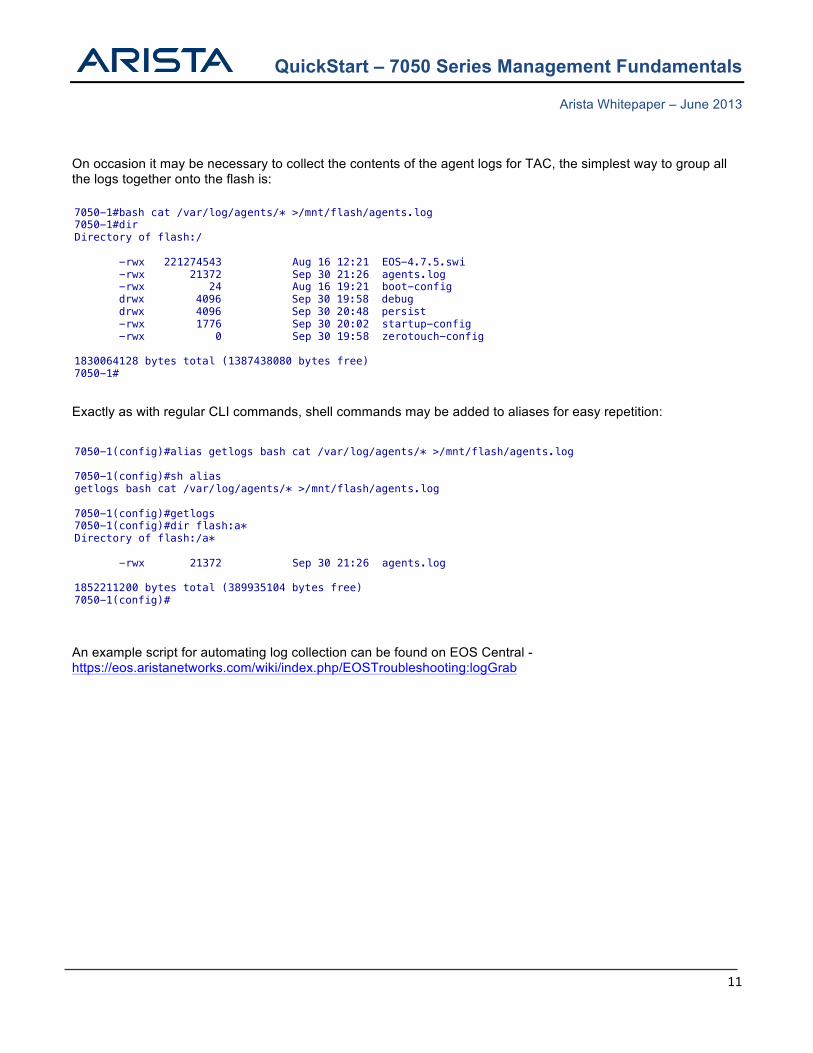
On occasion it may be necessary to collect the contents of the agent logs for TAC, the simplest way to group all the logs together onto the flash is:
Exactly as with regular CLI commands, shell commands may be added to aliases for easy repetition:
An example script for automating log collection can be found on EOS Central - https://eos.aristanetworks.com/wiki/index.php/EOSTroubleshooting:logGrab
7050-1#bash cat /var/log/agents/* >/mnt/flash/agents.log 7050-1#dir Directory of flash:/ -rwx 221274543 Aug 16 12:21 EOS-4.7.5.swi -rwx 21372 Sep 30 21:26 agents.log -rwx 24 Aug 16 19:21 boot-config drwx 4096 Sep 30 19:58 debug drwx 4096 Sep 30 20:48 persist -rwx 1776 Sep 30 20:02 startup-config -rwx 0 Sep 30 19:58 zerotouch-config 1830064128 bytes total (1387438080 bytes free) 7050-1#
7050-1(config)#alias getlogs bash cat /var/log/agents/* >/mnt/flash/agents.log 7050-1(config)#sh alias getlogs bash cat /var/log/agents/* >/mnt/flash/agents.log 7050-1(config)#getlogs 7050-1(config)#dir flash:a* Directory of flash:/a* -rwx 21372 Sep 30 21:26 agents.log 1852211200 bytes total (389935104 bytes free) 7050-1(config)#
QuickStart – 7050 Series Management Fundamentals
Arista Whitepaper – June 2013
12
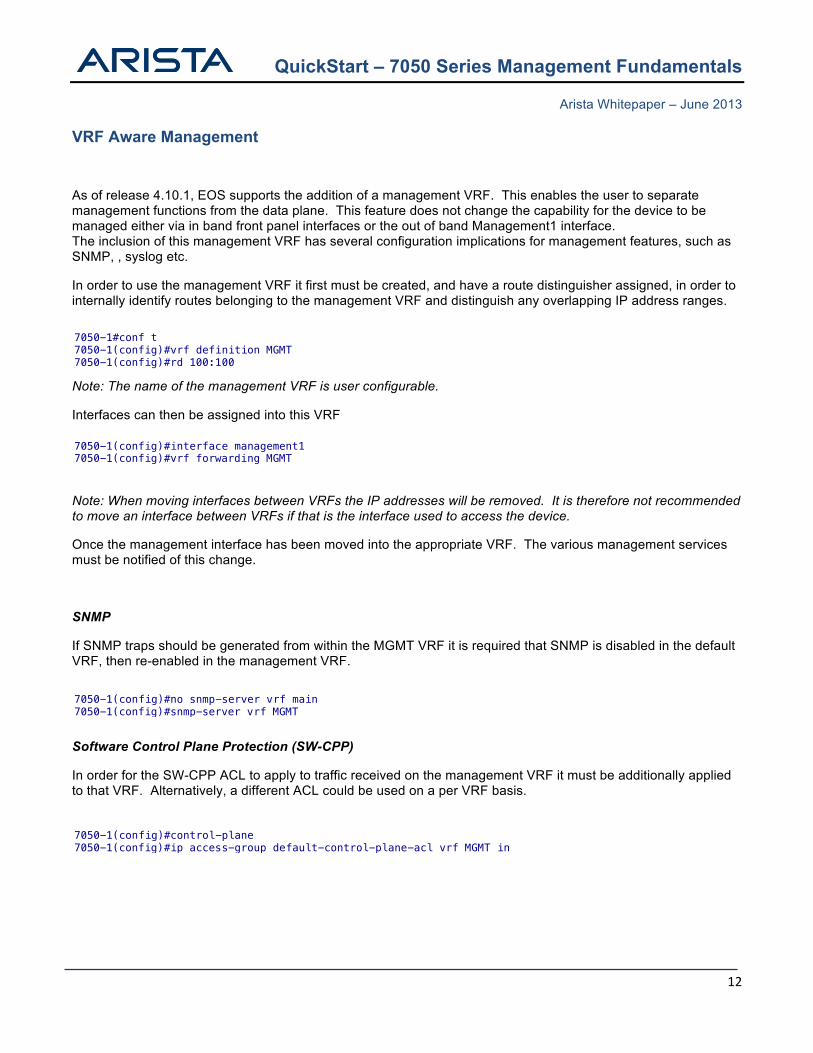
VRF Aware Management
As of release 4.10.1, EOS supports the addition of a management VRF. This enables the user to separate management functions from the data plane. This feature does not change the capability for the device to be managed either via in band front panel interfaces or the out of band Management1 interface. The inclusion of this management VRF has several configuration implications for management features, such as SNMP, , syslog etc.
In order to use the management VRF it first must be created, and have a route distinguisher assigned, in order to internally identify routes belonging to the management VRF and distinguish any overlapping IP address ranges.
Note: The name of the management VRF is user configurable.
Interfaces can then be assigned into this VRF
Note: When moving interfaces between VRFs the IP addresses will be removed. It is therefore not recommended to move an interface between VRFs if that is the interface used to access the device.
Once the management interface has been moved into the appropriate VRF. The various management services must be notified of this change.
SNMP
If SNMP traps should be generated from within the MGMT VRF it is required that SNMP is disabled in the default VRF, then re-enabled in the management VRF.
Software Control Plane Protection (SW-CPP)
In order for the SW-CPP ACL to apply to traffic received on the management VRF it must be additionally applied to that VRF. Alternatively, a different ACL could be used on a per VRF basis.
7050-1#conf t 7050-1(config)#vrf definition MGMT 7050-1(config)#rd 100:100
7050-1(config)#interface management1 7050-1(config)#vrf forwarding MGMT
7050-1(config)#no snmp-server vrf main 7050-1(config)#snmp-server vrf MGMT
7050-1(config)#control-plane 7050-1(config)#ip access-group default-control-plane-acl vrf MGMT in

QuickStart – 7050 Series Management Fundamentals
Arista Whitepaper – June 2013
13
TACACS+
If the TACACS+ server is located in the management VRF a VRF argument should be appended to the host configuration command.
Syslog
If the Syslog server is located in the management VRF a VRF argument should be appended to the logging configuration statement.
NTP
If the NTP server is located in the management VRF a VRF argument should be appended to the ntp server configuration command.
7050-1(config)#-server host 192.168.1.1 vrf MGMT
7050-1(config)#logging vrf MGMT host 192.168.1.1
7050-1(config)#ntp server vrf MGMT 192.168.1.1

QuickStart – 7050 Series Management Fundamentals
Arista Whitepaper – June 2013
14
Arista EOS API
The Arista EOS API (eAPI) provides an alternative interface to EOS for either configuration or show commands. It allows a third party user, script or application, programmatic access to the Arista CLI using JSON structured requests and responses served over HTTP/HTTPS. Any task achievable via a CLI command will be achievable using the eAPI, be it a configuration, show or platform command.
Minimal configuration is required to enable the eAPI.
Once enabled EOS will process HTTP delivered JSON requests sent with the below format:
The above example includes a show command for a single interface. EOS will send responses with the following format.
Once the management API interface is enabled on a particular switch, a command API frontend will be made available when establishing a HTTP/HTTPS connection to the IP address or hostname of the switch. The eAPI frontend includes both extensive documentation and a command explorer tool designed to aid in the development of user eAPI calls. Note: Access to the eAPI frontend requires a valid switch login, which is authenticated in the same way as an SSH login attempt.
{ "jsonrpc": "2.0", "method": "runCli“, "params": { "cmds": [ "show interface Ethernet3“, ], "format": "json" }, "id": 1 }
7050-1(config)#management api http-commands 7050-1(config)#no protocol <http|https> shutdown
{ "jsonrpc": "2.0”, "result": [ { "Ethernet3" : { 'bandwidth': 10000000, 'description': '', 'interfaceStatus': 'up', 'mtu': 9212, 'physicalAddr': '0000.4401.0001’ } } ], “id”: 1 }

QuickStart – 7050 Series Management Fundamentals
Arista Whitepaper – June 2013
15
Using tcpdump to Monitor Control Plane Traffic
The Linux tcpdump utility is included with EOS, allowing fast and efficient monitoring of control plane or CPU bound traffic. tcpdump provides ready access to L2/3 protocols and any other traffic destined for the switch itself without the need to SPAN interfaces.
From EOS version 4.10 onwards tcpdump is supported natively from the CLI, prior to this release tcpdump needed to be run from a bash shell.
Before running tcpdump it is important to identify the interface in relation to which type of traffic you want to capture:
Interface Type TCPDump will capture
L2 Standalone Interface L2 Generated packets; LLDP, STP etc.
L2 Port-channel Interface L2 Port-channel global packets, STP etc.
L2 Port-channel Member L2 Member interface specific packets; LACP, LLDP
L3 Interface (Routed port or SVI) L3 Generated traffic, ICMP, OSPF Hellos etc.
Note- Packets such as STP which are relevant to the whole port-channel would not be seen on a tcpdump of a member interface.
Running tcpdump natively in EOS (Version 4.10 and later)
The utility is executed using the native EOS command ‘tcpdump, alongside a mandatory interface argument, then optional arguments such as a capture filter or writing to a file.
Note – tcpdump will run with –e (capture Ethernet headers) by default.
For example, to run a capture on interface management1 for stp frames the following command could be used.
Note – The filter argument refers to a capture-filter, so display-filter arguments will not be accepted.
7050-1#tcpdump interface Ethernet2 filter stp tcpdump: WARNING: et2: no IPv4 address assigned tcpdump: verbose output suppressed, use -v or -vv for full protocol decode listening on et2, link-type EN10MB (Ethernet), capture size 65535 bytes 05:42:38.480733 00:1c:73:10:3f:b2 (oui Arista Networks) > 01:80:c2:00:00:00 (oui Unknown), 802.3, length 119: LLC, dsap STP (0x42) Individual, ssap STP (0x42) Command, ctrl 0x03: STP 802.1s,

QuickStart – 7050 Series Management Fundamentals
Arista Whitepaper – June 2013
16
Running tcpdump from Bash (All versions of EOS)
To tcpdump an interface, first find out the Linux name for the interface (note, L2, L3 and management interfaces are listed individually):
Next run the utility passing the required interface and optionally a standard filter along with any other advanced arguments:
7050-1#bash tcpdump -i et1 arp tcpdump: verbose output suppressed, use -v or -vv for full protocol decode listening on et1, link-type EN10MB (Ethernet), capture size 65535 bytes 15:25:03.516271 00:1b:21:29:d7:f2 (oui Unknown) > Broadcast, ethertype ARP (0x0806), length 60: Request who-has dc1-tac-rack4-serial1.aristanetworks.com tell lab.aristanetworks.com, length 46 15:25:04.516296 00:1b:21:29:d7:f2 (oui Unknown) > Broadcast, ethertype ARP (0x0806), length 60: Request who-has dc1-tac-rack4-serial1.aristanetworks.com tell lab.aristanetworks.com, length 46 15:25:05.516309 00:1b:21:29:d7:f2 (oui Unknown) > Broadcast, ethertype ARP (0x0806), length 60: Request who-has dc1-tac-rack4-serial1.aristanetworks.com tell lab.aristanetworks.com, length 46 15:25:05.551091 00:25:11:06:87:cb (oui Unknown) > Broadcast, ethertype ARP (0x0806), length 60: Request who-has dc1-tac-rack4-serial1.aristanetworks.com tell lab.aristanetworks.com, length 46 ^C 5 packets captured 5 packets received by filter 0 packets dropped by kernel 7050-1#
7050-1#bash ifconfig cpu Link encap:Ethernet HWaddr 00:1C:73:10:BC:BA UP BROADCAST RUNNING MULTICAST MTU:9216 Metric:1 RX packets:0 errors:0 dropped:0 overruns:0 frame:0 TX packets:0 errors:0 dropped:0 overruns:0 carrier:0 collisions:0 txqueuelen:500 RX bytes:0 (0.0 b) TX bytes:0 (0.0 b) et1 Link encap:Ethernet HWaddr 00:1C:73:10:BC:BA UP BROADCAST MULTICAST MTU:9212 Metric:1 RX packets:0 errors:0 dropped:0 overruns:0 frame:0 TX packets:0 errors:0 dropped:0 overruns:0 carrier:0 collisions:0 txqueuelen:500 RX bytes:0 (0.0 b) TX bytes:0 (0.0 b): ma1 Link encap:Ethernet HWaddr 00:1C:73:10:BC:B9 inet addr:172.22.30.75 Bcast:255.255.255.255 Mask:255.255.254.0 UP BROADCAST RUNNING MULTICAST MTU:1500 Metric:1 RX packets:2926 errors:0 dropped:0 overruns:0 frame:0 TX packets:1597 errors:0 dropped:0 overruns:0 carrier:0 collisions:0 txqueuelen:1000 RX bytes:276100 (269.6 KiB) TX bytes:446088 (435.6 KiB) Interrupt:21 vlan20 Link encap:Ethernet HWaddr 00:1C:73:10:BC:BA UP BROADCAST MULTICAST MTU:1500 Metric:1 RX packets:0 errors:0 dropped:0 overruns:0 frame:0 TX packets:0 errors:0 dropped:0 overruns:0 carrier:0 collisions:0 txqueuelen:0 RX bytes:0 (0.0 b) TX bytes:0 (0.0 b)

QuickStart – 7050 Series Management Fundamentals
Arista Whitepaper – June 2013
17
Tracing Processes with EOS
EOS provides operators with extensive troubleshooting tools; to help debug control plane and protocol layer interactions through built-in tracing that delivers live trace output to the CLI. To configure tracing, first review the available agent processes:
Having selected an agent to trace, review the available trace facilities for that process:
By default all logging generated by the tracing facilities will be sent to the log file of agent being traced (/var/log/agents/<AgentName><ProcessID>) for example /var/log/agents/Arp-1631. The system automatically rotates agent log files to protect against excessive consumption of memory.
If it is desired to keep the tracing outputs and agent logs separate, a temporary file can be named, all tracing outputs will be logged directly to this file (on a per agent basis in /tmp). This file will not automatically log rotate, making it useful for extended tracing that would otherwise fill the agent log.
7050-1#sh trace ? Aaa Aaa agent Acl Acl agent Adt7462Agent Adt7462Agent agent Arp Arp agent Cdp Cdp agent Dcbx Dcbx agent DhcpRelay DhcpRelay agent Ebra Ebra agent ElectionMgr ElectionMgr agent FPLanz FPLanz agent FanDetector FanDetector agent FileReplicator FileReplicator agent FocalPoint FocalPoint agent FrameBufferAgent FrameBufferAgent agent :
7050-1#sh trace Arp | b Trace facility Trace facility settings for agent Arp is ----------------------------------------------- Activity enabled ............ Agent enabled ............ AgentBase enabled ............ AgentEnv enabled ............ ArpRefresher enabled ............ ArpRefresherInputSm enabled ............ ArpResolver enabled ............ CEntityManager enabled ............ Clock enabled ............ Dir enabled ............ Entity enabled ............ :
7050-1(config)#trace Arp filename arp.trace
QuickStart – 7050 Series Management Fundamentals
Arista Whitepaper – June 2013
18
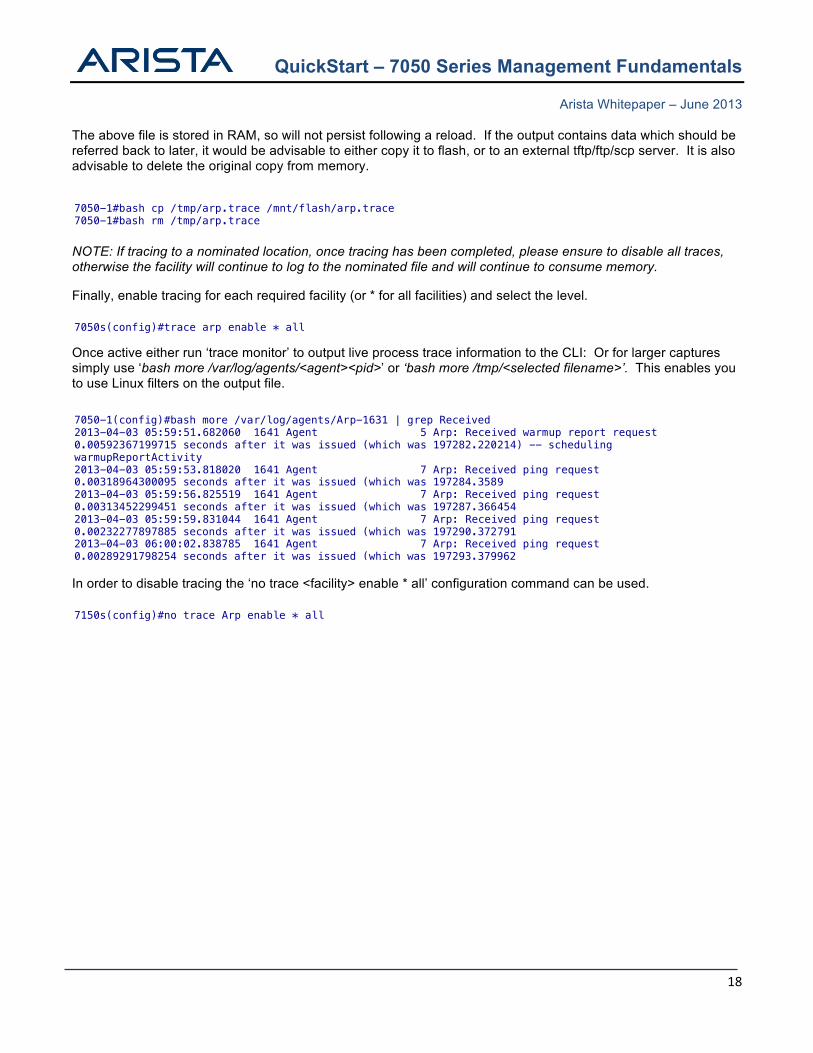
The above file is stored in RAM, so will not persist following a reload. If the output contains data which should be referred back to later, it would be advisable to either copy it to flash, or to an external tftp/ftp/scp server. It is also advisable to delete the original copy from memory.
NOTE: If tracing to a nominated location, once tracing has been completed, please ensure to disable all traces, otherwise the facility will continue to log to the nominated file and will continue to consume memory.
Finally, enable tracing for each required facility (or * for all facilities) and select the level.
Once active either run ‘trace monitor’ to output live process trace information to the CLI: Or for larger captures simply use ‘bash more /var/log/agents/<agent><pid>’ or ‘bash more /tmp/<selected filename>’. This enables you to use Linux filters on the output file.
In order to disable tracing the ‘no trace <facility> enable * all’ configuration command can be used.
7050s(config)#trace arp enable * all
7050-1(config)#bash more /var/log/agents/Arp-1631 | grep Received 2013-04-03 05:59:51.682060 1641 Agent 5 Arp: Received warmup report request 0.00592367199715 seconds after it was issued (which was 197282.220214) -- scheduling warmupReportActivity 2013-04-03 05:59:53.818020 1641 Agent 7 Arp: Received ping request 0.00318964300095 seconds after it was issued (which was 197284.3589 2013-04-03 05:59:56.825519 1641 Agent 7 Arp: Received ping request 0.00313452299451 seconds after it was issued (which was 197287.366454 2013-04-03 05:59:59.831044 1641 Agent 7 Arp: Received ping request 0.00232277897885 seconds after it was issued (which was 197290.372791 2013-04-03 06:00:02.838785 1641 Agent 7 Arp: Received ping request 0.00289291798254 seconds after it was issued (which was 197293.379962
7050-1#bash cp /tmp/arp.trace /mnt/flash/arp.trace 7050-1#bash rm /tmp/arp.trace
7150s(config)#no trace Arp enable * all
QuickStart – 7050 Series Management Fundamentals
Arista Whitepaper – June 2013
19
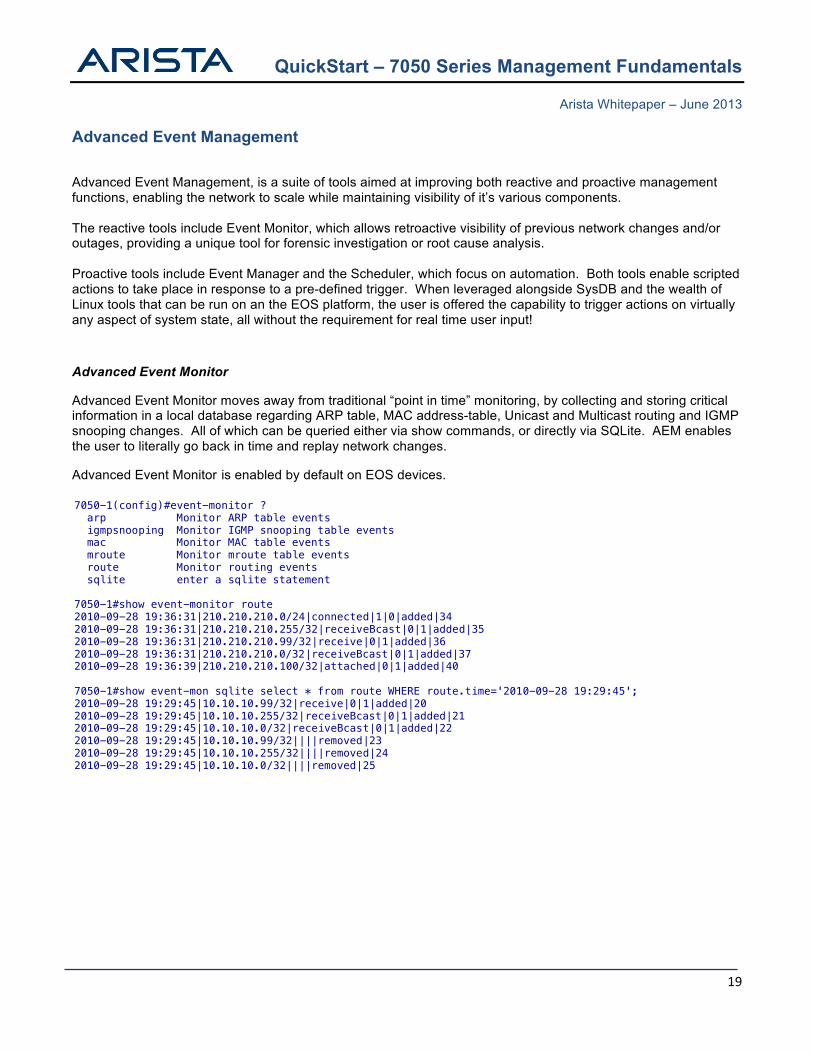
Advanced Event Management
Advanced Event Management, is a suite of tools aimed at improving both reactive and proactive management functions, enabling the network to scale while maintaining visibility of it’s various components. The reactive tools include Event Monitor, which allows retroactive visibility of previous network changes and/or outages, providing a unique tool for forensic investigation or root cause analysis. Proactive tools include Event Manager and the Scheduler, which focus on automation. Both tools enable scripted actions to take place in response to a pre-defined trigger. When leveraged alongside SysDB and the wealth of Linux tools that can be run on an the EOS platform, the user is offered the capability to trigger actions on virtually any aspect of system state, all without the requirement for real time user input! Advanced Event Monitor
Advanced Event Monitor moves away from traditional “point in time” monitoring, by collecting and storing critical information in a local database regarding ARP table, MAC address-table, Unicast and Multicast routing and IGMP snooping changes. All of which can be queried either via show commands, or directly via SQLite. AEM enables the user to literally go back in time and replay network changes.
Advanced Event Monitor is enabled by default on EOS devices.
7050-1(config)#event-monitor ? arp Monitor ARP table events igmpsnooping Monitor IGMP snooping table events mac Monitor MAC table events mroute Monitor mroute table events route Monitor routing events sqlite enter a sqlite statement 7050-1#show event-monitor route 2010-09-28 19:36:31|210.210.210.0/24|connected|1|0|added|34 2010-09-28 19:36:31|210.210.210.255/32|receiveBcast|0|1|added|35 2010-09-28 19:36:31|210.210.210.99/32|receive|0|1|added|36 2010-09-28 19:36:31|210.210.210.0/32|receiveBcast|0|1|added|37 2010-09-28 19:36:39|210.210.210.100/32|attached|0|1|added|40 7050-1#show event-mon sqlite select * from route WHERE route.time='2010-09-28 19:29:45'; 2010-09-28 19:29:45|10.10.10.99/32|receive|0|1|added|20 2010-09-28 19:29:45|10.10.10.255/32|receiveBcast|0|1|added|21 2010-09-28 19:29:45|10.10.10.0/32|receiveBcast|0|1|added|22 2010-09-28 19:29:45|10.10.10.99/32||||removed|23 2010-09-28 19:29:45|10.10.10.255/32||||removed|24 2010-09-28 19:29:45|10.10.10.0/32||||removed|25

QuickStart – 7050 Series Management Fundamentals
Arista Whitepaper – June 2013
20
Advanced Event Manager Advanced Event Manager provides a platform to enable automation of actions in response to pre-defined event triggers. It allows the creation of an event, the definition of under which circumstances the event should trigger and what action should occur in such a situation As of 4.12.0 Advanced Event Manager contains four types of trigger:
1) on-boot triggers an action upon device bootup. Typically this can be used to daemonize python scripts or load user configured scripts. on-boot represents the most powerful trigger mechanism, as the script you call can be run as a daemon then mount any section of SysDB, allowing you to trigger based on essentially any value or attribute.
2) on-intf, as seen in the above example. OnIntf consists of 3 pre-defined sub-triggers, Operational state, IP information or interface name. It provides an easy access trigger for events induced by some sort of change to an interface.
3) on-startup-config will trigger an action whenever any changes are made to the startup-config file. This could be used for situations such as generating an alert, or backing up the configuration whenever a change is made.
4) vm-tracer leverages VM visibility offered through the VM Tracer feature. This trigger activates when a VM is added, removed, or moved. An example for this trigger would be having routing-policy automatically applied to your infrastructure based on the location of various virtual machines.
Once an event has been triggered the configured action will be executed, this action will be initiated natively from the Linux bash shell, which means the action is not limited by the EOS CLI syntax, but rather any function or action which can be achieved using a bash shell. Typical examples of actions would be to execute a native bash command, run a user provided shell script or execute EOS CLI commands using the FastCli program:
• Call a bash script – action bash /mnt/flash/EmailOnLinkDown • Call a python script to run as a daemon – action bash daemonize /mnt/flash/IntfMonitor • Execute a single CLI command, which sends an IM to all Network admins – action bash FastCli -p15 -c
'xmpp send NetworkAdmins command Interface Ethernet1 is down' • Execute a series of CLI commands, which bring down a particular interface – action bash FastCli -p15 -c
$'conf\n interface ethernet2\n shut' Due to the ability to trigger on anything, and carry out any action, the use cases for event-manager are diverse, providing a powerful option for automating a huge range of proactive tasks or reactive actions. One example use case would be dynamically changes the PIM DR and VRRP priority of a switch based on the presence of a nominated uplink interface. Event – PIM DR & VRRP Active Failover Trigger – If the uplinks go down, Action – Call a bash script stored in flash that reduces the PIM and VRRP priority so the impacted device is no longer the DR/Active Forwarder.

QuickStart – 7050 Series Management Fundamentals
Arista Whitepaper – June 2013
21
The contents of the drchange.sh script are included below.
A more in-depth look at event-handler can be found in the following EOS article - https://eos.aristanetworks.com/2012/01/email-alerts/
7050-1(config)#event-handler pim-vrrp-switch 7050-1(config-handler-pim-dr-switch)#? action Define event-handler action delay Configure event-handler delay trigger Configure event trigger condition 7050-1(config-handler-pim-dr-switch)#trigger onintf Et1 operstatus 7050-1(config-handler-pim-dr-switch)#action bash drchange.sh 7050-1#dir Directory of flash:/ -rwx 1170 Oct 9 22:15 drchange.sh
#!/bin/bash #create an alias for the current event time NOW=$(date) #set an action for the operstate trigger if [ $OPERSTATE = "linkdown" ] ; then Cli -p 15 -c' conf t int vlan 10 ip pim dr 1 vrrp 1 pri 1 #create a syslog message for the failover event send log level notifications message DR/VRRP failover initiated by Event-handler
pim-dr-switch wr mem ' elif [ $OPERSTATE = "linkup" ] ; then Cli -p 15 -c' conf t int vlan 10 ip pim dr 1000000 vrrp 1 pri 254 #create a syslog message for the failback event send log level notifications message DR/VRRP failback initiated by Event-handler
pim-dr-switch wr mem ' fi

QuickStart – 7050 Series Management Fundamentals
Arista Whitepaper – June 2013
22
Scheduler While the Advanced Event Manager enables actions based on complex triggers, the scheduler triggers actions at regular time intervals. Scheduleder also captures the standard output of an action to compressed, timestamped file in flash, enablng the user to configure how many of these files they wish to keep at any one time and automatically deleting older copies. To create a scheduled job, a user simply defines how often a task should run, how many log file to store and what the job should be. Optionally the user can also define a time and/or date when the scheduled task should run for the first time, enabling post dated or synchronous execution of tasks over multiple devices.
Unlike Event-Manager, this command is executed natively in EOS, however by prepending the ‘bash’ argument it is possible to execute bash commands and call scripts, for example ‘command bash /mnt/flash/ConfigBackup’. By default EOS has a scheduled task configured to collect a show tech every 60 minutes and store up to 100 instances of the show tech, ensuring that platform data is available both prior and following a network issue is available to assist with analysis.
7050-1#show run all | grep schedule schedule tech-support interval 60 max-log-files 100 command show tech-support
schedule <name> [at <hh:mm:ss> <mm:dd:yyyy>] interval <minutes> max-log-files <files> command <command to execute>
QuickStart – 7050 Series Management Fundamentals
Arista Whitepaper – June 2013
23
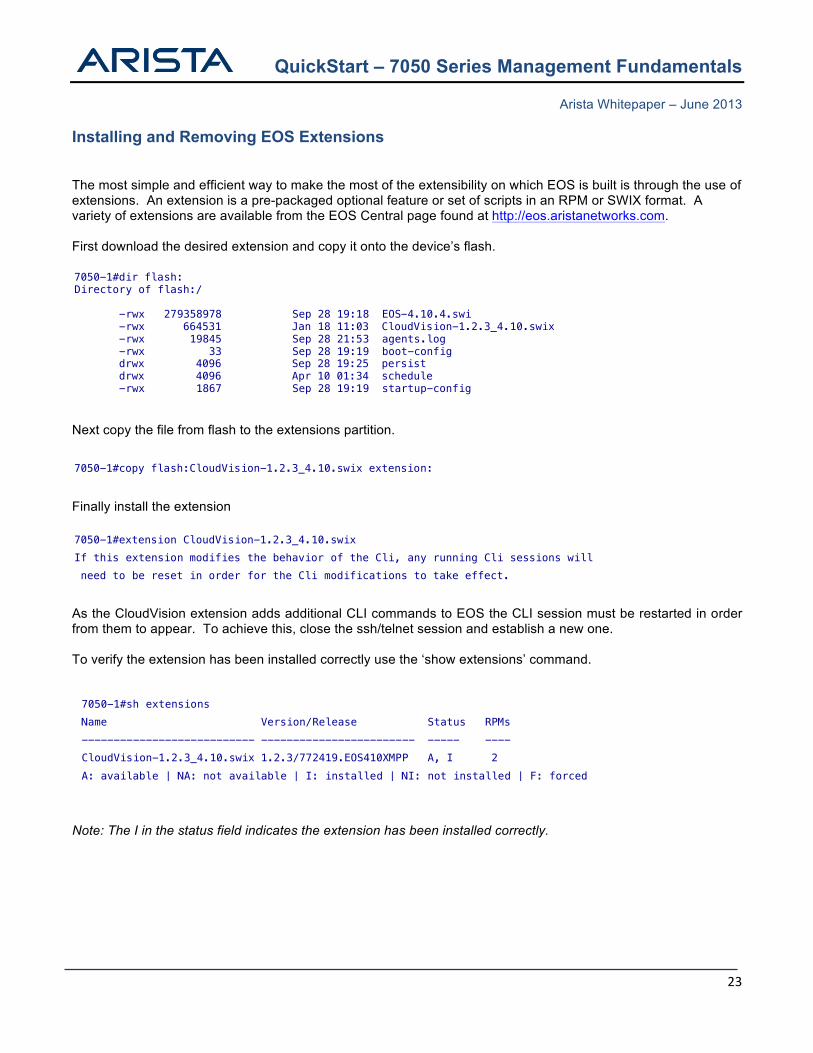
Installing and Removing EOS Extensions
The most simple and efficient way to make the most of the extensibility on which EOS is built is through the use of extensions. An extension is a pre-packaged optional feature or set of scripts in an RPM or SWIX format. A variety of extensions are available from the EOS Central page found at http://eos.aristanetworks.com. First download the desired extension and copy it onto the device’s flash.
Next copy the file from flash to the extensions partition.
Finally install the extension
As the CloudVision extension adds additional CLI commands to EOS the CLI session must be restarted in order from them to appear. To achieve this, close the ssh/telnet session and establish a new one. To verify the extension has been installed correctly use the ‘show extensions’ command.
Note: The I in the status field indicates the extension has been installed correctly.
7050-1#dir flash: Directory of flash:/ -rwx 279358978 Sep 28 19:18 EOS-4.10.4.swi -rwx 664531 Jan 18 11:03 CloudVision-1.2.3_4.10.swix -rwx 19845 Sep 28 21:53 agents.log -rwx 33 Sep 28 19:19 boot-config drwx 4096 Sep 28 19:25 persist drwx 4096 Apr 10 01:34 schedule -rwx 1867 Sep 28 19:19 startup-config
7050-1#copy flash:CloudVision-1.2.3_4.10.swix extension:
7050-1#extension CloudVision-1.2.3_4.10.swix If this extension modifies the behavior of the Cli, any running Cli sessions will need to be reset in order for the Cli modifications to take effect.
7050-1#sh extensions Name Version/Release Status RPMs --------------------------- ------------------------ ----- ---- CloudVision-1.2.3_4.10.swix 1.2.3/772419.EOS410XMPP A, I 2 A: available | NA: not available | I: installed | NI: not installed | F: forced

QuickStart – 7050 Series Management Fundamentals
Arista Whitepaper – June 2013
24
By default the extension will not persist between reloads. If extension persistence is required the extension must also be copied into the boot-extensions file.
In order to determine which extensions are currently enabled for boot persistence the ‘show boot extensions’ command can be used.
In order to uninstall an extension use the ‘no’ form of the extension command, then push the installed-extensions to the boot-extensions list.
7050-1#copy installed-extensions boot-extensions
7050-1#sh boot-extensions CloudVision-1.2.3_4.10.swix
7050-1#no extension CloudVision-1.2.3_4.10.swix 7050-1#copy installed-extensions boot-extensions 7050-1#show extensions Name Version/Release Status RPMs --------------------------- ------------------------ ----- ---- A: available | NA: not available | I: installed | NI: not installed | F: forced

QuickStart – 7050 Series Management Fundamentals
Arista Whitepaper – June 2013
25
sFlow sFlow is an embedded sampling technology designed to facilitate high rate traffic and statistics export from network devices with no impact to forwarding performance. sFlow samples may be sent to a collector application supporting a specific requirement (visualization, modeling, troubleshooting, capacity planning, IDS) or may also be converted to pcap data or NetFlow for consumption in other applications.
7050-1(config)#sflow ? destination Set the collector IP address polling-interval Set polling interval (secs) for sFlow run Run sFlow globally sample Set sample rate for sFlow source Set the source IP address source-interface Configure the source interface for sFlow datagrams 7050-1(config)#sflow destination 192.168.1.65 7050-1(config)#sflow run 7050-1(config)#sh sflow int 7050-1(config-if-Et1-24)# 7050-1(config-if-Et1-24)#sh sflow int sFlow Interface (s): -------------------- Ethernet1 Ethernet2

QuickStart – 7050 Series Management Fundamentals
Arista Whitepaper – June 2013
26
Port Mirroring Port Mirroring is used on a Arista switch to send a copy of packets transmitted or received on one or more ports out of a configured destination switchport. This is commonly used for network appliances that require monitoring of network traffic like an intrusion-detection system.
Information in this document is provided in connection with Arista Networks products. For more information, visit us at http://www.aristanetworks.com, or contact us at [email protected]
7050-1(config)#monitor session MON1 destination e1 7050-1(config)#monitor session MON1 source e4,6-7,10,12-$ 7050-1(config)#sh monitor session Session MON1 ------------------------ Source Ports Both: Et6, Et7, Et10, Et12, Et13, Et14 Et15, Et16, Et17, Et18, Et19, Et20 Et21, Et22, Et23, Et24 Destination Port: Et1