questions on the tema model - dashboard - unece wiki
TRANSCRIPT

Questions on the TEMA model
Input from ACEA, JAMA and AI member companies compiled by Annika Ahlberg Tidblad 2020-12-05.
Documents reviewed: EVE-22-07
EVE-23-08
EVE-24-10
EVE-28-13
EVE-30-12
EVE-32-13
EVE-33-07
EVE-34-16
EVE 36-09
EVE-38-02
General questions and comments:
1. The transitions between data analysis and simulations is unclear in the presented material,
especially regarding Big Data. Is the Big Data only used for data analysis and to calibrate the
model, develop customer profiles or is it used also as input into the model?
1 Big Data (recorded driving profiles) are used as input to the JRC TEMA platform. Please note
that JRC TEMA is a modular big data platform developed to assess the potential of using big
data in support to transport policy assessments. In-vehicle battery durability is just one of the
modules, developed to support the discussion within EVE IWG and overcoming the sensitivity
of battery data sharing. The model is not meant to be a commercial software or an industrial
software, being more a policy support tool.
2. What is the age span and distribution of the vehicles in Big Data? Differences in the Big Data
sets with respect to BEV and PHEV, i.e. age distribution, population size, types/categories of
vehicles, etc?
3. What are the sources of the Big Data? Car pools, professional drivers, household vehicles,..?
Relative distribution of sources?
2 and 3. The data refers to ICE vehicle activity navigation system data collected in different
European areas by traffic monitoring companies and insurance company. We do not have
information about vehicle segment or age, for being compliant with the data protection rules.
Moreover, the data is protected by proprietary agreements.
4. Benchmarking against other lifetime prediction models is essential. How do you propose this
can be done?
4 Up to now we have tried to retrieve open source vehicle ageing data from literature and
websites and also run a comparison with experimental data from an extensive testing
campaign carried out by Transport Canada and Environment and Climate Change Canada.
Having additional real-world ageing data, aggregated vehicle ageing data or ageing trends in
years or in driven distances for given vehicle segments could contribute further to the
benchmark. TEMA in-vehicle battery durability module is not a commercial or industrial
software and it has been exercised to support the discussion and overcome the limitation in
sharing confidential data. Suggestions on eventual corrective factors might help to improve
the predictions.
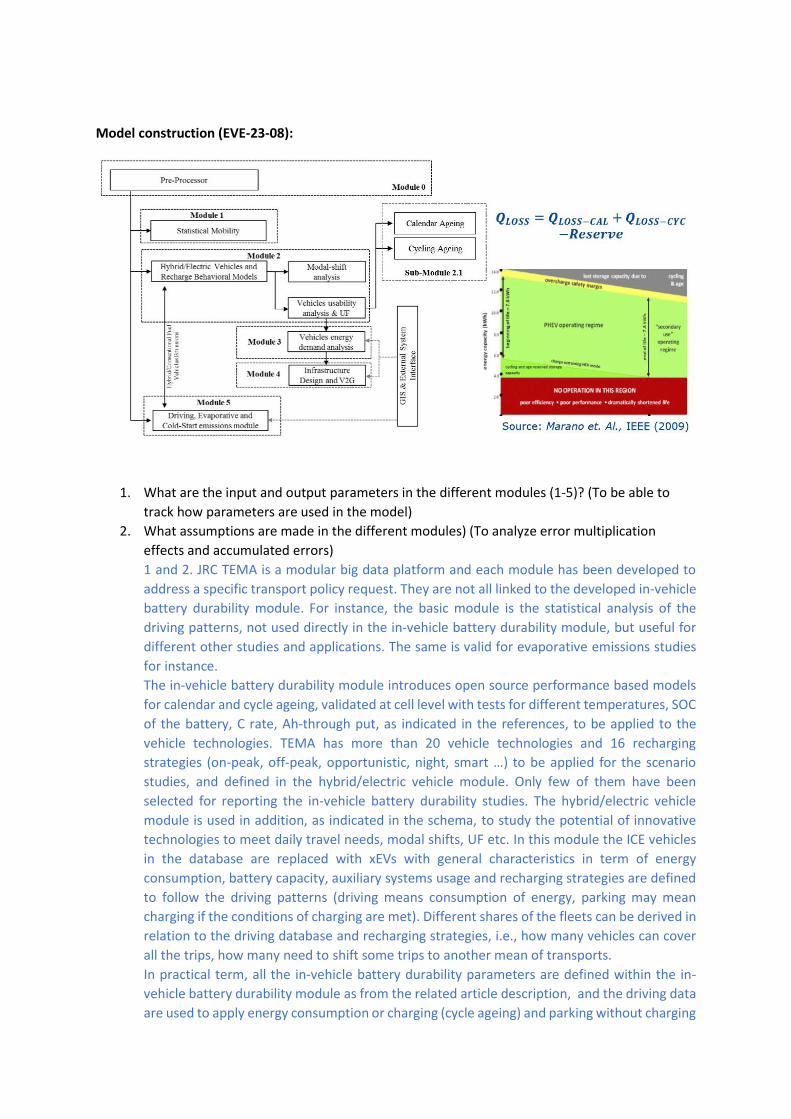
Model construction (EVE-23-08):
1. What are the input and output parameters in the different modules (1-5)? (To be able to
track how parameters are used in the model)
2. What assumptions are made in the different modules) (To analyze error multiplication
effects and accumulated errors)
1 and 2. JRC TEMA is a modular big data platform and each module has been developed to
address a specific transport policy request. They are not all linked to the developed in-vehicle
battery durability module. For instance, the basic module is the statistical analysis of the
driving patterns, not used directly in the in-vehicle battery durability module, but useful for
different other studies and applications. The same is valid for evaporative emissions studies
for instance.
The in-vehicle battery durability module introduces open source performance based models
for calendar and cycle ageing, validated at cell level with tests for different temperatures, SOC
of the battery, C rate, Ah-through put, as indicated in the references, to be applied to the
vehicle technologies. TEMA has more than 20 vehicle technologies and 16 recharging
strategies (on-peak, off-peak, opportunistic, night, smart …) to be applied for the scenario
studies, and defined in the hybrid/electric vehicle module. Only few of them have been
selected for reporting the in-vehicle battery durability studies. The hybrid/electric vehicle
module is used in addition, as indicated in the schema, to study the potential of innovative
technologies to meet daily travel needs, modal shifts, UF etc. In this module the ICE vehicles
in the database are replaced with xEVs with general characteristics in term of energy
consumption, battery capacity, auxiliary systems usage and recharging strategies are defined
to follow the driving patterns (driving means consumption of energy, parking may mean
charging if the conditions of charging are met). Different shares of the fleets can be derived in
relation to the driving database and recharging strategies, i.e., how many vehicles can cover
all the trips, how many need to shift some trips to another mean of transports.
In practical term, all the in-vehicle battery durability parameters are defined within the in-
vehicle battery durability module as from the related article description, and the driving data
are used to apply energy consumption or charging (cycle ageing) and parking without charging
(calendar ageing). There is the link to the hybrid/electric vehicle module where the vehicles
are defined and to the usability scenarios.
The other modules are not related to in-vehicle battery durability and they have been
reported for illustrating the complete TEMA platform structure. Costumer driven recharge
infrastructure and V2G was developed in support to the directive on alternative fuels
infrastructure, evaporative emission to support the revision of the evaporative emission
studies and so on.
3. Life prediction estimates (year and milage) are outputs from Module 2. How does Module 4
feed back to module 2 for life estimations including e.g. V2G ageing?
3 We have to update the flow chart adding a link from V2G to in-vehicle battery durability
module, missing here above. V2G is a study we did years ago to study the grid optimisation
and peak shaving and recently we went back to it while thinking that V2G should be
considered in the in-vehicle battery ageing in view of a wide spread of future applications. It
explores the possibility to have vehicles parked but not charging giving back to the grid part
of the energy store in their battery. The first V2G ageing analysis was presented in Geneva, in
one of the last face-to-face meeting. As presented different scenario where analysed with
different share of energy, from little amount, 2% up to higher shares, always however
checking that the vehicle that shares the energy to the grid can still perform the trip after the
parking event. In this way the chain of driving and parking events is not broken. V2G is
considered as an additional cycling of the battery with given power and the in-vehicle battery
durability module has been modified to consider this extra cycling of the battery if it can be
applied without breaking the driving-parking chain.
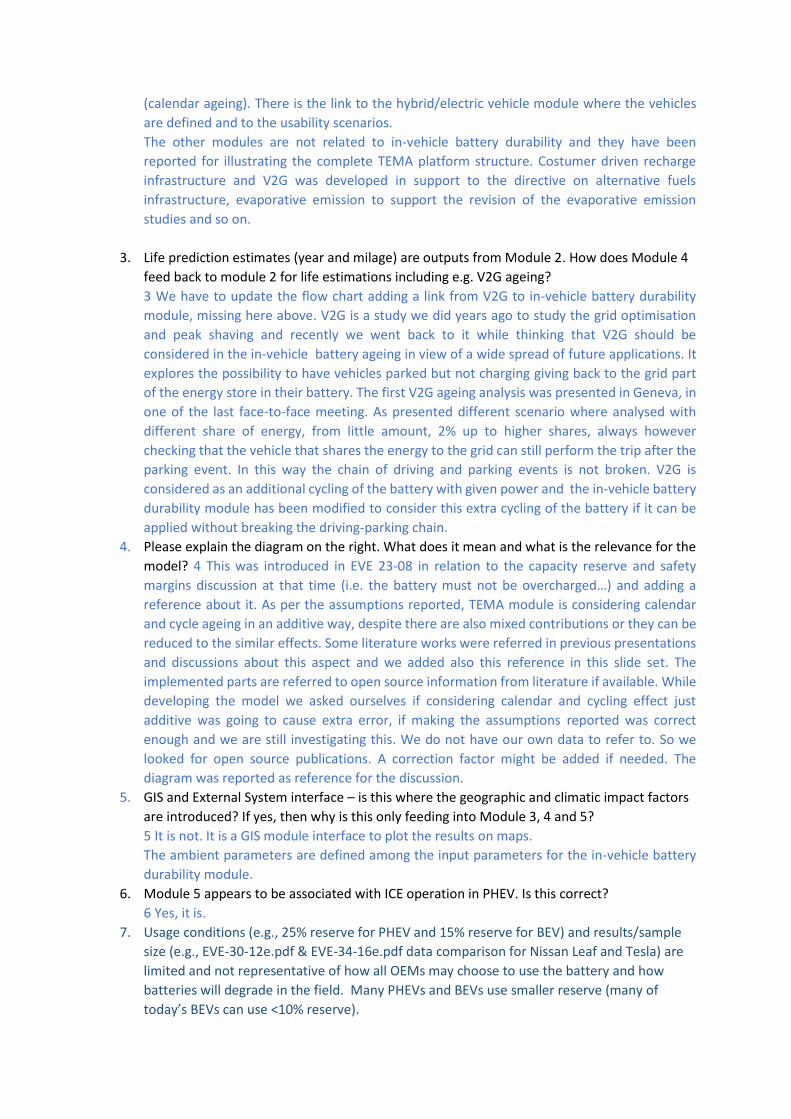
4. Please explain the diagram on the right. What does it mean and what is the relevance for the
model? 4 This was introduced in EVE 23-08 in relation to the capacity reserve and safety
margins discussion at that time (i.e. the battery must not be overcharged…) and adding a
reference about it. As per the assumptions reported, TEMA module is considering calendar
and cycle ageing in an additive way, despite there are also mixed contributions or they can be
reduced to the similar effects. Some literature works were referred in previous presentations
and discussions about this aspect and we added also this reference in this slide set. The
implemented parts are referred to open source information from literature if available. While
developing the model we asked ourselves if considering calendar and cycling effect just
additive was going to cause extra error, if making the assumptions reported was correct
enough and we are still investigating this. We do not have our own data to refer to. So we
looked for open source publications. A correction factor might be added if needed. The
diagram was reported as reference for the discussion.
5. GIS and External System interface – is this where the geographic and climatic impact factors
are introduced? If yes, then why is this only feeding into Module 3, 4 and 5?
5 It is not. It is a GIS module interface to plot the results on maps.
The ambient parameters are defined among the input parameters for the in-vehicle battery
durability module.
6. Module 5 appears to be associated with ICE operation in PHEV. Is this correct?
6 Yes, it is.
7. Usage conditions (e.g., 25% reserve for PHEV and 15% reserve for BEV) and results/sample
size (e.g., EVE-30-12e.pdf & EVE-34-16e.pdf data comparison for Nissan Leaf and Tesla) are
limited and not representative of how all OEMs may choose to use the battery and how
batteries will degrade in the field. Many PHEVs and BEVs use smaller reserve (many of
today’s BEVs can use <10% reserve).

a. How are the energy reserves positioned relative to battery SOC? Positioning of this
reserve band will have a significant impact on the degradation characteristics of the
battery. This effect is highly nonlinear and specific to a given battery
design. Neither Sarasketa-Zabala et Al. nor Cordoba-Arenas et Al. conducted testing
with fine enough granularity to determine the aging characteristics accurately with
respect to SOC. For example, Sarasketa-Zabala et Al. used only 3 SOC points, while
Cordoba-Arenas et Al. did not consider the effect of different upper SOC values.
b. It is unclear how the model takes the “reserve” capacity into account? Is it assumed
that the “reserve” is an isolated part of the battery, which is not used? This is
unrealistic, and it is much more likely that the “reserve” is used and ages together
with the rest of the battery. Needs to be elaborated.
i. How were the “reserve” values (25% for PHEV and 15% for BEV)
determined?
ii. How does is the “reserve” treated in the capacity retention (UBE) algorithm?
iii. What is the sensitivity for “reserve”?
iv. Is it the intension of TEMA, and the GTR, to force battery designs with huge
“reserves”? not technical question
v. How does the model consider trade-off between capacity retention and
battery life prediction against negative environmental impacts from
oversized batteries (added weight, added energy consumption, added
material and energy resources in production,..) and reduces total energy
throughput (per Ah of battery) during the lifetime of the battery?
7 a, b I,ii, iii. (iv and v are not technical questions).
The data shown from real-world vehicle applications is what could be retrieved so far
open source from literature and websites. It is also for us very important to check in-
vehicle battery durability predictions against real-world data especially at the beginning
of the development and that is why JRC on its own initiative looks constantly for source
of data open source, also to overcome the proprietary information sharing problem.
We will keep looking for additional information that might be helpful to the discussion.
TEMA module despite all the assumptions is able to reproduce the trend of data for
different vehicle data. It is not meant to reproduce perfectly the data but the real-field
application trends, considering different driving behaviour, recharge strategy,
frequency and power, environmental data etc. This was the scope of the data
comparison, especially when additional information on the data collections and usage
of the vehicles is not available in the source of field data and assumptions have to be
made on charging behaviour for instance or kilometres driven per month.
The cell chemistry models we used are open source performance based models we
retrieved from literature. The testing parameters are those reported in these
publication. We do not have our source of cell testing data. Other open sources data
have been found recently and are under studied to verify if all the needed parameters
are available to be implemented. If you have references to new chemistries and models
that you think is worth fit to explore we could verify if it is possible to implement them.
TEMA module considers two capacity reserves, one it is related to the smaller cycling
window not allowing to deplete completely or overcharge the battery, the other is a
percentage of energy that will be used while the battery is ageing. The values of the

second capacity reserve are values discussed in previous EVE IWG meeting, but they
are parameters that can be changed. That’s why different values have been shown in
meeting EVE IWG 42. It is treated as a subtracted value from the available energy. Not
additional analyses have been done on the capacity reserve aside exploring the effect
on the final capacity drop of different assumed values as shown in the EVE IWG
meetings. Refining the connection of the reserve itself to the ageing, or its position
relative to the battery SOC could be one of the following steps to be addressed.
Assumptions:
EVE-24-10
1. The strong dependency on architecture is surprising and is most likely an indirect
consequence of parameters hidden in the assumption, mainly related to the temperature
profile inside the battery pack.
a. What assumptions are made about the vehicle electric architectures?
1 a. The vehicle technologies analysed for in-vehicle battery durability assessments are
those reported in the slides presented in EVE IWG meetings. The parameters used in the
assessments are the battery nominal capacity, the certification and tested energy
consumption of vehicles including auxiliary usage if needed, nominal voltage etc. In
addition as reported in slide 11 in EVE-24-10 we applied those further scaling of the
parameters, being aware that these are approximations. But as mentioned before we do
not have our own source of cell data. As additional information, despite there is the
possibility, in the in-vehicle battery durability assessments the energy consumption is kept
constant not varying while driving. This is also to limit the computation burden.
b. What cooling strategies are included and considered? How are there accounted for
in the model?
c. Thermal management and cooling strategies is an area where significant technical
advances have been and are continued to be made compared to when TEMA was
developed. How can the model take this into consideration in order to reduce errors
introduced by this assumption?
1 b c. We have a very simplified control on the temperature in relation to some
literature information and we are investigating about this aspect and effective ways
to improve it. It is well known the increase of temperature during charging of the
battery or driving event though in less extend and the large thermal inertia of the
battery. We implement an active control of the temperature during the cycling of the
battery but not while parking at rest.
Connections (parallel/series)? Why focus on type of connections? The load vs
capacity rating is main factor, whether the load is managed by a single cell (with high
capacity) or several cells in parallel (each with a lower capacity) is not relevant.
Reasoning is unclear.
The analyses are based on performance based models validated at cell level for
different temperatures, SOC of the battery, C rate, Ah-throughput. The vehicle
technology is superimposed to scale up to vehicle level together with the assumptions
mentioned above in slide 11 and being able to link the analysis to the activity data.

2. “The model assumes average quantities in the reference period per each vehicle for DOD, C-
rate, Ah-throughput and temperature”
a. How are the averages of the different parameters derived?
b. What temperature is inferred here, battery or ambient temperature?
c. What is the impact of substituting static values for dynamic parameters on the
model results??
2 a b c They are all weighted parameters not simple average. This simplification was
introduced to allow to input simpler data, overcoming the sensitivity of the
proprietary data sharing. The weighting is decided case by case depending on the data
available. We change the ambient temperatures in relation to the geographic areas,
month and year when the driving data were collected. These temperatures are input
parameters. A weighting on the exposure while driving was also introduced in some
cases. The main target is to obtain estimates in line with real applications data
maintaining the computational burden limited considering the large driving database
applied during the analysis.
3. The model assumes the BMS regulates the battery temperature between 22-27 °C in the
cycling capacity fade model. This is a very rough assumption that is unlikely to apply in most
vehicles. OEMs must balance vehicle operating efficiency with battery life in the choice of
thermal management temperature, and most batteries are robust enough to allow
operation to at least 35 – 40 deg C or higher. Battery resistance rise with cycling usage and
calendar time should be included in the degradation estimates. This will cause the battery
to generate more heat as it degrades and therefore it will operate at higher temperature,
with the possibility of accelerating the observed degradation.The internal battery
temperature is one of the most important parameters used to calibrate ageing in life
prediction models and this assumption disables or ignores the predictive strategies widely
employed in the industry. Furthermore, operating temperature is a function of cell
chemistry. Due to the high importance of the battery temperature on ageing, this
assumption needs to be assessed for sensitivity.
a. How were the temperature limits determined?
b. What justifies this assumption?
c. How does the model take account expected changes is operating temperature as a
result of internal resistance increase later in the battery life?
TEMA module has a very simplified control on the temperature in relation to some literature
information. However we are also in contact with other colleagues to study an effective way
to improve this part of the model. It is known the increase of temperature during charging of
the battery or driving and the large thermal inertia of the battery. Internal resistance increase
can be correlated to the power fade models too so interesting to be implemented better. We
have few models of this in TEMA module still to be extensively explored and integrated with
capacity fade. Some of the internal resistance increase models have been developed based
on the same cell testing used for the capacity fade models, so interesting to correlate.
Exploring the possibility to add target corrective factors in relation to these effects may be of
interest too.
4. The model assumes that the battery has ambient temperature when parked (calendar
capacity fade model). This is a very rough assumption and the error introduced depends on
how frequently the vehicle is used, if the battery is being charged while it is parked, etc. This
is a very important parameter and it is standard for automotive battery ageing models to
use actual internal battery temperatures. It is common for battery packs to take hours (>12h
for huge BEV packs) to acclimatize with the ambient, and this has a huge impact on
temperature conditions inside the battery during calendar ageing. Due to the high
importance of the battery temperature on ageing, this assumption needs to be assessed for
sensitivity.
a. How does the model take the thermal inertia of the battery pack into consideration?
4 a. As mentioned in the points above, it is known the increase of temperature during charging
of the battery or driving and the large thermal inertia of the battery. We also have data from
out tests. But we do not have exact information of the battery temperatures for all the
analysed cases. Only for few tests of ours. So also in this case the assumption is a simplification
but allows to overcome limited data and sensitive information. We can explore how to
improve this part also with key corrective parameters to study the effects on the results.
Please note that the calendar ageing is applied only to the portion of the parking time when
there is no charging.
5. It is unclear what internal battery temperature is assumed during charging, the assumed
BMS regulated range 22-27 °C or ambient temperature. Since the charging is associated with
electrochemical activity and heat generation, the latter would not make sense. Since heat
generated during charging strongly depends on the type of charge, assuming a constant
temperature range for all charging protocols introduces significant error to the estimate.
Due to the high importance of the battery temperature on ageing, this assumption needs to
be assessed for sensitivity.
a. How is battery internal temperature during charging treated in the model?
b. How does the model account for different charging protocols with regards to heat
generation and battery temperature?
5 Same as the point before. We followed a simple approach based on some references as reported
in the slides suggesting temperature values rather than referring to sensitive information. Also in
this case we are exploring the possibilities to improve this part, also applying parameters if more
effective, for instance increasing the cycling temperature for fast charging in respect to slow
charging. There is a different power and Ah-throughput, customised different temperatures may
be added as well. Generic but relevant parameters would be preferred than rather referring to
specific test values, always to overcome proprietary information.
6. The model assumes and average ambient temperature based on only two values, the
maximum and the minimum temperature of the month. This is a very rough assumption and
the error induced depends strongly on the climatic zone the vehicle is used in. This is a very
important parameter in battery life prediction models and is typically modelled with much
higher granularity. How is the average derived? Is it a simple arithmetic average or does it
take into account daytime/nighttime hours and other meteorological variations? Due to the
high importance of the battery temperature on ageing, this assumption needs to be
assessed for sensitivity.
6 A simplification and weighted parametrized case has been developed to allow non sensitive
data inputs in respect to the approach with an historical evolution of the data inputs. The
parameters are normally weighted and also customised case by case if needed. A more refined
time steps approach was for instance applied to compare the TEMA module estimates with
Transport Canada data, where we have more information on vehicles use, charging and

exposure to temperature. For another Eco-innovation study of some colleagues of ours for
instance the temperatures in all European countries were weighted on driving and vehicle
statistics (not used in the in-vehicle battery durability).
Five different charging strategies are assumed.
a. Please describe the distribution between the charging strategies used in the model
for estimating battery durability?
b. Battery usage in BEV and PHEV are different by design. How does the model
differentiate between expected charging strategies for BEV and PHEV considering
the development of the future charging infrastructure?
A b. A distribution of recharging strategies has not been applied. We can do it if needed. So
far we have kept the scenarios separated to be able to assess better the contribution of all
the involved parameters. All the worst case scenarios among all the combinations of driving
behaviour and recharging strategies are then considered.
We apply to PHEVs only the common strategies foreseen for these technologies (i.e. not fast
charging) and the charging is strictly linked to the driving behaviour of the given PHEV and its
battery capacity. For BEVs there is a higher number of possible recharging strategies to be
applied.
TEMA has 16 recharging strategies, on peak, off peak, smart charging, night charging,
opportunistic, distance driven, return home etc. It is always possible to develop future
scenarios. We used TEMA also for studies on customer driven recharge infrastructure designs
(not related to the ageing module).
The results on in-vehicle battery durability have been reported only for few recharging
strategies, as from the discussions within EVE IWG.
7. The consumption values for BEVs presented by TEMA seem quite low compared with
industry durability estimates. For example, the highest consumption value from EVE-36-09,
slide 6, for a “HP Large Sized BEV”, is 262 Wh/km = 419 Wh/mi = < 1.1 Ah/mi assuming 3.6 V
per cell. This is probably only representative of very mild use customers (less than 50th
percentile) and will produce optimistic estimates of battery degradation for the higher end
of the customer distribution. Some vehicle designs require more than double the
energy/distance (Wh/km) of smaller, more energy-efficient vehicle designs. Future PHEV and
BEV designs may also use the high-voltage battery for on-board, non-propulsion power
generation (e.g., work site 110-V power) and for electrical grid support – these will also
increase the effective Wh/km required of the battery over 160K km
7 The energy consumptions applied are those from vehicle certification or tests. In case of
auxiliaries usage studies the energy consumption is increased. These are parameters that can be
changed also to address worst case scenarios or better scenarios. V2G studies have been explored
too, contributing to extra cycling of the battery. Applied electricity power and efficiency were
those in relation to the already available V2x charging stations and standards.
Cell models:
EVE-24-10 lists 4 different cell model options:
#1 (LiFePO4): Sarasketa-Zabala et Al. (2013/14) model for calendar plus Wang et Al. (2011) model for
cycle
#2 (LiFePO4): Sarasketa-Zabala et Al. (2013/14) model for calendar plus Sarasketa-Zabala et Al.
(2015) model for cycle
#3 (NCM + Spinel Mn): Wang et Al. (2014) for calendar plus Wang et Al. (2014) for cycle
#4 (NCM-LMO): Wang et Al. (2014) for calendar plus Cordoba-Arenas et Al. (2015) for cycle
1. #1 and #2 both address LFP cells.
a. How does the model use the two options for the calendar and cycle life estimations?
b. Are two different life estimates made and combined? If yes, how are the two models
weighted in the final life estimate? If no, why does the model include 2 options for
the same chemistry?
2. #3 and #4 both address NMC-LMO cells (spinel Mn is the same as LMO). How does the
model use the two options for the calendar and cycle life estimations? ? If yes, how are the
two models weighted in the final life estimate? If no, why does the model include 2 options
for the same chemistry?
1 2.They are not combined. Different models for the same chemistry are implemented to contribute
to the assessment of the accuracy of the results, to evaluate the differences in the predictions using
different models for the same chemistry for instance. These are open source cell test data, not JRC
testing data, where we could have more control on the defined parameters.
3. How are other cell chemistries taken into account in the cell models: NCA, NMC, etc?
1 Which are the tuning and the fixed parameters in the cell models?
2 The model seems to assume all mixes belonging to a certain chemical family age in the
same way. Experience shows this is not accurate, e.g. the main ageing mechanisms in
NMC 111 are different from those in NMC 811. Recalibration of modelling parameters is
always required when making changes in manufacturer, chemical composition, physical
material properties, etc.
a. How are different mixes of a specific cell chemistry taken into account by the
cell models?
b. How is the approach validated?
3 We implemented the cells performance based models as for the references. In the references the validation between the model and the cell testing data are reported. The chemistries are not mixed. A new chemistry will generally mean a new model. At the top of the cell validation performed by the authors of the articles in the references we constantly search for new cell chemistry data. New chemistries have been identified. We need to verify if all the parameters are available to be implemented to assess the differences. A recalibration of the parameters can be considered too but in any case testing data at cell level for calendar and cycle ageing is needed. If you have references to new chemistries and models we could verify if it is possible to implement them. 3 Natural variations in cell capacity needs to be accounted for when considering
connection schemes and the influence on load conditions. How is this treated in the cell
model?

3 The assumptions are those reported in the various presentations (normally there is always an extra slide on it for convenience). While developing the model we tried to estimate the effect in making the reported assumptions and limitations. Unfortunately we do not have our own data to refer to. A correction factor might be added if needed. Probably it should be evaluated also the gain on the results against complex implementation and computational burden. 4 The cell model references are from 2013-2015. Significant advances in battery ageing
modelling has occurred in the last 5 years, e.g. transition from 1D to 3D models, new
chemistries. Different tuning parameters are used in the more recent models. Although
the basic parameters may be used to model different types of cells, recalibration is
needed in order to be representative of new cells on the market (e.g. particle
distributions, electrode thickness, electrolyte additives…), or a statistical recalibration
made for a specific cell.
a. How can TEMA be updated to reflect the expanding knowledge base in the
research and manufacturing communities?
b. What specific efforts have been made to update TEMA with additional cell
chemistries?
5 As mentioned already we have retrieved new chemistry data and models, always open
source. Some of them result not to be suitable being not all the parameters available
others are still under study. The update is decided case by case. There is a natural delay
however between the developments in the field and the availability of publications, not
being the new results from our internal source of testing. Typically we implement new
models but if data is available we can also explore recalibrating the parameters. If you
have references to these new chemistries and models we could verify if it is possible to
implement them.
The two experts suggested to be contacted about possible new cell chemistry models
unfortunately said that they did not have available data to share.
6 In EVE-24-10, slide 9, are the curves based on one or two data sets?
These refer to the parameters of the chemistry models and data as reported in the reference
7 Can JRC provide copies of the paper references for the cell models: Wang et al. (2011),
Wang et al. (2014); Sarasketa-Zabala et al. (2013), Sarasketa-Zabala et al. (2014),
Sarasketa-Zabala et al. (2015), Cordoba-Arenas et al. (2014) and Cordoba-Arenas (2015)?
We can provide only open source references.
8 Power to energy ratios of the cells considered are much higher than the present state of
the art for BEV cells, and corresponding energy densities are much lower. For example:
Sarasketa-Zabala et Al. (2013/2014 & 2015): P/E of 25 and Cordoba-Arenas et Al. (2015):
P/E of 15. Different power to energy ratios will result in different sensitivity to aging
factors and affect the conclusions of the study. Chemistry will of course also play a role,
and neither of the chemistries utilized in the references are common in future BEV
applications.
Thanks for the comment. New chemistry, P/E etc. can be explored to be implemented. If you
have references to these new chemistries and models we could verify if it is possible to
implement them. There is always a natural delay as mentioned above between the
development in research and the publication of results.
Data:
1. The presentations name the type of data required as input, but there is no information
about the data format required by the model. In order to enable benchmarking, this must be
elaborated in detail.
2. The table with input data (e.g. EVE-38-02, slide 31, suggests that all input data are single
values.
a. Is this a correct understanding?
b. Does this mean that each customer is assumed to have a single drive cycle or can a
dynamic driving profile be used?
c. How are the drive cycles for BEV and PHEV, respectively, defined in the model
d. How does the model derive representative single values for each parameter?
1 2.The table simplifies the inputs to overcome the sensitivity of data as starting point.
Dynamic driving profile can be used. The drive cycles are based on the database we collected
in different geographic area of Europe, as mentioned above, and on the BEV or PHEV
characteristics. We have a complete 24h a day chain of trip and parking events, trip is
consuming energy, parking might be a charging event or a parking without charging. As
mentioned above the weighted is determine case by case, as per experimental vehicle data
comparison.
3. Can JRC disclose the following (i.e. parameters and specific data distribution):
a. The customer drive cycle used for the simulations, i.e. 24h x 1 week for weekday
commuting and weekend activities
b. How climate in different regions are modelled
c. Any weighting considerations done e.g. based on regional sales statistics
4. It is inappropriate to develop regulatory guidelines for battery degradation based on averaged regression fitting of a few fleet data. Further validation and incorporation of wider scenarios required. We cannot share the data due to the contracts we have in place and data protection rules. The database contains more than 600,000 vehicles, 2.7 billion records and 146 million driven kilometres from twenty geographic areas in Europe. We refer to the website of temperature information in specific month and year in given cities. One source is our JRC website developed by the JRC photovoltaic expert group or an open source website https://www.timeanddate.com/weather We also contributed to an Eco-innovation study of some colleagues of ours where the
temperatures in all European countries were weighted on driving and vehicle statistics. We
have not used this for in-vehicle battery durability.
Other questions:
1. EVE-23-08, slide 13: Axis parameters are missing. What does this graph show?
It is the charge depleting range as for typical UF curves. It was missing for mistake, probably
while resizing the figure for the slide. An example of studies we were doing with big data that
can support the PHEV driving studies, WLTP assessments etc. JRC TEMA has been developed

for other purposes as already mentioned. In-vehicle battery durability is one of the latest
developed module.
2. EVE-24-10, slide 16; What is the intention of the question: “Is there an in-vehicle battery
durability potential issue (i.e. customer-expectation / comparison of technologies)?” Is the
issue related to customer expectation or technical ageing?
2 The slide referred back to 2017 and to all the discussions we were doing to address the topic.
Back that time the need to develop a GTR was still to be decided.
3. EVE-36-09 slides 9-11: “Benchmarking” of model output with field data shows that the
simulated ageing has a wider spread than the field data. How is this possible?
3 As explain the intention was to show the dependence on the different driving behaviour of
the users, charging habits etc. Not always detailed information about how the vehicles were
driven or charged is available in the open source field data. The dispersion is related to
different vehicle user behaviours.
4. EVE-38-02 (slide 17-18): MPR recommendations for “advanced vehicles”
a. How is “advanced vehicles” defined?
b. This implies that different MPR will be developed for other categories of vehicles.
Which categories are considered and how are they defined?
c. What is the market distribution in the data sets used to determine MPR
recommendations?
4 Advanced vehicle refers to technologies and resulting performances.