questions c1 and c2 on enumerator-completed questionnaires ... · questions c1 and c2 on...
TRANSCRIPT
Census 2000 Evaluation I.5June 24, 2003
Coverage Gains From Coverage Questions C1 and C2 on Enumerator-Completed Questionnaires for Census 2000
FINAL REPORT
This evaluation reports the results of research and analysis undertaken by the U.S. Census Bureau. It is part of a broad program, the Census 2000 Testing, Experimentation, and Evaluation (TXE) Program, designed to assess Census 2000 and to inform 2010 Census planning. Findings from the Census 2000 TXE Program reports are integrated into topic reports that provide context and background for broader interpretation of results.
Nganha T. Nguyen
Mary Frances E. Zelenak
Decennial Statistical
Studies Division

______________________________________________________________________ Intentionally Blank

CONTENTS
EXECUTIVE SUMMARY . . . . . . . . . . . . . . . . . . . . . . . . . . . . . . . . . . . . . . . . . . . . . . . . . . . . . . v
1. BACKGROUND . . . . . . . . . . . . . . . . . . . . . . . . . . . . . . . . . . . . . . . . . . . . . . . . . . . . . . . . . . . 11.1 Question C1: Miss anyone? . . . . . . . . . . . . . . . . . . . . . . . . . . . . . . . . . . . . . . . . . . . . 11.2 Question C2: Include anyone who should have been counted elsewhere? . . . . . . . . . 2
2. METHODOLOGY . . . . . . . . . . . . . . . . . . . . . . . . . . . . . . . . . . . . . . . . . . . . . . . . . . . . . . . . . . 22.1 Source of the data . . . . . . . . . . . . . . . . . . . . . . . . . . . . . . . . . . . . . . . . . . . . . . . . . . . . 22.2 Coverage Questions C1 and C2 . . . . . . . . . . . . . . . . . . . . . . . . . . . . . . . . . . . . . . . . . 22.3 Adds and deletes . . . . . . . . . . . . . . . . . . . . . . . . . . . . . . . . . . . . . . . . . . . . . . . . . . . . . 32.4 Demographic characteristics . . . . . . . . . . . . . . . . . . . . . . . . . . . . . . . . . . . . . . . . . . . . 42.5 Enumerators’ use of coverage questions . . . . . . . . . . . . . . . . . . . . . . . . . . . . . . . . . . . 42.6 Applying quality assurance procedures . . . . . . . . . . . . . . . . . . . . . . . . . . . . . . . . . . . . 4
3. LIMITATIONS . . . . . . . . . . . . . . . . . . . . . . . . . . . . . . . . . . . . . . . . . . . . . . . . . . . . . . . . . . . . . 4
4. RESULTS . . . . . . . . . . . . . . . . . . . . . . . . . . . . . . . . . . . . . . . . . . . . . . . . . . . . . . . . . . . . . . . . . 54.1 Coverage gains from Questions C1 and C2 . . . . . . . . . . . . . . . . . . . . . . . . . . . . . . . . 54.2 Demographics of added and deleted people . . . . . . . . . . . . . . . . . . . . . . . . . . . . . . . 124.3 Enumerators’ use of Questions C1 and C2 . . . . . . . . . . . . . . . . . . . . . . . . . . . . . . . . 20
5. CONCLUSIONS . . . . . . . . . . . . . . . . . . . . . . . . . . . . . . . . . . . . . . . . . . . . . . . . . . . . . . . . . . . 21
6. RECOMMENDATIONS . . . . . . . . . . . . . . . . . . . . . . . . . . . . . . . . . . . . . . . . . . . . . . . . . . . . 22
7. REFERENCES . . . . . . . . . . . . . . . . . . . . . . . . . . . . . . . . . . . . . . . . . . . . . . . . . . . . . . . . . . . . 23
APPENDIX A: State Tables . . . . . . . . . . . . . . . . . . . . . . . . . . . . . . . . . . . . . . . . . . . . . . . . . . . . 25
APPENDIX B: Variable Definitions From DRF2 . . . . . . . . . . . . . . . . . . . . . . . . . . . . . . . . . . . . 63
APPENDIX C: Census 2000 Enumerator Questionnaire, Form D-1(E) . . . . . . . . . . . . . . . . . . . 69
i
LIST OF TABLES
Table 1. Response to Question C1 for all enumerator returns by form type and operation . . . . . 6
Table 2. Response to Question C1 for basic enumerator returns by form type and operation . . . 6
Table 3. Response to Question C1 for surviving basic enumerator returns by form type and
operation . . . . . . . . . . . . . . . . . . . . . . . . . . . . . . . . . . . . . . . . . . . . . . . . . . . . . . . . . . . . . . 7
Table 4. Returns with at least one person added when C1 was marked “Yes” by operation . . . . 7
Table 5. Distribution of housing units with C1 marked “Yes” by number of people added and
operation . . . . . . . . . . . . . . . . . . . . . . . . . . . . . . . . . . . . . . . . . . . . . . . . . . . . . . . . . . . . . . 8
Table 6. Response to Question C2 for all enumerator returns by form type and operation . . . . . 9
Table 7. Response to Question C2 for basic enumerator returns by form type and operation . . . 9
Table 8. Response to Question C2 for surviving basic enumerator returns by form type and
operation . . . . . . . . . . . . . . . . . . . . . . . . . . . . . . . . . . . . . . . . . . . . . . . . . . . . . . . . . . . . . 10
Table 9. Returns with at least one person deleted when C2 was marked “Yes” by operation . . 10
Table 10. Distribution of housing units with C2 marked “Yes” by number of people deleted and
operation . . . . . . . . . . . . . . . . . . . . . . . . . . . . . . . . . . . . . . . . . . . . . . . . . . . . . . . . . . . . . 11
Table 11. Number and percent of added and deleted people by RACE . . . . . . . . . . . . . . . . . . . 12
Table 12. Number and percent of added and deleted people by AGE . . . . . . . . . . . . . . . . . . . . 13
Table 13. Number and percent of added and deleted people by SEX . . . . . . . . . . . . . . . . . . . . 14
Table 14. Number and percent of added and deleted people by HISPANIC ORIGIN . . . . . . . . 14
Table 15. Number and percent of added and deleted people by TENURE . . . . . . . . . . . . . . . . 15
Table 16. Number and percent of added people selected by PSA by RACE . . . . . . . . . . . . . . . 16
Table 17. Number and percent of added people selected by PSA by AGE . . . . . . . . . . . . . . . . 17
Table 18. Number and percent of added people selected by PSA by SEX . . . . . . . . . . . . . . . . 18
Table 19. Number and percent of added people selected by PSA by HISPANIC ORIGIN . . . . 18
Table 20. Number and percent of added people selected by PSA by TENURE . . . . . . . . . . . . . 19
Table 21. Observation summary of coverage questions from CIFU, NRFU, and U/E . . . . . . . . 20
Table A1. Response to Question C1 for all enumerator returns by state . . . . . . . . . . . . . . . . . . 25
Table A2. Response to Question C1 for basic enumerator returns by state . . . . . . . . . . . . . . . . 26
Table A3. Response to Question C1 for surviving basic enumerator returns by state . . . . . . . . 27
ii
Table A4. Distribution of housing units with C1 marked “Yes” by number of people added and
state . . . . . . . . . . . . . . . . . . . . . . . . . . . . . . . . . . . . . . . . . . . . . . . . . . . . . . . . . . . . . . . . . 28
Table A5. Response to Question C2 for all enumerator returns by state . . . . . . . . . . . . . . . . . . 30
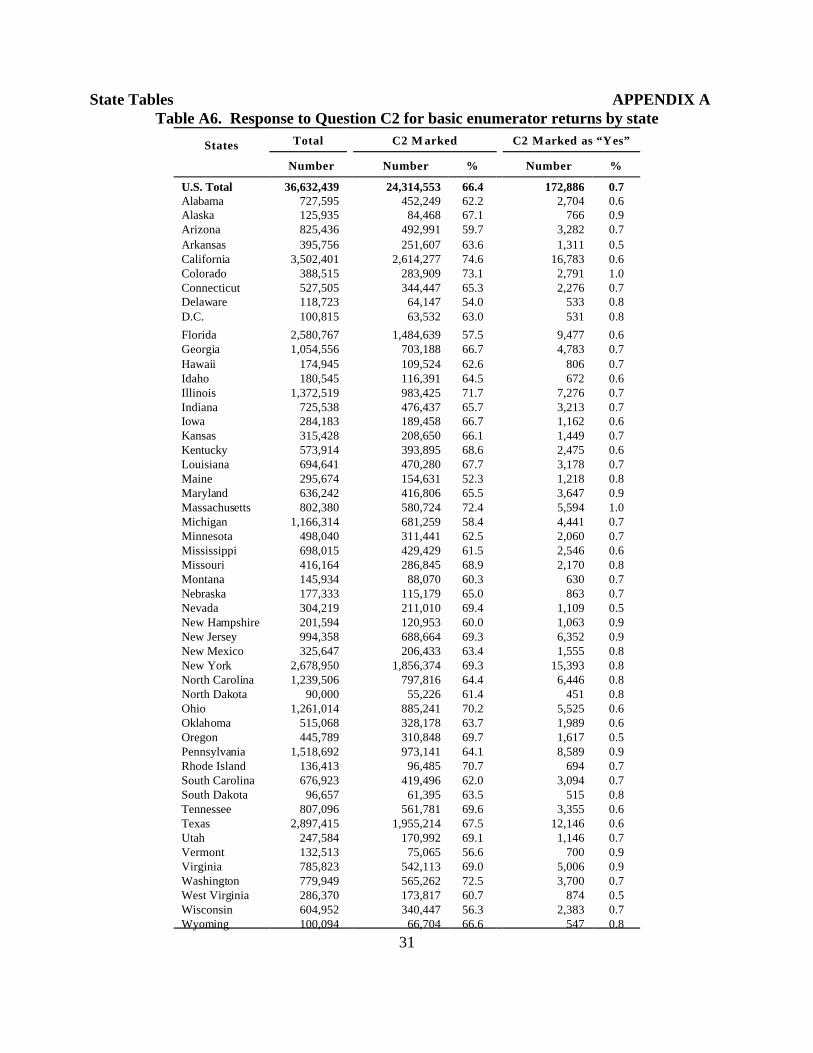
Table A6. Response to Question C2 for basic enumerator returns by state . . . . . . . . . . . . . . . . 31
Table A7. Response to Question C2 for surviving basic enumerator returns by state . . . . . . . . 32
Table A8. Distribution of housing units with C2 marked “Yes” by number of people deleted and
state . . . . . . . . . . . . . . . . . . . . . . . . . . . . . . . . . . . . . . . . . . . . . . . . . . . . . . . . . . . . . . . . . 33
Table A9. Number and percent of added people by state and RACE . . . . . . . . . . . . . . . . . . . . . 35
Table A10. Number and percent of added people by state and AGE . . . . . . . . . . . . . . . . . . . . . 39
Table A11. Number and percent of added people by state and SEX . . . . . . . . . . . . . . . . . . . . . 43
Table A12. Number and percent of added people by state and HISPANIC ORIGIN . . . . . . . . 45
Table A13. Number and percent of added people by state and TENURE . . . . . . . . . . . . . . . . . 47
Table A14. Number and percent of deleted people by state and RACE . . . . . . . . . . . . . . . . . . . 49
Table A15. Number and percent of deleted people by state and AGE . . . . . . . . . . . . . . . . . . . . 53
Table A16. Number and percent of deleted people by state and SEX . . . . . . . . . . . . . . . . . . . . 57
Table A17. Number and percent of deleted people by state and HISPANIC ORIGIN . . . . . . . 59
Table A18. Number and percent of deleted people by state and TENURE . . . . . . . . . . . . . . . . 61
iii

______________________________________________________________________ Intentionally Blank
iv

EXECUTIVE SUMMARY
This evaluation focuses on the use and effectiveness of coverage questions on enumerator-completed questionnaires for Census 2000. The intent of these questions was to identify people who otherwise would have been missed or included in error. Summaries from field observations were examined to determine how well enumerators asked these questions and used the answers to obtain an accurate household roster. The census operations which used these questions were List/Enumerate, Update/Enumerate, Nonresponse Followup, and Coverage Improvement Followup.
In Census 2000, enumerators began by asking how many people were living or staying in the housing unit on Census Day. After collecting the appropriate person and housing unit information, the enumerator asked two coverage questions, which were designed to get an accurate enumeration of all people and housing units.
For the first question, C1, the enumerator referred to Census Day, April 1, 2000, and asked:
I need to make sure I have counted everyone who lived or stayed here on April 1, 2000. Did I miss -- any children, including foster children? - anyone away on business or vacation? - any roomers or housemates? - anyone else who had no other home?
If someone had been missed, then his or her name was to be added to the form, the “Add” box under that person’s name was supposed to be marked, and the census information was to be recorded.
For the second question, C2, the enumerator referred to Census Day, April 1, 2000, and asked:
The Census Bureau has already counted certain people so I don’t want to count them again here. On April 1, 2000, were any of the people you told me about -- away at college? - away in the Armed Forces? - in a nursing home? - in a correctional facility?
If someone was included on the form but should have been counted elsewhere, the enumerator was to delete him or her from the form by marking the “Cancel” box under that person’s name.
For this evaluation, we used data from the Decennial Response File–Stage 2 and the Hundred Percent Census Edited File to tally enumerator returns that had added or deleted people and to obtain distributions of the demographic characteristics of these people.
v

Enumerators were supposed to mark either “Yes” or “No” for each of these coverage questions and then take appropriate action whenever the response was “Yes.” However, about one-third of the time, enumerators left these questions blank. Of the surviving basic enumerator returns in the United States, 66.1 percent had C1 marked and 65.9 percent had C2 marked. Approximately 1.1 percent of the responses were “Yes” for C1, meaning that someone had been missed, and 0.7 percent were “Yes” for C2, meaning that someone should be counted elsewhere. Among the operations, the Coverage Improvement Followup operation saw the lowest percentage of returns with these questions marked, 49.4 percent and 49.2 percent for C1 and C2, respectively. The response rate for these questions in the Nonresponse Followup operation was approximately 68 percent for both.
Inconsistencies appeared when we looked at the people associated with these surviving returns. Only 21.8 percent of the returns that had the “Yes” box marked for C1, had at least one person added; that is, someone with the “Add” box marked. A similar situation occurred with the returns having C2 marked as “Yes.” Only 43.4 percent of the returns with C2 marked as “Yes” had at least one person deleted; that is, someone with the “Cancel” box marked. One possible reason for this inconsistency is that the enumerators may have forgotten to mark the “Add” or “Cancel” box when a roster change was necessary. A person may have been added to the roster but the “Add” box under the name was not marked. If this occurred, we are unable to determine which people were added. For deleted people, although there were returns with C2 marked “Yes” (we included someone who should have been counted elsewhere), we cannot determine who should have been deleted if there is no one with the “Cancel” box marked.
This lack of information makes it difficult to get an accurate account of the people who were missed or included in error. Therefore, a net result of people added or deleted may not be inferred from the data in this report. For the same reason, the demographic data included in this document may not accurately reflect the distributions of the people who were truly added to or deleted from the household rosters.
Based on the information about the number of “Add” and “Cancel” boxes marked, we have added 77,050 people and deleted 83,160 people. Among the people recorded as adds, 46.6 percent were non-Whites, 57.9 percent were young people (ages 0 to 24), 56.5 percent were males, and 51.2 percent were renters. These groups are traditionally undercounted, however, we cannot infer that these two coverage questions are good for improving the differential undercount because of the inadequacy of the data collected.
To improve the percentage of returns with the “Add” and “Cancel” boxes marked when the coverage questions are answered as “Yes,” we recommend providing additional space immediately following the coverage question for entering the names of the people to be added or deleted. A “Don’t know” option may help to increase the response to the question. Also, to improve the data collection process, we recommend using automated instruments and having more training for enumerators on the purpose of asking these questions.
vi

1. BACKGROUND
Census 2000 coverage improvement operations were intended to improve the coverage of groups in the population usually under-represented in the census. The purpose of this evaluation is to study the effectiveness of the new coverage questions in the identification of people who otherwise would have been missed or included in error. This evaluation examines the effect that the coverage questions on enumerator-completed questionnaires–specifically C1 and C2–had on the coverage of Census 2000. It also uses summaries from field observations to determine how well enumerators asked these questions and used the answers to obtain an accurate household roster. The census operations which used these coverage questions were List/Enumerate (L/E), Update/Enumerate (U/E), Nonresponse Followup (NRFU), and Coverage Improvement Followup (CIFU).
In the 1990 census, enumerators began their interview with an explanation of who should be included as residents of the household. This procedure was changed for Census 2000 to facilitate an easier interview. In 2000, enumerators began by asking how many people were living or staying in the housing unit on Census Day. After collecting the appropriate person and housing unit information, the enumerator asked two coverage questions, which were designed to get an accurate enumeration of all people and housing units.
1.1 Question C1: Miss anyone?
The first question asked if the enumerator missed anyone who should have been enumerated at the respondent’s housing unit. The following text was used to obtain this information:
I need to make sure I have counted everyone who lived or stayed here on April 1, 2000. Did I miss -- any children, including foster children? - anyone away on business or vacation? - any roomers or housemates? - anyone else who had no other home?
Typical situations in which people, who should be included as residents, tend to be missed are babies, foster children, people away on business or vacation, roomers or housemates, and temporary residents with no other home. If someone had been missed, then the person’s name was to be added to the form, the “Add” box under that name was supposed to be marked, and the census information was to be recorded. See Appendix C for a copy of the Census 2000 Enumerator Short Form Questionnaire.
1

1.2 Question C2: Include anyone who should have been counted elsewhere?
The second question asked if someone listed on the form should have been counted elsewhere. The following text was used to obtain this information:
The Census Bureau has already counted certain people so I don’t want to count them again here. On April 1, 2000, were any of the people you told me about -- away at college? - away in the Armed Forces? - in a nursing home? - in a correctional facility?
The typical situations in which people, who should not be included as residents, tend to be included as such are people away at college, in the Armed Forces, in a nursing home, or in a correctional facility. If someone was included on the form but should have been counted elsewhere, then the enumerator was supposed to delete him or her from the form by marking the “Cancel” box under that person’s name. See Appendix C for a copy of the Census 2000 Enumerator Short Form Questionnaire.
2. METHODOLOGY
2.1 Source of the data
The data in this evaluation were obtained from the Decennial Response File–Stage 2 (DRF2) and the Hundred Percent Census Edited File (HCEF-D’). Using these files, we created subsets of the data in several steps which are explained below.
We also obtained demographic data for the entire United States population from the Census 2000 Summary File 1 (SF 1).
2.2 Coverage Questions C1 and C2
2.2.1 Surviving enumerator returns
We began by creating a SAS dataset that includes all enumerator return records from the DRF2. The variable RSOURCE was used to select these records. The values for the variable RSOURCE indicate the type (paper or electronic) and source of the return. The source of the return includes the operation from which the return was received. See Appendix B for the values of this variable. For our dataset, we kept all records where RSOURCE = 13–24. These returns were from four operations: L/E, U/E, NRFU, and CIFU. Note that we did not include any records from Group Quarters, Service-Based Enumeration, or T-Night in this evaluation.
2

Next, we merged the enumerator returns on the DRF2 with the HCEF-D’ housing unit file to determine which enumerator returns on the DRF2 were used in further census processing; that is, those with a matching Census ID on the HCEF-D’ housing unit file.
2.2.2 Primary Selection Algorithm
There were several ways in which to respond to Census 2000, including mailing back a questionnaire, completing the form on the Internet, using a Be Counted Form, and being enumerated by field operations such as L/E, U/E, NRFU, and CIFU. While these and other methods of collecting population data were implemented with the goal of obtaining a more accurate census count, the various methods also presented the possibility of receiving multiple responses for a single Census ID. The Primary Selection Algorithm (PSA) was the computer program designed to resolve the receipt of multiple responses from housing units.
Major features of the Census 2000 PSA design included performing person matching between returns, constructing PSA households, selecting the primary PSA household, and selecting additional persons for the census household that are not in the primary PSA household.
A PSA household is a set of associated persons at one Census ID. The set may contain no persons (a vacant PSA household), or one or more persons. More than one return may contribute to a single PSA household. Returns that do not have any persons in common (determined by person matching) constitute separate PSA households. One or more PSA households may be formed at a Census ID. The primary PSA household is the PSA household (including the selected person records on returns in that PSA household) that is used in further processing. When more than one PSA household exists, the primary PSA household is selected by sequentially applying criteria to all of the PSA households until only one PSA household is selected. Certain person records in non-primary PSA households at the Census ID may also be selected for inclusion in the census household.
For this evaluation, we created a subset of the data by keeping only the return selected by the PSA that provides the housing unit data and operational variables on the household level for a particular Census ID. This is the basic return for the primary PSA household. To accomplish this, we used the variable RPRSTAT, which indicates return and PSA household status. We kept the returns with RPRSTAT = 1. See Appendix B for additional values of this variable.
2.3 Adds and deletes
On the enumerator return, there were boxes to indicate if a person was added or deleted. If either of these boxes was marked, the respective variable, PADD or PCANCEL, on the DRF2 person file would have a value of 1. See Appendix B for additional values of these variables. In this evaluation, we are interested in the people marked as adds or deletes who are included on housing unit records that had Question C1 and/or C2 marked as “Yes” and survived to the HCEF–D’. To get this information, we merged the surviving returns with the people on the
3

DRF2. On the DRF2, the variables RC1 and RC2 indicate the response to Questions C1 (whether anyone was missed) and C2 (whether anyone was included in error), respectively. Note: To keep the file sizes to a minimum for the merge, we only kept people who had the “Add” or “Cancel” box marked (PADD = 1 or PCANCEL = 1).
2.4 Demographic characteristics
Summary statistics for race, age, sex, Hispanic origin, and tenure were calculated for added and deleted people separately. We used the final dataset, described in section 2.3 above, containing surviving housing unit records and associated people who were marked as an add or delete. For further analysis, we created a subset of the added people that included only persons who were selected by PSA. This status was indicated by the value of 1 for variable PPSEL on the DRF2 person file. See Appendix B for other possible values of this variable.
2.5 Enumerators’ use of coverage questions
Observations of three enumerator operations–U/E, NRFU, and CIFU–were conducted. Observers filled out an observation checklist or observer’s diary, and this information was summarized in the Financial and Administrative Systems Division’s (FASD’s) Motion and Time Study. Data from this study were used to determine whether enumerators asked the coverage questions and made any roster changes as a result.
2.6 Applying quality assurance procedures
We applied quality assurance procedures throughout the creation of this report. They encompassed how we determined evaluation methods, designed and reviewed computer systems, developed clerical and computer procedures, analyzed data, and prepared this report.
3. LIMITATIONS
The most important limitation in this evaluation was seen in the high level of incomplete or inconsistent information from the enumerator returns. Although Question C1 or C2 was marked as “Yes” on the return, there were cases where no people on the return were marked as an add or a delete. One possible reason for this inconsistency is that the enumerators may have forgotten to mark the “Add” or “Cancel” box when a roster change was necessary. People may have been added to the roster, but without the “Add” box marked, we are unable to determine which people were added. For deleted people, although there were returns with C2 marked “Yes” (we included someone who should have been counted elsewhere), we cannot determine who should have been deleted if there is no one with the “Cancel” box marked.
This lack of information makes it difficult to get an accurate account of the people who were missed or included in error. Therefore, a net result of people added or deleted may not be
4

inferred from the data in this report. Also, this evaluation only contains tallies and demographic information for people who had the “Add” box or “Cancel” box marked. Therefore, the demographic data included in this document may not accurately reflect the distributions of the people who were truly added to or deleted from the household rosters.
Another limitation is that some of the data in this evaluation have not gone through editing and imputation. Therefore, caution should be used when comparing these data to other distributions. For example, the demographic tables, Tables 11 through 20, include a row for people with missing values for the specific characteristic. For added and deleted people, percentages of the demographic characteristics are calculated excluding people with missing values for the specific characteristic. The data from the Census 2000 Summary File 1 (SF 1), also shown in these tables, have undergone editing and imputation, and therefore will have no missing values.
The frequencies and percentages presented in this report include enumerator returns for vacant housing units. We do not know what impact those returns have on the information provided in this evaluation. Also, although we did not study this group, proxy respondents may be a factor in the low number of responses reported here. Further analysis may be needed. More information about the four enumerator operations, including vacant and proxy counts, may be found in the F.12, F.13, H.5 and I.4 Census 2000 Evaluations listed in the reference section of this document.
Note that the Motion and Time Study was done in a limited number of areas and did not use a random sample. This limits any interpretation of the estimates that can be made. We also note that the enumerators may not always have marked the questions that are of interest in this evaluation.
4. RESULTS
NOTE: The tables in this document contain national-level data for the United States, including the District of Columbia. Puerto Rico is excluded from this evaluation. For related state-level tables, see Appendix A.
4.1 Coverage gains from Questions C1 and C2
4.1.1 How many times was Question C1 marked?
Question C1 asks if the enumerator missed anyone that should have been counted at the respondent’s housing unit. Table 1 shows the number of enumerator returns with Question C1 marked and the percentage of all enumerator returns, regardless of PSA household status, from the DRF2 file. Also shown are the number and percentage of returns which had Question C1 marked as “Yes,” meaning someone had been missed. These counts are given by form type (short form or long form from variable RRT) and by operation (RSOURCE). See Appendix B for the values of these variables.
5

Of the approximately 47 million enumerator returns, 40.6 percent did not mark either of the boxes for Question C1. Of the 59.4 percent responses, 1.1 percent were recorded as “Yes.” Among the operations, CIFU had the lowest percentage (31.5 percent) of responses to the question whether anyone was missed.
NOTE: The frequencies and percentages presented in this report include enumerator returns for vacant housing units. We do not know what impact those returns have on the information provided in this evaluation.
Table 1. Response to Question C1 for all enumerator returns by form type and operation
All Enumerator
Returns
Total
Short Form
Long Form
L/E-U /E
NRFU
CIFU
Total C1 M arked C1 M arked as “Y es”
Number Number % Number %
46,971,700 27,895,851 59.4 311,286 1.1
36,437,270 22,258,919 61.1 226,382 1.0
10,534,430 5,636,932 53.5 84,904 1.5
1,463,877 797,713 54.5 9,117 1.1
38,879,865 25,011,023 64.3 280,221 1.1
6,627,958 2,087,115 31.5 21,948 1.1
Source: DRF2 (Variables: RSOURCE (Source of return) = 13-24, all possible values of RPRSTAT (Return and PSA
Household status), RC1 = (1, 2), and RRT = (2, 3))
Table 2 shows similar data as Table 1 for enumerator returns designated as the basic return for a primary PSA household from the DRF2 file. See section 2.2.2. When limiting the universe to only these returns, the percentage of returns with Question C1 marked increases. Among those marked, the percentages of those marked “Yes” were similar to those in Table 1, ranging from 1.0 to 1.5 percent.
Table 2. Response to Question C1 for basic enumerator returns by form type and operation
Basic Enumerator Total C1 M arked C1 Marked as “Yes”
Returns Number Number % Number %
Total 36,632,439 24,386,318 66.6 273,599 1.1
Short Form 28,659,358 19,535,609 68.2 199,744 1.0
Long Form 7,973,081 4,850,709 60.8 73,855 1.5
L/E-U /E 1,305,675 780,421 59.8 8,897 1.1
NRFU 31,558,238 21,665,454 68.7 244,449 1.1
CIFU 3,768,526 1,940,443 51.5 20,253 1.0
Source: DRF2 (Variables: RSOURCE = 13-24, RPRSTAT = 1, RC1 = (1 , 2), and RRT = (2, 3))
6

Table 3 shows how many times Question C1 was marked for surviving basic returns. A surviving basic return is the enumerator return on the DRF2 selected by the PSA to be used in further processing that is also on the HCEF-D’ file. The response percentages by form type and by operation for surviving basic returns are similar to those for basic returns in Table 2.
Table 3. Response to Question C1 for surviving basic enumerator returns by form type and operation
Sur vivin g B asic Total C1 M arked C1 M arked as “Y es” Enumerator
Returns1 Number Number % Number %
Total 35,872,321 23,694,688 66.1 267,452 1.1
Short Form 27,946,633 18,878,633 67.6 194,103 1.0
Long Form 7,925,688 4,816,055 60.8 73,349 1.5
L/E-U /E 1,300,921 775,931 59.6 8,840 1.1
NRFU 31,008,656 21,159,483 68.2 240,090 1.1
CIFU 3,562,744 1,759,274 49.4 18,522 1.1 1The household return from the DRF2 file selected by the PSA for further processing which is also on the HCEF-D’.
Source: DRF2 and HCEF-D’ (Variables: RSOURCE = 13-24, RPRSTAT = 1, RC1 = (1, 2), and RRT = (2, 3))
4.1.2 How many times was at least one person added when Question C1 was marked as
“Yes”?
Table 4 shows the number and percentage of surviving basic returns that had at least one person added (with the “Add” box marked) when Question C1 was marked as “Yes.” Among the operations, the CIFU operation had the smallest percentage (11.2 percent) of returns with at least one person added when the response to C1 was “Yes.”
Table 4. Returns with at least one person added when C1 was marked “Yes” by operation
Question C1 At least 1 person added
marked as “Y es” when C1 marked as “Yes”
Number Number %
Total 267,452 58,215 21.8
L/E-U /E 8,840 2,228 25.2
NRFU 240,090 53,906 22.5
CIFU 18,522 2,081 11.2
Source: DRF2 and HCEF-D’ (Variables: RSOURCE = 13-24,
RPRSTAT = 1 , RC1 = 1, and PADD = 1 for at least one person
on the return)
7

Some possible reasons for the inconsistent information for Question C1 may include:
• The respondent answered “Yes” (that someone had been missed), but - refused to give the information for the person to be added; or - then said there was no one else in the household.
• The enumerator - recorded the information for the person, but forgot to mark the “Add” box; or - marked “Yes” by mistake.
4.1.3 What was the distribution of the number of people added as a result of Question C1?
Table 5 shows the distribution of the number of people added (with the “Add” box marked) as a result of Question C1 being marked as “Yes.” Overall, 80.1 percent of returns with added people added one person. In the L/E and U/E operations combined, 3.7 percent of the returns had five or more people added.
Table 5. Distribution of housing units with C1 marked “Yes” by number of people added and operation
Distribution of added people
Total 1 2 3 4 5+
Number Number % Number % Number % Number % Number %
Total 58,215 46,617 80.1 7,565 13.0 2,249 3.9 1,025 1.8 759 1.3
L/E-U /E 2,228 1,648 74.0 319 14.3 117 5.3 62 2.8 82 3.7
NRFU 53,906 43,319 80.4 6,961 12.9 2,060 3.8 922 1.7 644 1.2
CIFU 2,081 1,650 79.3 285 13.7 72 3.5 41 2.0 33 1.6
Source: DRF2 and HCEF-D’ (Variables: RSOURCE = 13-24, RPRSTAT = 1, RC1 = 1, and PADD = 1)
4.1.4 How many times was Question C2 marked?
Question C2 asks if someone listed on the form should be counted elsewhere. Table 6 shows the number of returns with Question C2 marked together with its percentage of the total of all enumerator returns, regardless of PSA household status, from the DRF2 file. Also shown are the number of times Question C2 was marked as “Yes” and its percentage among those with Question C2 marked.
A response to Question C2 was given on 59.2 percent of all enumerator returns. Among these, 0.7 percent responded “Yes,” indicating that someone, who was included on the form, should have been counted somewhere else. The percentage of responses to Question C2 by form type and by operation was similar to the percentage of responses to Question C1 shown in Table 1.
8
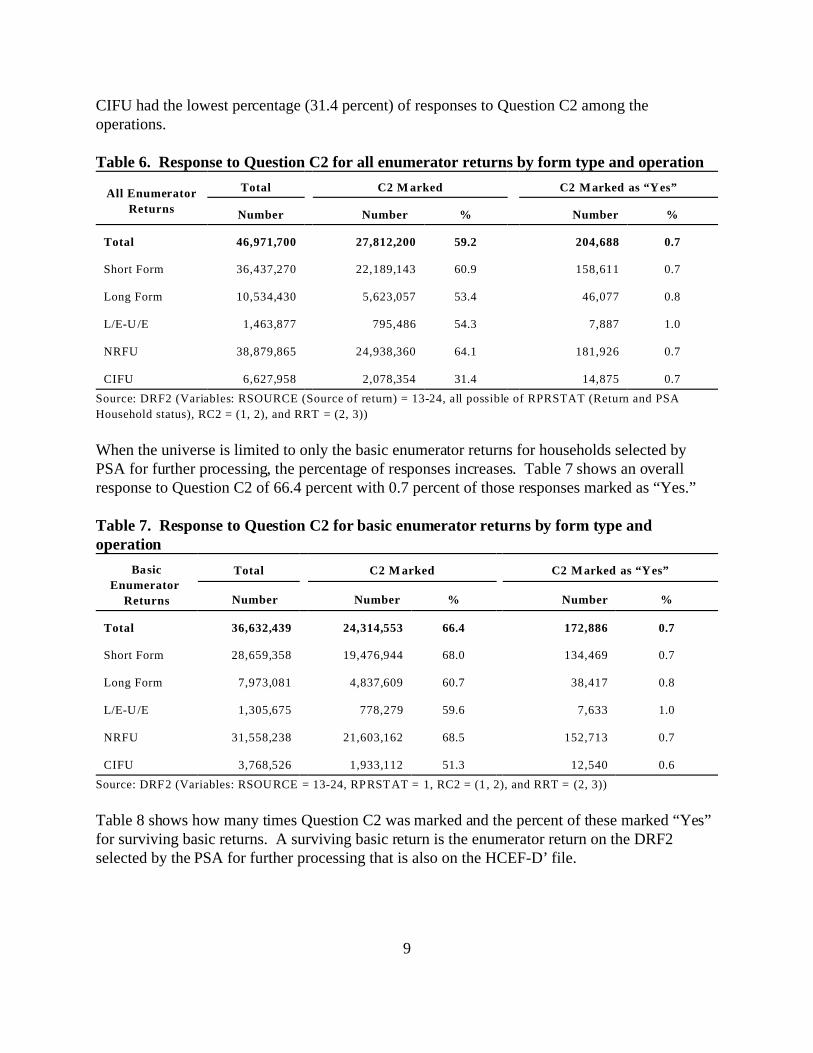
CIFU had the lowest percentage (31.4 percent) of responses to Question C2 among the operations.
Table 6. Response to Question C2 for all enumerator returns by form type and operation
All Enumerator Total C2 M arked C2 M arked as “Y es”
Returns Number Number % Number %
Total 46,971,700 27,812,200 59.2 204,688 0.7
Short Form 36,437,270 22,189,143 60.9 158,611 0.7
Long Form 10,534,430 5,623,057 53.4 46,077 0.8
L/E-U /E 1,463,877 795,486 54.3 7,887 1.0
NRFU 38,879,865 24,938,360 64.1 181,926 0.7
CIFU 6,627,958 2,078,354 31.4 14,875 0.7
Source: DRF2 (Variables: RSOURCE (Source of return) = 13-24, all possible of RPRSTAT (Return and PSA
Household status), RC2 = (1, 2), and RRT = (2, 3))
When the universe is limited to only the basic enumerator returns for households selected by PSA for further processing, the percentage of responses increases. Table 7 shows an overall response to Question C2 of 66.4 percent with 0.7 percent of those responses marked as “Yes.”
Table 7. Response to Question C2 for basic enumerator returns by form type and operation
Ba sic Total C2 M arked C2 M arked as “Y es” Enumerator
Returns Number Number % Number %
Total 36,632,439 24,314,553 66.4 172,886 0.7
Short Form 28,659,358 19,476,944 68.0 134,469 0.7
Long Form 7,973,081 4,837,609 60.7 38,417 0.8
L/E-U /E 1,305,675 778,279 59.6 7,633 1.0
NRFU 31,558,238 21,603,162 68.5 152,713 0.7
CIFU 3,768,526 1,933,112 51.3 12,540 0.6
Source: DRF2 (Variables: RSOURCE = 13-24, RPRSTAT = 1, RC2 = (1 , 2), and RRT = (2, 3))
Table 8 shows how many times Question C2 was marked and the percent of these marked “Yes” for surviving basic returns. A surviving basic return is the enumerator return on the DRF2 selected by the PSA for further processing that is also on the HCEF-D’ file.
9

On average, only 0.7 percent of the 65.9 percent of returns with a response to Question C2 responded “Yes,” that someone who was included should have been counted elsewhere. The CIFU operation had the lowest percentage (49.2 percent) of surviving basic returns with a response to Question C2.
Table 8. Response to Question C2 for surviving basic enumerator returns by form type and operation
Sur vivin g B asic Total C2 M arked C2 M arked as “Y es” Enumerator
Returns2 Number Number % Number %
Total 35,872,321 23,624,967 65.9 168,370 0.7
Short Form 27,946,633 18,821,889 67.3 130,380 0.7
Long Form 7,925,688 4,803,078 60.6 37,990 0.8
L/E-U /E 1,300,921 773,804 59.5 7,593 1.0
NRFU 31,008,656 21,098,641 68.0 149,459 0.7
CIFU 3,562,744 1,752,522 49.2 11,318 0.6 2The household return from the DRF2 file selected by PSA for further processing which is also on the HCEF-D’.
Source: DRF2 and HCEF-D’ (Variables: RSOURCE = 13-24, RPRSTAT = 1, RC2 = (1, 2) and RRT = (2, 3))
4.1.5 How many times was at least one person deleted when Question C2 was marked as
“Yes”?
For surviving basic returns with Question C2 marked as “Yes,” Table 9 shows the number of returns which had at least one person deleted; that is, with the “Cancel” box marked. Of the 7,593 L/E and U/E returns with Question C2 marked as “Yes,” 56.1 percent had at least one person marked for deletion.
Table 9. Returns with at least one person deleted when C2 was marked “Yes” by operation
Question C2 At least 1 person deleted
marked as “Y es” when C2 marked as “Yes”
Number Number %
Total 168,370 73,019 43.4
L/E-U /E 7,593 4,263 56.1
NRFU 149,459 65,293 43.7
CIFU 11,318 3,463 30.6
Source: DRF2 and HCEF-D’ (Variables: RSOURCE = 13-24, RPRSTAT = 1,
RC2 = 1 and PCANCEL = 1 for at least one person on the return)
10

Some possible reasons for the inconsistent information for Question C2 may include:
• The respondent answered “Yes” (that someone should have been counted elsewhere), but refused to indicate which person should be deleted.
• The enumerator forgot to mark the “Cancel” box under the person’s name.
4.1.6 What was the distribution of the number of people deleted as a result of Question
C2?
Table 10 shows the distribution of the number of people deleted (with the “Cancel” box marked) as a result of an affirmative response to Question C2. For the majority of housing units (88.4 percent) with Question C2 marked as “Yes,” there was one person deleted. Less than 0.5 percent of the housing units from each operation had five or more people deleted.
Table 10. Distribution of housing units with C2 marked “Yes” by number of people deleted and operation
Distribution of deleted people
Total 1 2 3 4 5+
Number Number % Number % Number % Number % Number %
Total 73,019 64,559 88.4 7,169 9.8 985 1.3 237 0.3 69 0.1
L/E-U /E 4,263 3,671 86.1 511 12.0 69 1.6 11 0.3 1 0.0
NRFU 65,293 57,920 88.7 6,285 9.6 837 1.3 198 0.3 53 0.1
CIFU 3,463 2,968 85.7 373 10.8 79 2.3 28 0.8 15 0.4
Source: DRF2 and HCEF-D’ (Variables: RSOURCE = 13-24, RPRSTAT = 1, RC2 = 1 and PCANCEL = 1)
11

4.2 Demographics of added and deleted people
4.2.1 What were the demographics of the added and deleted people?
Tables 11 through 15 show the distributions of selected demographic characteristics (race, age, sex, Hispanic origin, and tenure) for the people who were on a surviving return and had the “Add” or “Cancel” box marked. We also include the frequency distribution of each characteristic for the entire United States population from the Census 2000 Summary File 1 (SF 1), which has undergone editing and imputation, and includes the group quarters as well as the housing unit population unless stated otherwise.
Note that percents for each demographic characteristic in Tables 11 through 15 are calculated excluding people with missing values for that particular characteristic. However, the tables by state in Appendix A include all people in the percent calculation. See Appendix B for the values of the demographic variables used in this evaluation.
Table 11 shows that among added and deleted people with non-missing race, White comprised 53.3 percent and 65.8 percent, respectively. The Black, African American race group made up 21.4 percent of adds and 19.1 percent of deletes. The non-whites made up 46.7 percent of the adds and 24.9 percent of the entire population. However, we cannot infer that these questions are good for improving the differential undercount because of the inadequacy of the data collected.
NOTE: Because data are for persons who actually had the “Add” or “Cancel” box marked, a net count of added or deleted people should not be inferred from this table, nor should any inferences be made about the demographic distributions.
Table 11. Number and percent of added and deleted people by RACE
Adds Deletes Entire population
Race Number % Number % Number %
Total 77,050 100 .0 83,160 100 .0 281,421,906 100 .0
W hite 39,617 53.3 51,199 65.8 211,460,626 75.1
Black, African American 15,910 21.4 14,827 19.1 34,658,190 12.3
American Indian,
Alaskan Native
Asian
Native Hawaiian or
Other Pacific Islander
Some Other Race
Two or More
Missing
2,790 3.8 1,845 2.4 2,475,956 0.9
3,375 4.5 4,030 5.2 10,242,998 4.8
394 0.5 206 0.3 398,835 1.2
9,668 13.0 3,973 5.1 15,359,073 5.5
2,520 3.4 1,737 2.2 6,826,228 2.4
2,776 - 5,343 - - -
Source: DRF2 and HCEF-D’ (Variables: RSOURCE = 13-24, RPRSTAT = 1, RC1 = 1 or RC2 = 1, PADD = 1 or
PCANCEL = 1, and PRACE01-PRACE15); Census 2000 Summary File 1.
12

For the age characteristic in Table 12, among people with non-missing age, 57.9 percent of adds were people ages 0 through 24 years. Young people ages 0 through 24 years made up 35.3 percent of the entire population. This is a group that is traditionally undercounted, however, we cannot infer that these questions are good for improving the differential undercount because of the inadequacy of the data collected. Among the deletes, 67.3 percent of the people were ages 15 to 24 years. This may reflect college students who would be counted at college and often are included on their parents’ return.
NOTE: Because data are for persons who actually had the “Add” or “Cancel” box marked, a net count of added or deleted people should not be inferred from this table, nor should any inferences be made about the demographic distributions.
Table 12. Number and percent of added and deleted people by AGE
Age
Total
0 to 14 years
15 to 24 years
25 to 34 years
35 to 44 years
45 to 54 years
55 to 64 years
65 to 74 years
75 to 84 years
85 years and over
Missing
Adds Deletes Entire population
Number % Number % Number %
77,050 100 .0 83,160 100 .0 281,421,906 100 .0
20,891 29.4 3,562 4.8 60,253,375 21.4
20,262 28.5 49,727 67.3 39,183,891 13.9
12,356 17.4 8,488 11.5 39,891,724 14.2
7,606 10.7 4,368 5.9 45,148,527 16.0
4,409 6.2 1,986 2.7 37,677,952 13.4
2,548 3.6 1,075 1.5 24,274,684 8.6
1,675 2.4 1,211 1.6 18,390,986 6.5
869 1.2 1,900 2.6 12,361,180 4.4
395 0.0 1,598 2.2 4,239,587 1.5
6,039 - 9,245 - - -
Source: DRF2 and HCEF-D’ (Variables: RSOURCE = 13-24, RPRSTAT = 1, RC1 = 1 or RC2 = 1, PADD = 1 or
PCANCEL = 1, and PAGE); Census 2000 Summary File 1.
13

Males are traditionally undercounted. Within the entire population, 49.1 percent are males. Table 13 shows that, among people with non-missing sex, 56.5 percent of adds were males. However, we cannot infer that these questions are good for improving the differential undercount because of the inadequacy of the data collected. Males accounted for 56.7 percent of the deleted people.
NOTE: Because data are for persons who actually had the “Add” or “Cancel” box marked, a net count of added or deleted people should not be inferred from this table, nor should any inferences be made about the demographic distributions.
Table 13. Number and percent of added and deleted people by SEX
Adds Deletes Entire population
Sex Number % Number % Number %
Total 77,050 100 .0 83,160 100 .0 281,421,906 100 .0
M ale 42,928 56.5 45,896 56.7 138,053,563 49.1
Fem ale 33,023 43.5 35,038 43.3 143,368,343 50.9
Missing 1,099 - 2,226 - - -
Source: DRF2 and HCEF-D’ (Variables: RSOURCE = 13-24, RPRSTAT = 1, RC1 = 1 or RC2 = 1, PADD = 1 or
PCANCEL = 1, and PSEX); Census 2000 Summary File 1.
Table 14 shows that, among people with non-missing Hispanic origin, Hispanic people made up 25.3 percent of adds. However, Hispanics made up 12.5 percent of the entire population. We cannot infer that these questions are good for improving the differential undercount because of the inadequacy of the data collected. Among deleted people, 90.3 percent were Non-Hispanic.
NOTE: Because data are for persons who actually had the “Add” or “Cancel” box marked, a net count of added or deleted people should not be inferred from this table, nor should any inferences be made about the demographic distributions.
Table 14. Number and percent of added and deleted people by HISPANIC ORIGIN
Adds Deletes Entire population
Hisp anic orig in Number % Number % Number %
Total 77,050 100 .0 83,160 100 .0 281,421,906 100 .0
No n-Hisp anic 56,178 74.7 70,589 90.3 246,116,088 87.5
Hisp anic 19,076 25.3 7,578 9.7 35,305,818 12.5
Missing 1,796 - 4,993 - - -
Source: DRF2 and HCEF-D’ (Variables: RSOURCE = 13-24, RPRSTAT = 1, RC1 = 1 or RC2 = 1, PADD = 1 or
PCANCEL = 1, PSPAN01-PSPAN05, PSPANWI); Census 2000 Summary File 1.
14
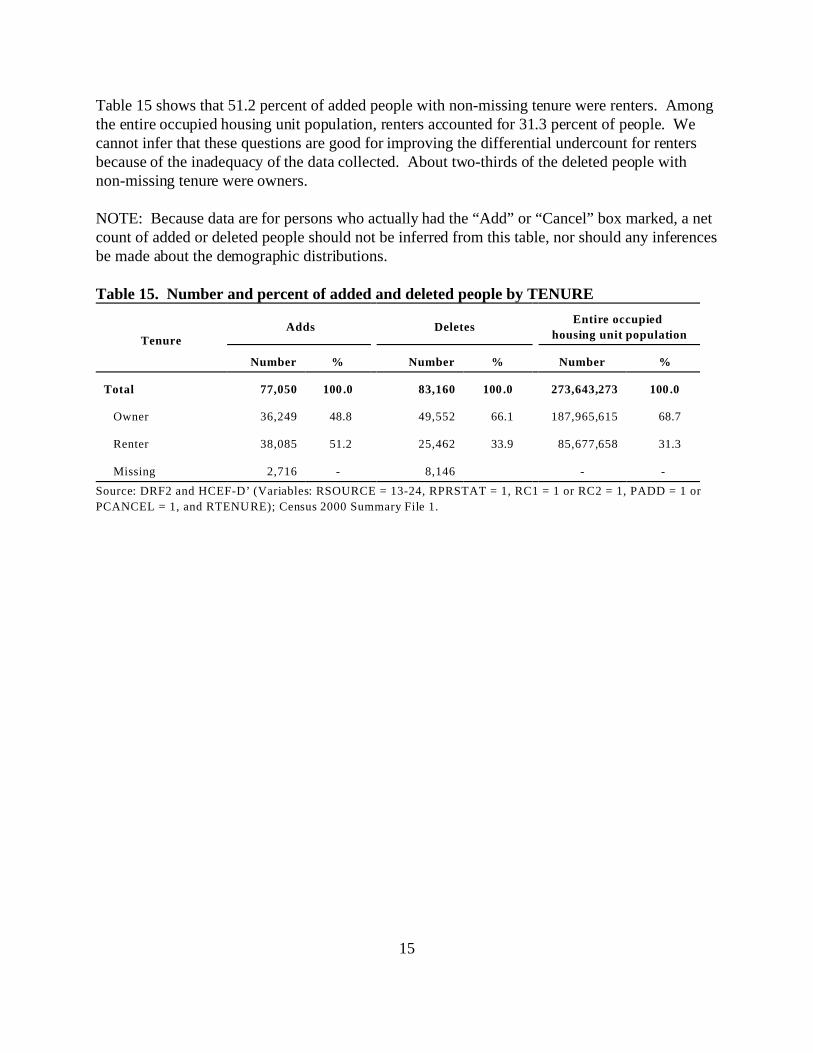
Table 15 shows that 51.2 percent of added people with non-missing tenure were renters. Among the entire occupied housing unit population, renters accounted for 31.3 percent of people. We cannot infer that these questions are good for improving the differential undercount for renters because of the inadequacy of the data collected. About two-thirds of the deleted people with non-missing tenure were owners.
NOTE: Because data are for persons who actually had the “Add” or “Cancel” box marked, a net count of added or deleted people should not be inferred from this table, nor should any inferences be made about the demographic distributions.
Table 15. Number and percent of added and deleted people by TENURE
Tenure Adds Deletes
Entire occupied
housing unit population
Number % Number % Number %
Total 77,050 100 .0 83,160 100 .0 273,643,273 100 .0
Owner 36,249 48.8 49,552 66.1 187,965,615 68.7
Renter 38,085 51.2 25,462 33.9 85,677,658 31.3
Missing 2,716 - 8,146 - -
Source: DRF2 and HCEF-D’ (Variables: RSOURCE = 13-24, RPRSTAT = 1, RC1 = 1 or RC2 = 1, PADD = 1 or
PCANCEL = 1, and RTENURE); Census 2000 Summary File 1.
15

4.2.2 What were the demographics of added people selected by PSA?
Tables 16 through 20 show the demographic characteristics of added people on surviving returns who were selected by PSA. By definition, no deleted people were selected. These tables also include the frequency distribution of each characteristic for the entire United States population from the Census 2000 Summary File 1 (SF 1), which has undergone editing and imputation, and includes the group quarters as well as the housing unit population unless stated otherwise.
Note that percents for each demographic characteristic in Tables 16 through 20 are calculated excluding people with missing values for that particular characteristic. See Appendix B for the values of the demographic variables used in this evaluation.
Among added people selected by PSA with non-missing race, 53.4 percent reported White and 21.4 percent reported Black, African American.
NOTE: Because data are for persons who actually had the “Add” box marked, the estimates may not reflect the actual impact of the coverage question, and inferences about the demographic distributions of added people should not be made from this table.
Table 16. Number and percent of added people selected by PSA by RACE
Adds selected by PSA Entire population
Race Number % Number %
Total 75,804 100 .0 281,421,906 100 .0
W hite 39,101 53.4 211,460,626 75.1
Black, African American 15,670 21.4 34,658,190 12.3
American Indian, Alaskan Native 2,715 3.7 2,475,956 0.9
Asian 3,311 4.5 10,242,998 4.8
Native Hawaiian or Other Pacific Islander 390 0.5 398,835 1.2
Some Other Race 9,509 13.0 15,359,073 5.5
Two o r More 2,487 3.4 6,826,228 2.4
Missing 2,621 - - -
Source: DRF2 and HCEF-D’ (Variables: RSOURCE = 13-24, RPRSTAT = 1, RC1 = 1, PPSEL = 1, PAD D = 1, and
PRACE01-PRACE15); Census 2000 Summary File 1.
16

Table 17 shows that 57.9 percent of added people selected by PSA with non-missing age were young people aged 0 to 24 years old.
NOTE: Because data are for persons who actually had the “Add” box marked, the estimates may not reflect the actual impact of the coverage question, and inferences about the demographic distributions of added people should not be made from this table.
Table 17. Number and percent of added people selected by PSA by AGE
Age
Total
0 to 14 years
15 to 24 years
25 to 34 years
35 to 44 years
45 to 54 years
55 to 64 years
65 to 74 years
75 to 84 years
85 years and over
Missing
Adds selected by PSA Entire population
Number % Number %
75,804 100 .0 281,421,906 100.0
20,518 29.3 60,253,375 21.4
19,971 28.6 39,183,891 13.9
12,203 17.4 39,891,724 14.2
7,502 10.7 45,148,527 16.0
4,352 6.2 37,677,952 13.4
2,512 3.6 24,274,684 8.6
1,653 2.4 18,390,986 6.5
852 1.2 12,361,180 4.4
384 0.5 4,239,587 1.5
5,857 - - -
Source: DRF2 and HCEF-D’ (Variables: RSO URCE = 13-24, RPRSTAT = 1, RC1 = 1,
PPSEL = 1, PADD = 1, and PAGE); Census 2000 Summary File 1.
17

Table 18 shows that males made up 56.5 percent of added people who were selected by PSA with non-missing sex. Females made up 43.5 percent of this group.
NOTE: Because data are for persons who actually had the “Add” box marked, the estimates may not reflect the actual impact of the coverage question, and inferences about the demographic distributions of added people should not be made from this table.
Table 18. Number and percent of added people selected by PSA by SEX
Adds selected by PSA Entire population Sex
Number % Number %
Total 75,804 100.0 281,421,906 100.0
M ale 42,277 56.5 138,053,563 49.1
Fem ale 32,525 43.5 143,368,343 50.9
Missing 1,002 - - -
Source: DRF2 and HCEF-D’ (Variables: RSO URCE = 13-24, RPRSTAT = 1, RC1 = 1,
PPSEL = 1, PADD = 1, and PSEX); Census 2000 Summary File 1.
In Table 19, we see that about three-fourths (74.7 percent) of added people selected by PSA with non-missing Hispanic origin were Non-Hispanic.
NOTE: Because data are for persons who actually had the “Add” box marked, the estimates may not reflect the actual impact of the coverage question, and inferences about the demographic distributions of added people should not be made from this table.
Table 19. Number and percent of added people selected by PSA by HISPANIC ORIGIN
Adds selected by PSA Entire population Hisp anic orig in
Number % Number %
Total 75,804 100 .0 281,421,906 100.0
No n-Hisp anic 55,401 74.7 246,116,088 87.5
Hisp anic 18,732 25.3 35,305,818 12.5
Missing 1,671 - - -
Source: DRF2 and HCEF-D’ (Variables: RSO URCE = 13-24, RPRSTAT = 1, RC1 = 1,
PPSEL = 1, PADD = 1, PSPAN01-PSPAN05, PSPANW I); Census 2000 Summary File 1.
18

Table 20 shows that renters accounted for 51.2 percent of added people with non-missing tenure who were selected by PSA.
NOTE: Because data are for persons who actually had the “Add” box marked, the estimates may not reflect the actual impact of the coverage question, and inferences about the demographic distributions of added people should not be made from this table.
Table 20. Number and percent of added people selected by PSA by TENURE
Tenure Adds selected by PSA
Entire occupied hou sing u nit
population
Number % Number %
Total 75,804 100 .0 273,643,273 100 .0
Owner 35,674 48.8 187,965,615 68.7
Renter 37,482 51.2 85,677,658 31.3
Missing 2,648 - - -
Source: DRF2 and HCEF-D’ (Variables: RSOURCE = 13-24, RPRSTAT = 1, RC1 = 1 ,
PPSEL = 1, PADD = 1, and RTENURE); Census 2000 Summary File 1.
19

4.3 Enumerators’ use of Questions C1 and C2
The following table summarizes the field observations in FASD’s Motion and Time Studies of the CIFU, NRFU, and U/E operations. The observations were conducted in a limited number of areas, which are listed below.
CIFU Concord, CA; Clarksville, IN; Louisville, KY NRFU Providence, RI; Clarksville, IN; Louisville, KY U/E El Paso, TX
Note: FASD did not conduct a Motion and Time Study of L/E for Census 2000.
Did the enumerators read Questions C1 and C2?
The information included here is directly from the Motion and Time Studies. There were only 417 enumerator interviews observed, which were not randomly selected. We note that roster changes were made in NRFU and U/E; however, the data do not explain what those changes were; specifically, whether people were added or deleted from the roster.
Table 21. Observation summary of coverage questions from CIFU, NRFU, and U/E
CIFU
Number of Percent
Interviews %
NRFU
Number of Percent
Interviews %
U/E
Number of Percent
Interviews %
154 100
134 87
20 13
130 84
24 16
4 3
Total 55 100 208 100
Asked C1 35 64 184 88
Did not ask C1 20 36 24 12
Asked C2 34 62 170 82
Did not ask C2 21 38 38 18
Number of times
roster change d as a 0 0 7 3
result of C1 or C2
20

5. CONCLUSIONS
Among enumerator returns in the United States, the percentage with coverage Question C1 marked was similar to the percentage with Question C2 marked. Of the surviving basic enumerator returns, 66.1 percent had C1 marked and 65.9 percent had C2 marked. Among the operations, CIFU saw the lowest percentage of returns with these questions marked, 49.4 percent and 49.2 percent for C1 and C2, respectively. The NRFU response to these questions was approximately 68 percent for both.
When checking the people associated with these surviving returns, one finds that only 21.8 percent of the returns that had the “Yes” box marked for C1, had at least one person added; that is, someone with the “Add” box marked. A similar situation occurred with the returns having C2 marked as “Yes.” At least one person was deleted; that is, someone had the “Cancel” box marked, on 43.4 percent of the returns.
The enumerators may have forgotten to mark the “Add” or “Cancel” box when a roster change was necessary. People may have been added, but the “Add” box was not marked. For deleted people, although there were returns with C2 marked “Yes” (we included someone who should have been counted elsewhere), we cannot determine who should have been deleted if there is no one with the “Cancel” box marked.
This inconsistent and incomplete information makes it difficult to get an accurate account of the people who were missed or included in error. Therefore, we are unable to determine a net result of people added or deleted from the data in this report. For the same reason, the demographic data included in this document may not accurately reflect the distributions of the people who were truly added to or deleted from the household rosters.
Based on the information about the number of “Add” and “Cancel” boxes marked, we have added 77,050 people and deleted 83,160 people. Among the people recorded as adds, 46.6 percent were non-Whites, 57.9 percent were young people (ages 0 to 24), 56.5 percent were males, and 51.2 percent were renters. These groups are traditionally undercounted, however, we cannot infer that these two coverage questions are good for improving the differential undercount because of the inadequacy of the data collected.
21

6. RECOMMENDATIONS
Coverage questions are a useful tool for capturing those people who would have been missed in the census or for excluding those people who should have been counted elsewhere. The coverage questions, C1 and C2, did not work as presented. More research to explore other solutions is needed. The questions may need to be redesigned and tested for different audiences. Certain formats may work better in different situations or with different respondents.
There are two main schools of thought about census coverage. One suggests, as we did in Census 2000, that we collect everybody that we can on the household roster and then filter the list using the coverage questions to determine who to add or delete. The other side agrees with the 1990 method of telling the respondent up front who should be included or not included on the roster. Maybe a compromise can be reached such as providing to the respondent a flash card with the types of people to include or exclude.
Although this evaluation did not address proxy respondents or returns for vacant housing units, and we, therefore, do not know the impact they may have had on the reported data, one suggestion for improving the response to the coverage questions is adding a “Don’t know” response option. If the information is for a vacant unit or is provided by a proxy, there may not be enough information to give a definite “yes” or “no” answer. This may also be helpful when respondents refuse to answer or simply don’t know. Further analysis may be necessary.
Because of the low percentage of returns with the “Add” and “Cancel” boxes marked when the coverage questions were answered in the affirmative, we recommend providing additional space immediately following the coverage questions for entering the name of the people to be added or deleted.
Automated instruments may help to improve the data collection process by requiring a response to each coverage question, and subsequent data entry for an affirmative answer, before allowing the enumerator to continue with the next question.
Although we are unsure why the coverage questions C1 and C2 were left blank by enumerators one-third of the time, we feel that enumerators may need more training to understand the purpose and importance of asking the questions.
22
7. REFERENCES
Census 2000 Enumerator Short Form Questionnaire, Form D-1(E).
Census 2000 Enumerator Long Form Questionnaire, Form D-2(E).
“Detailed Tables from Census 2000 Summary File 1 (SF 1) 100-Percent Data,” American FactFinder, September 26, 2002.
Katzoff, Ellen. “Decennial Response File–Stage2 (DRF2) Final (Revision 3),” 2000 Decennial Census Documentation, October 3, 2000.
Memorandum from Howard Hogan for Ruth Ann Killion, “Study Plan for Coverage Gains from Coverage Questions (C1-C2) on Enumerator Completed Questionnaires for Census, I.5,” DSSD Census 2000 Procedures and Operations Memorandum Series #BB-32.
Memorandum from Nevins A. Frankel for Brian Monaghan, “Report of the Work Measurement Study of Coverage Improvement Followup (CIFU) - Census 2000,” April 24, 2001.
Memorandum from Nevins A. Frankel for Brian Monaghan, “Report of the Work Measurement Study of Nonresponse Followup - Census 2000,” November 15, 2000.
Memorandum from Nevins A. Frankel for Brian Monaghan, “Report of the Work Measurement Study of Update/Enumerate - Census 2000,” September 6, 2000.
Memorandum from Rajendra P. Singh for Ruth Ann Killion, “Final Report for List/Enumerate -F.13,” May 23, 2002.
Memorandum from Rajendra P. Singh for Ruth Ann Killion, “Final Report for Update/Enumerate - F.12.”
Moul, Darlene A. (2003), “Coverage Improvement Followup,” DSSD Census 2000 Evaluation I.4, U.S. Bureau of the Census, February 20, 2003 (Draft).
Moul, Darlene A. (2002), “Nonresponse Followup for Census 2000,” DSSD Census 2000 Evaluation H.5, U.S. Bureau of the Census, July 25, 2002.
23

______________________________________________________________________ Intentionally Blank
24

State Tables APPENDIX A Table A1. Response to Question C1 for all enumerator returns by state
States
U.S. Total
AlabamaAlaskaArizonaArkansasCaliforniaColoradoConnecticutDelawareD.C.FloridaGeorgiaHawaiiIdahoIllinoisIndianaIowaKansasKentuckyLouisianaMaineMarylandMassachusettsMichiganMinnesotaMississippiMissouriMontanaNebraskaNevadaNew HampshireNew JerseyNew MexicoNew YorkNorth CarolinaNorth DakotaOhioOklahomaOregonPennsylvaniaRhode IslandSouth CarolinaSouth DakotaTennesseeTexasUtahVermontVirginiaWashingtonWest VirginiaWisconsinWyoming
Total C1 M arked C1 M arked as “Y es”
Number Number % Number %
46,971,700 27,895,851 59.4 311,286 1.1
962,372 507,242 52.7 5,516 1.1 147,237 92,094 62.5 999 1.1
1,056,297 553,592 52.4 6,950 1.3 529,695 289,760 54.7 2,900 1.0
4,426,491 3,014,327 68.1 34,712 1.2 658,717 392,304 59.6 4,211 1.1 490,503 329,438 67.2 4,038 1.2 158,434 74,612 47.1 819 1.1 139,700 74,791 53.5 1,300 1.7
3,177,980 1,697,308 53.4 19,054 1.1 1,318,161 798,024 60.5 9,435 1.2
224,227 125,032 55.8 1,177 0.9 222,377 131,594 59.2 1,281 1.0
1,858,308 1,160,414 62.4 14,482 1.2 955,606 568,091 59.4 5,882 1.0 369,526 224,078 60.6 2,162 1.0 411,908 243,589 59.1 2,422 1.0 741,001 447,099 60.3 4,377 1.0 902,521 531,431 58.9 5,703 1.1 346,112 167,658 48.4 1,483 0.9 841,852 484,669 57.6 6,665 1.4 994,740 661,743 66.5 8,216 1.2
1,488,512 794,542 53.4 8,366 1.1 652,096 386,047 59.2 3,761 1.0 539,354 325,750 60.4 3,907 1.2 913,966 496,281 54.3 4,537 0.9 180,967 98,294 54.3 915 0.9 225,096 135,127 60.0 1,436 1.1 377,775 233,269 61.7 2,900 1.2 243,992 135,721 55.6 1,354 1.0
1,294,374 796,790 61.6 9,162 1.2 406,866 230,330 56.6 2,997 1.3
3,441,865 2,087,871 60.7 27,044 1.3 1,610,543 914,108 56.8 9,663 1.1
112,303 62,450 55.6 567 0.9 1,583,259 1,014,758 64.1 8,882 0.9
683,962 374,940 54.8 3,772 1.0 558,499 355,007 63.6 3,697 1.0
1,951,746 1,121,825 57.5 12,380 1.1 181,682 109,168 60.1 1,162 1.1 899,751 481,360 53.5 5,293 1.1 125,277 73,734 58.9 859 1.2
1,065,605 635,688 59.7 6,351 1.0 3,773,710 2,224,220 58.9 25,538 1.1
302,979 195,107 64.4 2,533 1.3 155,324 82,174 52.9 897 1.1
1,034,644 632,061 61.1 6,464 1.0 989,326 653,025 66.0 6,762 1.0 364,803 195,642 53.6 1,441 0.7 760,289 408,617 53.7 4,120 1.0
119,370 73,055 61.2 742 1.0
25

State Tables APPENDIX A Table A2. Response to Question C1 for basic enumerator returns by state
States
U.S. Total AlabamaAlaskaArizonaArkansasCaliforniaColoradoConnecticutDelawareD.C.FloridaGeorgiaHawaiiIdahoIllinoisIndianaIowaKansasKentuckyLouisianaMaineMarylandMassachusettsMichiganMinnesotaMississippiMissouriMontanaNebraskaNevadaNew HampshireNew JerseyNew MexicoNew YorkNorth CarolinaNorth DakotaOhioOklahomaOregonPennsylvaniaRhode IslandSouth CarolinaSouth DakotaTennesseeTexasUtahVermontVirginiaWashingtonWest VirginiaWisconsinWyoming
Total C1 M arked C1 M arked as “Y es”
Number Number % Number %
36,632,439 24,386,318 66.6 273,599 1.1 727,595 453,803 62.4 4,992 1.1 125,935 84,539 67.1 936 1.1 825,436 494,479 59.9 6,289 1.3 395,756 252,336 63.8 2,504 1.0
3,502,401 2,620,702 74.8 30,357 1.2 388,515 284,865 73.3 3,520 1.2 527,505 345,449 65.5 3,720 1.1 118,723 64,467 54.3 695 1.1 100,815 63,922 63.4 1,124 1.8
2,580,767 1,490,164 57.7 16,784 1.1 1,054,556 705,708 66.9 8,348 1.2
174,945 109,768 62.7 1,011 0.9 180,545 116,605 64.6 1,156 1.0
1,372,519 986,402 71.9 12,391 1.3 725,538 478,011 65.9 4,972 1.0 284,183 189,966 66.8 1,866 1.0 315,428 209,328 66.4 2,124 1.0 573,914 394,891 68.8 3,867 1.0 694,641 471,529 67.9 5,047 1.1 295,674 155,012 52.4 1,379 0.9 636,242 418,313 65.7 5,803 1.4 802,380 582,722 72.6 7,248 1.2
1,166,314 683,075 58.6 7,223 1.1 498,040 312,154 62.7 3,080 1.0 698,015 430,377 61.7 3,958 0.9 416,164 287,678 69.1 3,504 1.2 145,934 88,214 60.4 829 0.9 177,333 115,522 65.1 1,235 1.1 304,219 211,587 69.6 2,609 1.2 201,594 121,334 60.2 1,202 1.0 994,358 690,744 69.5 8,001 1.2 325,647 206,972 63.6 2,724 1.3
2,678,950 1,862,542 69.5 24,202 1.3 1,239,506 800,061 64.5 8,520 1.1
90,000 55,338 61.5 505 0.9 1,261,014 887,471 70.4 7,808 0.9
515,068 328,999 63.9 3,318 1.0 445,789 311,734 69.9 3,276 1.1
1,518,692 975,999 64.3 10,799 1.1 136,413 96,840 71.0 1,048 1.1 676,923 421,213 62.2 4,625 1.1
96,657 61,524 63.7 749 1.2 807,096 563,362 69.8 5,667 1.0
2,897,415 1,960,960 67.7 22,665 1.2 247,584 171,416 69.2 2,204 1.3 132,513 75,257 56.8 831 1.1 785,823 543,446 69.2 5,581 1.0 779,949 566,810 72.7 5,857 1.0 286,370 174,223 60.8 1,283 0.7 604,952 341,576 56.5 3,482 1.0 100,094 66,909 66.8 681 1.0
26

State Tables APPENDIX A Table A3. Response to Question C1 for surviving basic enumerator returns by state
States
U.S. Total AlabamaAlaskaArizona
ArkansasCaliforniaColoradoConnecticutDelawareD.C.FloridaGeorgiaHawaiiIdahoIllinoisIndianaIowaKansasKentuckyLouisianaMaineMarylandMassachusettsMichiganMinnesotaMississippiMissouriMontanaNebraskaNevadaNew HampshireNew JerseyNew MexicoNew YorkNorth CarolinaNorth DakotaOhioOklahomaOregonPennsylvaniaRhode IslandSouth CarolinaSouth DakotaTennesseeTexasUtahVermontVirginiaWashingtonWest VirginiaWisconsinWyoming
Total C1 M arked C1 M arked as “Y es”
Number Number % Number %
35,872,321 23,694,688 66.1 267,452 1.1 705,375 433,772 61.5 4,829 1.1
124,156 82,822 66.7 927 1.1
807,615 480,715 59.5 6,162 1.3
384,267 241,666 62.9 2,412 1.0 3,454,650 2,576,914 74.6 29,946 1.2
518,375 337,246 65.1 3,640 1.1 380,828 277,861 73.0 3,449 1.2 116,376 62,607 53.8 680 1.1 100,594 63,801 63.4 1,122 1.8
2,540,131 1,457,080 57.4 16,427 1.1 1,024,019 677,835 66.2 8,128 1.2
169,957 105,413 62.0 965 0.9 176,559 112,852 63.9 1,130 1.0
1,344,720 960,694 71.4 12,118 1.3 707,676 462,079 65.3 4,850 1.1 277,726 183,941 66.2 1,821 1.0 309,295 203,706 65.9 2,090 1.0 556,688 378,593 68.0 3,756 1.0 675,724 454,004 67.2 4,905 1.1 291,410 151,006 51.8 1,352 0.9 624,399 407,813 65.3 5,685 1.4 787,482 568,929 72.2 7,100 1.2
1,146,043 664,458 58.0 7,079 1.1 488,803 303,380 62.1 3,016 1.0 684,026 417,189 61.0 3,865 0.9 400,433 273,161 68.2 3,359 1.2 144,031 86,391 60.0 819 0.9 174,996 113,328 64.8 1,208 1.1 300,974 208,732 69.4 2,584 1.2 197,354 117,374 59.5 1,162 1.0 972,182 670,854 69.0 7,840 1.2 318,224 200,335 63.0 2,654 1.3
2,625,039 1,813,089 69.1 23,598 1.3 1,204,449 767,288 63.7 8,216 1.1
88,432 53,876 60.9 493 0.9 1,237,867 865,703 69.9 7,654 0.9
505,851 320,367 63.3 3,245 1.0 436,512 303,526 69.5 3,200 1.1
1,482,206 941,702 63.5 10,519 1.1 133,679 94,335 70.6 1,022 1.1 653,032 399,787 61.2 4,434 1.1
95,276 60,211 63.2 739 1.2 782,740 540,867 69.1 5,528 1.0
2,844,262 1,912,697 67.2 22,239 1.2 242,801 166,953 68.8 2,157 1.3 129,886 72,716 56.0 810 1.1 770,908 529,324 68.7 5,472 1.0 763,197 551,534 72.3 5,725 1.0 279,967 168,014 60.0 1,258 0.7 592,115 330,255 55.8 3,394 1.0
99,014 65,893 66.5 669 1.0
27

State Tables APPENDIX A Table A4. Distribution of housing units with C1 marked “Yes” by number of people added and state
Total Distribution of added peopleStates
1 2 3 4 5+ Number
Number % Number % Number % Number % Number %
U.S. Total 58,215 46,617 80.1 7,565 13.0 2,249 3.9 1,025 1.8 759 1.3
Alabama 787 654 83.1 92 11.7 23 2.9 12 1.5 6 0.8
Alaska 372 300 80.6 52 14.0 11 3.0 6 1.6 3 0.8
Arizona 1,589 1,196 75.3 237 14.9 86 5.4 33 2.1 37 2.3
Arkansas 433 358 82.7 52 12.0 10 2.3 7 1.6 6 1.4
California 8,767 6,853 78.2 1,224 14.0 371 4.2 171 2.0 148 1.7
Colorado 1,038 868 83.6 127 12.2 27 2.6 8 0.8 8 0.8
Connecticut 719 560 77.9 107 14.9 33 4.6 10 1.4 9 1.3
Delaware 123 99 80.5 15 12.2 6 4.9 2 1.6 1 0.8
D.C. 153 112 73.2 22 14.4 12 7.8 3 2.0 4 2.6
Florida 3,256 2,655 81.5 413 12.7 104 3.2 48 1.5 36 1.1
Georgia 1,383 1,121 81.1 178 12.9 47 3.4 24 1.7 13 0.9
Hawaii 355 279 78.6 50 14.1 11 3.1 8 2.3 7 2.0
Idaho 371 316 85.2 31 8.4 12 3.2 6 1.6 6 1.6
Illinois 2,144 1,696 79.1 285 13.3 76 3.5 55 2.6 32 1.5
Indiana 824 688 83.5 88 10.7 30 3.6 11 1.3 7 0.9
Iowa 370 302 81.6 44 11.9 14 3.8 5 1.4 5 1.4
Kansas 455 377 82.9 41 9.0 24 5.3 9 2.0 4 0.9
Kentucky 694 591 85.2 75 10.8 19 2.7 7 1.0 2 0.3
Louisiana 996 809 81.2 130 13.1 40 4.0 12 1.2 5 0.5
Maine 271 224 82.7 35 12.9 9 3.3 3 1.1 0 0.0
Maryland 1,006 801 79.6 131 13.0 45 4.5 17 1.7 12 1.2
Massachusetts 963 773 80.3 113 11.7 34 3.5 30 3.1 13 1.4
Michigan 1,682 1,344 79.9 228 13.6 61 3.6 29 1.7 20 1.2
Minnesota 819 668 81.6 98 12.0 30 3.7 14 1.7 9 1.1
Mississippi 593 484 81.6 76 12.8 19 3.2 10 1.7 4 0.7
Missouri 850 706 83.1 95 11.2 27 3.2 16 1.9 6 0.7
Montana 313 265 84.7 35 11.2 10 3.2 2 0.6 1 0.3
Nebraska 291 243 83.5 31 10.7 8 2.7 5 1.7 4 1.4
Nevada 565 419 74.2 83 14.7 21 3.7 18 3.2 24 4.2
New Hampshire 243 209 86.0 29 11.9 4 1.6 0 0.0 1 0.4
28

State Tables APPENDIX A Total Distribution of added people
States 1 2 3 4 5+
Number Number % Number % Number % Number % Number %
New Jersey 1,484 1,167 78.6 201 13.5 73 4.9 27 1.8 16 1.1
New Mexico 823 639 77.6 116 14.1 35 4.3 17 2.1 16 1.9
New York 4,260 3,288 77.2 619 14.5 196 4.6 83 1.9 74 1.7
North Carolina 1,512 1,215 80.4 199 13.2 61 4.0 31 2.1 6 0.4
North Dakota 147 120 81.6 17 11.6 8 5.4 1 0.7 1 0.7
Ohio 1,793 1,468 81.9 222 12.4 63 3.5 29 1.6 11 0.6
Oklahoma 711 586 82.4 76 10.7 30 4.2 13 1.8 6 0.8
Oregon 992 829 83.6 116 11.7 32 3.2 8 0.8 7 0.7
Pennsylvania 1,742 1,418 81.4 228 13.1 43 2.5 29 1.7 24 1.4
Rhode Island 182 140 76.9 30 16.5 8 4.4 3 1.6 1 0.5
South Carolina 792 653 82.4 94 11.9 27 3.4 7 0.9 11 1.4
South Dakota 193 154 79.8 24 12.4 4 2.1 7 3.6 4 2.1
Tennessee 1,159 957 82.6 145 12.5 35 3.0 13 1.1 9 0.8
Texas 4,968 3,917 78.8 622 12.5 227 4.6 106 2.1 96 1.9
Utah 706 563 79.7 94 13.3 29 4.1 12 1.7 8 1.1
Vermont 159 124 78.0 23 14.5 9 5.7 2 1.3 1 0.6
Virginia 1,307 1,053 80.6 180 13.8 46 3.5 19 1.5 9 0.7
Washington 1,743 1,459 83.7 199 11.4 53 3.0 19 1.1 13 0.7
West Virginia 273 237 86.8 25 9.2 7 2.6 3 1.1 1 0.4
W isconsin 666 514 77.2 91 13.7 35 5.3 14 2.1 12 1.8
W yoming 178 146 82.0 27 15.2 4 2.2 1 0.6 0 0.0
29

State Tables APPENDIX A Table A5. Response to Question C2 for all enumerator returns by state
States
U.S. Total AlabamaAlaskaArizonaArkansasCaliforniaColoradoConnecticutDelawareD.C.
FloridaGeorgiaHawaiiIdahoIllinoisIndianaIowaKansasKentuckyLouisianaMaineMarylandMassachusettsMichiganMinnesotaMississippiMissouriMontanaNebraskaNevadaNew HampshireNew JerseyNew MexicoNew YorkNorth CarolinaNorth DakotaOhioOklahomaOregonPennsylvaniaRhode IslandSouth CarolinaSouth DakotaTennesseeTexasUtahVermontVirginiaWashingtonWest VirginiaWisconsinWyoming
Total C2 M arked C2 M arked as “Y es”
Number Number % Number %
46,971,700 27,812,200 59.2 204,688 0.7 962,372 505,471 52.5 3,180 0.6 147,237 92,022 62.5 849 0.9
1,056,297 551,892 52.2 3,739 0.7 529,695 288,926 54.5 1,604 0.6
4,426,491 3,006,737 67.9 19,848 0.7 658,717 391,152 59.4 2,648 0.7 490,503 328,285 66.9 3,380 1.0 158,434 74,226 46.9 649 0.9 139,700 74,346 53.2 633 0.9
3,177,980 1,690,871 53.2 11,056 0.7 1,318,161 795,116 60.3 5,591 0.7
224,227 124,738 55.6 950 0.8 222,377 131,356 59.1 794 0.6
1,858,308 1,156,827 62.3 8,900 0.8 955,606 566,214 59.3 3,994 0.7 369,526 223,494 60.5 1,444 0.6 411,908 242,804 58.9 1,777 0.7
741,001 445,968 60.2 2,912 0.7 902,521 530,018 58.7 3,688 0.7 346,112 167,235 48.3 1,338 0.8 841,852 482,828 57.4 4,387 0.9 994,740 659,386 66.3 6,538 1.0
1,488,512 792,377 53.2 5,422 0.7 652,096 385,155 59.1 2,653 0.7 539,354 324,767 60.2 2,554 0.8 913,966 495,152 54.2 3,079 0.6 180,967 98,139 54.2 700 0.7 225,096 134,723 59.9 1,065 0.8 377,775 232,642 61.6 1,280 0.6 243,992 135,292 55.4 1,247 0.9
1,294,374 794,361 61.4 7,585 1.0 406,866 229,730 56.5 1,722 0.8
3,441,865 2,080,806 60.5 17,646 0.8 1,610,543 911,495 56.6 7,605 0.8
112,303 62,320 55.5 512 0.8 1,583,259 1,012,174 63.9 6,628 0.7
683,962 373,981 54.7 2,355 0.6 558,499 353,969 63.4 1,937 0.5
1,951,746 1,118,490 57.3 10,311 0.9 181,682 108,783 59.9 850 0.8 899,751 479,408 53.3 3,697 0.8 125,277 73,567 58.7 605 0.8
1,065,605 633,834 59.5 3,987 0.6 3,773,710 2,217,545 58.8 14,212 0.6
302,979 194,625 64.2 1,322 0.7 155,324 81,977 52.8 788 1.0
1,034,644 630,468 60.9 6,057 1.0 989,326 651,206 65.8 4,409 0.7 364,803 195,171 53.5 1,028 0.5 760,289 407,294 53.6 2,924 0.7 119,370 72,837 61.0 609 0.8
30
State Tables APPENDIX A Table A6. Response to Question C2 for basic enumerator returns by state
States
U.S. Total AlabamaAlaskaArizonaArkansasCaliforniaColoradoConnecticutDelawareD.C.
FloridaGeorgiaHawaiiIdahoIllinoisIndianaIowaKansasKentuckyLouisianaMaineMarylandMassachusettsMichiganMinnesotaMississippiMissouriMontanaNebraskaNevadaNew HampshireNew JerseyNew MexicoNew YorkNorth CarolinaNorth DakotaOhioOklahomaOregonPennsylvaniaRhode IslandSouth CarolinaSouth DakotaTennesseeTexasUtahVermontVirginiaWashingtonWest VirginiaWisconsinWyoming
Total C2 M arked C2 M arked as “Y es”
Number Number % Number %
36,632,439 24,314,553 66.4 172,886 0.7 727,595 452,249 62.2 2,704 0.6 125,935 84,468 67.1 766 0.9 825,436 492,991 59.7 3,282 0.7
395,756 251,607 63.6 1,311 0.5 3,502,401 2,614,277 74.6 16,783 0.6
388,515 283,909 73.1 2,791 1.0 527,505 344,447 65.3 2,276 0.7 118,723 64,147 54.0 533 0.8 100,815 63,532 63.0 531 0.8
2,580,767 1,484,639 57.5 9,477 0.6 1,054,556 703,188 66.7 4,783 0.7
174,945 109,524 62.6 806 0.7 180,545 116,391 64.5 672 0.6
1,372,519 983,425 71.7 7,276 0.7 725,538 476,437 65.7 3,213 0.7 284,183 189,458 66.7 1,162 0.6 315,428 208,650 66.1 1,449 0.7 573,914 393,895 68.6 2,475 0.6 694,641 470,280 67.7 3,178 0.7 295,674 154,631 52.3 1,218 0.8 636,242 416,806 65.5 3,647 0.9 802,380 580,724 72.4 5,594 1.0
1,166,314 681,259 58.4 4,441 0.7 498,040 311,441 62.5 2,060 0.7 698,015 429,429 61.5 2,546 0.6 416,164 286,845 68.9 2,170 0.8 145,934 88,070 60.3 630 0.7 177,333 115,179 65.0 863 0.7 304,219 211,010 69.4 1,109 0.5 201,594 120,953 60.0 1,063 0.9 994,358 688,664 69.3 6,352 0.9 325,647 206,433 63.4 1,555 0.8
2,678,950 1,856,374 69.3 15,393 0.8 1,239,506 797,816 64.4 6,446 0.8
90,000 55,226 61.4 451 0.8 1,261,014 885,241 70.2 5,525 0.6
515,068 328,178 63.7 1,989 0.6 445,789 310,848 69.7 1,617 0.5
1,518,692 973,141 64.1 8,589 0.9 136,413 96,485 70.7 694 0.7 676,923 419,496 62.0 3,094 0.7
96,657 61,395 63.5 515 0.8 807,096 561,781 69.6 3,355 0.6
2,897,415 1,955,214 67.5 12,146 0.6 247,584 170,992 69.1 1,146 0.7 132,513 75,065 56.6 700 0.9 785,823 542,113 69.0 5,006 0.9 779,949 565,262 72.5 3,700 0.7 286,370 173,817 60.7 874 0.5 604,952 340,447 56.3 2,383 0.7 100,094 66,704 66.6 547 0.8
31

State Tables APPENDIX A Table A7. Response to Question C2 for surviving basic enumerator returns by state
States
U.S. Total
AlabamaAlaskaArizona
ArkansasCaliforniaColoradoConnecticutDelawareD.C.FloridaGeorgiaHawaiiIdahoIllinoisIndianaIowaKansasKentuckyLouisianaMaineMarylandMassachusettsMichiganMinnesotaMississippiMissouriMontanaNebraskaNevadaNew HampshireNew JerseyNew MexicoNew YorkNorth CarolinaNorth DakotaOhioOklahomaOregonPennsylvaniaRhode IslandSouth CarolinaSouth DakotaTennesseeTexasUtahVermontVirginiaWashingtonWest VirginiaWisconsinWyoming
Total C1 M arked C1 M arked as “Y es”
Number Number % Number %
35,872,321 23,624,967 65.9 168,370 0.7
705,375 432,283 61.3 2,593 0.6 124,156 82,752 66.7 750 0.9
807,615 479,283 59.3 3,218 0.7
384,267 240,963 62.7 1,266 0.5 3,454,650 2,570,628 74.4 16,533 0.6
518,375 336,268 64.9 2,213 0.7 380,828 276,925 72.7 2,739 1.0 116,376 62,289 53.5 520 0.8 100,594 63,411 63.0 529 0.8
2,540,131 1,451,667 57.1 9,255 0.6 1,024,019 675,404 66.0 4,609 0.7
169,957 105,182 61.9 768 0.7 176,559 112,647 63.8 649 0.6
1,344,720 957,803 71.2 7,079 0.7 707,676 460,543 65.1 3,117 0.7 277,726 183,450 66.1 1,120 0.6 309,295 203,041 65.6 1,410 0.7 556,688 377,647 67.8 2,389 0.6 675,724 452,798 67.0 3,094 0.7 291,410 150,632 51.7 1,189 0.8
624,399 406,341 65.1 3,575 0.9 787,482 566,976 72.0 5,478 1.0
1,146,043 662,709 57.8 4,330 0.7 488,803 302,684 61.9 1,992 0.7 400,433 272,366 68.0 2,053 0.8 684,026 416,265 60.9 2,475 0.6 144,031 86,252 59.9 622 0.7 174,996 112,992 64.6 849 0.8 300,974 208,166 69.2 1,094 0.5 197,354 117,000 59.3 1,027 0.9 972,182 668,835 68.8 6,182 0.9 318,224 199,823 62.8 1,521 0.8
2,625,039 1,807,082 68.8 14,982 0.8 1,204,449 765,132 63.5 6,212 0.8
88,432 53,765 60.8 445 0.8 1,237,867 863,537 69.8 5,393 0.6
505,851 319,568 63.2 1,944 0.6 436,512 302,671 69.3 1,580 0.5
1,482,206 938,950 63.3 8,302 0.9 133,679 93,990 70.3 673 0.7 653,032 398,145 61.0 2,953 0.7
95,276 60,083 63.1 501 0.8 782,740 539,341 68.9 3,264 0.6
2,844,262 1,907,097 67.1 11,887 0.6 242,801 166,538 68.6 1,119 0.7 129,886 72,527 55.8 685 0.9 770,908 528,007 68.5 4,906 0.9 763,197 550,022 72.1 3,595 0.7 279,967 167,625 59.9 851 0.5 592,115 329,163 55.6 2,312 0.7
99,014 65,699 66.4 528 0.8
32

State Tables APPENDIX A Table A8. Distribution of housing units with C2 marked “Yes” by number of people deleted and state
States Total Distribution of deleted people
1 2 3 4 5+ Number
Number % Number % Number % Number % Number %
U.S. Total 73,019 64,559 88.4 7,169 9.8 985 1.3 237 0.3 69 0.1
Alabama 917 819 89.3 86 9.4 10 1.1 2 0.2 0 0.0
Alaska 425 359 84.5 53 12.5 11 2.6 2 0.5 0 0.0
Arizona 1,265 1,093 86.4 140 11.1 22 1.7 8 0.6 2 0.2
Arkansas 459 408 88.9 42 9.2 6 1.3 3 0.7 0 0.0
Califo rnia 6,914 6,065 87.7 701 10.1 105 1.5 37 0.5 6 0.1
Colorado 940 832 88.5 97 10.3 10 1.1 1 0.1 0 0.0
Connecticut 1,340 1,164 86.9 155 11.6 20 1.5 1 0.1 0 0.0
Delaware 199 179 90.0 16 8.0 3 1.5 0 0.0 1 0.5
D.C. 211 186 88.2 21 10.0 3 1.4 1 0.5 0 0.0
Florida 3,344 3,014 90.1 276 8.3 36 1.1 12 0.4 6 0.2
Ge orgia 1,628 1,441 88.5 160 9.8 20 1.2 7 0.4 0 0.0
Ha waii 417 367 88.0 33 7.9 12 2.9 3 0.7 2 0.5
Idaho 297 265 89.2 28 9.4 3 1.0 0 0.0 1 0.3
Illinois 2,833 2,508 88.5 284 10.0 32 1.1 7 0.2 2 0.1
Indiana 1,311 1,192 90.9 99 7.6 17 1.3 2 0.2 1 0.1
Iowa 454 403 88.8 43 9.5 7 1.5 1 0.2 0 0.0
Kansas 630 575 91.3 47 7.5 7 1.1 1 0.2 0 0.0
Kentucky 984 907 92.2 60 6.1 13 1.3 3 0.3 1 0.1
Louisiana 1,306 1,172 89.7 121 9.3 12 0.9 1 0.1 0 0.0
Maine 670 584 87.2 76 11.3 6 0.9 3 0.4 1 0.1
Maryland 1,610 1,438 89.3 149 9.3 15 0.9 5 0.3 3 0.2
M assachusetts 2,497 2,144 85.9 307 12.3 36 1.4 7 0.3 3 0.1
Michigan 1,871 1,637 87.5 201 10.7 24 1.3 6 0.3 3 0.2
M inneso ta 894 786 87.9 88 9.8 15 1.7 5 0.6 0 0.0
Mississippi 907 822 90.6 70 7.7 11 1.2 2 0.2 2 0.2
Missouri 1,044 941 90.1 85 8.1 12 1.1 5 0.5 1 0.1
Mo ntana 348 302 86.8 41 11.8 5 1.4 0 0.0 0 0.0
Nebraska 428 361 84.3 54 12.6 8 1.9 4 0.9 1 0.2
Nevada 324 271 83.6 46 14.2 3 0.9 4 1.2 0 0.0
New H ampshire 590 499 84.6 82 13.9 7 1.2 2 0.3 0 0.0
33

State Tables APPENDIX A
States Total Distribution of deleted people
1 2 3 4 5+ Number
Number % Number % Number % Number % Number %
New Jersey 3,019 2,630 87.1 354 11.7 32 1.1 1 0.0 2 0.1
New Mexico 669 588 87.9 66 9.9 13 1.9 2 0.3 0 0.0
New York 6,538 5,747 87.9 682 10.4 90 1.4 15 0.2 4 0.1
North Carolina 2,851 2,531 88.8 265 9.3 43 1.5 12 0.4 0 0.0
North Dakota 259 231 89.2 26 10.0 1 0.4 1 0.4 0 0.0
Ohio 2,414 2,151 89.1 224 9.3 31 1.3 6 0.2 2 0.1
Oklahoma 818 718 87.8 81 9.9 12 1.5 6 0.7 1 0.1
Oregon 649 564 86.9 63 9.7 16 2.5 4 0.6 2 0.3
Pennsylvania 4,153 3,672 88.4 417 10.0 50 1.2 13 0.3 1 0.0
Rhode Island 303 256 84.5 40 13.2 6 2.0 1 0.3 0 0.0
South Carolina 1,268 1,145 90.3 101 8.0 15 1.2 5 0.4 2 0.2
South Dakota 244 221 90.6 19 7.8 4 1.6 0 0.0 0 0.0
Tennessee 1,286 1,155 89.8 115 8.9 13 1.0 2 0.2 1 0.1
Texas 4,601 4,110 89.3 426 9.3 48 1.0 13 0.3 4 0.1
Utah 468 418 89.3 34 7.3 12 2.6 1 0.2 3 0.6
Vermont 392 337 86.0 51 13.0 4 1.0 0 0.0 0 0.0
Virginia 2,695 2,383 88.4 244 9.1 56 2.1 6 0.2 6 0.2
Washington 1,576 1,398 88.7 135 8.6 30 1.9 10 0.6 3 0.2
West Virginia 414 374 90.3 37 8.9 3 0.7 0 0.0 0 0.0
Wisconsin 1,054 937 88.9 100 9.5 12 1.1 3 0.3 2 0.2
Wyoming 291 259 89.0 28 9.6 3 1.0 1 0.3 0 0.0
34
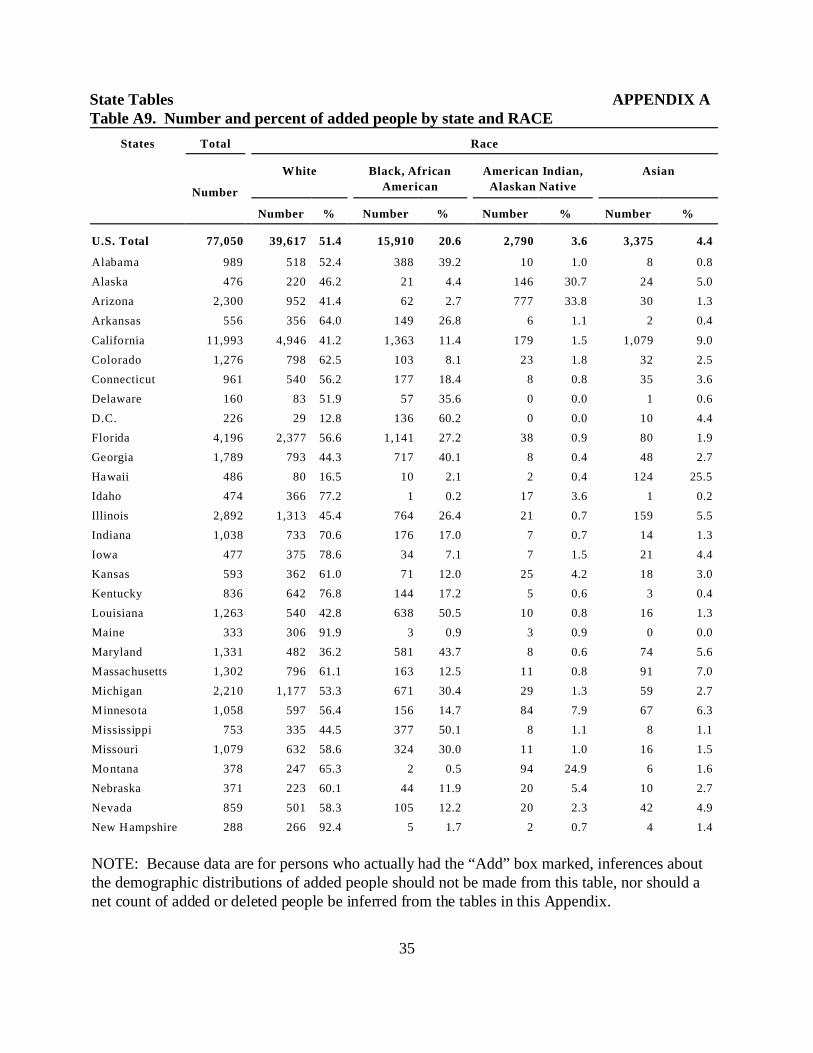
State Tables APPENDIX A Table A9. Number and percent of added people by state and RACE
States Total Race
White Black, African American Indian, Asian
Number American Alaskan Native
U.S. Total
Alabama
Alaska
Arizona
Arkansas
California
Colorado
Connecticut
Delaware
D.C.
Florida
Georgia
Hawaii
Idaho
Illinois
Indiana
Iowa
Kansas
Kentucky
Louisiana
Maine
Maryland
Massachusetts
Michigan
Minnesota
Mississippi
Missouri
Montana
Nebraska
Nevada
New Hampshire
Number % Number % Number % Number %
77,050 39,617 51.4 15,910 20.6 2,790 3.6 3,375 4.4
989 518 52.4 388 39.2 10 1.0 8 0.8
476 220 46.2 21 4.4 146 30.7 24 5.0
2,300 952 41.4 62 2.7 777 33.8 30 1.3
556 356 64.0 149 26.8 6 1.1 2 0.4
11,993 4,946 41.2 1,363 11.4 179 1.5 1,079 9.0
1,276 798 62.5 103 8.1 23 1.8 32 2.5
961 540 56.2 177 18.4 8 0.8 35 3.6
160 83 51.9 57 35.6 0 0.0 1 0.6
226 29 12.8 136 60.2 0 0.0 10 4.4
4,196 2,377 56.6 1,141 27.2 38 0.9 80 1.9
1,789 793 44.3 717 40.1 8 0.4 48 2.7
486 80 16.5 10 2.1 2 0.4 124 25.5
474 366 77.2 1 0.2 17 3.6 1 0.2
2,892 1,313 45.4 764 26.4 21 0.7 159 5.5
1,038 733 70.6 176 17.0 7 0.7 14 1.3
477 375 78.6 34 7.1 7 1.5 21 4.4
593 362 61.0 71 12.0 25 4.2 18 3.0
836 642 76.8 144 17.2 5 0.6 3 0.4
1,263 540 42.8 638 50.5 10 0.8 16 1.3
333 306 91.9 3 0.9 3 0.9 0 0.0
1,331 482 36.2 581 43.7 8 0.6 74 5.6
1,302 796 61.1 163 12.5 11 0.8 91 7.0
2,210 1,177 53.3 671 30.4 29 1.3 59 2.7
1,058 597 56.4 156 14.7 84 7.9 67 6.3
753 335 44.5 377 50.1 8 1.1 8 1.1
1,079 632 58.6 324 30.0 11 1.0 16 1.5
378 247 65.3 2 0.5 94 24.9 6 1.6
371 223 60.1 44 11.9 20 5.4 10 2.7
859 501 58.3 105 12.2 20 2.3 42 4.9
288 266 92.4 5 1.7 2 0.7 4 1.4
NOTE: Because data are for persons who actually had the “Add” box marked, inferences about the demographic distributions of added people should not be made from this table, nor should a net count of added or deleted people be inferred from the tables in this Appendix.
35

State Tables APPENDIX A
States Total Race
W hite Black, African American Indian, Asian
Number American Alaskan Native
Number % Number % Number % Number %
New Jersey 1,992 848 42.6 560 28.1 11 0.6 160 8.0
New Mexico 1,138 396 34.8 19 1.7 422 37.1 5 0.4
New York 5,870 2,308 39.3 1,794 30.6 38 0.6 457 7.8
North Carolina 1,955 907 46.4 728 37.2 29 1.5 31 1.6
North Dakota 187 110 58.8 1 0.5 61 32.6 0 0.0
Ohio 2,274 1,474 64.8 559 24.6 12 0.5 51 2.2
Oklahoma 911 532 58.4 112 12.3 113 12.4 15 1.6
Oregon 1,236 856 69.3 51 4.1 49 4.0 37 3.0
Pennsylvania 2,262 1,319 58.3 636 28.1 6 0.3 71 3.1
Rhode Island 242 152 62.8 24 9.9 2 0.8 5 2.1
South Carolina 1,017 433 42.6 483 47.5 10 1.0 10 1.0
South Dakota 264 100 37.9 1 0.4 149 56.4 3 1.1
Tennessee 1,452 922 63.5 413 28.4 9 0.6 16 1.1
Texas 6,849 3,685 53.8 1,053 15.4 46 0.7 159 2.3
Utah 935 665 71.1 14 1.5 62 6.6 9 1.0
Vermont 210 184 87.6 2 1.0 4 1.9 4 1.9
Virginia 1,680 801 47.7 552 32.9 4 0.2 100 6.0
Washington 2,167 1,328 61.3 115 5.3 126 5.8 125 5.8
West Virginia 325 293 90.2 16 4.9 1 0.3 2 0.6
W isconsin 925 540 58.4 192 20.8 42 4.5 33 3.6
W yoming 216 179 82.9 2 0.9 15 6.9 0 0.0
36

State Tables APPENDIX A Table A9. Number and percent of added people by state and RACE (Continued)
States Total Race
Native Hawaiian Some Other Two or more Missing
or O ther Pacific Race Number Islander
U.S. Total
Alabama
Alaska
Arizona
Arkansas
California
Colorado
Connecticut
Delaware
D.C.
Florida
Georgia
Hawaii
Idaho
Illinois
Indiana
Iowa
Kansas
Kentucky
Louisiana
Maine
Maryland
Massachusetts
Michigan
Minnesota
Mississippi
Missouri
Montana
Nebraska
Nevada
New Hampshire
Number % Number % Number % Number %
77,050 394 0.5 9,668 12.5 2,520 3.3 2,776 3.6
989 1 0.1 22 2.2 18 1.8 24 2.4
476 6 1.3 8 1.7 34 7.1 17 3.6
2,300 6 0.3 283 12.3 78 3.4 112 4.9
556 2 0.4 24 4.3 9 1.6 8 1.4
11,993 123 1.0 3,240 27.0 508 4.2 555 4.6
1,276 0 0.0 209 16.4 60 4.7 51 4.0
961 3 0.3 110 11.4 34 3.5 54 5.6
160 0 0.0 14 8.8 3 1.9 2 1.3
226 0 0.0 34 15.0 4 1.8 13 5.8
4,196 5 0.1 303 7.2 117 2.8 135 3.2
1,789 1 0.1 153 8.6 21 1.2 48 2.7
486 103 21.2 18 3.7 136 28.0 13 2.7
474 3 0.6 62 13.1 12 2.5 12 2.5
2,892 4 0.1 422 14.6 66 2.3 143 4.9
1,038 1 0.1 48 4.6 31 3.0 28 2.7
477 3 0.6 28 5.9 5 1.0 4 0.8
593 2 0.3 71 12.0 31 5.2 13 2.2
836 2 0.2 16 1.9 7 0.8 17 2.0
1,263 1 0.1 16 1.3 21 1.7 21 1.7
333 0 0.0 3 0.9 8 2.4 10 3.0
1,331 4 0.3 93 7.0 45 3.4 44 3.3
1,302 1 0.1 138 10.6 42 3.2 60 4.6
2,210 0 0.0 144 6.5 79 3.6 51 2.3
1,058 0 0.0 98 9.3 37 3.5 19 1.8
753 0 0.0 8 1.1 7 0.9 10 1.3
1,079 5 0.5 44 4.1 33 3.1 14 1.3
378 0 0.0 12 3.2 7 1.9 10 2.6
371 0 0.0 43 11.6 13 3.5 18 4.9
859 19 2.2 114 13.3 26 3.0 32 3.7
288 0 0.0 7 2.4 0 0.0 4 1.4
NOTE: Because data are for persons who actually had the “Add” box marked, inferences about the demographic distributions of added people should not be made from this table, nor should a net count of added or deleted people be inferred from the tables in this Appendix.
37

State Tables APPENDIX A
States Total Race
Native Hawaiian Some Other Two or more Missing
or O ther Pacific Race Number Islander
Number % Number % Number % Number %
New Jersey 1,992 1 0.1 243 12.2 55 2.8 114 5.7
New Mexico 1,138 0 0.0 243 21.4 28 2.5 25 2.2
New York 5,870 12 0.2 784 13.4 186 3.2 291 5.0
North Carolina 1,955 3 0.2 157 8.0 49 2.5 51 2.6
North Dakota 187 0 0.0 3 1.6 7 3.7 5 2.7
Ohio 2,274 3 0.1 69 3.0 60 2.6 46 2.0
Oklahoma 911 3 0.3 34 3.7 85 9.3 17 1.9
Oregon 1,236 1 0.1 123 10.0 77 6.2 42 3.4
Pennsylvania 2,262 4 0.2 108 4.8 48 2.1 70 3.1
Rhode Island 242 3 1.2 37 15.3 5 2.1 14 5.8
South Carolina 1,017 2 0.2 29 2.9 13 1.3 37 3.6
South Dakota 264 0 0.0 2 0.8 7 2.7 2 0.8
Tennessee 1,452 0 0.0 41 2.8 21 1.4 30 2.1
Texas 6,849 14 0.2 1,443 21.1 142 2.1 307 4.5
Utah 935 21 2.2 98 10.5 38 4.1 28 3.0
Vermont 210 0 0.0 6 2.9 5 2.4 5 2.4
Virginia 1,680 3 0.2 133 7.9 55 3.3 32 1.9
Washington 2,167 28 1.3 261 12.0 111 5.1 73 3.4
West Virginia 325 0 0.0 1 0.3 10 3.1 2 0.6
Wisconsin 925 1 0.1 54 5.8 24 2.6 39 4.2
Wyoming 216 0 0.0 14 6.5 2 0.9 4 1.9
38
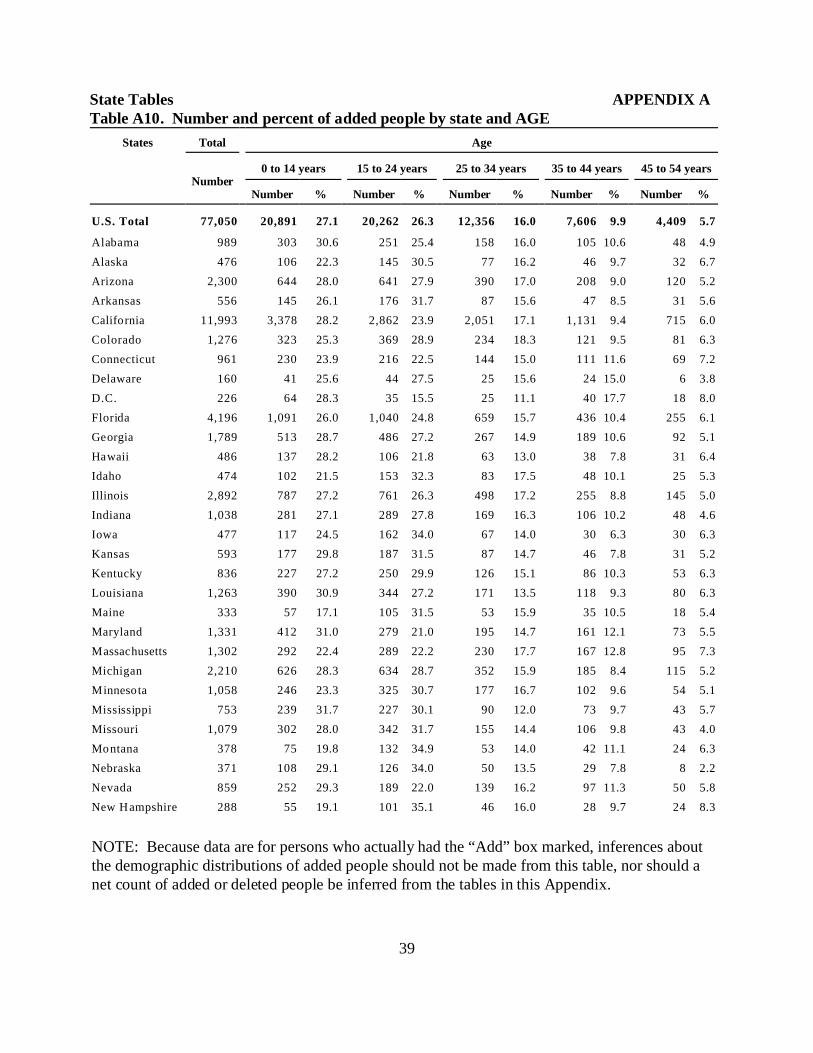
State Tables APPENDIX A Table A10. Number and percent of added people by state and AGE
States Total Age
0 to 14 years 15 to 24 years 25 to 34 years 35 to 44 years 45 to 54 yearsNumber
Number % Number % Number % Number % Number %
U.S. Total 77,050 20,891 27.1 20,262 26.3 12,356 16.0 7,606 9.9 4,409 5.7
Alabama 989 303 30.6 251 25.4 158 16.0 105 10.6 48 4.9
Alaska 476 106 22.3 145 30.5 77 16.2 46 9.7 32 6.7
Arizona 2,300 644 28.0 641 27.9 390 17.0 208 9.0 120 5.2
Arkansas 556 145 26.1 176 31.7 87 15.6 47 8.5 31 5.6
Califo rnia 11,993 3,378 28.2 2,862 23.9 2,051 17.1 1,131 9.4 715 6.0
Colorado 1,276 323 25.3 369 28.9 234 18.3 121 9.5 81 6.3
Connecticut 961 230 23.9 216 22.5 144 15.0 111 11.6 69 7.2
Delaware 160 41 25.6 44 27.5 25 15.6 24 15.0 6 3.8
D.C. 226 64 28.3 35 15.5 25 11.1 40 17.7 18 8.0
Florida 4,196 1,091 26.0 1,040 24.8 659 15.7 436 10.4 255 6.1
Ge orgia 1,789 513 28.7 486 27.2 267 14.9 189 10.6 92 5.1
Ha waii 486 137 28.2 106 21.8 63 13.0 38 7.8 31 6.4
Idaho 474 102 21.5 153 32.3 83 17.5 48 10.1 25 5.3
Illinois 2,892 787 27.2 761 26.3 498 17.2 255 8.8 145 5.0
Indiana 1,038 281 27.1 289 27.8 169 16.3 106 10.2 48 4.6
Iowa 477 117 24.5 162 34.0 67 14.0 30 6.3 30 6.3
Kansas 593 177 29.8 187 31.5 87 14.7 46 7.8 31 5.2
Kentucky 836 227 27.2 250 29.9 126 15.1 86 10.3 53 6.3
Louisiana 1,263 390 30.9 344 27.2 171 13.5 118 9.3 80 6.3
Maine 333 57 17.1 105 31.5 53 15.9 35 10.5 18 5.4
Maryland 1,331 412 31.0 279 21.0 195 14.7 161 12.1 73 5.5
M assachusetts 1,302 292 22.4 289 22.2 230 17.7 167 12.8 95 7.3
Michigan 2,210 626 28.3 634 28.7 352 15.9 185 8.4 115 5.2
M inneso ta 1,058 246 23.3 325 30.7 177 16.7 102 9.6 54 5.1
Mississippi 753 239 31.7 227 30.1 90 12.0 73 9.7 43 5.7
Missouri 1,079 302 28.0 342 31.7 155 14.4 106 9.8 43 4.0
Mo ntana 378 75 19.8 132 34.9 53 14.0 42 11.1 24 6.3
Nebraska 371 108 29.1 126 34.0 50 13.5 29 7.8 8 2.2
Nevada 859 252 29.3 189 22.0 139 16.2 97 11.3 50 5.8
New H ampshire 288 55 19.1 101 35.1 46 16.0 28 9.7 24 8.3
NOTE: Because data are for persons who actually had the “Add” box marked, inferences about the demographic distributions of added people should not be made from this table, nor should a net count of added or deleted people be inferred from the tables in this Appendix.
39

State Tables APPENDIX A
States Total Age
0 to 14 years 15 to 24 years 25 to 34 years 35 to 44 years 45 to 54 yearsNumber
New Jersey
New Mexico
New York
North Carolina
North Dakota
Ohio
Oklahoma
Oregon
Pennsylvania
Rhode Island
South Carolina
South Dakota
Tennessee
Texas
Utah
Vermont
Virginia
Washington
West Virginia
Wisconsin
Wyoming
Number % Number % Number % Number % Number %
1,992 518 26.0 435 21.8 303 15.2 193 9.7 152 7.6
1,138 327 28.7 324 28.5 168 14.8 106 9.3 65 5.7
5,870 1,511 25.7 1,149 19.6 957 16.3 650 11.1 390 6.6
1,955 524 26.8 491 25.1 343 17.5 190 9.7 120 6.1
187 37 19.8 67 35.8 32 17.1 19 10.2 4 2.1
2,274 618 27.2 653 28.7 371 16.3 208 9.1 126 5.5
911 282 31.0 281 30.8 126 13.8 87 9.6 37 4.1
1,236 279 22.6 384 31.1 192 15.5 119 9.6 65 5.3
2,262 651 28.8 611 27.0 336 14.9 250 11.1 125 5.5
242 63 26.0 53 21.9 41 16.9 27 11.2 12 5.0
1,017 296 29.1 269 26.5 159 15.6 106 10.4 61 6.0
264 59 22.3 68 25.8 36 13.6 40 15.2 20 7.6
1,452 416 28.7 419 28.9 223 15.4 166 11.4 62 4.3
6,849 1,928 28.2 1,886 27.5 1,086 15.9 618 9.0 352 5.1
935 236 25.2 322 34.4 147 15.7 72 7.7 53 5.7
210 47 22.4 66 31.4 32 15.2 21 10.0 15 7.1
1,680 474 28.2 434 25.8 302 18.0 178 10.6 91 5.4
2,167 494 22.8 665 30.7 348 16.1 204 9.4 116 5.4
325 80 24.6 98 30.2 63 19.4 30 9.2 20 6.2
925 282 30.5 257 27.8 130 14.1 95 10.3 56 6.1
216 49 22.7 64 29.6 40 18.5 17 7.9 10 4.6
40

State Tables APPENDIX A Table A10. Number and percent of added people by state and AGE (Continued)
States Total Age
55 to 64 years 65 to 74 years 75 to 84 years 85 years and Missing
Number over
Number % Number % Number % Number % Number %
U.S. Total 77,050 2,548 3.3 1,675 2.2 869 1.1 395 0.5 6,039 7.8
Alabama 989 24 2.4 12 1.2 11 1.1 7 0.7 70 7.1
Alaska 476 30 6.3 10 2.1 3 0.6 1 0.2 26 5.5
Arizona 2,300 72 3.1 40 1.7 21 0.9 11 0.5 153 6.7
Arkansas 556 13 2.3 8 1.4 5 0.9 3 0.5 41 7.4
Califo rnia 11,993 416 3.5 297 2.5 152 1.3 50 0.4 941 7.8
Colorado 1,276 28 2.2 12 0.9 8 0.6 2 0.2 98 7.7
Connecticut 961 56 5.8 31 3.2 12 1.2 8 0.8 84 8.7
Delaware 160 7 4.4 4 2.5 2 1.3 0 0.0 7 4.4
D.C. 226 2 0.9 5 2.2 2 0.9 0 0.0 35 15.5
Florida 4,196 157 3.7 90 2.1 58 1.4 30 0.7 380 9.1
Ge orgia 1,789 48 2.7 17 1.0 15 0.8 10 0.6 152 8.5
Ha waii 486 25 5.1 17 3.5 8 1.6 3 0.6 58 11.9
Idaho 474 8 1.7 9 1.9 2 0.4 3 0.6 41 8.7
Illinois 2,892 101 3.5 64 2.2 37 1.3 16 0.6 228 7.9
Indiana 1,038 25 2.4 31 3.0 8 0.8 7 0.7 74 7.1
Iowa 477 13 2.7 16 3.4 7 1.5 1 0.2 34 7.1
Kansas 593 14 2.4 7 1.2 4 0.7 2 0.3 38 6.4
Kentucky 836 20 2.4 13 1.6 8 1.0 2 0.2 51 6.1
Louisiana 1,263 41 3.2 20 1.6 7 0.6 10 0.8 82 6.5
Maine 333 9 2.7 22 6.6 6 1.8 3 0.9 25 7.5
Maryland 1,331 54 4.1 25 1.9 12 0.9 8 0.6 112 8.4
M assachusetts 1,302 56 4.3 36 2.8 25 1.9 8 0.6 104 8.0
Michigan 2,210 61 2.8 66 3.0 28 1.3 6 0.3 137 6.2
M inneso ta 1,058 29 2.7 9 0.9 11 1.0 2 0.2 103 9.7
Mississippi 753 14 1.9 12 1.6 8 1.1 3 0.4 44 5.8
Missouri 1,079 20 1.9 9 0.8 7 0.6 3 0.3 92 8.5
Mo ntana 378 11 2.9 9 2.4 3 0.8 2 0.5 27 7.1
Nebraska 371 9 2.4 2 0.5 1 0.3 2 0.5 36 9.7
Nevada 859 31 3.6 18 2.1 8 0.9 6 0.7 69 8.0
New H ampshire 288 9 3.1 9 3.1 3 1.0 0 0.0 13 4.5
NOTE: Because data are for persons who actually had the “Add” box marked, inferences about the demographic distributions of added people should not be made from this table, nor should a net count of added or deleted people be inferred from the tables in this Appendix.
41

State Tables APPENDIX A
States Total Age
55 to 64 years 65 to 74 years 75 to 84 years 85 years and Missing
Number over
Number % Number % Number % Number % Number %
New Jersey 1,992 90 4.5 53 2.7 37 1.9 14 0.7 197 9.9
New Mexico 1,138 41 3.6 16 1.4 12 1.1 11 1.0 68 6.0
New York 5,870 275 4.7 216 3.7 105 1.8 44 0.8 573 9.8
North Carolina 1,955 48 2.5 29 1.5 19 1.0 10 0.5 181 9.3
North Dakota 187 5 2.7 3 1.6 5 2.7 1 0.5 14 7.5
Ohio 2,274 67 2.9 57 2.5 25 1.1 7 0.3 142 6.2
Oklahoma 911 24 2.6 11 1.2 4 0.4 6 0.7 53 5.8
Oregon 1,236 47 3.8 26 2.1 12 1.0 9 0.7 103 8.3
Pennsylvania 2,262 73 3.2 43 1.9 21 0.9 12 0.5 140 6.2
Rhode Island 242 11 4.5 7 2.9 1 0.4 0 0.0 27 11.2
South Carolina 1,017 35 3.4 18 1.8 5 0.5 4 0.4 64 6.3
South Dakota 264 11 4.2 8 3.0 1 0.4 0 0.0 21 8.0
Tennessee 1,452 43 3.0 19 1.3 10 0.7 5 0.3 89 6.1
Texas 6,849 208 3.0 131 1.9 60 0.9 33 0.5 547 8.0
Utah 935 20 2.1 17 1.8 2 0.2 6 0.6 60 6.4
Vermont 210 11 5.2 5 2.4 5 2.4 1 0.5 7 3.3
Virginia 1,680 52 3.1 20 1.2 19 1.1 5 0.3 105 6.3
Washington 2,167 55 2.5 40 1.8 28 1.3 8 0.4 209 9.6
West Virginia 325 4 1.2 13 4.0 3 0.9 1 0.3 13 4.0
Wisconsin 925 17 1.8 15 1.6 12 1.3 6 0.6 55 5.9
Wyoming 216 8 3.7 8 3.7 1 0.5 3 1.4 16 7.4
42

State Tables APPENDIX A Table A11. Number and percent of added people by state and SEX
States Total Sex
Male Female Missing Number
Number % Number % Number %
U.S. Total
Alabama
Alaska
Arizona
Arkansas
California
Colorado
Connecticut
Delaware
D.C.
Florida
Georgia
Hawaii
Idaho
Illinois
Indiana
Iowa
Kansas
Kentucky
Louisiana
Maine
Maryland
Massachusetts
Michigan
Minnesota
Mississippi
Missouri
Montana
Nebraska
Nevada
New Hampshire
77,050 42,928 55.7 33,023 42.9 1,099 1.4
989 536 54.2 435 44.0 18 1.8
476 294 61.8 178 37.4 4 0.8
2,300 1,312 57.0 961 41.8 27 1.2
556 313 56.3 230 41.4 13 2.3
11,993 6,601 55.0 5,243 43.7 149 1.2
1,276 762 59.7 499 39.1 15 1.2
961 511 53.2 427 44.4 23 2.4
160 83 51.9 73 45.6 4 2.5
226 131 58.0 85 37.6 10 4.4
4,196 2,321 55.3 1,793 42.7 82 2.0
1,789 1,018 56.9 751 42.0 20 1.1
486 251 51.6 232 47.7 3 0.6
474 285 60.1 183 38.6 6 1.3
2,892 1,605 55.5 1,250 43.2 37 1.3
1,038 589 56.7 430 41.4 19 1.8
477 292 61.2 178 37.3 7 1.5
593 351 59.2 231 39.0 11 1.9
836 457 54.7 364 43.5 15 1.8
1,263 702 55.6 542 42.9 19 1.5
333 179 53.8 147 44.1 7 2.1
1,331 702 52.7 614 46.1 15 1.1
1,302 691 53.1 593 45.5 18 1.4
2,210 1,200 54.3 984 44.5 26 1.2
1,058 628 59.4 421 39.8 9 0.9
753 439 58.3 303 40.2 11 1.5
1,079 608 56.3 458 42.4 13 1.2
378 220 58.2 155 41.0 3 0.8
371 208 56.1 162 43.7 1 0.3
859 467 54.4 385 44.8 7 0.8
288 164 56.9 120 41.7 4 1.4
NOTE: Because data are for persons who actually had the “Add” box marked, inferences about the demographic distributions of added people should not be made from this table, nor should a net count of added or deleted people be inferred from the tables in this Appendix.
43

State Tables APPENDIX A
States Total Sex
M ale Fem ale M issing Number
Number % Number % Number %
New Jersey 1,992 1,052 52.8 901 45.2 39 2.0
New M exico 1,138 667 58.6 445 39.1 26 2.3
New Y ork 5,870 3,124 53.2 2,636 44.9 110 1.9
North Carolina 1,955 1,108 56.7 820 41.9 27 1.4
No rth Dakota 187 113 60.4 68 36.4 6 3.2
Ohio 2,274 1,294 56.9 940 41.3 40 1.8
Oklahoma 911 523 57.4 384 42.2 4 0.4
Oregon 1,236 701 56.7 525 42.5 10 0.8
Pen nsylvania 2,262 1,287 56.9 941 41.6 34 1.5
Rhode Island 242 150 62.0 90 37.2 2 0.8
South Carolina 1,017 551 54.2 437 43.0 29 2.9
Sou th Da kota 264 135 51.1 125 47.3 4 1.5
Tennessee 1,452 840 57.9 599 41.3 13 0.9
Texas 6,849 3,773 55.1 2,971 43.4 105 1.5
Utah 935 549 58.7 383 41.0 3 0.3
Vermo nt 210 108 51.4 100 47.6 2 1.0
Virg inia 1,680 937 55.8 728 43.3 15 0.9
Washington 2,167 1,266 58.4 879 40.6 22 1.0
W est Virginia 325 194 59.7 129 39.7 2 0.6
W isconsin 925 507 54.8 408 44.1 10 1.1
W yoming 216 129 59.7 87 40.3 0 0.0
44

State Tables APPENDIX A Table A12. Number and percent of added people by state and HISPANIC ORIGIN
States Total Hispanic origin
Non-Hispanic
Number %
Hispanic Missing
Number % Number %
U.S. Total
Alabama
Alaska
Arizona
Arkansas
California
Colorado
Connecticut
Delaware
D.C.
Florida
Georgia
Hawaii
Idaho
Illinois
Indiana
Iowa
Kansas
Kentucky
Louisiana
Maine
Maryland
Massachusetts
Michigan
Minnesota
Mississippi
Missouri
Montana
Nebraska
Nevada
New Hampshire
Number
77,050
989
476
2,300
556
11,993
1,276
961
160
226
4,196
1,789
486
474
2,892
1,038
477
593
836
1,263
333
1,331
1,302
2,210
1,058
753
1,079
378
371
859
288
56,178 72.9 19,076 24.8 1,796 2.3
915 92.5 46 4.7 28 2.8
432 90.8 30 6.3 14 2.9
1,532 66.6 721 31.3 47 2.0
497 89.4 45 8.1 14 2.5
6,160 51.4 5,586 46.6 247 2.1
814 63.8 431 33.8 31 2.4
671 69.8 255 26.5 35 3.6
131 81.9 26 16.3 3 1.9
167 73.9 51 22.6 8 3.5
3,065 73.0 1,014 24.2 117 2.8
1,473 82.3 274 15.3 42 2.3
411 84.6 63 13.0 12 2.5
361 76.2 105 22.2 8 1.7
1,964 67.9 840 29.0 88 3.0
915 88.2 96 9.2 27 2.6
425 89.1 50 10.5 2 0.4
453 76.4 126 21.2 14 2.4
781 93.4 37 4.4 18 2.2
1,197 94.8 37 2.9 29 2.3
319 95.8 3 0.9 11 3.3
1,135 85.3 156 11.7 40 3.0
1,051 80.7 211 16.2 40 3.1
1,956 88.5 207 9.4 47 2.1
911 86.1 126 11.9 21 2.0
739 98.1 5 0.7 9 1.2
1,009 93.5 53 4.9 17 1.6
357 94.4 15 4.0 6 1.6
269 72.5 89 24.0 13 3.5
534 62.2 303 35.3 22 2.6
272 94.4 10 3.5 6 2.1
NOTE: Because data are for persons who actually had the “Add” box marked, inferences about the demographic distributions of added people should not be made from this table, nor should a net count of added or deleted people be inferred from the tables in this Appendix.
45

State Tables APPENDIX A
States Total Hisp anic orig in
No n-H ispan ic
Number %
Hispanic Missing
Number % Number %Number
New Jersey 1,992
New Mexico 1,138
New York 5,870
North Carolina 1,955
North Dakota 187
Ohio 2,274
Oklahoma 911
Oregon 1,236
Pennsylvania 2,262
Rhode Island 242
South Carolina 1,017
South Dakota 264
Tennessee 1,452
Texas 6,849
Utah 935
Vermont 210
Virginia 1,680
Washington 2,167
West Virginia 325
Wisconsin 925
Wyoming 216
1,410 70.8 529 26.6 53 2.7
647 56.9 469 41.2 22 1.9
4,231 72.1 1,471 25.1 168 2.9
1,600 81.8 297 15.2 58 3.0
169 90.4 13 7.0 5 2.7
2,130 93.7 109 4.8 35 1.5
805 88.4 90 9.9 16 1.8
981 79.4 238 19.3 17 1.4
2,016 89.1 186 8.2 60 2.7
162 66.9 76 31.4 4 1.7
912 89.7 78 7.7 27 2.7
250 94.7 11 4.2 3 1.1
1,337 92.1 84 5.8 31 2.1
3,251 47.5 3,469 50.7 129 1.9
707 75.6 212 22.7 16 1.7
203 96.7 4 1.9 3 1.4
1,435 85.4 219 13.0 26 1.5
1,720 79.4 374 17.3 73 3.4
318 97.8 2 0.6 5 1.5
797 86.2 101 10.9 27 2.9
181 83.8 33 15.3 2 0.9
46

State Tables APPENDIX A Table A13. Number and percent of added people by state and TENURE
States Total Tenure
U.S. Total
Alabama
Alaska
Arizona
Arkansas
California
Colorado
Connecticut
Delaware
D.C.
Florida
Georgia
Hawaii
Idaho
Illinois
Indiana
Iowa
Kansas
Kentucky
Louisiana
Maine
Maryland
Massachusetts
Michigan
Minnesota
Mississippi
Missouri
Montana
Nebraska
Nevada
New Hampshire
Number Owner Renter Missing
Number % Number % Number %
77,050 36,249 47.0 38,085 49.4 2,716 3.5
989 519 52.5 420 42.5 50 5.1
476 283 59.5 188 39.5 5 1.1
2,300 1,296 56.3 925 40.2 79 3.4
556 282 50.7 257 46.2 17 3.1
11,993 4,667 38.9 6,995 58.3 331 2.8
1,276 589 46.2 643 50.4 44 3.4
961 388 40.4 544 56.6 29 3.0
160 74 46.3 73 45.6 13 8.1
226 68 30.1 146 64.6 12 5.3
4,196 2,081 49.6 1,955 46.6 160 3.8
1,789 803 44.9 887 49.6 99 5.5
486 215 44.2 260 53.5 11 2.3
474 260 54.9 202 42.6 12 2.5
2,892 1,325 45.8 1,472 50.9 95 3.3
1,038 578 55.7 421 40.6 39 3.8
477 262 54.9 198 41.5 17 3.6
593 301 50.8 275 46.4 17 2.9
836 431 51.6 370 44.3 35 4.2
1,263 675 53.4 536 42.4 52 4.1
333 217 65.2 96 28.8 20 6.0
1,331 696 52.3 580 43.6 55 4.1
1,302 599 46.0 656 50.4 47 3.6
2,210 1,146 51.9 984 44.5 80 3.6
1,058 554 52.4 478 45.2 26 2.5
753 430 57.1 291 38.6 32 4.3
1,079 527 48.8 524 48.6 28 2.6
378 215 56.9 147 38.9 16 4.2
371 159 42.9 203 54.7 9 2.4
859 337 39.2 495 57.6 27 3.1
288 170 59.0 108 37.5 10 3.5
NOTE: Because data are for persons who actually had the “Add” box marked, inferences about the demographic distributions of added people should not be made from this table, nor should a net count of added or deleted people be inferred from the tables in this Appendix.
47

State Tables APPENDIX A
States Total Tenure
Number Owner Renter Missing
Number % Number % Number %
New Jersey 1,992 867 43.5 1,060 53.2 65 3.3
New M exico 1,138 689 60.5 408 35.9 41 3.6
New Y ork 5,870 2,176 37.1 3,420 58.3 274 4.7
North Carolina 1,955 838 42.9 1,037 53.0 80 4.1
No rth Dakota 187 96 51.3 87 46.5 4 2.1
Ohio 2,274 1,117 49.1 1,082 47.6 75 3.3
Oklahoma 911 439 48.2 444 48.7 28 3.1
Oregon 1,236 547 44.3 640 51.8 49 4.0
Pen nsylvania 2,262 1,158 51.2 1,015 44.9 89 3.9
Rhode Island 242 104 43.0 128 52.9 10 4.1
South Carolina 1,017 592 58.2 376 37.0 49 4.8
Sou th Da kota 264 102 38.6 155 58.7 7 2.7
Tennessee 1,452 709 48.8 686 47.2 57 3.9
Texas 6,849 3,413 49.8 3,198 46.7 238 3.5
Utah 935 559 59.8 359 38.4 17 1.8
Vermo nt 210 118 56.2 83 39.5 9 4.3
Virg inia 1,680 814 48.5 835 49.7 31 1.8
Washington 2,167 1,046 48.3 1,059 48.9 62 2.9
W est Virginia 325 187 57.5 126 38.8 12 3.7
W isconsin 925 397 42.9 484 52.3 44 4.8
W yoming 216 134 62.0 74 34.3 8 3.7
48

State Tables APPENDIX A Table A14. Number and percent of deleted people by state and RACE
States Total Race
White Black, African American Indian, Asian
Number American Alaskan Native
U.S. Total
Alabama
Alaska
Arizona
Arkansas
California
Colorado
Connecticut
Delaware
D.C.
Florida
Georgia
Hawaii
Idaho
Illinois
Indiana
Iowa
Kansas
Kentucky
Louisiana
Maine
Maryland
Massachusetts
Michigan
Minnesota
Mississippi
Missouri
Montana
Nebraska
Nevada
New Hampshire
Number % Number % Number % Number %
83,160 51,199 61.6 14,827 17.8 1,845 2.2 4,030 4.8
1,029 539 52.4 401 39.0 3 0.3 8 0.8
506 234 46.2 25 4.9 150 29.6 16 3.2
1,482 625 42.2 66 4.5 514 34.7 21 1.4
522 342 65.5 133 25.5 4 0.8 3 0.6
7,962 3,814 47.9 877 11.0 76 1.0 1,089 13.7
1,060 670 63.2 111 10.5 24 2.3 27 2.5
1,538 1,066 69.3 208 13.5 4 0.3 50 3.3
225 120 53.3 76 33.8 1 0.4 6 2.7
241 41 17.0 175 72.6 0 0.0 7 2.9
3,760 2,241 59.6 918 24.4 17 0.5 108 2.9
1,849 948 51.3 626 33.9 5 0.3 69 3.7
491 151 30.8 24 4.9 2 0.4 117 23.8
335 270 80.6 5 1.5 11 3.3 1 0.3
3,210 1,889 58.8 637 19.8 4 0.1 256 8.0
1,454 1,107 76.1 164 11.3 0 0.0 20 1.4
514 411 80.0 23 4.5 9 1.8 15 2.9
694 518 74.6 69 9.9 7 1.0 19 2.7
1,083 838 77.4 150 13.9 1 0.1 14 1.3
1,454 659 45.3 631 43.4 8 0.6 31 2.1
771 716 92.9 5 0.6 13 1.7 2 0.3
1,817 864 47.6 629 34.6 1 0.1 132 7.3
2,909 2,227 76.6 213 7.3 3 0.1 103 3.5
2,150 1,466 68.2 322 15.0 23 1.1 80 3.7
1,027 790 76.9 61 5.9 26 2.5 49 4.8
1,013 445 43.9 492 48.6 8 0.8 8 0.8
1,172 785 67.0 248 21.2 6 0.5 25 2.1
399 261 65.4 5 1.3 87 21.8 3 0.8
514 426 82.9 27 5.3 11 2.1 3 0.6
388 235 60.6 56 14.4 19 4.9 21 5.4
692 625 90.3 5 0.7 3 0.4 11 1.6
NOTE: Because data are for persons who actually had the “Cancel” box marked, inferences about the demographic distributions of deleted people should not be made from this table, nor should a net count of added or deleted people be inferred from the tables in this Appendix.
49

State Tables APPENDIX A
States Total Race
White Black, African American Indian, Asian
Number American Alaskan Native
New Jersey
New Mexico
New York
North Carolina
North Dakota
Ohio
Oklahoma
Oregon
Pennsylvania
Rhode Island
South Carolina
South Dakota
Tennessee
Texas
Utah
Vermont
Virginia
Washington
West Virginia
Wisconsin
Wyoming
Number % Number % Number % Number %
3,448 2,150 62.4 560 16.2 5 0.1 293 8.5
767 227 29.6 18 2.3 355 46.3 10 1.3
7,463 4,359 58.4 1,540 20.6 35 0.5 512 6.9
3,238 1,973 60.9 892 27.5 24 0.7 48 1.5
290 231 79.7 4 1.4 39 13.4 2 0.7
2,726 1,917 70.3 486 17.8 5 0.2 69 2.5
945 578 61.2 124 13.1 57 6.0 34 3.6
764 572 74.9 14 1.8 19 2.5 35 4.6
4,713 3,563 75.6 613 13.0 3 0.1 128 2.7
358 250 69.8 36 10.1 1 0.3 10 2.8
1,422 720 50.6 575 40.4 5 0.4 13 0.9
271 184 67.9 3 1.1 63 23.2 4 1.5
1,437 895 62.3 401 27.9 8 0.6 21 1.5
5,178 2,994 57.8 1,037 20.0 30 0.6 212 4.1
542 396 73.1 12 2.2 39 7.2 9 1.7
451 405 89.8 3 0.7 1 0.2 5 1.1
3,093 1,695 54.8 880 28.5 8 0.3 144 4.7
1,813 1,207 66.6 106 5.8 56 3.1 128 7.1
457 395 86.4 32 7.0 2 0.4 2 0.4
1,195 887 74.2 107 9.0 37 3.1 34 2.8
328 278 84.8 2 0.6 13 4.0 3 0.9
50

State Tables APPENDIX A Table A14. Number and percent of deleted people by state and RACE (Continued)
States Total Race
Native Hawaiian or Some Other Race Two or More Other Pacific
Number Islander
Missing
U.S. Total
Alabama
Alaska
Arizona
Arkansas
California
Colorado
Connecticut
Delaware
D.C.
Florida
Georgia
Hawaii
Idaho
Illinois
Indiana
Iowa
Kansas
Kentucky
Louisiana
Maine
Maryland
Massachusetts
Michigan
Minnesota
Mississippi
Missouri
Montana
Nebraska
Nevada
New Hampshire
Number % Number % Number % Number %
83,160 206 0.2 3,973 4.8 1,737 2.1 5,343 6.4
1,029 3 0.3 8 0.8 14 1.4 53 5.2
506 0 0.0 6 1.2 39 7.7 36 7.1
1,482 2 0.1 92 6.2 36 2.4 126 8.5
522 0 0.0 2 0.4 11 2.1 27 5.2
7,962 59 0.7 1,091 13.7 304 3.8 652 8.2
1,060 3 0.3 99 9.3 30 2.8 96 9.1
1,538 2 0.1 50 3.3 33 2.1 125 8.1
225 0 0.0 4 1.8 3 1.3 15 6.7
241 0 0.0 7 2.9 2 0.8 9 3.7
3,760 4 0.1 150 4.0 62 1.6 260 6.9
1,849 2 0.1 47 2.5 29 1.6 123 6.7
491 46 9.4 15 3.1 111 22.6 25 5.1
335 0 0.0 19 5.7 8 2.4 21 6.3
3,210 5 0.2 153 4.8 54 1.7 212 6.6
1,454 1 0.1 40 2.8 22 1.5 100 6.9
514 1 0.2 14 2.7 8 1.6 33 6.4
694 1 0.1 15 2.2 12 1.7 53 7.6
1,083 3 0.3 8 0.7 7 0.6 62 5.7
1,454 2 0.1 14 1.0 20 1.4 89 6.1
771 0 0.0 1 0.1 10 1.3 24 3.1
1,817 2 0.1 59 3.2 35 1.9 95 5.2
2,909 2 0.1 101 3.5 44 1.5 216 7.4
2,150 3 0.1 55 2.6 50 2.3 151 7.0
1,027 3 0.3 17 1.7 18 1.8 63 6.1
1,013 0 0.0 6 0.6 8 0.8 46 4.5
1,172 2 0.2 16 1.4 22 1.9 68 5.8
399 1 0.3 3 0.8 7 1.8 32 8.0
514 0 0.0 15 2.9 7 1.4 25 4.9
388 1 0.3 20 5.2 8 2.1 28 7.2
692 2 0.3 2 0.3 6 0.9 38 5.5
NOTE: Because data are for persons who actually had the “Cancel” box marked, inferences about the demographic distributions of deleted people should not be made from this table, nor should a net count of added or deleted people be inferred from the tables in this Appendix.
51

State Tables APPENDIX A
States Total Race
Native Hawaiian or Some Other Race Two or More Missing Other Pacific
Number Islander
Number % Number % Number % Number %
New Jersey 3,448 2 0.1 197 5.7 52 1.5 189 5.5
New M exico 767 0 0.0 89 11.6 24 3.1 44 5.7
New Y ork 7,463 9 0.1 464 6.2 132 1.8 412 5.5
North Carolina 3,238 4 0.1 122 3.8 46 1.4 129 4.0
No rth Dakota 290 0 0.0 2 0.7 1 0.3 11 3.8
Ohio 2,726 8 0.3 42 1.5 41 1.5 158 5.8
Oklahoma 945 1 0.1 23 2.4 53 5.6 75 7.9
Oregon 764 5 0.7 48 6.3 24 3.1 47 6.2
Pen nsylvania 4,713 0 0.0 93 2.0 63 1.3 250 5.3
Rhode Island 358 1 0.3 29 8.1 5 1.4 26 7.3
South Carolina 1,422 0 0.0 13 0.9 13 0.9 83 5.8
Sou th Da kota 271 0 0.0 0 0.0 5 1.8 12 4.4
Tennessee 1,437 0 0.0 19 1.3 21 1.5 72 5.0
Texas 5,178 5 0.1 472 9.1 66 1.3 362 7.0
Utah 542 4 0.7 27 5.0 9 1.7 46 8.5
Vermo nt 451 0 0.0 3 0.7 6 1.3 28 6.2
Virg inia 3093 4 0.1 106 3.4 63 2.0 193 6.2
Washington 1813 12 0.7 74 4.1 67 3.7 163 9.0
W est Virginia 457 0 0.0 1 0.2 6 1.3 19 4.2
W isconsin 1195 1 0.1 16 1.3 17 1.4 96 8.0
W yoming 328 0 0.0 4 1.2 3 0.9 25 7.6
52

State Tables APPENDIX A Table A15. Number and percent of deleted people by state and AGE
States Total Age
0 to 14 years 15 to 24 years 25 to 34 years 35 to 44 years 45 to 54 yearsNumber
Number % Number % Number % Number % Number %
U.S. Total 83,160 3,562 4.3 49,727 59.8 8,488 10.2 4,368 5.3 1,986 2.4
Alabama 1,029 36 3.5 624 60.6 96 9.3 71 6.9 21 2.0
Alaska 506 56 11.1 272 53.8 54 10.7 33 6.5 20 4.0
Arizona 1,482 92 6.2 721 48.7 204 13.8 103 7.0 47 3.2
Arkansas 522 36 6.9 312 59.8 42 8.0 36 6.9 15 2.9
California 7,962 493 6.2 3,829 48.1 1,214 15.2 629 7.9 259 3.3
Colorado 1,060 54 5.1 526 49.6 177 16.7 85 8.0 30 2.8
Connecticut 1,538 36 2.3 1,121 72.9 81 5.3 31 2.0 17 1.1
Delaware 225 5 2.2 151 67.1 15 6.7 12 5.3 6 2.7
D.C. 241 8 3.3 129 53.5 29 12.0 16 6.6 8 3.3
Florida 3,760 176 4.7 1,859 49.4 470 12.5 275 7.3 114 3.0
Georgia 1,849 71 3.8 995 53.8 235 12.7 107 5.8 50 2.7
Hawaii 491 24 4.9 210 42.8 96 19.6 51 10.4 16 3.3
Idaho 335 18 5.4 181 54.0 33 9.9 21 6.3 8 2.4
Illinois 3,210 108 3.4 2,169 67.6 245 7.6 102 3.2 48 1.5
Indiana 1,454 48 3.3 925 63.6 93 6.4 62 4.3 27 1.9
Iowa 514 20 3.9 306 59.5 41 8.0 24 4.7 16 3.1
Kansas 694 31 4.5 401 57.8 64 9.2 37 5.3 16 2.3
Kentucky 1,083 43 4.0 651 60.1 94 8.7 51 4.7 31 2.9
Louisiana 1,454 44 3.0 878 60.4 191 13.1 90 6.2 33 2.3
Maine 771 32 4.2 565 73.3 39 5.1 35 4.5 7 0.9
Maryland 1,817 68 3.7 1,136 62.5 182 10.0 98 5.4 46 2.5
Massachusetts 2,909 83 2.9 2,058 70.7 161 5.5 72 2.5 39 1.3
Michigan 2,150 114 5.3 1,300 60.5 160 7.4 66 3.1 50 2.3
Minnesota 1,027 64 6.2 635 61.8 57 5.6 40 3.9 21 2.0
Mississippi 1,013 42 4.1 663 65.4 74 7.3 50 4.9 21 2.1
Missouri 1,172 52 4.4 690 58.9 98 8.4 49 4.2 34 2.9
Montana 399 29 7.3 231 57.9 35 8.8 28 7.0 10 2.5
Nebraska 514 25 4.9 327 63.6 37 7.2 13 2.5 8 1.6
Nevada 388 18 4.6 177 45.6 50 12.9 43 11.1 16 4.1
New Hampshire 692 21 3.0 531 76.7 26 3.8 14 2.0 13 1.9
NOTE: Because data are for persons who actually had the “Cancel” box marked, inferences about the demographic distributions of deleted people should not be made from this table, nor should a net count of added or deleted people be inferred from the tables in this Appendix.
53

State Tables APPENDIX A
States Total Age
0 to 14 years 15 to 24 years 25 to 34 years 35 to 44 years 45 to 54 yearsNumber
New Jersey
New Mexico
New York
North Carolina
North Dakota
Ohio
Oklahoma
Oregon
Pennsylvania
Rhode Island
South Carolina
South Dakota
Tennessee
Texas
Utah
Vermont
Virginia
Washington
West Virginia
Wisconsin
Wyoming
Number % Number % Number % Number % Number %
3,448 82 2.4 2,570 74.5 225 6.5 70 2.0 56 1.6
767 52 6.8 425 55.4 98 12.8 50 6.5 22 2.9
7,463 247 3.3 5,001 67.0 597 8.0 256 3.4 143 1.9
3,238 96 3.0 1,778 54.9 537 16.6 231 7.1 70 2.2
290 9 3.1 195 67.2 25 8.6 14 4.8 3 1.0
2,726 134 4.9 1,672 61.3 209 7.7 128 4.7 65 2.4
945 55 5.8 520 55.0 105 11.1 52 5.5 33 3.5
764 54 7.1 360 47.1 85 11.1 61 8.0 31 4.1
4,713 175 3.7 3,322 70.5 252 5.3 125 2.7 85 1.8
358 10 2.8 226 63.1 21 5.9 9 2.5 4 1.1
1,422 44 3.1 837 58.9 172 12.1 70 4.9 26 1.8
271 16 5.9 182 67.2 18 6.6 8 3.0 2 0.7
1,437 52 3.6 831 57.8 141 9.8 89 6.2 35 2.4
5,178 241 4.7 2,973 57.4 598 11.5 308 5.9 139 2.7
542 48 8.9 260 48.0 69 12.7 29 5.4 15 2.8
451 19 4.2 320 71.0 23 5.1 8 1.8 15 3.3
3,093 123 4.0 1,619 52.3 521 16.8 265 8.6 82 2.7
1,813 88 4.9 812 44.8 268 14.8 184 10.1 54 3.0
457 9 2.0 297 65.0 30 6.6 16 3.5 17 3.7
1,195 48 4.0 742 62.1 75 6.3 45 3.8 32 2.7
328 13 4.0 212 64.6 26 7.9 6 1.8 10 3.0
54

State Tables APPENDIX A Table A15. Number and percent of deleted people by state and AGE (Continued)
States Total Age
55 to 64 years 65 to74 years 75 to 84 years 85 years and Missing
Number over
Number % Number % Number % Number % Number %
U.S. Total 83,160 1,075 1.3 1,211 1.5 1,900 2.3 1,598 1.9 9,245 11.1
Alabama 1,029 12 1.2 14 1.4 16 1.6 16 1.6 123 12.0
Alaska 506 4 0.8 3 0.6 3 0.6 1 0.2 60 11.9
Arizona 1,482 18 1.2 30 2.0 30 2.0 30 2.0 207 14.0
Arkansas 522 8 1.5 3 0.6 12 2.3 11 2.1 47 9.0
Califo rnia 7,962 116 1.5 123 1.5 171 2.1 147 1.8 981 12.3
Colorado 1,060 11 1.0 8 0.8 13 1.2 22 2.1 134 12.6
Connecticut 1,538 18 1.2 22 1.4 27 1.8 26 1.7 159 10.3
Delaware 225 6 2.7 2 0.9 5 2.2 4 1.8 19 8.4
D.C. 241 6 2.5 3 1.2 9 3.7 6 2.5 27 11.2
Florida 3,760 49 1.3 65 1.7 108 2.9 87 2.3 557 14.8
Ge orgia 1,849 21 1.1 29 1.6 50 2.7 39 2.1 252 13.6
Ha waii 491 9 1.8 5 1.0 5 1.0 6 1.2 69 14.1
Idaho 335 5 1.5 3 0.9 17 5.1 8 2.4 41 12.2
Illinois 3,210 30 0.9 34 1.1 71 2.2 50 1.6 353 11.0
Indiana 1,454 25 1.7 18 1.2 41 2.8 41 2.8 174 12.0
Iowa 514 1 0.2 5 1.0 12 2.3 23 4.5 66 12.8
Kansas 694 6 0.9 14 2.0 17 2.5 18 2.6 90 13.0
Kentucky 1,083 11 1.0 22 2.0 27 2.5 23 2.1 130 12.0
Louisiana 1,454 17 1.2 15 1.0 21 1.4 21 1.4 144 9.9
Maine 771 8 1.0 9 1.2 14 1.8 12 1.6 50 6.5
Maryland 1,817 24 1.3 25 1.4 34 1.9 29 1.6 175 9.6
M assachusetts 2,909 31 1.1 46 1.6 76 2.6 61 2.1 282 9.7
Michigan 2,150 37 1.7 45 2.1 75 3.5 58 2.7 245 11.4
M inneso ta 1,027 16 1.6 15 1.5 37 3.6 22 2.1 120 11.7
Mississippi 1,013 14 1.4 19 1.9 14 1.4 15 1.5 101 10.0
Missouri 1,172 20 1.7 20 1.7 39 3.3 37 3.2 133 11.3
Mo ntana 399 1 0.3 8 2.0 2 0.5 7 1.8 48 12.0
Nebraska 514 5 1.0 8 1.6 18 3.5 15 2.9 58 11.3
Nevada 388 5 1.3 6 1.5 7 1.8 4 1.0 62 16.0
New H ampshire 692 10 1.4 13 1.9 12 1.7 6 0.9 46 6.6
NOTE: Because data are for persons who actually had the “Cancel” box marked, inferences about the demographic distributions of deleted people should not be made from this table, nor should a net count of added or deleted people be inferred from the tables in this Appendix.
55

State Tables APPENDIX A
States Total Age
55 to 64 years 65 to74 years 75 to 84 years 85 years and Missing
Number over
Number % Number % Number % Number % Number %
New Jersey 3,448 34 1.0 34 1.0 49 1.4 35 1.0 293 8.5
New Mexico 767 16 2.1 8 1.0 15 2.0 14 1.8 67 8.7
New York 7,463 112 1.5 120 1.6 165 2.2 126 1.7 696 9.3
North Carolina 3,238 31 1.0 35 1.1 54 1.7 58 1.8 348 10.7
North Dakota 290 2 0.7 3 1.0 9 3.1 9 3.1 21 7.2
Ohio 2,726 42 1.5 54 2.0 88 3.2 58 2.1 276 10.1
Oklahoma 945 16 1.7 10 1.1 12 1.3 20 2.1 122 12.9
Oregon 764 16 2.1 13 1.7 21 2.7 25 3.3 98 12.8
Pennsylvania 4,713 49 1.0 56 1.2 137 2.9 92 2.0 420 8.9
Rhode Island 358 5 1.4 8 2.2 10 2.8 8 2.2 57 15.9
South Carolina 1,422 17 1.2 22 1.5 44 3.1 35 2.5 155 10.9
South Dakota 271 1 0.4 2 0.7 7 2.6 7 2.6 28 10.3
Tennessee 1,437 17 1.2 24 1.7 34 2.4 47 3.3 167 11.6
Texas 5,178 70 1.4 86 1.7 107 2.1 82 1.6 574 11.1
Utah 542 12 2.2 9 1.7 12 2.2 14 2.6 74 13.7
Vermont 451 3 0.7 6 1.3 12 2.7 8 1.8 37 8.2
Virginia 3,093 29 0.9 27 0.9 52 1.7 32 1.0 343 11.1
Washington 1,813 27 1.5 39 2.2 43 2.4 35 1.9 263 14.5
West Virginia 457 9 2.0 4 0.9 17 3.7 8 1.8 50 10.9
Wisconsin 1,195 20 1.7 16 1.3 23 1.9 35 2.9 159 13.3
Wyoming 328 3 0.9 3 0.9 6 1.8 5 1.5 44 13.4
56

State Tables APPENDIX A Table A16. Number and percent of deleted people by state and SEX
States Total Sex
Male Female Missing Number
U.S. Total
Alabama
Alaska
Arizona
Arkansas
California
Colorado
Connecticut
Delaware
D.C.
Florida
Georgia
Hawaii
Idaho
Illinois
Indiana
Iowa
Kansas
Kentucky
Louisiana
Maine
Maryland
Massachusetts
Michigan
Minnesota
Mississippi
Missouri
Montana
Nebraska
Nevada
New Hampshire
Number % Number % Number %
83,160 45,896 55.2 35,038 42.1 2,226 2.7
1,029 543 52.8 457 44.4 29 2.8
506 299 59.1 192 37.9 15 3.0
1,482 841 56.7 606 40.9 35 2.4
522 285 54.6 223 42.7 14 2.7
7,962 4,819 60.5 2,923 36.7 220 2.8
1,060 633 59.7 395 37.3 32 3.0
1,538 778 50.6 712 46.3 48 3.1
225 124 55.1 95 42.2 6 2.7
241 136 56.4 101 41.9 4 1.7
3,760 2,241 59.6 1,421 37.8 98 2.6
1,849 1,019 55.1 778 42.1 52 2.8
491 315 64.2 168 34.2 8 1.6
335 195 58.2 134 40.0 6 1.8
3,210 1,650 51.4 1,467 45.7 93 2.9
1,454 762 52.4 640 44.0 52 3.6
514 268 52.1 228 44.4 18 3.5
694 367 52.9 302 43.5 25 3.6
1,083 594 54.8 457 42.2 32 3.0
1,454 837 57.6 574 39.5 43 3.0
771 400 51.9 358 46.4 13 1.7
1,817 986 54.3 792 43.6 39 2.1
2,909 1,392 47.9 1,426 49.0 91 3.1
2,150 1,102 51.3 972 45.2 76 3.5
1,027 545 53.1 443 43.1 39 3.8
1,013 538 53.1 446 44.0 29 2.9
1,172 620 52.9 518 44.2 34 2.9
399 215 53.9 170 42.6 14 3.5
514 270 52.5 231 44.9 13 2.5
388 240 61.9 138 35.6 10 2.6
692 359 51.9 321 46.4 12 1.7
NOTE: Because data are for persons who actually had the “Cancel” box marked, inferences about the demographic distributions of deleted people should not be made from this table, nor should a net count of added or deleted people be inferred from the tables in this Appendix.
57
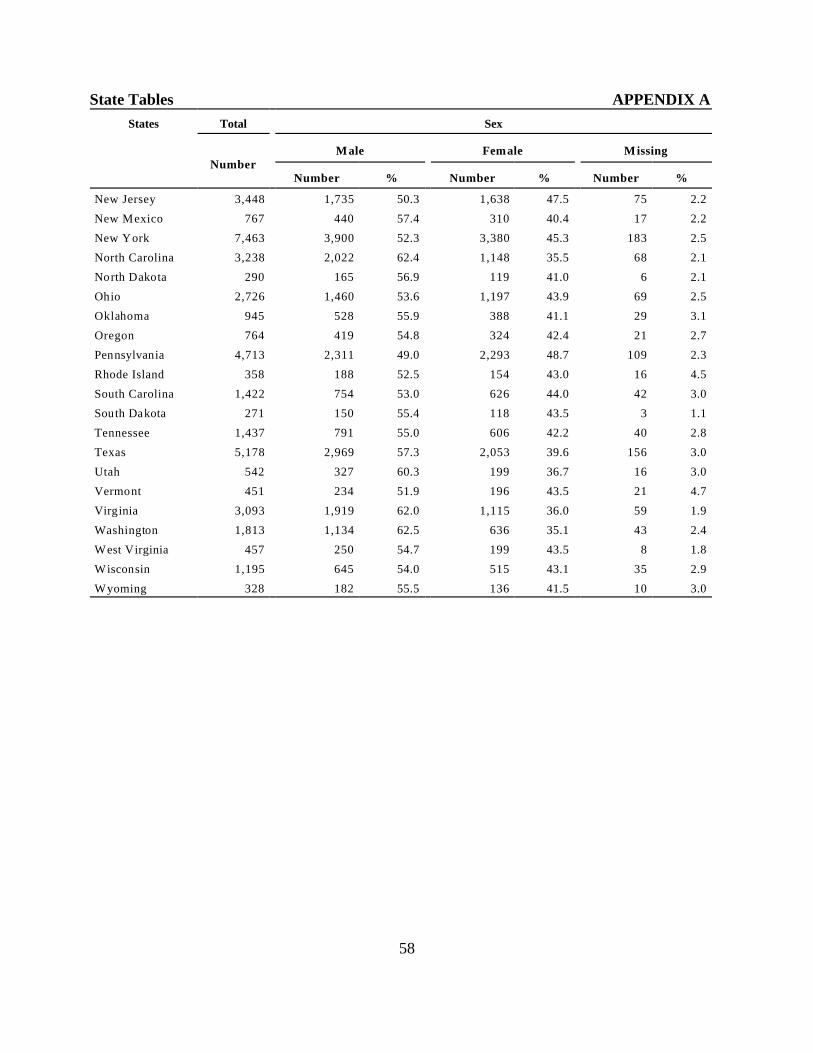
State Tables APPENDIX A
States Total Sex
M ale Fem ale M issing Number
New Jersey
New Mexico
New York
North Carolina
North Dakota
Ohio
Oklahoma
Oregon
Pennsylvania
Rhode Island
South Carolina
South Dakota
Tennessee
Texas
Utah
Vermont
Virginia
Washington
West Virginia
Wisconsin
Wyoming
Number % Number % Number %
3,448 1,735 50.3 1,638 47.5 75 2.2
767 440 57.4 310 40.4 17 2.2
7,463 3,900 52.3 3,380 45.3 183 2.5
3,238 2,022 62.4 1,148 35.5 68 2.1
290 165 56.9 119 41.0 6 2.1
2,726 1,460 53.6 1,197 43.9 69 2.5
945 528 55.9 388 41.1 29 3.1
764 419 54.8 324 42.4 21 2.7
4,713 2,311 49.0 2,293 48.7 109 2.3
358 188 52.5 154 43.0 16 4.5
1,422 754 53.0 626 44.0 42 3.0
271 150 55.4 118 43.5 3 1.1
1,437 791 55.0 606 42.2 40 2.8
5,178 2,969 57.3 2,053 39.6 156 3.0
542 327 60.3 199 36.7 16 3.0
451 234 51.9 196 43.5 21 4.7
3,093 1,919 62.0 1,115 36.0 59 1.9
1,813 1,134 62.5 636 35.1 43 2.4
457 250 54.7 199 43.5 8 1.8
1,195 645 54.0 515 43.1 35 2.9
328 182 55.5 136 41.5 10 3.0
58

State Tables APPENDIX A Table A17. Number and percent of deleted people by state and HISPANIC ORIGIN
States Total Hispanic origin
Non-Hispanic Hispanic Missing Number
U.S. Total
Alabama
Alaska
Arizona
Arkansas
California
Colorado
Connecticut
Delaware
D.C.
Florida
Georgia
Hawaii
Idaho
Illinois
Indiana
Iowa
Kansas
Kentucky
Louisiana
Maine
Maryland
Massachusetts
Michigan
Minnesota
Mississippi
Missouri
Montana
Nebraska
Nevada
New Hampshire
Number % Number % Number %
83,160 70,589 84.9 7,578 9.1 4,993 6.0
1,029 950 92.3 22 2.1 57 5.5
506 466 92.1 13 2.6 27 5.3
1,482 1,138 76.8 239 16.1 105 7.1
522 488 93.5 7 1.3 27 5.2
7,962 5,590 70.2 1,829 23.0 543 6.8
1,060 837 79.0 141 13.3 82 7.7
1,538 1,328 86.3 101 6.6 109 7.1
225 208 92.4 4 1.8 13 5.8
241 215 89.2 9 3.7 17 7.1
3,760 3,076 81.8 420 11.2 264 7.0
1,849 1,653 89.4 68 3.7 128 6.9
491 419 85.3 45 9.2 27 5.5
335 288 86.0 25 7.5 22 6.6
3,210 2,749 85.6 268 8.3 193 6.0
1,454 1,302 89.5 55 3.8 97 6.7
514 466 90.7 13 2.5 35 6.8
694 595 85.7 46 6.6 53 7.6
1,083 1,009 93.2 12 1.1 62 5.7
1,454 1,324 91.1 54 3.7 76 5.2
771 739 95.9 8 1.0 24 3.1
1,817 1,640 90.3 80 4.4 97 5.3
2,909 2,588 89.0 141 4.8 180 6.2
2,150 1,915 89.1 87 4.0 148 6.9
1,027 938 91.3 31 3.0 58 5.6
1,013 951 93.9 11 1.1 51 5.0
1,172 1,087 92.7 18 1.5 67 5.7
399 355 89.0 8 2.0 36 9.0
514 468 91.1 26 5.1 20 3.9
388 310 79.9 55 14.2 23 5.9
692 650 93.9 6 0.9 36 5.2
NOTE: Because data are for persons who actually had the “Cancel” box marked, inferences about the demographic distributions of deleted people should not be made from this table, nor should a net count of added or deleted people be inferred from the tables in this Appendix.
59

State Tables APPENDIX A
States Total Hispanic origin
No n-H ispan ic Hisp anic M issing Number
Number % Number % Number %
New Jersey 3,448 2,965 86.0 307 8.9 176 5.1
New Mexico 767 539 70.3 197 25.7 31 4.0
New York 7,463 6,345 85.0 749 10.0 369 4.9
North Carolina 3,238 2,893 89.3 197 6.1 148 4.6
North Dakota 290 267 92.1 10 3.4 13 4.5
Ohio 2,726 2,499 91.7 66 2.4 161 5.9
Oklahoma 945 828 87.6 41 4.3 76 8.0
Oregon 764 647 84.7 64 8.4 53 6.9
Pennsylvania 4,713 4,319 91.6 155 3.3 239 5.1
Rhode Island 358 295 82.4 31 8.7 32 8.9
South Carolina 1,422 1,309 92.1 20 1.4 93 6.5
South Dakota 271 253 93.4 4 1.5 14 5.2
Tennessee 1,437 1,339 93.2 25 1.7 73 5.1
Texas 5,178 3,430 66.2 1,454 28.1 294 5.7
Utah 542 434 80.1 63 11.6 45 8.3
Vermont 451 419 92.9 5 1.1 27 6.0
Virginia 3,093 2,750 88.9 164 5.3 179 5.8
Washington 1,813 1,519 83.8 133 7.3 161 8.9
West Virginia 457 431 94.3 7 1.5 19 4.2
W isconsin 1195 1075 90.0 30 2.5 90 7.5
W yoming 328 291 88.7 14 4.3 23 7.0
60

State Tables APPENDIX A Table A18. Number and percent of deleted people by state and TENURE
States Total Tenure
U.S. Total
Alabama
Alaska
Arizona
Arkansas
California
Colorado
Connecticut
Delaware
D.C.
Florida
Georgia
Hawaii
Idaho
Illinois
Indiana
Iowa
Kansas
Kentucky
Louisiana
Maine
Maryland
Massachusetts
Michigan
Minnesota
Mississippi
Missouri
Montana
Nebraska
Nevada
New Hampshire
Ow ner Renter M issing Number
Number % Number % Number %
83,160 49,552 59.6 25,462 30.6 8,146 9.8
1,029 629 61.1 263 25.6 137 13.3
506 318 62.8 162 32.0 26 5.1
1,482 900 60.7 444 30.0 138 9.3
522 321 61.5 141 27.0 60 11.5
7,962 3,728 46.8 3,602 45.2 632 7.9
1,060 578 54.5 394 37.2 88 8.3
1,538 1,037 67.4 357 23.2 144 9.4
225 146 64.9 57 25.3 22 9.8
241 112 46.5 97 40.2 32 13.3
3,760 2,093 55.7 1,210 32.2 457 12.2
1,849 1,004 54.3 569 30.8 276 14.9
491 204 41.5 262 53.4 25 5.1
335 217 64.8 94 28.1 24 7.2
3,210 2,073 64.6 827 25.8 310 9.7
1,454 919 63.2 327 22.5 208 14.3
514 314 61.1 134 26.1 66 12.8
694 394 56.8 207 29.8 93 13.4
1,083 681 62.9 282 26.0 120 11.1
1,454 793 54.5 512 35.2 149 10.2
771 593 76.9 134 17.4 44 5.7
1,817 1,116 61.4 515 28.3 186 10.2
2,909 1,958 67.3 708 24.3 243 8.4
2,150 1,463 68.0 441 20.5 246 11.4
1,027 685 66.7 245 23.9 97 9.4
1,013 609 60.1 282 27.8 122 12.0
1,172 737 62.9 307 26.2 128 10.9
399 214 53.6 143 35.8 42 10.5
514 254 49.4 207 40.3 53 10.3
388 203 52.3 152 39.2 33 8.5
692 535 77.3 86 12.4 71 10.3
NOTE: Because data are for persons who actually had the “Cancel” box marked, inferences about the demographic distributions of deleted people should not be made from this table, nor should a net count of added or deleted people be inferred from the tables in this Appendix.
61

State Tables APPENDIX A
States Total Tenure
Ow ner Renter M issing Number
Number % Number % Number %
New Jersey 3,448 2,352 68.2 823 23.9 273 7.9
New M exico 767 538 70.1 180 23.5 49 6.4
New Y ork 7,463 4,246 56.9 2,640 35.4 577 7.7
North Carolina 3,238 1,728 53.4 1,148 35.5 362 11.2
No rth Dakota 290 172 59.3 87 30.0 31 10.7
Ohio 2,726 1,694 62.1 763 28.0 269 9.9
Oklahoma 945 534 56.5 289 30.6 122 12.9
Oregon 764 410 53.7 289 37.8 65 8.5
Pen nsylvania 4,713 3,308 70.2 968 20.5 437 9.3
Rhode Island 358 197 55.0 120 33.5 41 11.5
South Carolina 1,422 859 60.4 392 27.6 171 12.0
Sou th Da kota 271 172 63.5 78 28.8 21 7.7
Tennessee 1,437 907 63.1 368 25.6 162 11.3
Texas 5,178 3,165 61.1 1,516 29.3 497 9.6
Utah 542 297 54.8 194 35.8 51 9.4
Vermo nt 451 340 75.4 72 16.0 39 8.6
Virg inia 3,093 1,641 53.1 1187 38.4 265 8.6
Washington 1,813 880 48.5 733 40.4 200 11.0
W est Virginia 457 306 67.0 105 23.0 46 10.1
W isconsin 1,195 738 61.8 293 24.5 164 13.7
W yoming 328 240 73.2 56 17.1 32 9.8
62

1 2 3 4 5 6 7 8 9101112
Variable Definitions From DRF2 APPENDIX B
Variable Definition and Values
RSOURCE Source of Return
-1 Not computed Paper mail back questionnaire from mail out (not used) Paper mail back questionnaire from TQA mail out with NO ID Paper mail back questionnaire from Update/Leave Paper mail back questionnaire from Update/Leave ADD Paper mail back questionnaire from Update/Leave SUBSTITUTE Paper mail back questionnaire from Urban Update/Leave Paper mail back questionnaire from Urban Update/Leave ADD Paper mail back questionnaire from Urban Update/Leave SUBSTITUTE Paper mail back questionnaire from Request for Foreign Language Paper mail back questionnaire from BCF marked as whole household Paper mail back questionnaire from BCF partial household (i.e., NOT marked
as whole household) 13 Paper enumerator questionnaire from List/Enumerate 14 Paper enumerator questionnaire from Update/Enumerate 15 Paper enumerator questionnaire from Update/Enumerate ADD 16 Paper enumerator questionnaire from Update/Enumerate SUBSTITUTE 17 Paper enumerator questionnaire from Nonresponse Followup (NRFU) 18 Paper enumerator questionnaire from NRFU ADD 19 Paper enumerator questionnaire from NRFU SUBSTITUTE 20 Paper enumerator questionnaire from NRFU Whole Household Usual Home
Elsewhere (WHUHE) 21 Paper enumerator questionnaire from NRFU In-mover 22 Paper enumerator questionnaire from Coverage Improvement Followup (CIFU) 23 Paper enumerator questionnaire from CIFU ADD 24 Paper enumerator questionnaire from CIFU SUBSTITUTE 25 Paper enumerator questionnaire from T-Night 26 Paper questionnaire for UHE from Service-based Enumeration (SBE)
(Individual Census Questionnaire (ICQ)) 27 Paper questionnaire for UHE from Group Quarters (GQ) enumeration
(Individual Census Report (ICR)) 28 Paper questionnaire for UHE from Military GQ enumeration (Military Census
Report (MCR)) 29 Paper questionnaire for UHE from Shipboard GQ enumeration (Shipboard
Census Report (SCR)) 30 Electronic short form from IDC 31 Electronic TQA reverse-CATI short form 32 Electronic TQA reverse-CATI BCF for whole household 33 Electronic TQA reverse-CATI BCF for partial household
63

1 2 3 4 5 6
Variable Definitions From DRF2 APPENDIX B
RSOURCE Source of Return (Continued)
34 Electronic Coverage Edit Followup (CEFU) from long or short form35 Electronic CEFU from BCF for whole household36 Electronic CEFU from IDC37 Paper enumerator continuation form – unlinked “orphan”
RPRSTAT Return and PSA Household Status
-1 Not computed Basic return for primary PSA houshold Other return for primary PSA houshold Basic return for non-primary PSA houshold Other return for non-primary PSA houshold Redundant Ineligible
RRT Record Type
2 Short form return-level record 3 Long form return-level record
RC1 “Miss anyone who lived or stayed here on April 1, 2000?” (i.e., People with no other home, young children, roomers or housemates, or people away on business or on vacation)
-1 No response 1 Yes only 2 No only 3 Both boxes marked
RC2 “Were any people you told me about staying at (college, institutions, etc.) on April 1, 2000?”
-1 No response 1 Yes only 2 No only 3 Both boxes marked
64
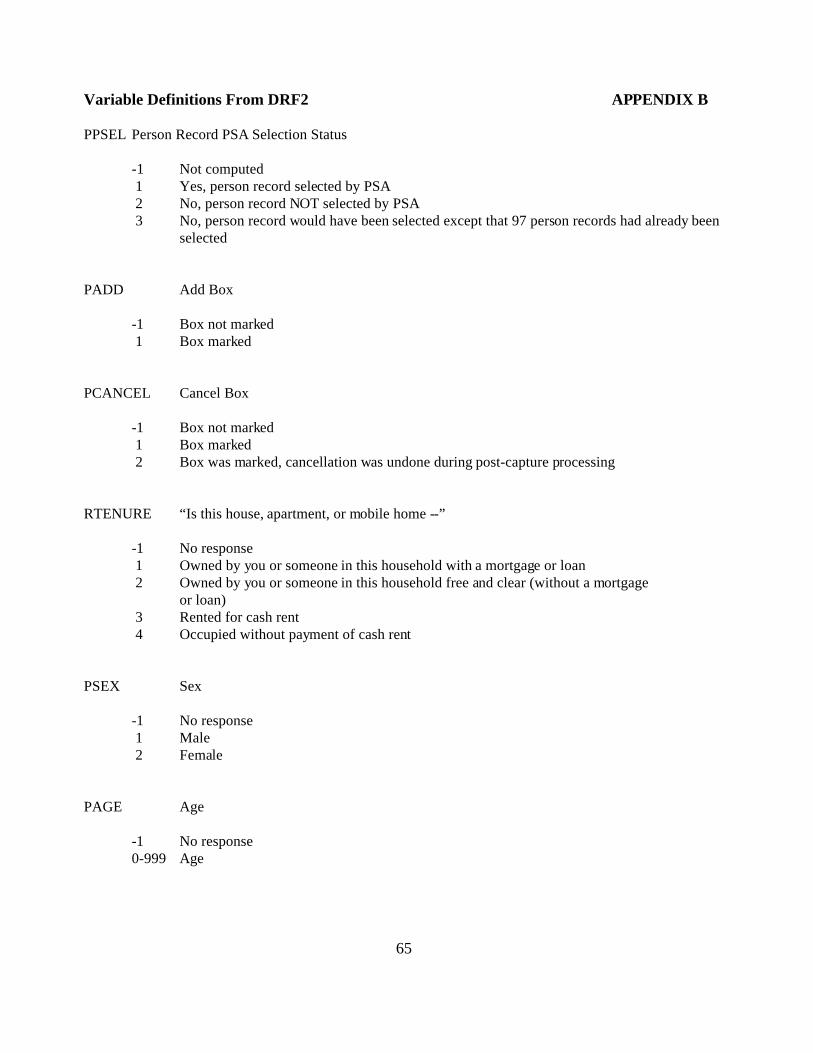
Variable Definitions From DRF2 APPENDIX B
PPSEL Person Record PSA Selection Status
-1 Not computed 1 Yes, person record selected by PSA 2 No, person record NOT selected by PSA 3 No, person record would have been selected except that 97 person records had already been
selected
PADD Add Box
-1 Box not marked 1 Box marked
PCANCEL Cancel Box
-1 Box not marked 1 Box marked 2 Box was marked, cancellation was undone during post-capture processing
RTENURE “Is this house, apartment, or mobile home --”
-1 No response 1 Owned by you or someone in this household with a mortgage or loan 2 Owned by you or someone in this household free and clear (without a mortgage
or loan) 3 Rented for cash rent 4 Occupied without payment of cash rent
PSEX Sex
-1 No response 1 Male 2 Female
PAGE Age
-1 No response 0-999 Age
65

Variable Definitions From DRF2 APPENDIX B
PSPAN01 Spanish Origin - No, not Spanish/Hispanic origin Check Box
-1 Box not marked 1 Box marked
PSPAN02 Spanish Origin - Yes, Mexican, Mexican-Am, Chicano Check Box
-1 Box not marked 1 Box marked
PSPAN03 Spanish Origin - Yes, Puerto Rican Check Box
-1 Box not marked 1 Box marked
PSPAN04 Spanish Origin - Yes, Cuban Check Box
-1 Box not marked 1 Box marked
PSPAN05 Spanish Origin - Yes, other Spanish/Hispanic Check Box -1 Box not marked 1 Box marked
PSPANWI Spanish Origin Write-in
PRACE01 Race - White Check Box
-1 Box not marked 1 Box marked
PRACE02 Race - Black, African Am., or Negro Check Box
-1 Box not marked 1 Box marked
66

Variable Definitions From DRF2 APPENDIX B
PRACE03 Race - Indian (Amer.) or Alaska Native Check Box
-1 Box not marked 1 Box marked
PRACE04 Race - Asian Indian Check Box -1 Box not marked 1 Box marked
PRACE05 Race - Chinese Check Box
-1 Box not marked 1 Box marked
PRACE06 Race - Filipino Check Box
-1 Box not marked 1 Box marked
PRACE07 Race - Japanese Check Box
-1 Box not marked 1 Box marked
PRACE08 Race - Korean Check Box
-1 Box not marked 1 Box marked
PRACE09 Race - Vietnamese Check Box
-1 Box not marked 1 Box marked
PRACE10 Race - Other Asian Check Box
-1 Box not marked 1 Box marked
67

Variable Definitions From DRF2 APPENDIX B PRACE11 Race - Native Hawaiian Check Box
1 Box marked -1 Box not marked
PRACE12 Race - Guamanian or Chamorro Check Box
-1 Box not marked 1 Box marked
PRACE13 Race - Samoan Check Box
-1 Box not marked 1 Box marked
PRACE14 Race - Other Pacific Islander Check Box
-1 Box not marked 1 Box marked
PRACE15 Race - Some other race Check Box
-1 Box not marked 1 Box marked
68

Census 2000 Enumerator Questionnaire, Form D-1(E) APPENDIX C
69

Census 2000 Enumerator Questionnaire, Form D-1(E) APPENDIX C
70

Census 2000 Enumerator Questionnaire, Form D-1(E) APPENDIX C
71

Census 2000 Enumerator Questionnaire, Form D-1(E) APPENDIX C
72
