questionnaire results
TRANSCRIPT

Questionnaire results.
By Clare O’Mara
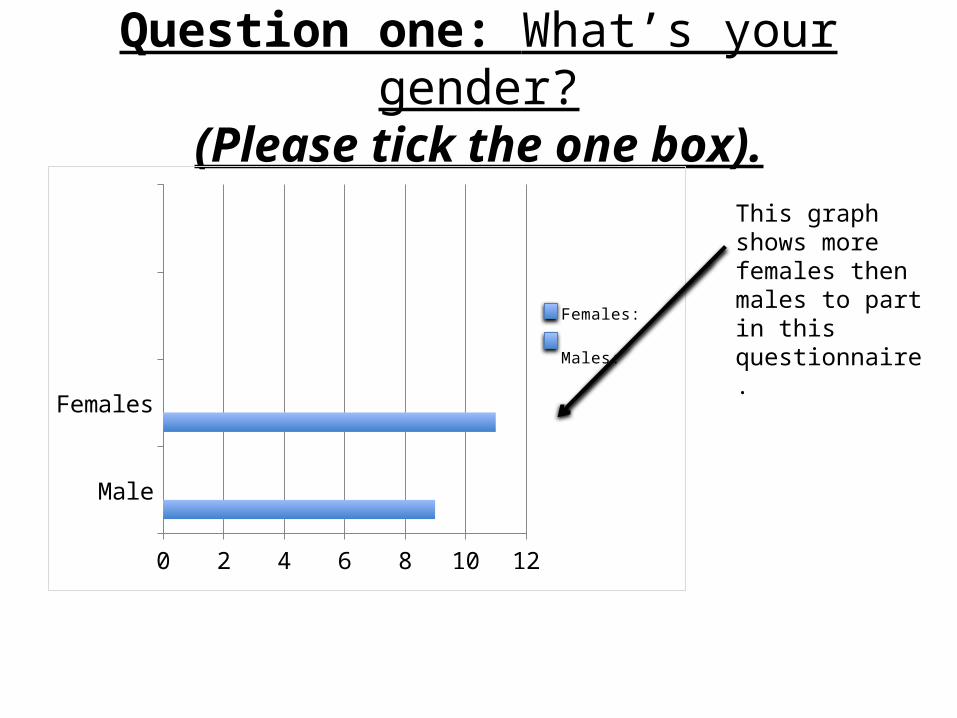
Question one: What’s your gender?(Please tick the one box).
Male
Females
0 2 4 6 8 10 12
Females:
Males:
This graph shows more females then males to part in this questionnaire.

Question 2: What’s your age?(Please tick the one box).
0-6 years
7-13 years
14-20 years
21-26 years
27-33 years
33+ years
02468
101214161820
Age group
This graph shows that a large amount of male and females aged 14-20 years of age took part in this questionnaire.
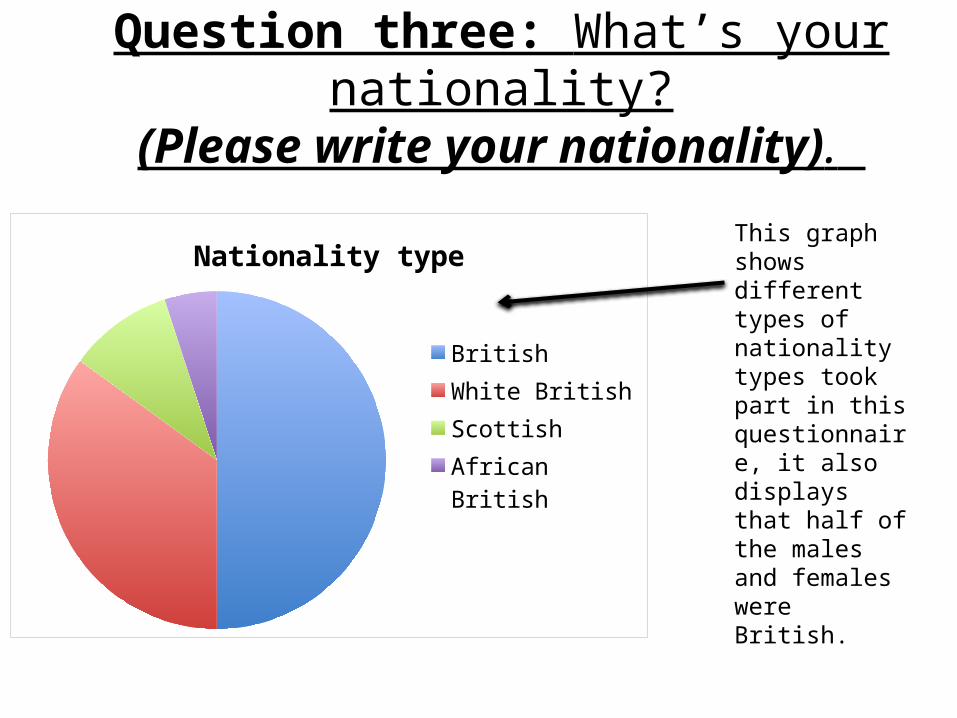
Question three: What’s your nationality?(Please write your nationality).
Nationality type
British White BritishScottishAfrican British
This graph shows different types of nationality types took part in this questionnaire, it also displays that half of the males and females were British.

Question four: What’s your current marital status?(Please tick the one box).
Married Divorced Single0
5
10
15
20
25
Marital status
This graph shows that all males and females who took part in this questionnaire current martial status is, ‘single’.

Question five: What’s your current occupation?
(Please tick the one box).
Employed
Student
Unemployed
Other
0 2 4 6 8 10 12 14 16 18 20
Current occupation
This graph communicates that most of the people took part in the questionnaire current occupation was, ‘student’.

Question six: What is your chosen religion?
(Please tick the one box).
Catholic
Hindu
Buddhism
Christian
ity
Athesis
tOth
er0123456789
Religion type
Religion type
This graph shows that the people whom took part with the questionnaire has a chosen religion of, ‘catholic’, ‘Christianity’, ‘atheist’ or a different type of religion, which the person would answer to, ‘other’.

Question seven: Do you have any hobbies?(Please tick the boxes that apply to you).
Perform
ingSp
orts
Cooking
Reading
Textiles/s
ewingOth
er0
2
4
6
8
10
12
Type of hobbie
This graph shows results of the people who took part in the questionnaire. Also each person whom took part in the questionnaire has a range of different types of hobbies, however the most popular hobbies that my audience enjoy most was, ‘sports’.

Question eight: How many hours of Television do you watch a day?
(Please tick the one box).
Hours of television watched in a day
0-3 hours4-7 hours8-10 hours10+ hours
This graph shows results of how many hours of television that my audience watch, I discovered that the most hours of television people watch is 4-7 hours per day.

Question nine: What channels do you watch most often?
(Please tick at least one box that applies to you).
Channels watched most often
BBC channelsITV channels4MusicVivaMTVOther
This graph shows what type of channels my audience watches most often, I discovered the most channels that my audiences watches is, ‘ITV’, ‘BBC’ and, ‘4Music’ channels.

Question ten: What channels do you watch less often?
(Please tick at least one box that applies to you).
Channels watched less often
BBC channelsITV channels4MusicVivaMTVOther
This graph shows the type of channels that my audience watches less often. I discovered that, ‘MTV’ was the most less watched channel that my audience’s watches.

Question eleven: What platform do you prefer watching a programme on?
(Please tick at least one box that applies to you).
Platform people prefer to watch programmes on
Mobile phone device
Computer/laptop
Tablet
Television
Other
This graph I created is displaying what platform does my audience prefer to watch programmes on, I found out that my audience prefer to watch programmes on television.

Question twelve: What music do you listen to?(Please tick at least one box that applies to you).
Music genre
R&BPopMetalRockPunkJazzOther
This graph I crated displays what music genre does my audience prefer and wishes to listen to, I found out that, ‘pop’ was the most popular music genre out of the seven.

Question thirteen: What radio station do you listen to?
(Please tick at least one box that applies to you).
Radio station genre
Capital FMKissKisstoryMagicHeartKerrang!Other
This graph I have created displays what radio station does my audience listen to, I found out that the most popular radio station that my audience’s listen to is, ‘Capital FM’.

Question fourteen: Have you ever been to a live concert?
(Please tick the one box).
Yes No0
2
4
6
8
10
12
14
16
Been to a live concert or not
This graph is about if my audience have or haven’t been to a live concert, I discovered that most of my audience have not been to a live concert.

Question fifteen: If you answered, ‘Yes’ to question fourteen please state which band/group you went to see live at a concert.
(Please write below the band/group you went to see live).
Answered, 'Yes' to question fourteen, what band/group the audience saw live.
ColdplayOrchestasNonoEd SharranOne directionTheory of a deadmanMonster magnetJLSSaturdaysOlly MursTiny Tempah
This graph displays if my audience answered, ‘yes’ to question fourteen, (which in this case if my audience have been to a live concert) then my audience must state which band/group they went to see live. The most popular band/group was, ‘Coldplay’ and, ‘One direction’.

Question sixteen: If you answered, ‘No’ to question fourteen please state which band/group you would wish to see live at a
concert.(Please write below the band/group you wish to see live).
If answered, 'No' to question fourteen, what band/group the audience would wish to see
live.Red hot chilli peppersOne directionBruno MarsBastillePurmoreEvanesceneColdplayLinkin parkImagine dragonsRihannaEd Sharran
This graph is about if my audience answered, ‘no’ to question fourteen, (which in this case if my audience have not been to a live concert), then my audience must state which band/group they wish to see live. The most popular band/group was, ‘Rihanna’ and, ‘One direction’.

Question seventeen: Do you live on your own or with relatives/carer?
(Please tick the one box that applies to you).
I live independently
I live with my relatives
I live with my carer
Other
0 4 8 12 16
Does the audience live independently or not.
This graph I created displays if my audience is living with relatives or with a carer, I discovered that most of my audiences lived with relatives.