queenstown - bendemeer » bendemeer of the rankton flats f continue to be delayed by on-going...
TRANSCRIPT

Accelerating success.
Queenstownmarket overview 2013

More than 532 offices
in over 62 countries
on six continents
2

contents
colliers international is the largest commercial property firm in australasia
COLLIERS INtERNAtIONAL NEW ZEALAND 5
MARKEt OVERVIEW 6
COMMERCIAL MARKEt SuMMARy 8
RESIDENtIAL 12
MANAgED/SERVICED ApARtMENtS 15
RuRAL LIfEStyLE MARKEt 16
LARgE SCALE DEVELOpMENtS 18
tOuRISM OVERVIEW 19
WANAKA MARKEt SuMMARy 21
QuEENStOWN pEDEStRIAN COuNt 2013 23
AbOut uS 25
3

colliers international is a leader in global real estate services, defined by our spirit of enterprise. through a culture of service excellence, and a shared sense of initiative, we have integrated the resources of real estate specialists worldwide to accelerate the success of our clients.

colliers international neW ZealanD
Since launching in Auckland in 1989, Colliers International New Zealand has grown to become a national group with more than 370 staff in 12 locations around the country.
Colliers International offers a full range of commercial real estate services, including:
� Agency
� Corporate solutions
� Hotels
� Insolvency property services
� Investment services
� Landlord representation
� project marketing
� Real estate management services (REM)
� Research
� Retail sales and leasing
� Special projects
� Sustainability
� tenant representation
� Valuation and advisory services
colliers international’s integrated platform provides clients with market knowledge and insight to make the best real estate decisions.
5

A buoyant tourism sector, significant increases in sales volumes alongside renewed activity in the construction sector, predominately driven from residential housing, are the key drivers behind the rise in Queenstown market activity. the Queenstown property market turned a corner midway through 2012 with the first quarter of 2013 showing signs of being the start of a new growth phase.
tourist numbers into Queenstown continue to be our largest economic driver, now at 1.9 million annually with a resident population of around 17,000. Combined, this gives an average day population of around 45,000. the tourist spend is now worth $900m per annum
in comparison to $125m worth of building permits issued for the area in 2012.
tourist numbers are forecast to grow to 2.1 million by 2016, with China being one of the fastest growing sectors. Queenstown International Airport is among the fastest growing airports in Australasia, with 40% growth in travel numbers since 2009, with substantial capital reinvestment required to sustain the growth.
the Queenstown Lakes District Council has recently announced a joint venture for a circa 1000 delegate capacity conference centre at an estimated cost of $50m. While subject to further public consultation,
the proposed site is within close proximity to the town centre on what was originally the old Queenstown Camping ground land. the proposed development will be a joint venture between Council, Ngāi tahu and Sky City Casino, with some potential funding from Central government. Should the development proceed, this will have a positive multiplier effect for the region.
Development of the frankton flats continue to be delayed by on-going Environment and High Court planning disputes. Substantial construction and infrastructure development is proposed, for the frankton area including:
MarKet overvieWin this annual Queenstown market overview we cover a range of property sectors, with a focus on the Queenstown market. Queenstown is one of the most positive property markets in the country, second only to christchurch, according to colliers international research. a net 49% of respondents expect the property market to improve, coming off the lows of 2009 when a net 43% of respondents expected the market to get worse.
New Zealand quarterly real estate investor confidence
80% —
60% —
40% —
20% —
0% —
-20% —
-40% —
-60% —
— three main centres — Queenstown — Regional
Jun
09 —
Aug
09 —
Oct
09
—
Dec
09 —
feb
10 —
Apr
10 —
Jun
10 —
Aug
10 —
Oct
10
—
Dec
10 —
feb
11 —
Apr
11 —
Jun
11 —
Aug
11 —
Oct
11
—
Dec
11 —
feb
12 —
Apr
12 —
Jun
12 —
Aug
12 —
Oct
12
—
Dec
12 —
feb
13 —
6

� 5 Mile’s gateway development of some 25,000m2 mixed use retail development anchored by a Countdown Supermarket and some other bulk and specialty retail entities
� bulk trade and industrial subdivision and development proposed for Shotover park
� A new MOE Secondary School at Remarkables park on a 7ha site due circa 2015
� Ongoing expansion of the Remarkables town Centre area, to the South side of the airport.
the residential market is enjoying increased sales volumes. Over the last
three years, a steady reduction in the oversupply of sections and apartments, and to a lesser extent housing, has occurred. the market is returning to equilibrium and in some areas a seller’s market is emerging. the current historic low interest rates on offer are stimulating activity with a rise in first home buyers and investors. the market has truly reached the bottom of the cycle and we expect price growth over the next 12 months. An increase in new house construction given the stronger fundamentals are beginning to underpin the market in 2013.
Active developers remain scarce; however there are some signs of new residential
apartment and unit developments with one under construction and others planned. With the Christchurch rebuild now beginning to gather momentum, construction costs are increasing. Over time, this will drive existing residential values as demand starts to exceed supply.
Central Queenstown commercial property continues to be tightly held with few commercial transactions in the last 12 months. Sales of prime CbD property indicate a yield range of between 5-6% for prime retail with tenanted office space above and a slightly softer yields for buildings with a higher office component. the increase in confidence in the local economy has spurred leasing activity with very limited ground floor CbD vacancy. Whilst a sufficient supply of office space is available, there has been a lowering of office vacancy rates.
Commercial sales in the frankton area have reflected yields of between 6.5% - 7.25%, also showing a limited number of vacancies.
the industrial market is enjoying an increase in new leasing activity, although still below levels experienced at the peak of the market in 2006/07. the limited sales provide evidence of yields between 7.5% - 8.5%, depending on location, tenant covenant and building quality.
A noticeable trend in the overall commercial and industrial market is a growing awareness of the need to have initial engineering assessments completed on buildings as part of the due diligence process. this is driven by purchasers, insurers and funders. At this stage it is too early to gauge from the market what is an acceptable level of New building Standard Rating and what discount the market is applying to price for the varying ratings.
MarKet overvieW
7

coMMercial MarKet suMMaryQueenstown’s commercial town centre property market has performed strongly over the last 25 years.
the key factors defining this market are a geographically constrained and finite supply of commercially zoned land, an established central core and viable retail trading conditions. Ongoing growth in domestic and international visitor arrivals combined with a limited supply of outlets supports strong retail rental growth. Notably demand outweighs supply in terms of the availability of prime retail space.
Queenstown commercial property is closely held by relatively few landlords, many owning more than one property, who tend to hold property as a long term investment. Accordingly, commercial property within the original CbD precinct is seldom presented to the market for sale.
Investors wishing to enter the marketplace are therefore compelled to accept low initial investment yields, for what is considered a scarce boutique investment with an expectation of continued rental growth. Such an expectation is well founded by the evidence of consistent historical rental increases, further confirmed during recent difficult economic times. Queenstown rents are relatively resilient and continue to support investment yields firmer than commercial property located in other parts of New Zealand. this firm yield trend also exists outside of Queenstown’s town centre.
Commercial sale activity within the CbD during the past 12 months has been relatively subdued with no substantial commercial properties being presented to the market. Only two sale transactions occurred for properties within the CbD during this period. both were in fringe locations and lower value quantums, however continuing the trend of very firm yields.
table 1 illustrates the low volume of sales that take place within Queenstown’s town centre each year and the low yield environment of this market.
the largest commercial sales transactions within the Queenstown area during the past 12 months include:
� A portfolio of three large format buildings within Remarkables park selling for $18.2m at a yield of 7.25%
� the warehouse, also within Remarkables park, which sold for circa $6.9m at a yield of 6.75%
� A modern commercial building at Frankton which sold for $3.35m at a yield of 7.06%.
prime retail rentals for space within the CbD remains strong with a trend towards rentals increasing at review and on renewal. this sector is underpinned by demand from new entrants wishing to enter the market and only limited supply (if any).
Secondary retail rents for space on the fringe of the CbD are steady. prominent smaller tenancies within good quality buildings in secondary locations are achieving rental increases on review.
Market rents for good quality office space remain steady. there is limited demand from new entrants who tend to be smaller entities requiring less than 100m2, and only limited availability of small premium quality office space is available.
good quality office space at frankton has low vacancy levels aided by discounted rental levels. Remarkables park has some limited office vacancy, with generally strong rental levels.
Frankton Flats – CommerCial and industrial
Over the past two decades frankton’s commercial precinct has grown substantially and now includes the full service Remarkables park town Centre, the smaller terrace Junction and frankton Village shopping centres that includes two service stations. the area has been further complemented by the establishment of the Queenstown Events Centre and associated facilities and the expansion of the Queenstown Airport.
Remarkables park town Centre, initially developed circa 2002, has now established itself as the main shopping destination outside of central Queenstown. Shotover park to the east is now established as Queenstown’s newer industrial area.
A further proposed development known as ‘5 Mile’ located on frankton Ladies Mile is planned to provide an integrated shopping centre including bulk retailers and specialty shops.
frankton flats plan change 19plan Change 19 (pC19) covering all of the land over the frankton flats impacts circa 60 hectares of land owned by seven different entities. It is flat land centrally located between Queenstown Airport’s northern boundary through to the State Highway, and extends east to the Shotover park industrial area and west to the playing fields surrounding the Queenstown Events Centre.
pC19 was first initiated in 2007, with the QLDC determining an outline structure plan in circa 2008. the outline structure plan provided for a mix of uses including education, residential, visitor accommodation, commercial, industrial, and business/recreation facilities.
8

coMMercial MarKet suMMary
following a number of consent applications, consultations, hearing’s and decisions/appeals over the last six years, the Environment Court released its interim decision for pC19 in february 2013. the current status of pC19 provides no definitive timeframe for resolution and/or certainty around the various areas and associated uses for the area.
We expect this may impact supply and demand for mixed use commercial and industrial land in the short term, with the impact on values unclear at this stage.
Frankton JunCtion
terrace Junction Shopping Centre (circa 6,000m2) was completed in 2010 with the ground floor retail fully leased, complemented by a number of national tenants. the developer has been successful in tenanting the upper level office accommodation with only limited vacancy remaining, albeit at competitive market rentals. this complex has a diversified tenant base and overall offers convenience and good quality buildings.
the bp service station continues to be Queenstown’s largest and busiest forecourt. the original core frankton retail shops remain popular with some office space available. A significant modern building complex sold in 2012 for $3.35m at a yield of 7.06%.
Year retail location no oF sales total sales
volume
Yield passing rental based on sale
price
2012 prime 1 $ 5,850,000 6.16%
Secondary 2 $ 3,800,000 3.95%
2011 prime 1 $ 7,500,000 5.25%
Secondary 2 $ 6,759,600 5.14%
2010 prime 1 $ 7,450,000 6.27%
Secondary 1 $ 7,038,000 4.52%
2009 prime 1 $ 5,940,000 5.22%
Secondary 2 $ 2,350,000 6.67%
2008 prime 4 $27,500,000 3.98%
Secondary 1 $ 1,950,000 N/A
2007 prime 4 $20,050,000 4.07%
Secondary 2 $10,700,000 5.20%
sector current rental values ($/m²) land values market
Yieldsprime retail $1,000 - $1,500/m² $14,000 - $18,000/m² 5% - 5.75%
Secondary retail $500 - $700/m² $4,000 - $8,000/m² 5.5% - 6.5%
Non CbD commercial $350 - $500/m² $1,200 - $2,000/m² 6% - 7.5%
prime office $250 - $300/m²
Secondary office $180 - $225/m²
table 2: Commercial value indicators
table 1: Volume of sales
frankton flats
9
remarkables Park
the Remarkables park town Centre on the south side of Queenstown Airport opened for trade mid 1999 bringing to Queenstown a much needed large format supermarket followed by other leading national brands. Over the past 10 years it has grown into an established and successful integrated shopping centre comprising 27,000m2 of accommodation with 800 public car parks, attracting circa 3.0 million patrons per annum.
Stage 1 of the town Centre of Remarkables park is effectively complete with the final stage of buildings now under construction and we understand nearly fully leased.
Stage 2 of the town Centre has been excavated and shaped, and will bring further large format retailing supply to the market, with land to accommodate associated bulk retail shops. further nearby specific buildings such as a retirement and healthcare facilities are also being planned.
the shopping centre contains a mix of national brand retailers who appear to be trading steadily with no retail vacancies, solid rentals and some noted increases on review. property investor/manager DNZ is the single largest property owner in the current town centre. three buildings, including Mitre 10, Element and H&J Smith within this complex, were sold at the end of 2011/early 2012. this was Queenstown’s largest sales transaction selling for a combined $18.2m at a yield of 7.25%. the Warehouse also sold for circa $6.9m at a yield of 6.75%.
Late in 2012 porter group, the developer of Remarkables park announced that it had agreed terms with the Ministry of Education to sell approximately seven hectares of land to be the site of the future Queenstown Secondary School. this is an important development that will further establish Remarkables park town Centre and the surrounding area.
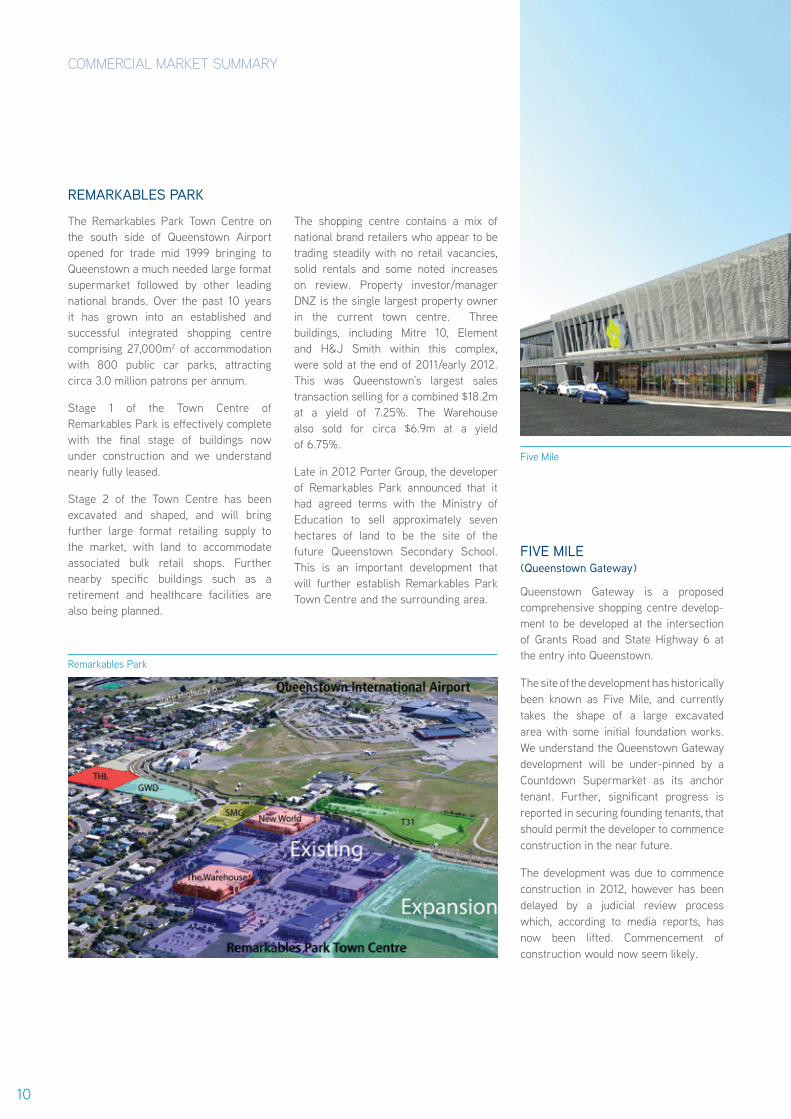
Five mile (Queenstown Gateway)
Queenstown gateway is a proposed comprehensive shopping centre develop-ment to be developed at the intersection of grants Road and State Highway 6 at the entry into Queenstown.
the site of the development has historically been known as five Mile, and currently takes the shape of a large excavated area with some initial foundation works. We understand the Queenstown gateway development will be under-pinned by a Countdown Supermarket as its anchor tenant. further, significant progress is reported in securing founding tenants, that should permit the developer to commence construction in the near future.
the development was due to commence construction in 2012, however has been delayed by a judicial review process which, according to media reports, has now been lifted. Commencement of construction would now seem likely.
coMMercial MarKet suMMary
Remarkables park
five Mile
10

2003
_ —
2004
_ —
2005
_ —
2006
_ —
2007
_ —
2008
_ —
2009
_ —
2010
_ —
2011
_ —
2012
_ —
2013
_ —
$1,000 —
$800 —
$600 —
$400 —
$200 —
$0 —
general market projections
� Lack of supply in industrial property in the short term
� A stabilising in investment yields
� Lack of supply of development sites suitable for larger national type tenants until plan Change 19 is finalised
� Continued demand for prime property with good profile and solid tenants on longer term leases.
Median $/m2
Vacant land sales in Shotover park industrial area
Queenstown industrial market
there was an increase in activity in the industrial market over 2012, with a number of premises leased that have been vacant for an extended period. there have also been a number of land sales and improved sales.
Vacant land sales predominantly in the Shotover park Industrial area have historically shown substantial growth with land values rising from $150 - $250/m² in 2002 and peaking in 2006/2007 at $800 - $1,000/m². Recent land sales indicate values generally ranging from $350 to $550/m2.
We understand that there have been some presales within the next stage of Shotover park for sites ranging in size from 700m² to 1,200m² at sales levels ranging from $400/m² - $500/m². However the progress and timing of this extension to
the industrial area is also uncertain due to ongoing consent and planning issues.
Industrial rents are now typically in the range of $95/m² - $140/m² for good quality warehouse space and $120/m² - $150/m² for offices, with some good profile locations achieving retail/showroom rentals of up to $250/m². Industrial yields are stable and are now at circa 7.0% - 8.5% depending on the tenant, lease terms, size, quality and location.
five Mile
coMMercial MarKet suMMary
11

the Queenstown residential property market peaked in terms of sales volume back in 2002/2003 with values reaching a new high a short time after.
the following graph summarises sales volume over the last 27 years:
Wakatipu basin Residential Sales Volumes 1986-2013
Note that these stats exclude sales direct from developers or some, which have not yet settled. We estimate this could be 5-10% of the current market. * Current year data is projected based on YTD sales Source: Colliers International, Queenstown
Overall sales volume for the year ending December 2012 was above 2011 (an increase of 26%).
Volumes have averaged 61 sales per month compared with around 90 sales a month during the peak of the market.
the lower price segment for residential dwellings and units (<$550,000) has been the most active, accounting for 52% of total residential sales. first home buyers have been more active largely due to lower funding costs, higher bank loan to equity ratios and in some cases the ability to draw on KiwiSaver funds to assist in paying the deposit.
there has been a rise in the mid-value market ($550,000 - $1.05m) sales activity accounting for approximately 38% of sales compared to around 26% of residential sales activity in 2011. the upper price segment (>$1.05m) has had steady sales activity with 51 in 2012 versus 50 in 2011.
the highest improved residential sale was a 546m2 residence known as Ekara Lodge within the exclusive gated subdivision ‘the peak’ in the upper reaches of Queenstown Hill. the seven bedroom, seven bathroom property sold for $6.4m in August 2012.
Section sales have continued to be active with 154 sales in 2012 compared to 146 in 2011.
resiDential
12
— Dwellings — units — Managed apartments — total
1986
— —19
88 — —
1990
— —19
92 — —
1994
— —19
96 — —
1998
— —20
00 — —
2002
— —20
04 — —
2006
— —20
08 — —
2010
— —*2
012
—
1,200 —
1,100 —
1,000 —
900 —
800 —
700 —
600 —
500 —
400 —
300 —
200 —
100 —
0 —

there have been a number of high value residential sites of note selling recently.
� two exclusive sites sold within ‘the peak’ on Queenstown Hill both in the first quarter of 2012, one for $1.05m and the other for $1.075m
� two sites in the upper reaches of Queenstown Hill with a combined area of 1742m2 sold for a combined $1.8m in April 2013. the sites are elevated above the corner of Kerry Drive and belfast terrace and obtain wide lake and mountain views and adjoin the Queenstown walking track. We understand that the buyer has purchased the property as a single house site.
� A prime waterfront park Street property adjoining a reserve comprising a modernised 1960’s home and an adjoining vacant residential site sold for a combined $3.35m in July 2012.
Values in general have increased slightly over the majority of the market compared with 2011 figures.
buildinG Consents
building consents have been relatively static since 2009 and are approximately a third of their 2004 peak of just under 600 as shown on the chart beside.
In 2012 there were 221 dwelling consents issued compared with the 20 year average of 297 dwellings per year. given existing trends, plus the number of vacant sites purchased over the past two years, we would expect a further increase in dwelling consents over the next three years.
the median section price for the Central Otago Lakes district is now $220,000 compared with $235,000 twelve months ago. the median dwelling price including apartments for the Central Otago Lakes district is now $475,000 compared with $395,000 twelve months ago. (Source REINZ)
Shotover Country is Queenstown’s latest residential development located approximately one kilometre east of the Shotover River bridge. Central Queenstown is located 10 kilometres to the southwest while frankton Shopping Centre and Queenstown Airport are located five kilometres to the southwest.
Initially, Shotover Country will obtain direct road access from frankton Ladies Mile Road via a roundabout to be constructed at the intersection of Stalker Road, and eventually the eastern side
projections for 2013
� total sales levels to increase largely in line with the last quarter of 2012 volumes (averaging 70 per month) with further increases likely.
� Limited forced sales as a large number of distressed assets have already been presented to the market.
� banks to further compete for market share keeping funding costs low and assisting in buying property versus renting.
� An increase in demand for rental investment properties as investors take advantage of reduced costs of funding, re-priced assets and clearer government policies.
� both residential and lifestyle section prices to remain at relatively low levels in comparison with previous pricing due to increased volume availability.
� An increase in new residential building activity with value levels increasing as building costs increase.
� Overall - some value increases expected over the majority of the residential market.
resiDential
Building consents have been relatively static since 2009.
13
num
ber o
f per
mits
issu
ed
Year ending
—19
79 — —
1981
— —19
83 — —
1985
— —19
87 — —
1989
— —19
91 — —
1993
— —19
95 — —
1997
— —19
99 — —
2001
— —20
03 — —
2005
— —20
07 — —
2009
— —20
11 — —
700 —
600 —
500 —
400 —
300 —
200 —
100 —
0 —
permits issue for new dwellings - Queenstown Lakes District Dec 1979 - Dec 2012

resiDential
of the development will link to Howards Way being the main road into the existing Lake Hayes Estate residential subdivision.
the proposed development stemmed from plan Change 41 otherwise known as Shotover Country private plan Change ratified late 2012. the zoning enables development of a range of residential, commercial and retail activities and an educational precinct. the overall subdivision will yield a total 705 sections as well as land zoned for a school site. Agreement has been reached with the Ministry of Education to provide a fully serviced site suitable for use as a primary school. the school is now required due to the rapid expansion of Queenstown primary School and the recently constructed Remarkables primary School.
Stage 1 (Oxford Neighbourhood) contains 54 residential lots. Sales and marketing has commenced, to date there has been good interest with nearly all lots in Stage 1 sold and marketing for Stage 2 commencing. Earthworks have been completed to form sites, streets and roads and installation of services. Sites have been surveyed with individual titles expected mid to late 2013. Several purchasers have already engaged builders in anticipation of titles being released.
Sites within Stage 1 are priced starting at $169,000 and all are below $200,000 designed to encourage ‘entry level’ purchasers into the Queenstown market.
We understand there has also been good interest in the purchase of bulk sites from construction companies intending to develop house and land packages.
Stage 2 (Woodstock Neighbourhood) of the development has recently been released containing 36 residential lots ranging in size from 525m2 to 1560m2
and prices ranging from $175,000 to $205,000.
the following is a summary of residential sales volumes over the last five years:
table 3: Average monthly sales volume
Year total sections2013 67 15
2012 61 13
2011 48 11
2010 46 10
2009 56 11
2008 46 6
2007 78 17
sectionsthe average section sale volumes (per month) have recovered well in the 2013 year to date.
We estimate an existing stock of 700 vacant sites currently in the market with a further 800 sites expected to be developed over the next five years.
the average section sale volumes (per month) have recovered well in the 2013 year to date.
14

ManageD/serviceD apartMents
there has been an increase in sales activity in this sector with volumes and value levels appearing to stabilise after the dramatic falls from the peak of the market in 2006/2007. sales volumes of managed apartments in 2011 fell to 36, down from 209 sales at the peak of the market in 2006.
Sales numbers in 2012 increased with 78 apartment sales and initial sales in 2013 continue with this trend in rising sales numbers.
the apartment market is proving most attractive for overseas buyers, particularly Australian, investors who identify the benefit of investing while the market is off its recent peak. Some Australian purchasers have been using the discretionary part of their superannuation savings to invest in assets such as managed apartments. the purchase also provides the added benefit of holiday use of the apartment.
Although there is renewed interest at ‘re-priced levels’ we don’t expect to see much capital growth over the short to medium term. the market has yet to fully adjust to the current volume and pricing of available product.
the volume of apartments constructed in the previous cycle created an oversupply and consequently there has been limited activity in the construction of new apartments although we are aware of recent plans for two new developments. the viability of this will be tested and initially we are likely to see smaller staged developments rather than substantial multi room complexes.
We have also seen a number of owners exit from management agreements and renting as residential apartments. this is due to the more consistent and generally higher returns offered from residential tenancies. the flip side of this is the reduced number of managed apartments in the market thereby potentially increasing returns to owners that remain in the management pool.
We have not yet seen fixed commercial type leases implemented in Queenstown for this sector. However, this is popular
in Australia and may be an option for managers to consider potentially increasing returns and providing a more consistent cashflow.
the number of mortgagee auctions has declined dramatically with what appears to be reduced discounts to current market value from previous mortgagee sales. We are aware of a number of owners unwilling to crystallise a loss and hoping for a recovery to previous value levels.
financial returns have remained consistent for managed apartments ranging from 2% for poorer performing complexes up to 5% for more efficient operations.
With tourist numbers stable and recent statistics suggesting some growth in guest nights and occupancy levels, we expect performance of this sector to continue to improve.
ManageD/serviceD apartMents
Hotel St Moritz
15

16
rural lifestyle MarKet
after a softening of value levels over 2008 to 2010, the rural lifestyle market has rebounded showing confident signs with good section sale numbers and strong lifestyle dwelling sales over $2m.
We are also aware of a number of construction projects either planned, underway or recently completed of high end residential/lifestyle dwellings with build costs in excess of $5m. Vacant lifestyle sales of note are:
� lot 17 elysium way (Slopehill Rd) sold in September 2012 for $925,000. the site has an elevated building platform with a number of good quality landscape features and ponds.
� A 3.7 hectare site at wyuna Preserve in glenorchy sold in May 2012 for $2.5m. this is an elevated site with panoramic lake vistas towards Mount Earnslaw.
� two upper Hawthorne sites near Lake Hayes sold, one in October 2012 for $1.485m and January 2013 at $1.41m. these sites have impressive Lake Hayes and surrounding mountain views.
imProved sales
In 2012, lifestyle home sales have been buoyant with 48 sales recorded with a median of $1,375,000 and 13 sales at approximately $2m and over. the sales distribution chart beside is a summary of these sales volumes.
Improved sales of note during 2012 include:
� 16 arrowtown - lake Hayes rd sold in January 2012 for $5.5m. A substantial modern contemporary, architecturally designed lifestyle residence on a 2.1468 hectare site.
� 72 arrowtown - lake Hayes rd sold in february 2012 for $6.05m. A ‘Warren & Mahoney’ designed home built in the mid 1990’s on an elevated six hectare site that overlooks Lake Hayes and benefits from further subdivision potential.
Sales distribution
num
ber o
f sal
es
value range
— — — —< $1 million > $1 million > $2 million
30 —25 —20 —15 —10 —5 —0 —
2006 2007 2008 2009 2010 2011 2012

rural lifestyle MarKet
� 76 Hunter road sold in December 2012 for $4,100,000. An architecturally designed split level four/five bedroom house of contemporary design with a large basement double car garage. Situated on a prime 21.5 hectare site on the eastern side of Hunter Road.
� 56-58 Hunter road sold in May 2012 for $7m. A large rural lifestyle residence known as White Shadows, on 5.87 hectares of land, contained in two separate titles both having an approved building platform.
the graph below indicates that the median lifestyle section sale price increased substantially from 2000, peaking in 2007 then falling back to a level similar to 2002/2003. Although that statistic is not a good representation of individual market values as a whole, which have not decreased to that extent. the median sale price showed a steady increase over 2009 – 2011 before falling dramatically in 2012. this can be attributed to good sale numbers in the lower end of the market inclusive of threepwood by Lake Hayes and Lookout point above bobs Cove on the glenorchy to Queenstown Road that were in the $200,000 to $300,000 bracket, and a reduced sales volume of premium lifestyle sections.
ProJeCtions
� Continued building activity in the high end value sector of $2m and above
� Similar vacant sales volumes above $1m until lower value stock is cleared
� Less speculative buyers for vacant sites with the majority of the purchasers intending to build as opposed to hold.
� buyers will begin to search for quality and unique features in the higher value bracket – a return to the fundamentals of this market pre gfC.
17
— Median — Number of sales
1995
—
1996
—
1997
—
1998
—
1999
—
2000
—
2001
—
2002
—
2003
—
2004
—
2005
—
2006
—
2007
—
2008
—
2009
—
2010
—
2011
—
2012
—
$1,000,000 —
$900,000 —
$800,000 —
$700,000 —
$600,000 —
$500,000 —
$400,000 —
$300,000 —
$200,000 —
$100,000 —
0 —
— 120
— 100
— 80
— 60
— 40
— 20
— 0
volume
sale
pric
e ($
)
Wakatipu median lifestyle section sale prices and volume

large scale DevelopMents
millbrook
sales momentum has gathered pace at Millbrook resort with almost $22m sold in the first quarter of 2013.
this compares with a reported $26m for each of the previous two years.
three recent developments within Millbrook west have contributed significantly to the sales revenue.
mcentyre’s tarn, which is a cluster of five stand alone single level high quality three bedroom, two bathroom Mason and Wales designed dwellings with open plan living areas plus a detached double garage and landscaping to a high quality inclusive of outdoor living areas.
further options include two outdoor living areas, sunroom, covered terrace plus a fourth loft bedroom above the garage. All of the homes have sold with one property re-selling prior to completion. Sales levels ranged from $1.9m to $2.3m.
Millbrook has launched a new “house and land” development during 2012 known as taramea Square, which along with McEntyre’s tarn complements the first release of ‘house and land’ offerings known as Coronet Square to provide three price points and multiple floor plans.
taramea square is a 12 home neighbourhood within an almost level, sunny and north-facing site bounded by the third and eighth fairways of Millbrook’s new Coronet 9 golf course. It is a short distance from the resort centre amenities and close to walking and cycling trails linking to Lake Hayes.
the 12 homes are designed by Mason and Wales Architects. the neighbourhood is made up of four different home designs featuring a variety of scale, claddings and colours. the homes have combinations of sunrooms, verandas, garages and outdoor spaces. to date there have been three sales of homes within taramea Square for prices in excess of $2m.
A shortage of ‘’land only’’ building sites within Millbrook Resort has prompted the latest release of the Millbrook West development known as mica ridge (Stage 3A).
the first release of this 20-lot development consists of nine building sites. the remaining 11 sites are proposed
to be “home and section” packages which will be released at a later date.
these nine north-facing terraced building sites are situated on and around two prominent ridgelines to the south of the fourth fairway (Coronet 9). featuring exposed mica schist rock, wide fairway to mountain views and a water feature, these home sites range in size from 1264m2 to 2029m2.
to date there have been four sales of sites within Mica Ridge for levels ranging from $1.18m to $1.25m. the remaining sites are priced ranging from $895,000 to $995,000.
Several substantial private homes have recently been completed with further large homes under construction on prime elevated sites within Millbrook West, all of a significant size and of a high specification.
Millbrook
18
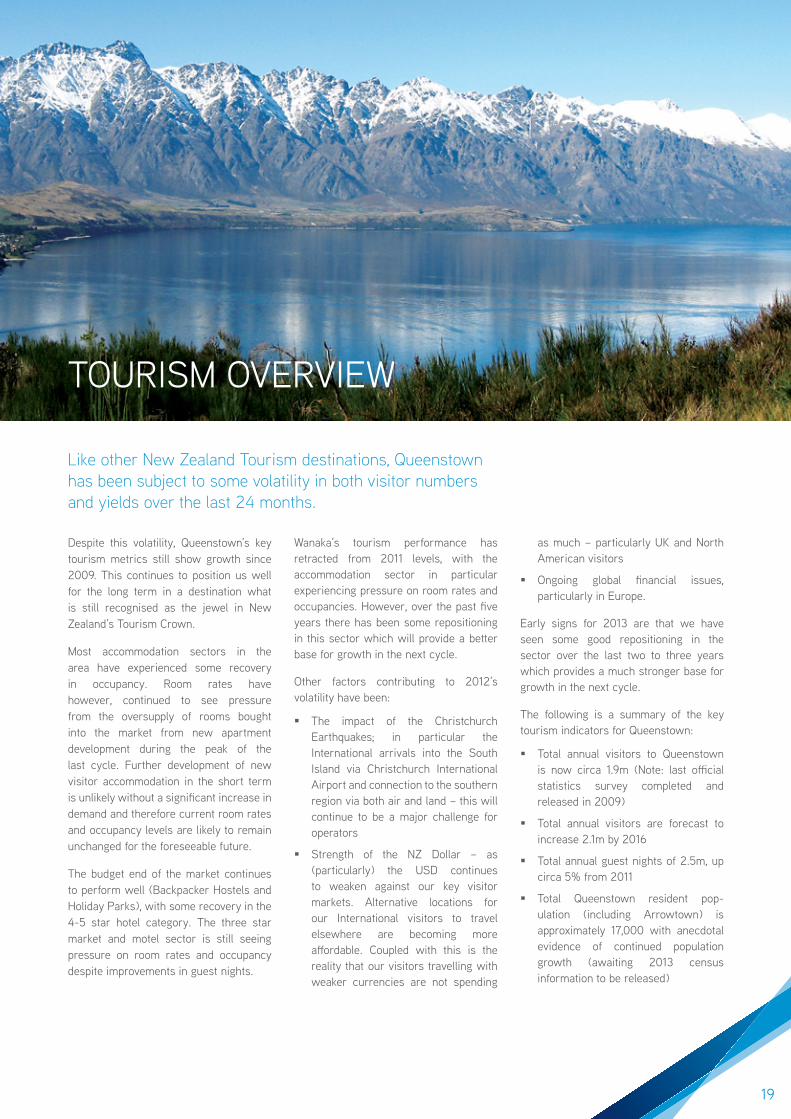
tOuRISM OVERVIEW
like other new Zealand tourism destinations, Queenstown has been subject to some volatility in both visitor numbers and yields over the last 24 months.
Despite this volatility, Queenstown’s key tourism metrics still show growth since 2009. this continues to position us well for the long term in a destination what is still recognised as the jewel in New Zealand’s tourism Crown.
Most accommodation sectors in the area have experienced some recovery in occupancy. Room rates have however, continued to see pressure from the oversupply of rooms bought into the market from new apartment development during the peak of the last cycle. further development of new visitor accommodation in the short term is unlikely without a significant increase in demand and therefore current room rates and occupancy levels are likely to remain unchanged for the foreseeable future.
the budget end of the market continues to perform well (backpacker Hostels and Holiday parks), with some recovery in the 4-5 star hotel category. the three star market and motel sector is still seeing pressure on room rates and occupancy despite improvements in guest nights.
Wanaka’s tourism performance has retracted from 2011 levels, with the accommodation sector in particular experiencing pressure on room rates and occupancies. However, over the past five years there has been some repositioning in this sector which will provide a better base for growth in the next cycle.
Other factors contributing to 2012’s volatility have been:
� the impact of the Christchurch Earthquakes; in particular the International arrivals into the South Island via Christchurch International Airport and connection to the southern region via both air and land – this will continue to be a major challenge for operators
� Strength of the NZ Dollar – as (particularly) the uSD continues to weaken against our key visitor markets. Alternative locations for our International visitors to travel elsewhere are becoming more affordable. Coupled with this is the reality that our visitors travelling with weaker currencies are not spending
as much – particularly uK and North American visitors
� Ongoing global financial issues, particularly in Europe.
Early signs for 2013 are that we have seen some good repositioning in the sector over the last two to three years which provides a much stronger base for growth in the next cycle.
the following is a summary of the key tourism indicators for Queenstown:
� total annual visitors to Queenstown is now circa 1.9m (Note: last official statistics survey completed and released in 2009)
� total annual visitors are forecast to increase 2.1m by 2016
� total annual guest nights of 2.5m, up circa 5% from 2011
� total Queenstown resident pop-ulation (including Arrowtown) is approximately 17,000 with anecdotal evidence of continued population growth (awaiting 2013 census information to be released)
19
� Average day population is estimated at 45,000
� peak day population is estimated at 75,000.
Queenstown International Airport continues to remain the key to ongoing growth in visitor numbers into our region. the expansion to the terminal facilities continues with the next phase of work in planning which ensures an ongoing spend of circa $25m over the next two to three years.
the year to December 2012 saw total passenger numbers in excess of 1.1 million. this is up from approximately 684,000 in 2009 with total growth over four years of approximately 40%.
total airline capacity has also increased by approximately 45% since 2009 made up of larger planes, more routes and the expansion of airline providers.
Also of note is the announcement of a joint venture consortium to develop a new large scale conference facility in central Queenstown costing circa $50m. this is still required to go through a public consultation and funding review, but if successful will be significant in assisting with the ongoing growth in our tourism sector.
aCCommodation seCtor
the hotel sector has gone through considerable realignment since 2007 with the oversupply in rooms starting to abate since the Hilton at Kawarau falls opened releasing approximately 276 rooms into the market. We expect supply will remain constant for the next two to three years with the viability for developing new product made difficult even despite realignment in underlying land values.
the budget accommodation sector has responded positively to an increase in supply of around 25% over the last three years, with only a small decline in revenue and yields, and a limited change in occupancy.
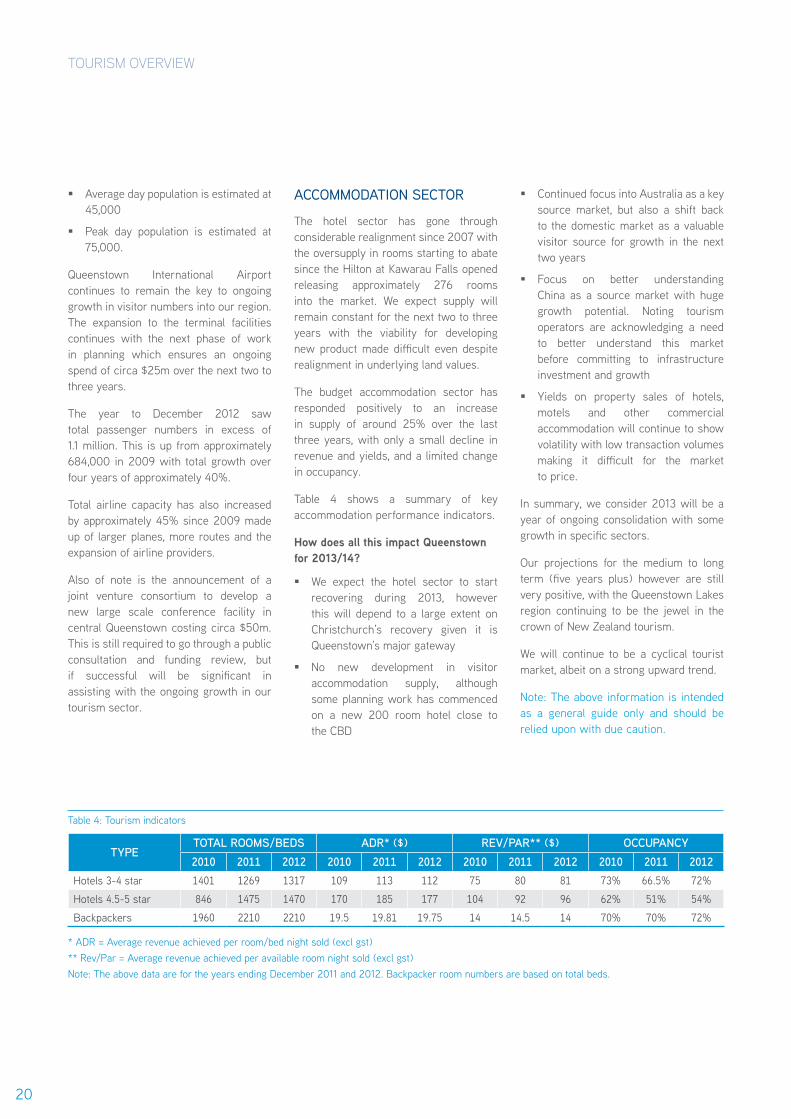
table 4 shows a summary of key accommodation performance indicators.
how does all this impact Queenstown for 2013/14?
� We expect the hotel sector to start recovering during 2013, however this will depend to a large extent on Christchurch’s recovery given it is Queenstown’s major gateway
� No new development in visitor accommodation supply, although some planning work has commenced on a new 200 room hotel close to the CbD
� Continued focus into Australia as a key source market, but also a shift back to the domestic market as a valuable visitor source for growth in the next two years
� focus on better understanding China as a source market with huge growth potential. Noting tourism operators are acknowledging a need to better understand this market before committing to infrastructure investment and growth
� yields on property sales of hotels, motels and other commercial accommodation will continue to show volatility with low transaction volumes making it difficult for the market to price.
In summary, we consider 2013 will be a year of ongoing consolidation with some growth in specific sectors.
Our projections for the medium to long term (five years plus) however are still very positive, with the Queenstown Lakes region continuing to be the jewel in the crown of New Zealand tourism.
We will continue to be a cyclical tourist market, albeit on a strong upward trend.
Note: the above information is intended as a general guide only and should be relied upon with due caution.
tourisM overvieW
table 4: tourism indicators
tYPetotal rooms/beds adr* ($) rev/Par** ($) occuPancY2010 2011 2012 2010 2011 2012 2010 2011 2012 2010 2011 2012
Hotels 3-4 star 1401 1269 1317 109 113 112 75 80 81 73% 66.5% 72%
Hotels 4.5-5 star 846 1475 1470 170 185 177 104 92 96 62% 51% 54%
backpackers 1960 2210 2210 19.5 19.81 19.75 14 14.5 14 70% 70% 72%
* ADR = Average revenue achieved per room/bed night sold (excl gst) ** Rev/par = Average revenue achieved per available room night sold (excl gst) Note: the above data are for the years ending December 2011 and 2012. backpacker room numbers are based on total beds.
20

there are a number of sales for higher values and reports of Christchurch based buyers entering the Wanaka market willing to pay a premium for sites with lake views. While difficult to determine, we are aware that some developers have incorporated rebates into some section sale prices, whereby a purchaser receives a cash back incentive, creating a higher face value sale price.
Annual sales volumes since 2010 have been recorded as follows:
table 5: Annual sales volumes
Year section sales
median sale Price
2010 76 $241,250
2011 65 $280,000
2012 115 $320,000
there has been a strong start to 2013 and we are aware that approximately 72 sections have sold to date, 12 of these sales being at a median of $232,000 with the balance being made up by the Northlakes subdivision of 64 4000m2 sections. there are approximately 60 pre-sales at a median of circa $260,000 per site, subject to section completion and issue of title, to a buyer pool whom we understand is locally based. this indicates a positive response to a product representing large
sections, central location, mountain views and competitive pricing.
Demand for large development sites is low with few active developers due to weak appetite for lending on development land given softer market conditions for completed sections and a high cost to create sections. As a consequence, values for development sites have been under downward pressure, which in some cases has resulted in substantial price correction. Extended selling periods are often required for such holdings and if properties are to be sold in a set time frame or under forced sale circumstances, significant discounts can be expected.
the former Wanaka primary school site marketed for sale during the second half of 2012 has recently sold. there are also reports that a large development site behind the Meadowstone subdivision is currently under offer. these sites represent two good quality land holdings inside established areas. the sites appear to have attracted demand from developers at value levels now considered viable for development. this interest was buoyed by positive section sales over the past 12 months. New supply into the Wanaka residential section market is shown in table 6.
table 6: Indicative supply into the Wanaka residential section market
locationPotential
residential sections (approx)
status – residential develoPment
three parks 300 Zoned - greenfields
North three parks 350 Zoned - greenfields
Riverside park 350Zoned and currently under subdivision with sites available for sale
peninsula bay 300Zoned - currently under subdivision with sites available for sale
Alpha Ridge 120 Zoned - greenfields
Kirimoko Neighbourhood 250Zoned – initial stages under subdivision with sites available for sale
West Meadows 100Initial stages zoned and titled and available for sale
WanaKa MarKet suMMary
sales activity in the Wanaka residential section market has shown resurgence, and has not been confined to affordable lower value section sales, which have only contributed to circa 20% of sections sold during 2012.
21

We are also aware of a current private plan change process that will potentially introduce zoned land capable of offering a further 1000 sites into the Wanaka market place.
Current estimates project Wanaka to require circa 185 houses to be built per year.
residential Homes
House values have rebounded slightly during 2010 and 2011 from previous lows.
table 7: House values
Year Houses sold
median sale Price
2010 171 $510,000
2011 150 $501,500
2012 219 $525,000
Demand for residential property that outstripped supply dominated the market during 2001-2004 driving prices up. the market is now in a more balanced state, with a rise in the number of properties available for sale. the increase in sales momentum established over 2012 seems to be continuing with the start of 2013 stronger than previous years.
aPartments
the upper value range of the residential apartment market remains relatively strong. During 2012 there were a number of sales in the $1m+ price bracket in the greater Wanaka area.
However, values for some apartment properties at the lower value end have suffered significant reductions due to a combination of negative market sentiment, onerous management agreements, or generally lacking in demand due to an oversupply of the below average quality of some of these properties.
retirement villaGe market
Developers have targeted the lifestyle retirement village sector as a potential growth area. two projects are presently underway, one being a multi-stage comprehensive project on golf Course Road and the second an extension to the Emslie House complex in Meadowstone.
two further projects are also in the consent/design phase, although the capacity of the market to absorb this additional supply should they proceed may be questionable.
A lack of local support services such as a hospital and aged care beds is an issue for retirees considering Wanaka, especially those looking at relocating from outside the area. Wanaka is a popular choice for active retirees with a number of options in greenfield developments such as West Meadows, Riverside park, Hidden Hills, Kirmoko park and peninsula bay.
CommerCial
Historically, central commercial property in Wanaka has commanded extremely low yields. this is a reflection of a small, closely held township that is quickly maturing, and rental levels low in comparison with centres such as Queenstown.
tighter economic conditions resulted in difficult trading conditions for Wanaka businesses which impacted rental affordability and rental growth. Where Queenstown benefited from its international airport and an influx of Australian visitors during 2009 and 2010, Wanaka missed out on such a stimulus and continued to rely upon a mostly domestic visitor market.
there have been relatively few commercial property transactions over the past five years, with a small number of commercial land transactions. this includes land purchased by the New World supermarket for additional car parking, and a few developed commercial properties including an older building in Ardmore Street selling at a comparably soft yield for the Wanaka market.
A substantial, good quality new commercial building was developed and completed late 2012. this building has a frontage to Ardmore Street, in close proximity to Helwick Street and excellent lake and mountain views, and we understand has been fully leased at strong rental levels.
WanaKa MarKet suMMary
22

QueenstoWn peDestrian count 2013
the Queenstown cBD pedestrian count began in 2005 and is carried out annually at the same time of year by colliers international Queenstown.
the counts are conducted over three half-hour periods; starting 10am, 3pm and 8pm to determine the volume of foot traffic throughout areas of Queenstown’s CbD. this years count was completed on 22 March 2013.
the sites are then ranked according to the volume of pedestrians counted at each time period. An overall ranking is then determined.
eXeCutive summarY oF results � 2013 is the second highest pedestrian count by volume on
record, with overall pedestrian numbers slightly ahead of 2012 across all time slots. 2010 was the highest overall volume on record.
� predictably, the majority of pedestrians are found in the area bordered by Camp Street, beach Street, Shotover Street, Rees Street and the Mall. typically, pedestrian numbers decrease with distance from these designated areas.
� the central Mall sites are the biggest movers this year being both the second and third busiest of all locations at the 3pm count.
� prime Queenstown CbD retail sites continue to attract strong pedestrian volumes, as a result we have had no long term vacancy and evidence of some key money being paid to secure prime sites.
� Camp St outside McCafe (O’Connell’s Mall) continues to be the busiest site in town taking the top spot for the past eight years running. See enclosed a summary of the top 15 locations for 2013.
table 8: Overall CbD ranking 2013
locationoverall
rank 2013
overall rank 2012
Central Camp St (McCafe) 1 1
East Camp St (Just Jeans) 2 2
Camp St (Subway) 3 6
Central Mall (bendon) 4 11
Central Shotover St (Outside Sports)
5 3
Central Mall (Amazon) 6 12
Steamer Wharf – Entrance 7 5
Lower beach St (Kodak Express) 8 14
Central Rees St (bNZ) 9 7
Central Rees St (Outside pog Mahones)
10 21
upper Shotover St (R&R Sports) 11 18
upper beach St (Whitcoulls) 12 4
Lower beach St (toilets) 13 9
West Rees St (ORA gallery) 14 15
Rees St (Kathmandu) 15 10
QueenstoWn peDestrian count 2013
23

� upper brecon Street saw a further increase in pedestrian traffic consistent with previous years, however still remains at a relatively low overall ranking.
keY loCation trends
camp streetthe western side of Camp Street has greater pedestrian numbers to the eastern side. this is most likely due to O’Connells Mall being located on the southern side of Camp Street. Most notable is the count on East Camp St completed outside Just Jeans maintaining its ranking of second and up from a ranking of fourth in 2011, giving Camp Street the top two rankings for 2013.
the mall Amazon and bendon sites saw increasing pedestrian volumes, however have remained relatively consistent since 2005.
rees streetpedestrian numbers were relatively consistent with prior years, however this year it is notable that there is little differentiation between the sides of the street as the retailers on the western side become more established.
the trend is consistent with the ‘common pedestrian circuit’ whereby a typical pedestrian starting from Camp Street, walks down either upper beach Street or the Mall which feeds out to Rees Street. pedestrians historically walked along the bNZ side of Rees Street however the redevelopment of the ‘Dairy Corner’ (Skyline) and the Mountaineer buildings on the opposite side appears to be now ‘drawing’ pedestrians across the road.
church streetthis part of town sits on the edge of the more popular pedestrian precincts with pedestrian numbers fluctuating. pedestrian numbers are generally at the quietest during the 8pm count although there is access to the food/beverage retailers on the increasingly popular Searle Lane bar precinct.
shotover streetthe central part of Shotover Street remains relatively consistent with past pedestrian numbers, however there has been some increase in activity towards the upper end of Shotover Street, with the largest fall off in foot count at the lower end of Shotover Street.
steamer Wharf Steamer Wharf sites increased significantly in 2012 when compared with 2011 only dropping away slightly in 2013, but still not to previous lower levels. It should be noted that pedestrian traffic at Steamer Wharf is heavily influenced by tour groups and the Earnslaw timetable.
for more detail on this or other Queenstown property market research please contact us to discuss your needs.
QuEENStOWN pEDEStRIAN COuNt 2013
2013 is the second highest pedestrian count
by volume on record, with overall pedestrian numbers slightly ahead
of 2012 across all time slots.
QuEENStOWN pEDEStRIAN COuNt 2013
24

aBout us

the colliers Queenstown office comprises three specialist services:
� Valuation and consultancy
� Commercial sales and leasing
� Commercial property management.
Combined this knowledge provides clients with arguably the largest and most experienced team of property professionals in the region.
our HistorY
MAC property Services was established in 1994 by Alastair Wood. In 2008 MAC property Services Limited became a Colliers International franchise rebranding to Colliers. the company is widely recognised as the leading property services company in Queenstown and the authority on the local property market.
In 2009 we opened our Dunedin office to give our clients a wider coverage of the Otago and Southland area.
Our full service offering includes:
� Property valuations – commercial, industrial, lifestyle, tourism-related and residential
� commercial property management
� commercial real estate sales and leasing
� Project developments – feasibility, advisory and management of the property development
� General consultancy – property acquisitions and sales, developments, subdivisions and syndications
� research - retail pedestrian traffic counts, sales research and analysis, subdivision supply and demand, commercial vacancy and leasing supply and demand.
colliers international QueenstoWnsales and leasinG aGents
Alastair Wood Commercial sales
e [email protected] P +64 3 441 0772 m +64 274 362 422
Mark Simpson Commercial sales and leasing
e [email protected] P +64 3 441 0770 m +64 274 906 394
Rory O’Donnell Commercial sales and leasing
e [email protected] P +64 3 441 0773 m +64 274 453 982
Mary-Jo Hudson retail and industrial leasing specialist
e [email protected] P +64 3 450 0863 m +64 21 667 880
Matt bowie executive assistant
e [email protected] P +64 3 441 0774 m +64 273 372 916
over 12,300 professionals WorlDWiDe
26

colliers international QueenstoWn
indePendent reGistered valuers and advisors
Andrew Hyndman
e [email protected] P +64 3 450 0861 m +64 21 856 469
sPecialist areas: � Commercial, industrial, tourism, high-value residential,
rural lifestyle and development land
� tenant representation and lease negotiation
� Strategy and transaction advisory
� property consultancy
geoff McElrea
e [email protected] P +64 3 441 0677 m +64 275 779 607
sPecialist areas: � Residential and rural lifestyle, property advice and valuation
� Insurance valuations
� High value residential
Doug Reid
e [email protected] P +64 3 441 0776 m +64 274 313 278
sPecialist areas: � Rural lifestyle, commercial and industrial and rural property
� High country station valuation
� Insurance valuations
� Luxury lodges
John Scobie
e [email protected] P +64 3 441 0778 m +64 275 648 843
sPecialist areas: � Valuation – commercial, tourism, managed apartments
and development land
� Insurance valuations
� property consultancy
tim thomas
e [email protected] P +64 3 450 0860 m +64 22 543 3210
sPecialist areas: � Residential valuation
� Insurance valuations
ProPertY manaGement
Angela Davis
e [email protected] P +64 3 441 0679 m +64 275 061 428
Korrena Mielke
e [email protected] P +64 3 441 0675 m +64 21 566 919
27

on the shores of lake wakatipu lies the village of Queenstown, a global destination for recreation, entertainment and natural splendor. and with the riches of the southland comes unprecedented opportunity for real estate investors and occupiers seeking to capitalize on the opportunities of the south island. with a real estate team whose expertise is as wide and deep as the valleys and lakes that surround us, Colliers leads the way.
colliers.co.nz/Queenstown
lake WakatipuQueenstown
291 sqkm
RemaRkable
Accelerating success.