queensland state natural hazard risk assessment 2017 part b · 26 a b c queensland state natural...
TRANSCRIPT

QUEENSLANDThe State context
B
23

Queensland State Natural Hazard Risk Assessment 2017
24
CBA QUEENSLAND CONTEXT
Geography
Queensland is the second largest state in Australia and covers more than 22% of the total Australian continent, an area of 1,730,648 square kilometres.
The coastline of mainland Queensland is approximately 6,973 kilometres long.
Queensland has a diverse landscape that is dominated by its extensive coastline which is home to more than 60% of its resident population.
Queensland is essentially a state of extensive plains which merge into high country of sharper relief to the east and north-west. To the north, the country falls gradually to meet the coastal plain
which reaches the Gulf of Carpentaria as a broad tract of salt flats.
The far north-west is occupied by a rugged uplands region, rich in minerals.
Eastward, the country rises towards the Great Dividing Range which runs from the southern border to the northern tip of the State and is the main watershed between the coastal and inland rivers.
East of the Great Dividing Range, the country drops seaward in a variety of ranges separated by lowlands.
This structure is continued in a chain of mountainous offshore islands sitting on the continental shelf.
Beyond them is the Great Barrier Reef, a series of coral formations stretching for about 2,000 kilometres.
Outback Queensland is in stark contrast to the coast with its vast landscape and mining country with flat plains that connect to the inner arid terrain of Central Australia.
Queensland shares its borders with the Northern Territory in the west, New South Wales to the south and South Australia in the south-west corner.
Figure 12Topographical map of Australia, illustrating the diversity of Queensland’s terrain.
Source: shutterstock.com/AridOcean

25
Queensland’s economy
Growth in the Queensland economy is forecast to strengthen over the coming years from 2.4% in 2015-16, to 2¾% in both 2016-17 and 2017-18, and 3% in 2018-19. The 2017-18 Budget is focused on supporting continued growth and creating jobs for Queensland, while enabling the State’s $300 billion economy to be more innovative, diverse and productive.
The 2017-18 Budget includes a range of measures which will boost productivity and support ongoing longer-term employment including significant infrastructure projects in both South East Queensland and regional Queensland as part of a $42.75 billion four year capital works program.
Operation Queensland Recovery is well underway to recover, reconnect and rebuild more resilient Queensland communities following Severe Tropical Cyclone (STC) Debbie. As at 2 June 2017, in the first two months after the cyclone, more than 118,000 people have been assisted.
Close to $30 million in assistance has already been distributed through the Personal Hardship Assistance Grants and Immediate Hardship Assistance Grants funded under the Natural Disaster Relief and Recovery Arrangements (NDRRA).
A $14.7 million Community Recovery Fund has been established and additional funding of $2 million has been provided for the government’s Go Local campaign to support the agricultural industry in disaster affected areas.
The Queensland Government is also expecting to spend over $1 billion to restore essential public assets before reimbursements from the Australian Government through the jointly-funded NDRRA. This investment will rebuild vital infrastructure and supporting communities and stimulate significant short term construction activity and jobs in these regions.
More importantly, however, it will re-establish productivity enhancing infrastructure and restore the productive capacity of affected economies, thereby supporting ongoing growth and employment across the State.
As noted above, the Queensland economy is forecast to strengthen, from the 2.4% recorded in 2015-16, to 2¾% in both 2016-17 and 2017-18, and 3% in 2018-19. Based on forecasts by the Australian Treasury, this is stronger than expected national gross domestic product (GDP) growth of 1¾% in 2016-17 and in line with it in 2017-18 and 2018-19.
Queensland growth forecasts for 2016-17 and 2017-18 would have been higher but for the impact of STC Debbie, which is estimated to have detracted around $2 billion or ¾ percentage point from economic growth across these years.
Major impacts from STC Debbie include the loss of around 10 million tonnes of coal exports due to damaged rail infrastructure, around $300 million of losses to sugar exports and a considerable hit to tourism in the Whitsundays region. With the impact of the resources boom largely reflected in exports and population growth broadly in line with the national rate, Queensland’s gross state product growth (GSP) is expected to remain in line with national growth in the projection years, at 3%.
Business investment continues to adjust in 2016-17 from the record levels experienced during the Liquefied Natural Gas (LNG) construction boom. Despite bright spots in tourism and education and ongoing spending in the coal seam gas (CSG) sector, business investment in Queensland is expected to be broadly unchanged in 2017-18, before returning to moderate growth from 2018-19 onward, consistent with the national growth profile.
Overseas exports are expected to grow solidly over the forecast period, generally between 3% and 4% per annum. In addition to the long-expected ramp up in LNG exports, coal exports are expected to recover from the fall in 2016-17 induced by STC Debbie.
The 2017-18 Budget features a range of further initiatives aimed at optimising the use of the State’s land and natural resources, including promoting exploration and mining activities through the $27.1 million Strategic Resources Exploration Program.
Key elements of this initiative also form part of the government’s overall package of $39 million over four years to deliver initiatives to support the North West Minerals Province, including implementation of the Queensland Government’s Strategic Blueprint aimed at facilitating a strong and prosperous future for the region.
To protect the State’s natural assets and ensure they continue to create wealth for current and future generations of Queenslanders, this Budget also allocates $175 million to improve water quality in the Great Barrier Reef, safeguard and respond to biosecurity related risks, and develop a Climate Change Strategy to assist Queensland to meet its national and international obligations related to CO2 emissions targets.
The government’s comprehensive Great Barrier Reef Water Quality Program, totalling $175 million over five years, is in addition to the $100 million provided in 2015-16 to address the recommendations arising from the Great Barrier Reef Water Science Taskforce. The Budget also includes $40 million to revitalise and leverage value from our national parks through increased tourism and other activities.
QUEENSLAND’S ECONOMY

26
CBA
Queensland State Natural Hazard Risk Assessment 2017
QUEENSLAND CONTEXT
Queensland’s economic growth is estimated to strengthen to 2¾% in both 2016-17 and 2017-18, with the ramp-up in LNG shipments continuing to boost overseas exports. This improvement is despite the impact of STC Debbie, which is estimated to have detracted around ¾ percentage point from economic growth across these two years.
GSP growth is forecast to strengthen further to 3% in 2018-19, with an anticipated recovery in business investment and a solid contribution from public sector capital spending supporting stronger domestic activity, as LNG exports plateau.
With the exception of the period of the GFC and natural disasters, Queensland has traditionally recorded economic growth rates above that nationally, underpinned by sustained resources sector investment and exports, as well as stronger population growth.
With these trends becoming less dominant and as growth becomes more broad-based across the major components of domestic demand, growth in Queensland is expected to remain in line with national growth in the projection years, at 3%.
Figure 13Severe Tropical Cyclone Debbie approaches the Queensland coast in March 2017.
Source: National Aeronautics and Space Administration
Sources of information
Information in this section was sourced from the Queensland Treasury and Queensland Government’s 2017-18 State Budget Papers.
www.treasury.qld.gov.au/economy/the-queensland-economy www.budget.qld.gov.au

Economic impacts of Severe Tropical Cyclone Debbie
On Tuesday 28 March 2017, Category 4 Severve Tropical Cyclone (STC) Debbie crossed the Queensland coast around Airlie Beach, then tracked southwest over the next few hours before being downgraded to a tropical low the following day.
STC Debbie inflicted significant structural damage to properties in the Whitsunday Islands, Airlie Beach and Proserpine and dumped a substantial amount of rainfall across the central coast, highlands and coalfields all the way down to the southeast coast regions of Queensland and into New South Wales.
STC Debbie caused damage and distress to households, businesses and public facilities, and the recovery and repair will take an extended time. This assessment is focused on estimating the impact of the cyclone on overall economic output (as measured by GSP). This primarily involves examining any impact on Queensland’s resources and agricultural production, as well as on the State’s tourism sector. Impacts on the State Budget include the costs to rebuild damaged roads and local government infrastructure, providing assistance to individuals, families and businesses impacted by the disasters.
Overall, the loss to economic output due to STC Debbie is estimated to be around $2 billion or ¾ percentage point of GSP. Losses will be spread across several financial years, but predominantly in 2016-17 and 2017-18. Key sectors impacted include coal exports and agricultural production, as well as tourism in the Whitsundays.
Coal exports
Unlike the 2010-11 natural disasters, when losses were estimated to have reached $6 billion largely due to mine flooding, there have been no reports of substantial damage to mines or ports infrastructure.
The largest impact on coal exports was damage to rail networks, which included:
• the Goonyella network, closed from 28 March to 26 April
• the Blackwater network, closed from 29 March to 10 April
• the Moura network, closed from 29 March to 12 April
• the Newlands network, closed from 28 March to 13 April.
Overall, the effect of these closures is estimated to result in a net loss in exports of around 10 million tonnes in June quarter 2017, with approximately two-thirds hard coking coal and the remainder thermal coal.
Agriculture
The Mackay-Isaac-Whitsunday region is a significant agricultural region, with $1.1 billion of agricultural production in 2014-15, 9.4% of the Queensland total. The region’s most valuable agricultural products in that year were beef ($485 million), sugar ($354 million), vegetables ($176 million) and grain sorghum ($64 million).
Looking at losses from previous similar events, such as STC Ului in 2010, Queensland Treasury expects losses in the nominal value of sugar exports due to STC Debbie to be around $300 million in the 2018 calendar year. Sorghum exports are expected to be reduced by $37 million in 2017-18.
However, better water availability is expected to boost wheat and chickpea exports in 2018 and dried shelled beans exports in 2017-18. In addition, despite some impact on fences and other farm infrastructure, graziers in the affected regions largely welcomed the rain accompanying STC Debbie, which in the longer term will assist herd rebuilding following a sustained period of drought.
Tourism
STC Debbie directly impacted the Whitsundays tourism region, including Airlie Beach and Whitsunday Island resorts. Overnight visitors spent an estimated $709 million in the Whitsundays region in 2016 (3.6% of the Queensland total), including spending by 243,000 international and 396,000 domestic tourists.
While no firm estimates of losses have been produced by the industry, Queensland Treasury assumes losses to overseas and interstate tourism of approximately $150 million. The loss of key resort capacity includes:
• Hamilton Island: no significant structural damage, partially re-opened on 8 April, then gradually to return to full capacity from August 2017
• Daydream Island: decided to bring forward $50 million redevelopment, reopening in mid-2018
• Hayman Island: closed and unable to accept new reservations until mid-2018.
Sound pricing of risk and strong investment performance has put the Queensland Government Insurance Fund (QGIF) in a good financial position, with investments held exceeding the provisioning for claims. As a result, $500 million will be drawn from the QGIF surplus to assist in funding the government’s response to STC Debbie. On current estimates, this will still leave a substantial surplus in QGIF to respond to future claims.
The Queensland Government will contribute $110 million towards a proposed joint $220 million funding package under the Commonwealth and State-funded NDRRA Category D following STC Debbie.
27
ECONOMIC IMPACTS OF STC DEBBIE

Queensland State Natural Hazard Risk Assessment 2017
28
CBA QUEENSLAND CONTEXT
Queensland’s economic sectors
Queensland has significant endowments of natural resources, including minerals, land, water, reefs and its unique natural landscape and heritage. Importantly, key industries relying directly on the use of Queensland’s land and natural resources are comparatively more important to regional Queensland, with mining, agriculture, forestry and fishing collectively accounting for only 2% of direct total employment in South East Queensland but nearly 12% in the rest of the State.
In addition, the Queensland tourism industry is linked closely to the State’s natural assets (e.g. Great Barrier Reef, national parks, beaches and waterways and outback), many of which are located in regional areas.
Queensland has a modern, diversified economy, underpinned by strong sectors including agriculture, resources, construction, tourism, manufacturing and services.
Queensland’s agriculture sector
Agriculture provides the original base for the development of the Queensland economy, accounting for 2.5% of the State’s economy and employing over 57,000 Queenslanders. More than half of Queensland’s agriculture output is produced in the Darling Downs-Maranoa, Queensland-Outback, Fitzroy and Wide Bay regions.
More than half of the value of Queensland agricultural production is derived from meat (mainly beef) and sugar, however these commodities have been supplemented by a large range of other agricultural products including vegetables, fruit and nuts, and crops such as wheat, sorghum and barley. The bulk of Queensland’s agricultural commodities are produced for export, providing a significant contribution to the State’s foreign earnings.
Queensland exported $9.1 billion of rural commodities in 2014-15, with the US, Japan and China accounting for over half of that trade.
The industry is sensitive to several external factors including weather events such as droughts, cyclones and flood events, as well as currency movements. Almost 70% of Queensland is currently drought declared and, if these conditions remain more protracted than assumed, this could impact on the production and export of key agricultural commodities.
Queensland’s resources sector
The resources sector has been a key driver of growth in Queensland. The State’s coal and bauxite reserves are among the largest in the world, and are generally of a high grade and easily accessible. Queensland is the world’s largest seaborne exporter of metallurgical coal, with total coal exports exceeding 220 million tonnes in 2014-15.
Queensland also has well-developed coal and minerals industries while the natural gas industry, which has been operating domestically since the 1960s, has undergone rapid expansion and transformation into a major international export sector. The main minerals produced in Queensland are bauxite, copper, zinc, lead, silver and gold, although a wide variety of minerals are produced in the State.
Queensland’s construction sector
Construction is another key driver of the Queensland economy. During 2014-15, the sector employed around 217,000 workers, making it the State’s third largest employer accounting for 11.1% of the Queensland economy (the largest contribution to total state output).
Based on the Australian Bureau of Statistics, the three broad classes of construction include engineering
construction (mines, ports, roads, bridges, rail and other infrastructure), non-residential building (shops, offices, factories, schools, hospitals, churches and theatres) and residential building (new houses, units, apartments and renovations).
Engineering construction work done totalled $28.1 billion in 2014-15, while non-residential construction work done totalled $6.8 billion in the same time period. In addition, residential construction work totalled $10.9 billion in 2014-15, with 21,102 new detached houses completed, along with 16,109 other dwellings, such as apartments and townhouses.
Queensland’s tourism sector
Queensland boasts many natural attractions, including the Great Barrier Reef, extensive beaches, island resorts and tropical rainforests, as well as cosmopolitan cities and a unique countryside. International and domestic tourism will always play an important role in Queensland’s economy. Rather than being a distinct industry, tourism economic activity covers a wide range of industries including accommodation, cafes and restaurants, transport services, retail trade and cultural and recreation services.
Queensland is Australia’s second largest tourism market after New South Wales, accounting for 24.6% of the national tourism output and employing around 130,900 people.
Tourists visiting Queensland come from a diverse range of countries and from different regions within Australia. While international tourism generally gains most attention, it is actually domestic tourists that have the largest impact, accounting for more than two-thirds of total nights spent by tourists in Queensland.
Sources of information
Information in this section was sourced from the Queensland Treasury website.
www.treasury.qld.gov.au/economy/the-queensland-economy

29
Community
Australia’s estimated resident population reached 24.1 million at 30 June 2016, increasing by 337,800 people or 1.4% since 30 June 2015. This growth rate was unchanged from 2014-15.
All states and territories experienced population growth between 2015 and 2016. Victoria had the greatest growth (123,100 people), followed by New South Wales (105,600) and Queensland (64,700).
Queensland’s population is now more than 4,800,000 persons, accounting for over 20% of Australia’s total population. Queensland was Australia’s third largest state by population behind New South Wales and Victoria.
Pimpama on Queensland’s Gold Coast recorded the second highest population growth rate in 2015-2016 at 35%.
Figure 14This map shows the change in population between 2015 and 2016 using the Australian Bureau of Statistics’ Statistical Areas Level 2 (SA2s); all states and territories experienced population growth.
Source: Australian Bureau of Statistics
ECONOMIC SECTORS AND COMMUNITY

Queensland State Natural Hazard Risk Assessment 2017
30
CBA QUEENSLAND CONTEXT
Between the 2006 and 2011 Census, the proportion of Queensland residents born overseas increased from 17.9% to 20.5% in the five years to 2011. In 2011, the main languages other than English spoken at home were Mandarin (0.9% of the population), followed by Cantonese (0.5%) and Vietnamese (0.5%).
On Census night in 2011, approximately two-thirds (66.8%) of households in occupied private dwellings included family groups. The mix of household types has remained steady since 2001. In each of the three Census years 2001, 2006 and 2011, approximately four in 10 private dwellings occupied on Census night housed a family with one or more children (of any age and not necessarily dependent). There was a small increase in the proportion of couples without children over the 10 years to 2011, from 25.3% to 26.6%.
The Queensland population is projected to grow to between 6.2 million and 7.3 million persons by 2036, and to between 8 million and 11.3 million by 2061. Annual growth rates are projected to range between 1.2% and 1.9% in 2036, declining to between 0.9% and 1.6% by 2061.
Net overseas migration is projected to continue to make a significant contribution to Queensland’s population, adding between 1.9 and 2.9 million persons by 2061. Natural increase is projected to add between 1.2 and 3 million, with net interstate migration adding between 450,000 and 920,000 persons.
While numbers of people in all age groups are projected to increase, the age structure of Queensland’s population is projected to change significantly in the 50-year period to 2061.
The number of people aged 65 years and over is projected to more than double by 2036, from 580,000 persons in 2011 to between 1.3 and 1.4 million persons. Further increases to between 2.0 and 2.6 million are projected by 2061. In 2011, this age group represented 13.0% of the total population.
This proportion is projected to increase to between 19.1% and 21.0% in 2036 and between 22.8% and 25.0% by 2061.
Despite the growth in older persons, the number of people aged 0 to 14 years
is projected to increase from 892,000 persons in 2011 to between 1.3 and 2.2 million persons by 2061.
Gold Coast is projected to remain the most populous region in Queensland, increasing from 529,000 persons in 2011 to 883,000 persons by 2036. The Ipswich region is projected to have the second largest population in 2036 (increasing from 291,000 to 670,000 persons). Logan–Beaudesert is projected to have the next largest population in 2036, followed by Sunshine Coast, Brisbane’s south and Brisbane’s inner city (refer Figure 15).
Figure 15Projected population, medium series, at 30 June, Queensland SA4s.
Source: Queensland Government Statistician’s Office
SA4Population Population change
2011–20362011 2036
– 000s – 000s
Brisbane–East 219.0 271.6 52.5
Brisbane–North 198.5 250.7 52.2
Brisbane–South 328.8 416.5 87.8
Brisbane–West 178.1 200.2 22.1
Brisbane Inner City 236.8 389.1 132.4
Cairns 232.8 324.8 92.0
Darling Downs–Maranoa 125.3 147.3 22.0
Fitzroy 217.1 324.2 107.1
Gold Coast 528.8 882.6 353.8
Ipswich 291.1 669.8 378.8
Logan–Beaudesert 300.2 522.2 222.0
Mackay 171.6 249.9 78.3
Moreton Bay–North 222.3 367.8 145.5
Moreton Bay–South 172.8 258.6 85.8
Queensland–Outback 86.6 96.8 10.2
Sunshine Coast 318.3 514.9 196.6
Toowoomba 144.3 197.5 53.2
Townsville 224.7 333.8 109.2
Wide Bay 280.0 364.8 84.8
Sources of information
Information in this section was sourced from:
Australian Bureau of Statistics. Regional Population Growth, Australia, 2015-16, available at: www.abs.gov.au
Queensland Statistician’s Office. Queensland Government population projections, 2015 edition: Queensland and SA4s available at: www.qgso.qld.gov.au
31
QUEENSLAND’S STATE PLANNING POLICY
31
Queensland’s State Planning Policy
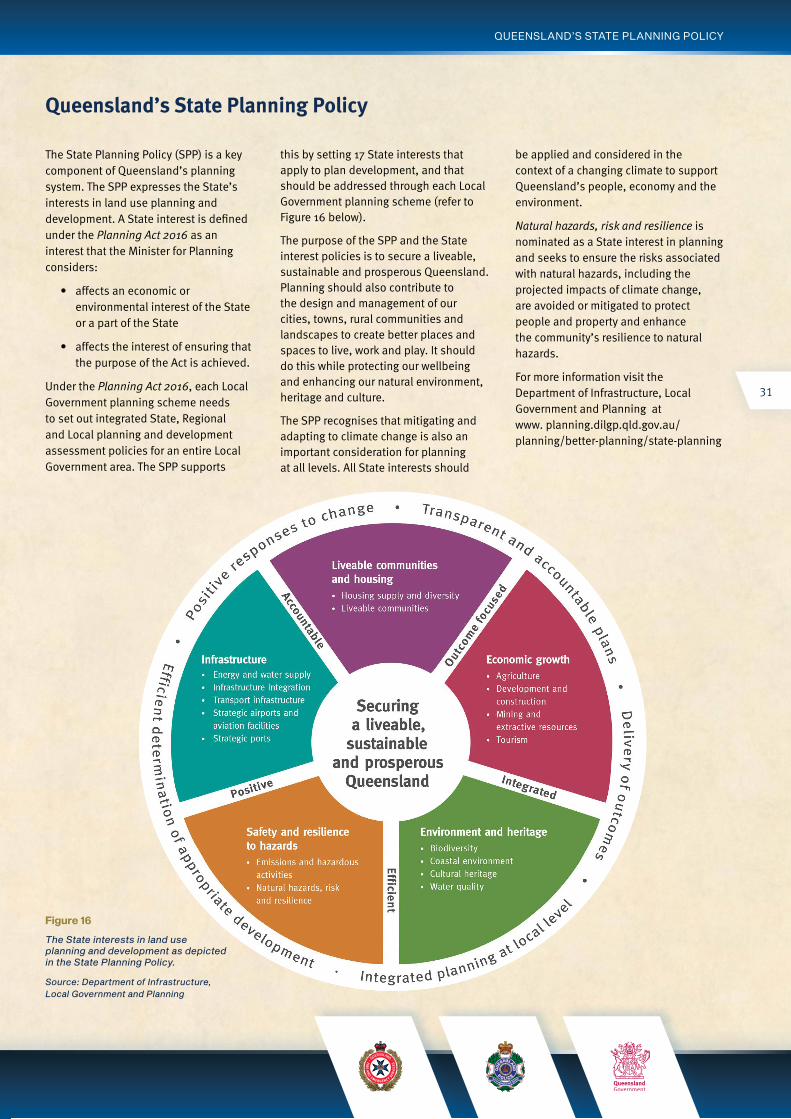
The State Planning Policy (SPP) is a key component of Queensland’s planning system. The SPP expresses the State’s interests in land use planning and development. A State interest is defined under the Planning Act 2016 as an interest that the Minister for Planning considers:
• affects an economic or environmental interest of the State or a part of the State
• affects the interest of ensuring that the purpose of the Act is achieved.
Under the Planning Act 2016, each Local Government planning scheme needs to set out integrated State, Regional and Local planning and development assessment policies for an entire Local Government area. The SPP supports
this by setting 17 State interests that apply to plan development, and that should be addressed through each Local Government planning scheme (refer to Figure 16 below).
The purpose of the SPP and the State interest policies is to secure a liveable, sustainable and prosperous Queensland. Planning should also contribute to the design and management of our cities, towns, rural communities and landscapes to create better places and spaces to live, work and play. It should do this while protecting our wellbeing and enhancing our natural environment, heritage and culture.
The SPP recognises that mitigating and adapting to climate change is also an important consideration for planning at all levels. All State interests should
be applied and considered in the context of a changing climate to support Queensland’s people, economy and the environment.
Natural hazards, risk and resilience is nominated as a State interest in planning and seeks to ensure the risks associated with natural hazards, including the projected impacts of climate change, are avoided or mitigated to protect people and property and enhance the community’s resilience to natural hazards.
For more information visit the Department of Infrastructure, Local Government and Planning at www. planning.dilgp.qld.gov.au/planning/better-planning/state-planning
Figure 16The State interests in land use planning and development as depicted in the State Planning Policy.
Source: Department of Infrastructure, Local Government and Planning

Queensland State Natural Hazard Risk Assessment 2017
32
CBA QUEENSLAND CONTEXT
Queensland is a vast state with great variations in climate, from the temperate south to the tropical north and the arid west. South East Queensland, which includes Brisbane and the Gold and Sunshine Coasts, experiences warm summers with average maximum temperatures of 29°C and winter maximum temperatures averaging 20°C. The Cape York region’s climate is tropical, with high to very high temperatures throughout the year.
Average maximum temperatures range from 32°C during December to February (the humid wet season) to 29°C from July to August. Western Queensland has a semi-arid to arid climate with very hot summers and warm, dry winters. The temperatures range from 37°C in summer to 24°C in winter.
Main climate influences
Australia’s climate can vary greatly from one year to the next. The schematic from the Australian Bureau of Meteorology (Figure 17) shows the main influences on the Australian climate, which have varying levels of impact in different regions at different times of year.
The following are the main – but not all – influences on the Queensland climate.
The Madden-Julian Oscillation
The Madden-Julian Oscillation (MJO) is associated with weekly to monthly periods of enhanced and suppressed rainfall over parts of Australia. It is a global-scale feature of the tropical atmosphere and is the major fluctuation in tropical weather on weekly to monthly timescales.
The MJO can be characterised as an eastward moving “pulse” of cloud and rainfall near the equator that typically recurs every 30 to 60 days. Tropical cyclones are also more likely to develop in association with certain phases of a strong MJO event.
The MJO has its greatest effect on the tropical areas of Australia during summer and can influence the timing and intensity of “active” monsoon periods in northern Australia. This can lead to enhanced rainfall in both the intensity and duration.
El Niño Southern Oscillation
The term El Niño refers to the extensive warming of the central and eastern tropical Pacific Ocean which leads to a major shift in weather patterns across the Pacific and occurs every three to eight years.
El Niño Southern Oscillation is the term used to describe the oscillation between the El Niño phase and the La Niña, or opposite, phase. They typically begin to develop during autumn, strengthen in winter/spring and then decay during summer and autumn of the following year.
El Niño events are associated with an increased risk of dry conditions across large areas of Australia. The period of strongest influence is the six months of winter/spring (June to November). The effects of El Niño events are not uniform with the greatest impacts usually over inland eastern Australia.
La Niña, El Niño’s opposite phase
La Niña conditions generally result in above average rainfall over much of Australia. La Niña is the positive phase of the El Niño Southern Oscillation.
It is associated with cooler than average sea surface temperatures in the central and eastern tropical Pacific Ocean. La Niña is normally associated with higher than average winter, spring and early summer rainfall over much of Australia.
Queensland’s climate
Figure 17Natural climate influences to Australia.
Source: Bureau of Meteorology

33
Figure 18These diagrams demonstrate the oscillation between the El Niño phase and the La Niña, or opposite, phase.
Source: Bureau of Meteorology
QUEENSLAND’S CLIMATE

Queensland State Natural Hazard Risk Assessment 2017
34
CBA QUEENSLAND CONTEXT
East coast low
East coast lows are intense low-pressure systems which occur on average several times each year off the eastern coast of Australia, in particular southern Queensland, New South Wales and eastern Victoria. East coast lows will often rapidly intensify overnight making them one of the more dangerous weather systems to affect the south-east Australian coast.
East coast lows can form at any time of year, however they are most common during autumn and winter with a maximum frequency in June. Individual east coast lows generally only last for a few days. East coast lows are generally associated with strong, gusty winds, sustained heavy rainfall and high seas. They can cause widespread damage over a very short period of time.
Easterly trough
The easterly, or inland, trough is a dominant feature of the synoptic pattern over Australia during the summer months and brings rainfall to central and inland parts of eastern Australia.
The trough is located on the inland side of the Great Dividing Range, forming a boundary between the moist air near the coast and dry air inland. It extends through central Queensland and central New South Wales, sometimes extending right down into northern Victoria.
It is partly formed by the intense heating of the land during the summer months and also is influenced by the topography of the region. Easterly trough begins to form as the land warms up, as such they are most common during the summer months, December to February.
While an easterly trough forms to the west of the Great Dividing Range, a ridge of higher pressure will also form along the coast. This is particularly evident when a high pressure system is located in the Tasman Sea and is accompanied by south-easterly winds along the Queensland coast.
The easterly trough is a major contributor to rainfall in eastern Australia. Rainfall can be particularly heavy when the trough interacts with other features, such as an upper level trough approaching from the west, or when on-shore flow is north-easterly and, as a result, the ridge of higher pressure to the windward side of the Great Dividing Range is absent.
Trade winds
Trade winds are the east to south- easterly winds which blow across much of the southern hemisphere tropics, affecting tropical to subtropical areas of Australia.
The diagram below (Figure 19) shows the trade winds as a part of the global circulation of the atmosphere.
The trade winds affect much of the northern and parts of eastern Australia. They collect moisture as they move eastward over the tropical Pacific Ocean towards the east coast of Australia and are associated with enhanced rainfall to tropical and sub-tropical areas of the east coast.
The trade winds blow all year round as they are a part of the general circulation of the atmosphere. However, they are strongest in the winter months when they have the greatest effect on conditions (generally dry and stable) over inland northern Australia and the top end. In the summer months, the sub-tropical ridge moves south, the trade winds weaken and the monsoon returns to northern Australia.
Figure 19This diagram shows the general circulation of the atmosphere. The trade winds in the southern hemisphere are located to the north of the string of high pressure systems seen over Australia. This region of high pressure is known as the sub-tropical ridge.
Source: Bureau of Meteorology
WESTWINDS
WESTWINDS
EAST WINDS
EAST WINDS
EAST WINDSMERIDIONAL CIRCULATION
Jetstream
Jetstream
Trade winds
Trade winds

35
LOCAL TOPIC IDENTIFIER
The flow of the trade winds occasionally becomes disturbed by features such as east coast lows and easterly troughs.
These moisture-rich winds are associated with enhanced rainfall over tropical and sub-tropical parts of the eastern seaboard. The elevated areas of the Great Dividing Range in northern New South Wales and Queensland are most affected. Australia’s wettest location, Mount Bellenden Kerr (1,545 metres above sea level) lies on the Great Dividing Range in the path of the trade winds between Cairns and Innisfail, and has an average annual rainfall of 7,708 millimetres.
During the winter months, the trade winds extend through the northern parts of the continent. These dry (continental) winds are thus associated with drier and more stable (fine and sunny) conditions over inland northern Australia, particularly the top end.
Tropical depression
Tropical depressions bring heavy rainfall to affected parts of northern Australia.
Tropical depressions are moderate- strength low pressure systems which occur in the tropics, often in association with the monsoon trough. Tropical depressions are stronger in intensity than weak tropical lows, but are not as strong as tropical cyclones, though they may develop into a tropical cyclone if they remain in the right conditions for long enough. A weakening tropical cyclone is also referred to as a tropical depression once it has decayed to below Category 1 strength.
Tropical depressions can affect Australia at any time between about October to April and can last from a day to a couple of weeks, depending on the environmental conditions. Tropical depressions are associated with occasional thunderstorms, fresh to strong and gusty winds and heavy rain, often leading to the flooding of affected areas.
Sub-tropical ridge
The sub-tropical ridge brings dry and stable conditions to large parts of Australia. The sub-tropical ridge runs across a belt of high pressure that encircles the globe in the middle latitudes. It is part of the global circulation of the atmosphere, as shown in Figure 20 overpage.
The position of the sub-tropical ridge plays an important part in the way the weather in Australia varies from season to season. During the warmer half of the year in southern Australia (November to April), the sub-tropical ridge is generally located to the south of the continent. High pressure systems (also called anticyclones), which are associated with stable and dry conditions, generally move eastwards along the ridge.
In autumn the sub-tropical ridge moves north and remains over the Australian continent for most of the colder half of the year in southern Australia (May to October). Conditions along the ridge, under the influence of the high pressure systems’ dry and descending air, tend to be stable and drier.
The sub-tropical ridge is a dynamic feature of the atmospheric circulation, which is present all year round. It is a broadscale feature and, as such, it affects much of Australia. This effect is greatest however over central Australia, where the sub-tropical ridge is dominant for most of the year.
As the sub-tropical ridge moves south during the warmer part of the year in southern Australia, the monsoon trough moves over the northern part of the continent. The southward movement of the sub-tropical ridge is related – through the atmospheric circulation – to the development of the monsoon trough, which brings cloud and rain to northern Australia.
Conversely, as autumn/winter arrives in southern Australia, the south- easterly trade winds begin to dominate the weather in the north of the country. During this time, the monsoon trough is pushed back towards the northern hemisphere and conditions become more settled in northern Australia (generally fine and sunny).
Monsoon
Monsoon is used to describe the seasonal reversal of winds that occurs over parts of the tropics and is part of the usual evolution of the seasons in northern Australia.
Active phases of the monsoon bring heavy rainfall to northern Australia. In northern Australia, the prevailing wind is from the east or south-east for most of the year, but during active monsoon periods (occurring any time during November to April) the winds shift to become north-westerly at the surface.
As the Australian summer approaches and the continent heats up, low pressure is created, which effectively draws the monsoon trough – a zone of low pressure and rising air – over northern Australia. This trough draws in moist air from the surrounding oceans and this influx of moist air is referred to as the monsoon.
The monsoon can be in either an active or inactive phase. The active phase is usually associated with broad areas of cloud and rain, with sustained moderate to fresh north-westerly winds on the north side of the trough. Widespread heavy rainfall can result if the trough is close to, or over, land. An inactive or “break” period occurs when the monsoon trough temporarily weakens or retreats north of Australia. It is characterised by light winds and isolated shower and thunderstorm activity, sometimes with gusty squall lines.
QUEENSLAND’S CLIMATE

Queensland State Natural Hazard Risk Assessment 2017
36
CBA QUEENSLAND CONTEXT
Transitions from active to inactive monsoon phases may be associated with the Madden-Julian Oscillation, a large-scale slow-moving band of increased cloudiness that travels eastwards in the tropics and discussed earlier in this section.
The monsoon trough frequently spawns individual low pressure systems, producing heavy rain and flooding.
The northern wet season extends from about October to April in the far north of the Northern Territory, but generally starts later and ends earlier elsewhere.
Active monsoon periods may occur at any time during this period, however the initial monsoon onset, as defined by the reversal of the winds, normally occurs in late December around Darwin. Later than normal onsets are often associated with El Niño conditions in the Pacific Ocean, while La Niña is usually associated with an early onset.
A typical wet season consists of a prolonged inactive period during the buildup (period before initial onset), followed by two or three active/inactive cycles, each full cycle lasting from about four to eight weeks. Inactive periods are usually longer than active ones.
The monsoon is associated with cloudy conditions, lengthy periods of heavy rain, occasional thunderstorms and fresh to strong squally winds. This often causes flooding in affected areas.
Figure 20This diagram shows the synoptic patterns typically associated with the active phase of the north Australian monsoon. The dashed red line indicates the position of the monsoon trough, which will shift slightly as weather systems progress across the continent. The monsoon trough is an area of low pressure along which broad-scale convergence and convection occurs.
Source: Bureau of Meteorology
Sources of information
Information in this section was sourced from the Australian Bureau of Meteorology.
www.bom.gov.au

37
The Climate Council of Australia has noted that the basic physics that govern the behaviour of the climate system show that extreme weather events are now occurring in a significantly warmer and wetter atmosphere. This means the atmosphere contains more energy, facilitating more severe extreme weather.
The State of the Climate 2016 report written by the Commonwealth Scientific and Industrial Research Organisation (CSIRO) and Australian Bureau of Meteorology (BoM) highlights the key impacts of climate change for Australia:
• the climate has warmed in both mean surface air temperature and surrounding sea surface temperature by around 1°C since 1910
• the duration, frequency and intensity of extreme heat events across large parts of Australia has increased
• extreme fire weather, and a longer fire season, across large parts of Australia has increased since the 1970s
• rainfall has reduced by around 19% during the May to July period in the south-west of Australia since 1970
• rainfall has declined by about 11% in the April to October growing season in the continental south-east since the 1990s
• rainfall has increased across parts of northern Australia since the 1970s
• oceans around Australia have warmed and ocean acidity levels have increased
• sea levels have risen around Australia which amplifies the effects of high tides and storm surges.
How will climate change affect Queensland?
The State will experience higher temperatures, hotter and more frequent hot days, harsher fire weather, fewer frosts, reduced rainfall in the south-east, more intense downpours, less frequent but more intense tropical cyclones in the north, rising sea level, more frequent sea level extremes, warmer and more acidic seas. Climate change is influencing all extreme weather events in Australia as these events are now occurring in an atmosphere that is warmer and wetter than it was in the 1950s:
• heatwaves are becoming hotter, lasting longer and occurring more often
• extreme fire weather and the length of the fire season is increasing, leading to an increase in the probability of bushfire, particularly for southern and eastern Australia
• the sea level has already risen and continues to rise, driving more coastal inundation during storm surges.
These extreme weather events are projected to worsen as the climate warms further:
• extreme heat is projected to increase across the entire continent, with significant increases in the length, intensity and frequency of heatwaves in many regions
• the time spent in drought is projected to increase across Australia, especially in southern Australia with extreme drought expected to increase in both frequency and duration
• southern and eastern Australia are projected to experience harsher fire weather
• the intensity of extreme rainfall events is projected to increase across most of Australia
• the increase in coastal flooding from high sea level events will become more frequent and more severe as sea levels continue to rise.
Climate change projections
CLIMATE CHANGE PROJECTIONS
Figure 21This diagram shows how a small increase in average temperature has a large impact on the prevalence of extreme heat.
Source: Climate Council

Queensland State Natural Hazard Risk Assessment 2017
38
CBA QUEENSLAND CONTEXT
The Queensland Government has allocated $15 million from 2015 to 2018 to tackle climate change impacts.
Queensland is working with a broad group of partners to develop and implement the Queensland Climate
Adaptation Strategy (Q-CAS) and roll out the Climate Change (Coastal Hazards) Adaptation Program (CHAP) in partnership with the Local Government Association of Queensland and coastal councils.
Figure 22Summary of climate change effects on Australia.
Source: Bureau of Meteorology
22 Future climate
Future climate
Key points• Australian temperatures are
projected to continue increasing with more extremely hot days and fewer extremely cool days.
• An increase in the number of days with weather conducive to fire in southern and eastern Australia is projected.
• Extreme rainfall events are likely to increase in intensity by the end of the century across most of Australia.
• Winter and spring rainfall is projected to decrease across southern continental Australia, with more time spent in drought.
• Projections suggest fewer tropical cyclones will form in the southern hemisphere than are currently observed, but a higher proportion of those will be more intense, with ongoing large variability from decade to decade.
• Past and ongoing emissions commit us to further sea-level rise around Australia in coming decades, with ongoing sea-level rise projected.
• Oceans around Australia will warm further and acidification will continue—with significant impacts on marine ecosystems.
Observed regional trends in rainfall and temperature can seem small when compared to daily, monthly and seasonal climate variability. However, such changes in the average climate, experienced over multiple decades, can have a large influence on ecosystems, agriculture and the built environment. In particular, the changing nature of rainfall and temperature extremes can have a noticeable impact.
As Australia’s climate evolves, a number of long-term changes, such as an increase in mean temperatures, are almost certain. The degree of change in temperature over the next few decades is relatively clear, while the extent to which the climate will change later in the century depends on the level of emissions now and into the future.
The Bureau of Meteorology and CSIRO, with other research institutions around Australia, have recently completed Climate Change in Australia, which describes likely changes to Australia’s climate over the coming century. The report and accompanying interactive materials are available at www.climatechangeinaustralia.gov.au.
Why are Australia and the globe warming?Energy comes from the Sun. In order to maintain stable temperatures at the Earth’s surface, in the long run this incoming energy must be balanced by an equal amount of heat radiated back to space. Greenhouse gases in the atmosphere, such as carbon dioxide, act to increase the temperature of the Earth’s surface, ocean and the atmosphere, by making it harder for the Earth to radiate this heat. This is called the greenhouse effect. Without any greenhouse gases, the Earth’s surface would be much colder, with an average temperature of about -18 °C. For centuries prior to industrialisation the incoming sunlight and outgoing heat were balanced and global average temperatures were relatively steady, at a little under 15 °C. Now, mostly because of the burning of fossil fuels and changes in land use, the concentrations of greenhouse gases in the atmosphere are rising and causing surface temperatures to increase. There is now an energy imbalance at the Earth’s surface of 0.65–0.80 Wm-2 (averaged globally). The atmosphere and oceans will continue to warm until enough extra heat can escape to space to allow the Earth to return to balance. Because carbon dioxide increases persist in the atmosphere for hundreds of years, further warming and sea-level rise is locked in.
Sources of information
Information in this section was sourced from the Climate Change in Australia report and State of the Climate 2016 report by CSIRO and BoM, and the Climate Council of Australia.
The Climate Change in Australia report, as well as accompanying interactive materials can be found at: www.climatechangeinaustralia.gov.au
The State of the Climate 2016 report can be found at: www.bom.gov.au/state-of-the-climate
The Climate Council of Australia’s website is at: www.climatecouncil.org.au
Additional information about Queensland’s natural climate influencers can be found at: www.bom.gov.au