queensland spatial educators’ toolkit€¦ · the queensland spatial educators’ toolkit (qset)...
TRANSCRIPT
Queensland Spatial Educators’ Toolkit for the Queensland Geography General Senior Syllabus (2019)
Senior secondary (Year 11 – Year 12) January 2020
Queensland Spatial Educators’ Toolkit Senior Secondary i
Version history
Date Version Author Notes
December 2015 1.0 QSIC Document first published
December 2017 1.1 QSIC Websites updated
December 2018 2.0 QSIC Revised in line with 2019 Queensland Senior Geography Syllabus
September 2019 2.1 QSIC Websites updated
January 2020 2.2 QSIC Updated weblinks Contact for enquires This publication has been compiled by the Queensland Spatial Information Council, Department of Natural Resources, Mines and Energy, State of Queensland. All enquiries regarding this document should be directed to: QSIC Office, Land & Spatial Information Department of Natural Resources and Mines Phone: 07 3330 4479 Email: [email protected] Copyright © The State of Queensland 2020
The Queensland Government supports and encourages the distribution of its material.
Unless otherwise noted, all copyright material is licensed under a Creative Commons Attribution 4.0 International licence (CC BY 4.0).
You are free to use copyright material that is covered by a CC BY licence in line with the licence terms. You must keep the copyright notice on the copyright material and attribute the State of Queensland as the source of the copyright material. For more information on this licence visit http://creativecommons.org/licenses/by/4.0 Information Security This document has been classified using the Queensland Government Information Security Classification Framework (QGISCF) as PUBLIC and will be managed according the requirements of the QGISCF.
Queensland Spatial Educators’ Toolkit Senior Secondary ii
Introduction ........................................................................................................................................... iii
Toolkit structure ................................................................................................................................... iii
Using the toolkit ................................................................................................................................... iii
Unit 1: Responding to risk and vulnerability in hazard zones ........................................................ 1
Topic 1: Natural hazard zones ........................................................................................................... 1
Topic 2: Ecological hazard zones ...................................................................................................... 4
Unit 2: Planning sustainable places .................................................................................................. 6
Topic 1: Responding to challenges facing a place in Australia ..................................................... 6
Topic 2: Managing challenges facing a megacity ......................................................................... 11
Unit 3: Responding to land cover transformations ........................................................................ 13
Topic 1: Land cover transformations and climate change ........................................................... 13
Topic 2: Responding to local land cover transformations ............................................................ 17
Unit 4: Managing population change ............................................................................................... 20
Topic 1: Population challenges in Australia ................................................................................... 20
Topic 2: Global population change .................................................................................................. 23

Queensland Spatial Educators’ Toolkit Senior Secondary iii
Introduction The Queensland Spatial Educators’ Toolkit (QSET) is designed to inspire classroom teachers with ideas on how to use spatial technologies in the classroom while meeting the requirements of the Queensland Geography General Senior Syllabus 2019.
Toolkit structure The Geographic Inquiry model has been part of the Queensland Geography General Senior Syllabus for many years and a modified version is being used in the current version of the syllabus as a framework for investigation.
Key and focus questions have been developed to help structure this the units and topics in this toolkit.
Ferny Grove State High School’s David McCauley, writing for the Geography Teachers Association of Queensland, outlines the inquiry approachi in Queensland geography classrooms. The Australian Geography Teachers Association’s Geogspace site also has a resource dedicated to Geographic inquiryii.
Using the toolkit Every school will have a different way of organising their units of work although there will be common elements across all classrooms. Look for opportunities to take teaching strategies from QSET and integrate those into your own work program and units. You can select those activities that fit with your work program, are appropriate for your classroom and can slot into your existing units with little reorganisation.
If you need to completely rewrite your units, you could use our structure, in conjunction with the resources provided, as a starting point.
i https://drive.google.com/file/d/0BxD8DSqqwrVkczNvUGF2SVlRbGM/view?usp=sharing ii http://www.geogspace.edu.au/support-units/geographical-inquiry/gi-introduction.html
Queensland Spatial Educators’ Toolkit Senior Secondary 1
Unit 1: Responding to risk and vulnerability in hazard zones Topic 1: Natural hazard zones Key inquiry questions
• What and where are the issues or patterns being studied? o What are natural hazards and natural hazard zones? o Where are different natural hazard zones found? o What patterns are evident in the occurrence of hazards?
• How and why do these issues or patterns develop? o What processes affect hazard formation? o What processes affect hazard severity? o How are the processes a work in catchments operating to cause change? o Why do catchment management problems occur?
• What are the impacts of these patterns and issues? o What are the social, economic, political and environmental impacts of hazards? o How can the impacts of hazards be prioritised?
• What is being done or what could be done to sustainably manage these impacts? o How can we mitigate against the negative impacts of hazards? o What is being and what could be done to manage hazard impacts by individuals, groups,
and governments?

Queensland Spatial Educators’ Toolkit Senior Secondary 2
Topic 1 toolkit What and where are the issues or patterns being studied?
Learning experiences and teaching strategies Spatial resources
Use the USGS Latest Earthquake map to view recent earthquakes (or historical) or to search for earthquakes in a particular period of time. Examine their distribution and compare that to plate boundaries and volcanoes where you can get that data. This information can be downloaded into a table and imported into another mapping tool if desired.
USGS Latest Earthquake mapi
Use the Queensland Government’s Floodcheck tool to simulate and examine the flood risk at various Queensland locations.
DNRME Floodcheckii
View rainfall distribution maps for Australia to determine which areas have rainfall deficiencies over time and are more likely to experience and drought conditions.
Bureau of Meteorology (rainfall deficiencies)iii DNRME Water Monitoring Portaliv
Find information on current and past natural disaster and natural hazard events and view information on each hazard, likely impacts, exposure and regional information about each hazard.
Pacific Disaster Centre Disaster Alertv
Review where in the world would be affected by the OPCC recommended 1m sea level rise by 2100. How would your current house be affected? What about your school? How would your nearest town/city be affected?
Flood fire treevi
Examine the location of global eruptions, earthquakes and emissions from 1960-2017 with this tool.
Smithsonian: Eruptions, earthquakes and emissionsvii
How and why do these issues or patterns develop? Learning experiences and teaching strategies Spatial resources
Use the Queensland Government’s Floodcheck tool to simulate and examine the flood risk at various Queensland locations. Look for the ‘simulations’ tab to select your location and run the simulation. You can also view historical flood data, including imagery, for Brisbane (1893, 1974 and 2011), Ipswich (1974 and 2011) and Roma (2011).
DNRME Floodcheckviii
View rainfall distribution maps for Australia to determine which areas have rainfall deficiencies over time and are more likely to experience drought conditions.
Bureau of Meteorology (rainfall deficiencies)ix DNRME Water Monitoring Portalx
Use National Geographic’s Mapmaker Interactive to overlay volcanoes, earthquakes and plate boundaries to demonstrate the connections between all three features.
National Geographic Mapmaker Interactivexi
View current or historic bushfire events across Australia using the Sentinel bushfire mapper. View weather data, topography, land use, economic value and other data relevant to the bushfire hazard.
Digital Earth Australia Hotspotsxii
Examine the distribution of different hazards globally as well as information on each country’s mitigation potential for natural hazards. Use the tool to evaluate risk of living in each of the following cities: Brisbane, Tokyo, Tehran and Dublin.
Global Risk Mapxiii
Queensland Spatial Educators’ Toolkit Senior Secondary 3
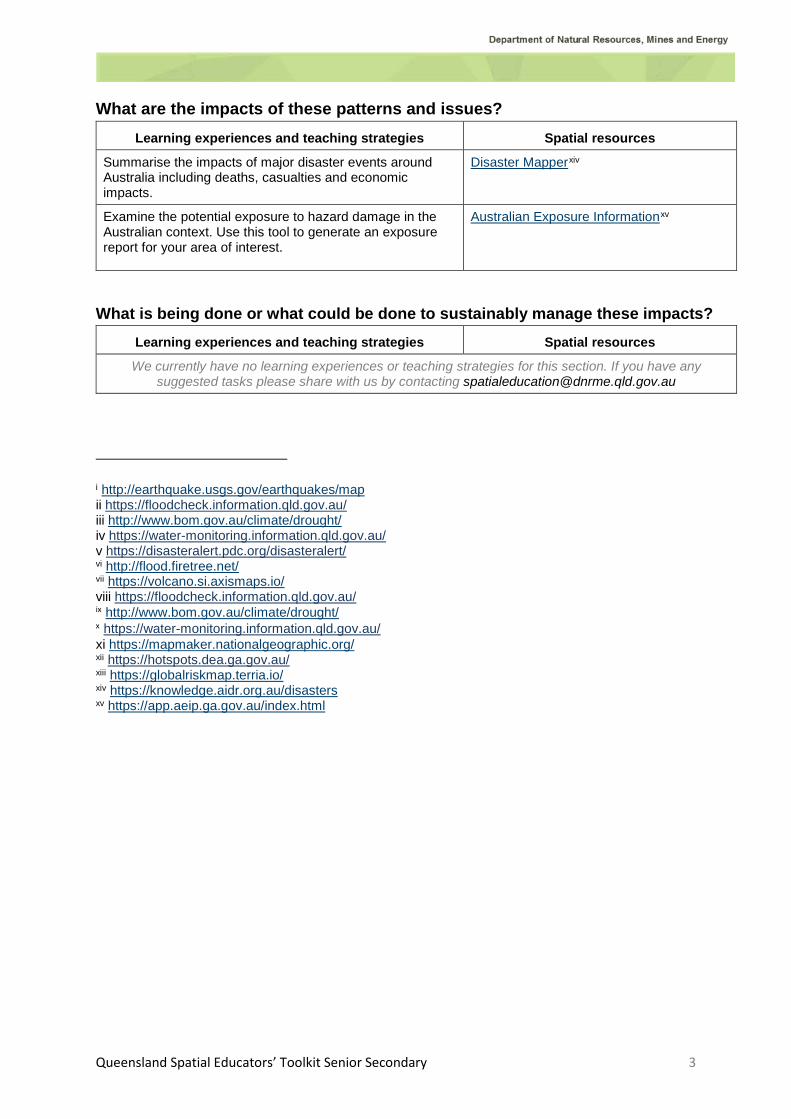
What are the impacts of these patterns and issues? Learning experiences and teaching strategies Spatial resources
Summarise the impacts of major disaster events around Australia including deaths, casualties and economic impacts.
Disaster Mapperxiv
Examine the potential exposure to hazard damage in the Australian context. Use this tool to generate an exposure report for your area of interest.
Australian Exposure Informationxv
What is being done or what could be done to sustainably manage these impacts? Learning experiences and teaching strategies Spatial resources
We currently have no learning experiences or teaching strategies for this section. If you have any suggested tasks please share with us by contacting [email protected]
i http://earthquake.usgs.gov/earthquakes/map ii https://floodcheck.information.qld.gov.au/ iii http://www.bom.gov.au/climate/drought/ iv https://water-monitoring.information.qld.gov.au/ v https://disasteralert.pdc.org/disasteralert/ vi http://flood.firetree.net/ vii https://volcano.si.axismaps.io/ viii https://floodcheck.information.qld.gov.au/ ix http://www.bom.gov.au/climate/drought/ x https://water-monitoring.information.qld.gov.au/ xi https://mapmaker.nationalgeographic.org/ xii https://hotspots.dea.ga.gov.au/ xiii https://globalriskmap.terria.io/ xiv https://knowledge.aidr.org.au/disasters xv https://app.aeip.ga.gov.au/index.html
Queensland Spatial Educators’ Toolkit Senior Secondary 4
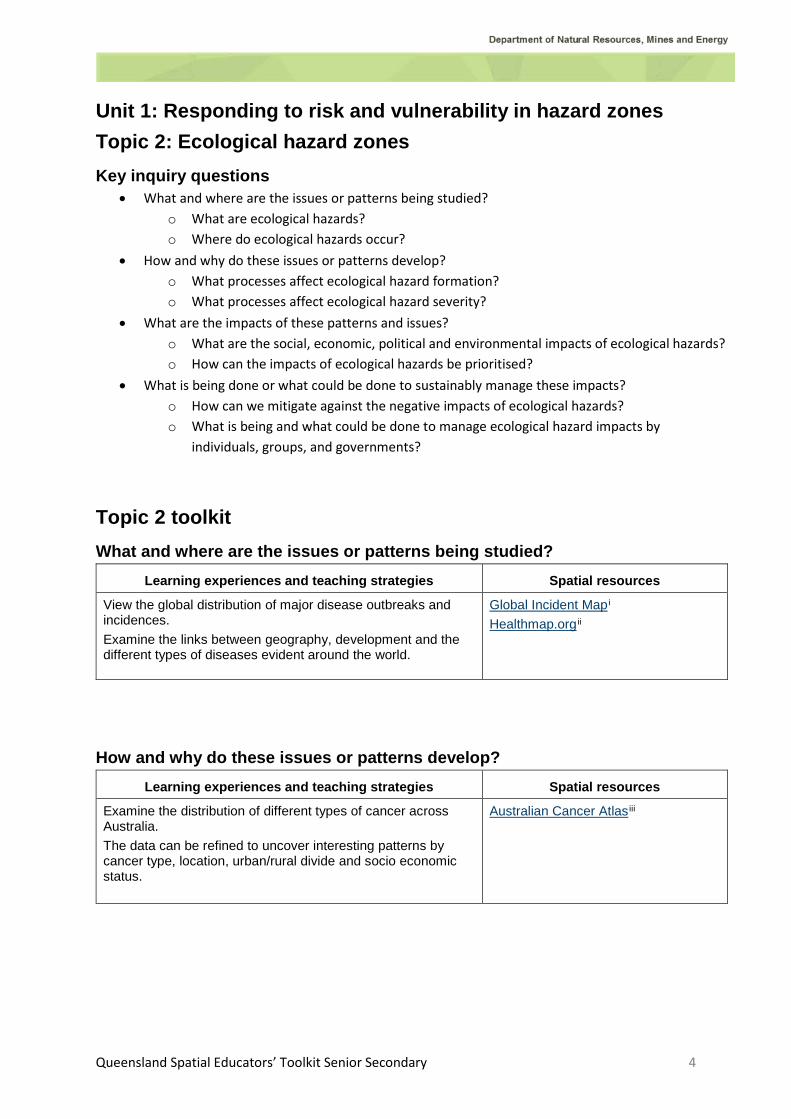
Unit 1: Responding to risk and vulnerability in hazard zones Topic 2: Ecological hazard zones Key inquiry questions
• What and where are the issues or patterns being studied? o What are ecological hazards? o Where do ecological hazards occur?
• How and why do these issues or patterns develop? o What processes affect ecological hazard formation? o What processes affect ecological hazard severity?
• What are the impacts of these patterns and issues? o What are the social, economic, political and environmental impacts of ecological hazards? o How can the impacts of ecological hazards be prioritised?
• What is being done or what could be done to sustainably manage these impacts? o How can we mitigate against the negative impacts of ecological hazards? o What is being and what could be done to manage ecological hazard impacts by
individuals, groups, and governments?
Topic 2 toolkit What and where are the issues or patterns being studied?
Learning experiences and teaching strategies Spatial resources
View the global distribution of major disease outbreaks and incidences. Examine the links between geography, development and the different types of diseases evident around the world.
Global Incident Mapi Healthmap.orgii
How and why do these issues or patterns develop? Learning experiences and teaching strategies Spatial resources
Examine the distribution of different types of cancer across Australia. The data can be refined to uncover interesting patterns by cancer type, location, urban/rural divide and socio economic status.
Australian Cancer Atlasiii
Queensland Spatial Educators’ Toolkit Senior Secondary 5
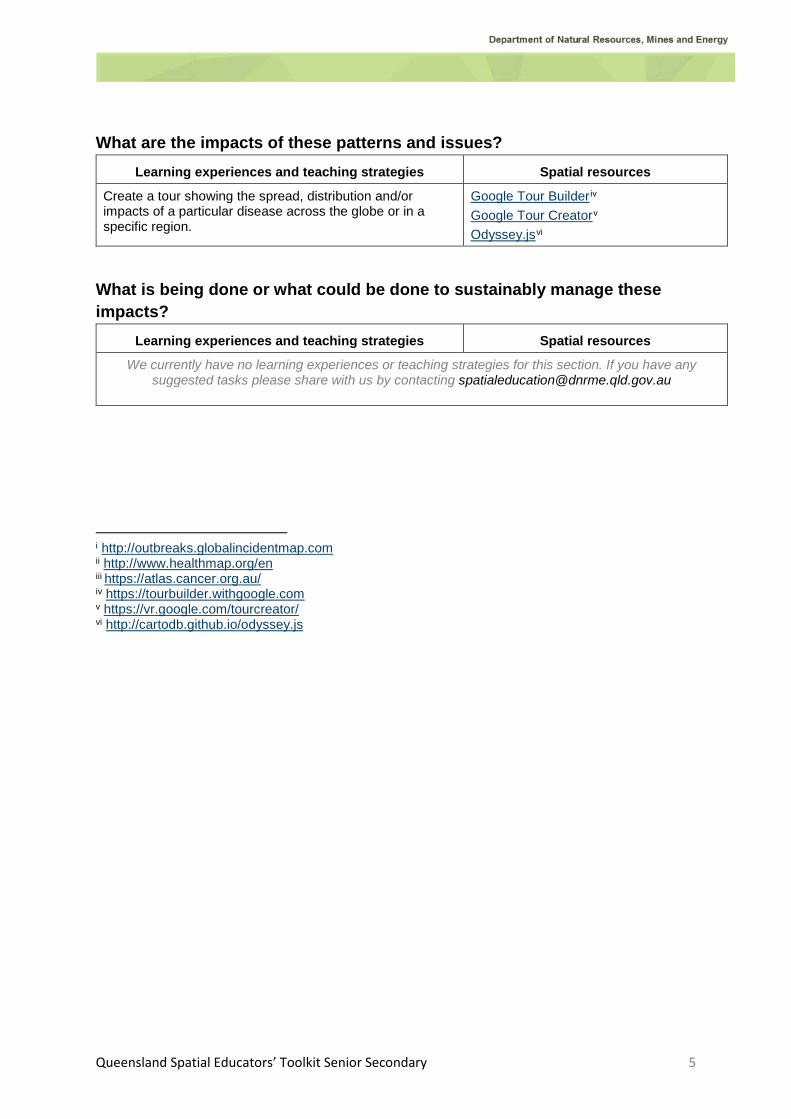
What are the impacts of these patterns and issues? Learning experiences and teaching strategies Spatial resources
Create a tour showing the spread, distribution and/or impacts of a particular disease across the globe or in a specific region.
Google Tour Builderiv Google Tour Creatorv Odyssey.jsvi
What is being done or what could be done to sustainably manage these impacts?
Learning experiences and teaching strategies Spatial resources
We currently have no learning experiences or teaching strategies for this section. If you have any suggested tasks please share with us by contacting [email protected]
i http://outbreaks.globalincidentmap.com ii http://www.healthmap.org/en iii https://atlas.cancer.org.au/ iv https://tourbuilder.withgoogle.com v https://vr.google.com/tourcreator/ vi http://cartodb.github.io/odyssey.js

Queensland Spatial Educators’ Toolkit Senior Secondary 6
Unit 2: Planning sustainable places Topic 1: Responding to challenges facing a place in Australia Key inquiry questions
• What and where are the issues or patterns being studied? o What are places? o How do we define/classify places? o Where do different places exist in Australia?
• How and why do these issues or patterns develop? o What are the processes at work in remote, rural and urban places? o How are the processes at work in communities operating to cause change? o Why are communities unsustainable/sustainable?
• What are the impacts of these patterns and issues? o What are the social, economic, political and environmental impacts of life in different
places? o How can the impacts of changes in communities be prioritised?
• What is being done or what could be done to sustainably manage these impacts? o What is being done and could be done to enhance the resilience and sustainability of our
remote, rural and urban places? o Who will make the decisions concerning the sustainability of the community?

Queensland Spatial Educators’ Toolkit Senior Secondary 7
Topic 1 toolkit What and where are the issues or patterns being studied?
Learning experiences and teaching strategies Spatial resources
Examine the many different indigenous nations across Australia. Discuss indigenous connection to place through art, stories and more.
ABC Indigenous language mapi
Use the Queensland Government’s Floodcheck tool to simulate and examine the flood risk at various Queensland locations. Look for the ‘simulations’ tab to select your location and run the simulation. You can also view historical flood data, including imagery, for Brisbane (1893, 1974 and 2011), Ipswich (1974 and 2011) and Roma (2011).
DNRME Floodcheckii
Survey personal water use across the class and create a map showing the distribution of water use across your local area.
Google My Mapsiii Scribble Mapsiv
Measure water quality data in a local waterway. Combine this in a table with locational data (latitude and longitude) and import the data into an online mapping tool that supports data imports. Represent the water quality on the map using appropriate mapping conventions.
Google My Mapsv Scribble Mapsvi Mapping your Waterway from the Queensland Governmentvii
Examine the variety of ways that a local or significant waterway is used by humans. Identify the land use along a stretch of your chosen waterway. The Queensland Globe contains information on land use, waterways and drainage basins.
Queensland Globeviii Google Earthix
Understand where light pollution exists across Australia using the Light pollution map.
Light pollution mapx
Get a better understanding of different places around Queensland using the Queensland Treasury’s Regional profiles and Thematic maps.
http://www.qgso.qld.gov.au/index.php
Get students to create a map showing the distribution of natural resources in Queensland. Consider mining, forestry, water and other resources.
Google My Mapsxi Scribble Mapsxii
Queensland Spatial Educators’ Toolkit Senior Secondary 8
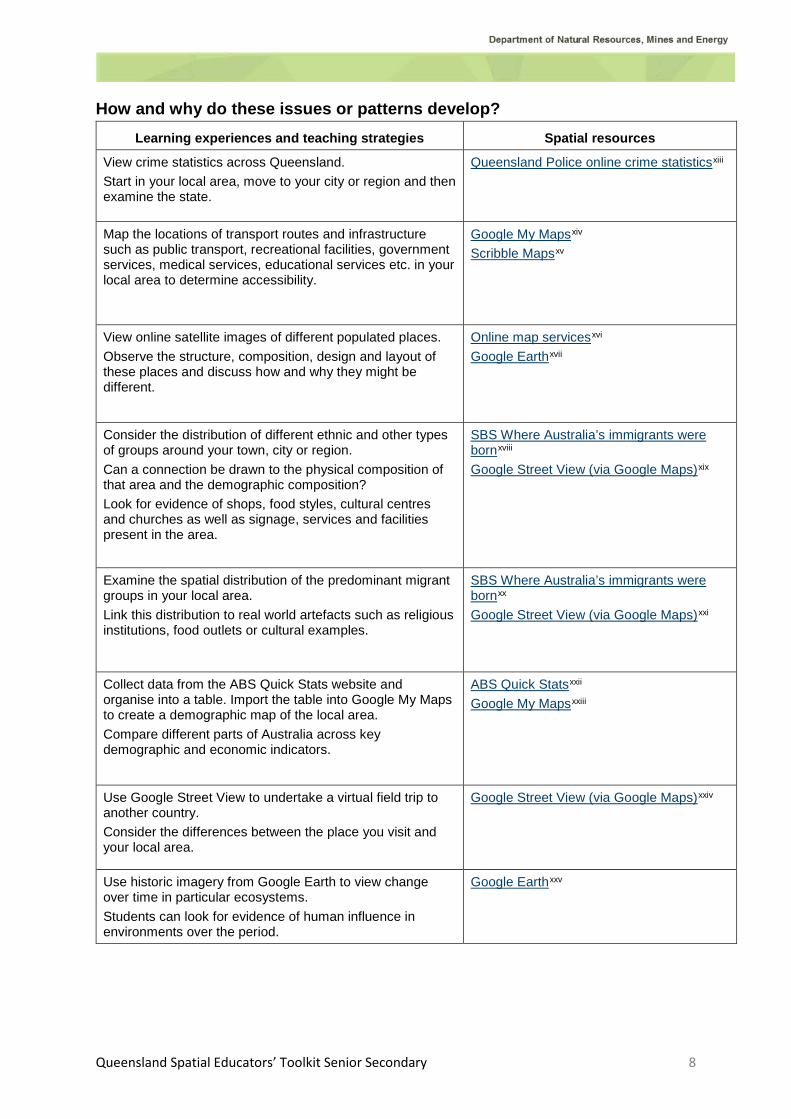
How and why do these issues or patterns develop? Learning experiences and teaching strategies Spatial resources
View crime statistics across Queensland. Start in your local area, move to your city or region and then examine the state.
Queensland Police online crime statisticsxiii
Map the locations of transport routes and infrastructure such as public transport, recreational facilities, government services, medical services, educational services etc. in your local area to determine accessibility.
Google My Mapsxiv Scribble Mapsxv
View online satellite images of different populated places. Observe the structure, composition, design and layout of these places and discuss how and why they might be different.
Online map servicesxvi Google Earthxvii
Consider the distribution of different ethnic and other types of groups around your town, city or region. Can a connection be drawn to the physical composition of that area and the demographic composition? Look for evidence of shops, food styles, cultural centres and churches as well as signage, services and facilities present in the area.
SBS Where Australia’s immigrants were bornxviii Google Street View (via Google Maps)xix
Examine the spatial distribution of the predominant migrant groups in your local area. Link this distribution to real world artefacts such as religious institutions, food outlets or cultural examples.
SBS Where Australia’s immigrants were bornxx Google Street View (via Google Maps)xxi
Collect data from the ABS Quick Stats website and organise into a table. Import the table into Google My Maps to create a demographic map of the local area. Compare different parts of Australia across key demographic and economic indicators.
ABS Quick Statsxxii Google My Mapsxxiii
Use Google Street View to undertake a virtual field trip to another country. Consider the differences between the place you visit and your local area.
Google Street View (via Google Maps)xxiv
Use historic imagery from Google Earth to view change over time in particular ecosystems. Students can look for evidence of human influence in environments over the period.
Google Earthxxv
Queensland Spatial Educators’ Toolkit Senior Secondary 9
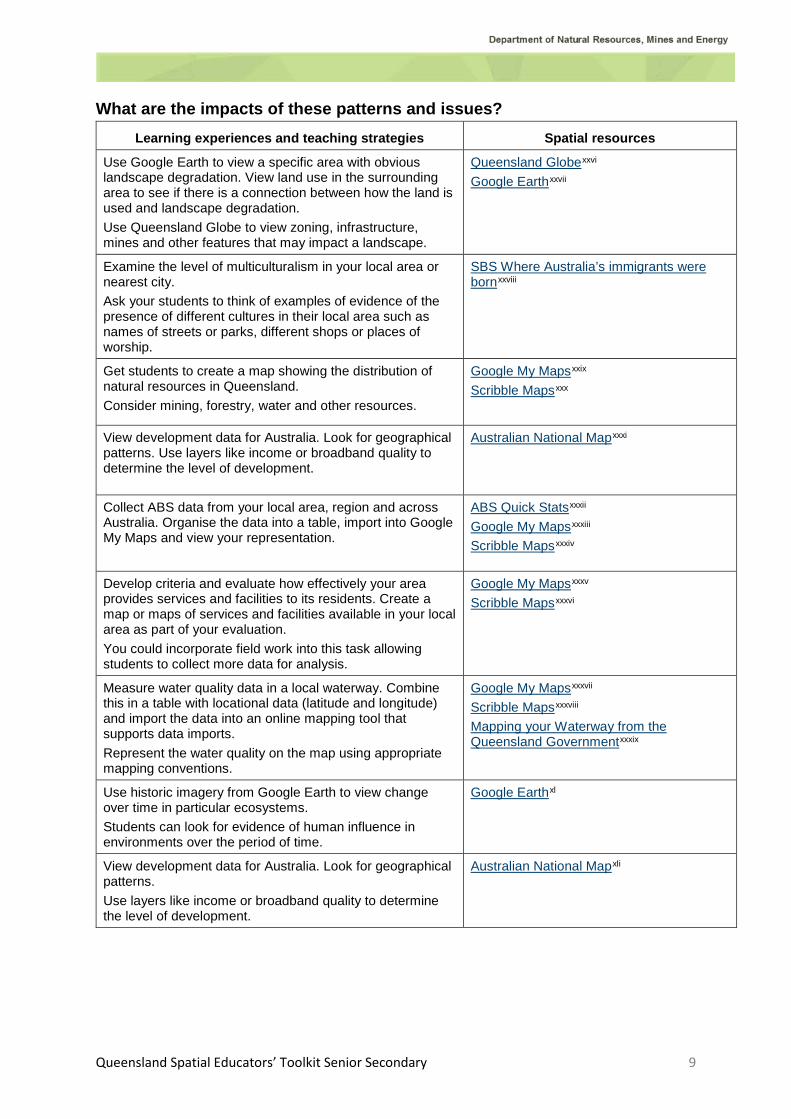
What are the impacts of these patterns and issues? Learning experiences and teaching strategies Spatial resources
Use Google Earth to view a specific area with obvious landscape degradation. View land use in the surrounding area to see if there is a connection between how the land is used and landscape degradation. Use Queensland Globe to view zoning, infrastructure, mines and other features that may impact a landscape.
Queensland Globexxvi Google Earthxxvii
Examine the level of multiculturalism in your local area or nearest city. Ask your students to think of examples of evidence of the presence of different cultures in their local area such as names of streets or parks, different shops or places of worship.
SBS Where Australia’s immigrants were bornxxviii
Get students to create a map showing the distribution of natural resources in Queensland. Consider mining, forestry, water and other resources.
Google My Mapsxxix Scribble Mapsxxx
View development data for Australia. Look for geographical patterns. Use layers like income or broadband quality to determine the level of development.
Australian National Mapxxxi
Collect ABS data from your local area, region and across Australia. Organise the data into a table, import into Google My Maps and view your representation.
ABS Quick Statsxxxii Google My Mapsxxxiii Scribble Mapsxxxiv
Develop criteria and evaluate how effectively your area provides services and facilities to its residents. Create a map or maps of services and facilities available in your local area as part of your evaluation. You could incorporate field work into this task allowing students to collect more data for analysis.
Google My Mapsxxxv Scribble Mapsxxxvi
Measure water quality data in a local waterway. Combine this in a table with locational data (latitude and longitude) and import the data into an online mapping tool that supports data imports. Represent the water quality on the map using appropriate mapping conventions.
Google My Mapsxxxvii Scribble Mapsxxxviii Mapping your Waterway from the Queensland Governmentxxxix
Use historic imagery from Google Earth to view change over time in particular ecosystems. Students can look for evidence of human influence in environments over the period of time.
Google Earthxl
View development data for Australia. Look for geographical patterns. Use layers like income or broadband quality to determine the level of development.
Australian National Mapxli
Queensland Spatial Educators’ Toolkit Senior Secondary 10
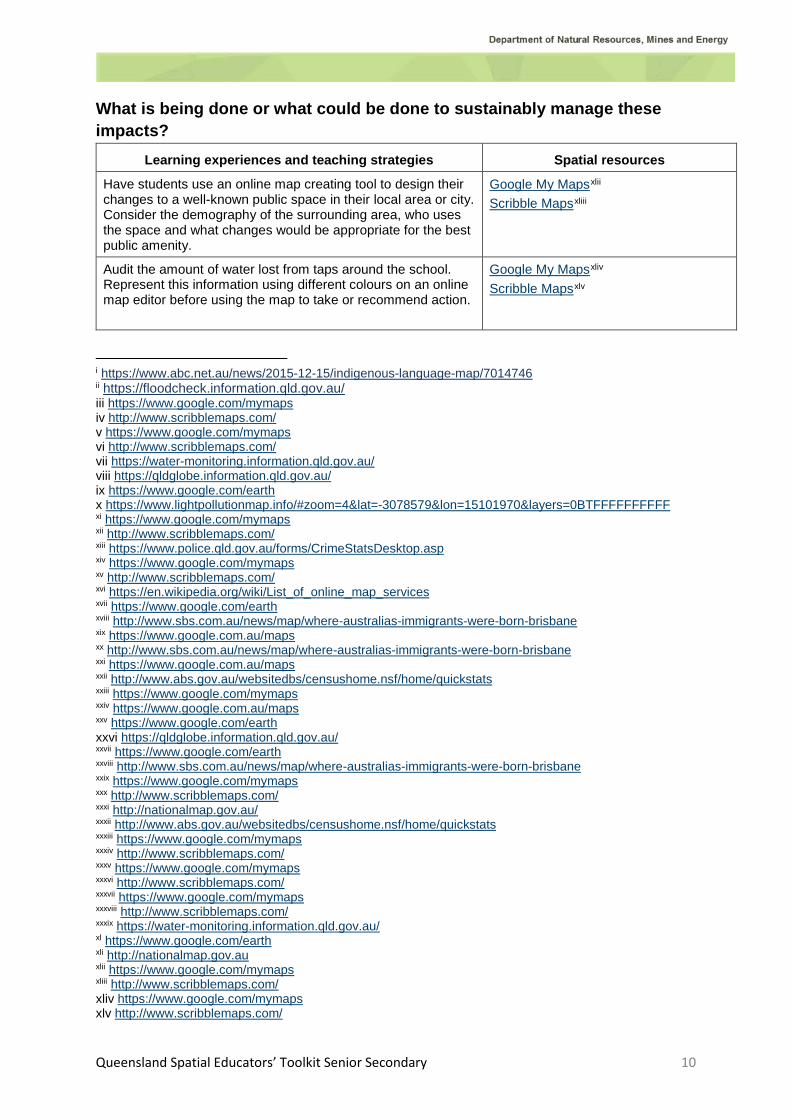
What is being done or what could be done to sustainably manage these impacts?
Learning experiences and teaching strategies Spatial resources
Have students use an online map creating tool to design their changes to a well-known public space in their local area or city. Consider the demography of the surrounding area, who uses the space and what changes would be appropriate for the best public amenity.
Google My Mapsxlii Scribble Mapsxliii
Audit the amount of water lost from taps around the school. Represent this information using different colours on an online map editor before using the map to take or recommend action.
Google My Mapsxliv Scribble Mapsxlv
i https://www.abc.net.au/news/2015-12-15/indigenous-language-map/7014746 ii https://floodcheck.information.qld.gov.au/ iii https://www.google.com/mymaps iv http://www.scribblemaps.com/ v https://www.google.com/mymaps vi http://www.scribblemaps.com/ vii https://water-monitoring.information.qld.gov.au/ viii https://qldglobe.information.qld.gov.au/ ix https://www.google.com/earth x https://www.lightpollutionmap.info/#zoom=4&lat=-3078579&lon=15101970&layers=0BTFFFFFFFFFF xi https://www.google.com/mymaps xii http://www.scribblemaps.com/ xiii https://www.police.qld.gov.au/forms/CrimeStatsDesktop.asp xiv https://www.google.com/mymaps xv http://www.scribblemaps.com/ xvi https://en.wikipedia.org/wiki/List_of_online_map_services xvii https://www.google.com/earth xviii http://www.sbs.com.au/news/map/where-australias-immigrants-were-born-brisbane xix https://www.google.com.au/maps xx http://www.sbs.com.au/news/map/where-australias-immigrants-were-born-brisbane xxi https://www.google.com.au/maps xxii http://www.abs.gov.au/websitedbs/censushome.nsf/home/quickstats xxiii https://www.google.com/mymaps xxiv https://www.google.com.au/maps xxv https://www.google.com/earth xxvi https://qldglobe.information.qld.gov.au/ xxvii https://www.google.com/earth xxviii http://www.sbs.com.au/news/map/where-australias-immigrants-were-born-brisbane xxix https://www.google.com/mymaps xxx http://www.scribblemaps.com/ xxxi http://nationalmap.gov.au/ xxxii http://www.abs.gov.au/websitedbs/censushome.nsf/home/quickstats xxxiii https://www.google.com/mymaps xxxiv http://www.scribblemaps.com/ xxxv https://www.google.com/mymaps xxxvi http://www.scribblemaps.com/ xxxvii https://www.google.com/mymaps xxxviii http://www.scribblemaps.com/ xxxix https://water-monitoring.information.qld.gov.au/ xl https://www.google.com/earth xli http://nationalmap.gov.au xlii https://www.google.com/mymaps xliii http://www.scribblemaps.com/ xliv https://www.google.com/mymaps xlv http://www.scribblemaps.com/
Queensland Spatial Educators’ Toolkit Senior Secondary 11
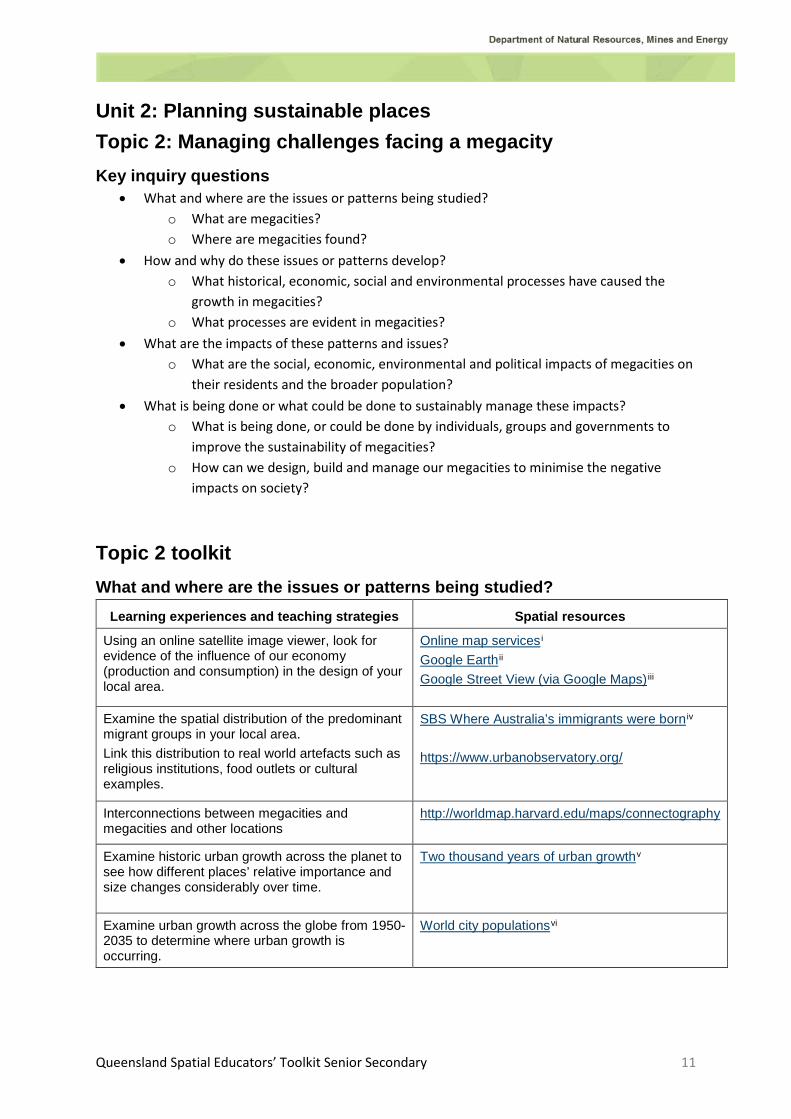
Unit 2: Planning sustainable places Topic 2: Managing challenges facing a megacity Key inquiry questions
• What and where are the issues or patterns being studied? o What are megacities? o Where are megacities found?
• How and why do these issues or patterns develop? o What historical, economic, social and environmental processes have caused the
growth in megacities? o What processes are evident in megacities?
• What are the impacts of these patterns and issues? o What are the social, economic, environmental and political impacts of megacities on
their residents and the broader population? • What is being done or what could be done to sustainably manage these impacts?
o What is being done, or could be done by individuals, groups and governments to improve the sustainability of megacities?
o How can we design, build and manage our megacities to minimise the negative impacts on society?
Topic 2 toolkit What and where are the issues or patterns being studied?
Learning experiences and teaching strategies Spatial resources
Using an online satellite image viewer, look for evidence of the influence of our economy (production and consumption) in the design of your local area.
Online map servicesi Google Earthii Google Street View (via Google Maps)iii
Examine the spatial distribution of the predominant migrant groups in your local area. Link this distribution to real world artefacts such as religious institutions, food outlets or cultural examples.
SBS Where Australia’s immigrants were borniv https://www.urbanobservatory.org/
Interconnections between megacities and megacities and other locations
http://worldmap.harvard.edu/maps/connectography
Examine historic urban growth across the planet to see how different places’ relative importance and size changes considerably over time.
Two thousand years of urban growthv
Examine urban growth across the globe from 1950-2035 to determine where urban growth is occurring.
World city populationsvi
Queensland Spatial Educators’ Toolkit Senior Secondary 12
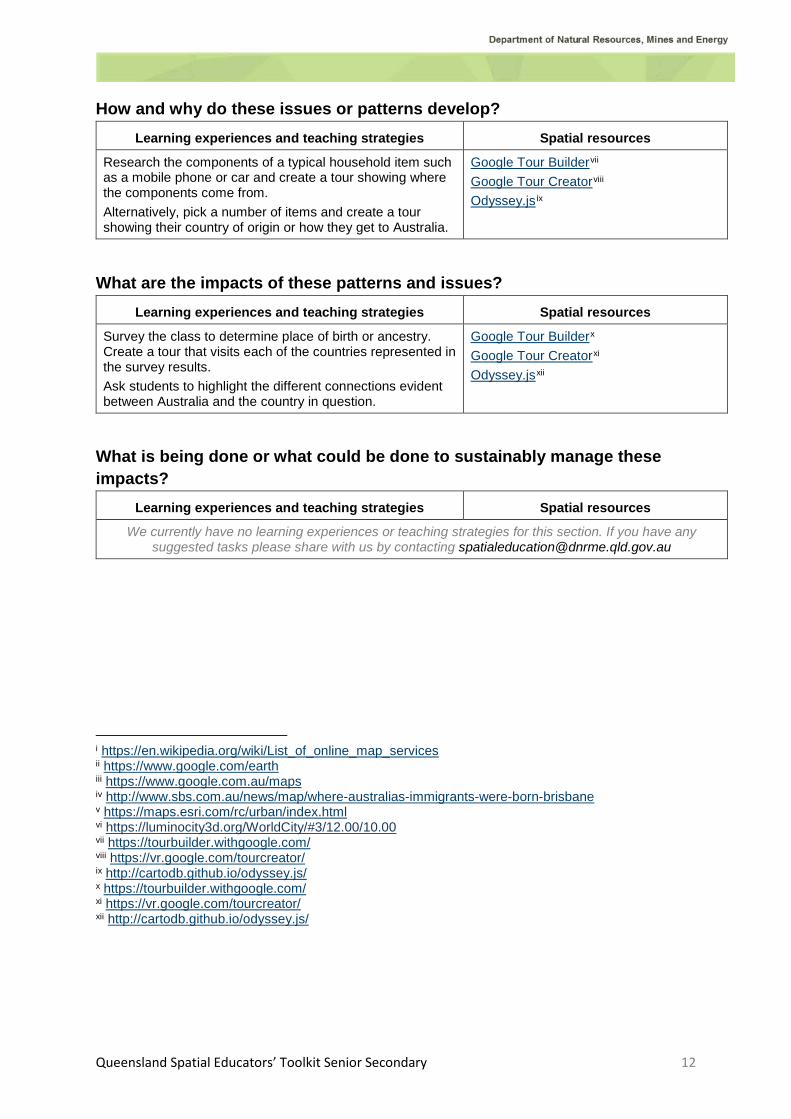
How and why do these issues or patterns develop? Learning experiences and teaching strategies Spatial resources
Research the components of a typical household item such as a mobile phone or car and create a tour showing where the components come from. Alternatively, pick a number of items and create a tour showing their country of origin or how they get to Australia.
Google Tour Buildervii Google Tour Creatorviii Odyssey.jsix
What are the impacts of these patterns and issues? Learning experiences and teaching strategies Spatial resources
Survey the class to determine place of birth or ancestry. Create a tour that visits each of the countries represented in the survey results. Ask students to highlight the different connections evident between Australia and the country in question.
Google Tour Builderx Google Tour Creatorxi Odyssey.jsxii
What is being done or what could be done to sustainably manage these impacts?
Learning experiences and teaching strategies Spatial resources
We currently have no learning experiences or teaching strategies for this section. If you have any suggested tasks please share with us by contacting [email protected]
i https://en.wikipedia.org/wiki/List_of_online_map_services ii https://www.google.com/earth iii https://www.google.com.au/maps iv http://www.sbs.com.au/news/map/where-australias-immigrants-were-born-brisbane v https://maps.esri.com/rc/urban/index.html vi https://luminocity3d.org/WorldCity/#3/12.00/10.00 vii https://tourbuilder.withgoogle.com/ viii https://vr.google.com/tourcreator/ ix http://cartodb.github.io/odyssey.js/ x https://tourbuilder.withgoogle.com/ xi https://vr.google.com/tourcreator/ xii http://cartodb.github.io/odyssey.js/
Queensland Spatial Educators’ Toolkit Senior Secondary 13
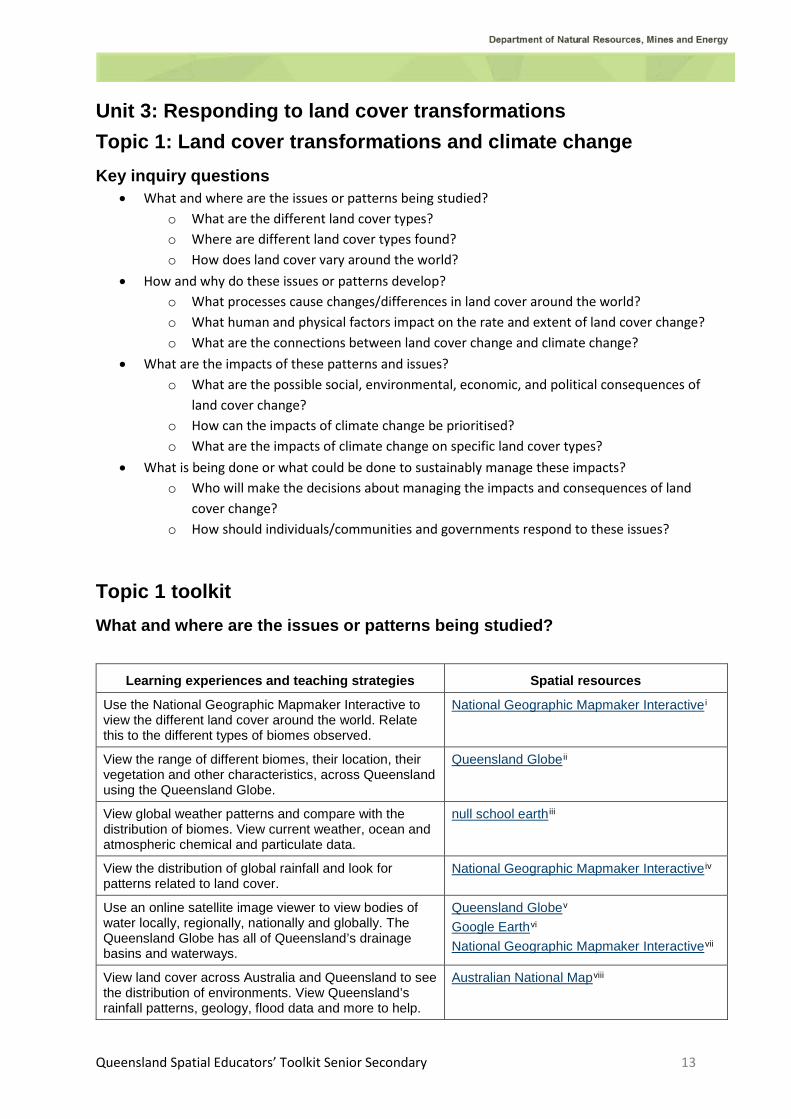
Unit 3: Responding to land cover transformations Topic 1: Land cover transformations and climate change Key inquiry questions
• What and where are the issues or patterns being studied? o What are the different land cover types? o Where are different land cover types found? o How does land cover vary around the world?
• How and why do these issues or patterns develop? o What processes cause changes/differences in land cover around the world? o What human and physical factors impact on the rate and extent of land cover change? o What are the connections between land cover change and climate change?
• What are the impacts of these patterns and issues? o What are the possible social, environmental, economic, and political consequences of
land cover change? o How can the impacts of climate change be prioritised? o What are the impacts of climate change on specific land cover types?
• What is being done or what could be done to sustainably manage these impacts? o Who will make the decisions about managing the impacts and consequences of land
cover change? o How should individuals/communities and governments respond to these issues?
Topic 1 toolkit What and where are the issues or patterns being studied?
Learning experiences and teaching strategies Spatial resources
Use the National Geographic Mapmaker Interactive to view the different land cover around the world. Relate this to the different types of biomes observed.
National Geographic Mapmaker Interactivei
View the range of different biomes, their location, their vegetation and other characteristics, across Queensland using the Queensland Globe.
Queensland Globeii
View global weather patterns and compare with the distribution of biomes. View current weather, ocean and atmospheric chemical and particulate data.
null school earthiii
View the distribution of global rainfall and look for patterns related to land cover.
National Geographic Mapmaker Interactiveiv
Use an online satellite image viewer to view bodies of water locally, regionally, nationally and globally. The Queensland Globe has all of Queensland’s drainage basins and waterways.
Queensland Globev Google Earthvi National Geographic Mapmaker Interactivevii
View land cover across Australia and Queensland to see the distribution of environments. View Queensland’s rainfall patterns, geology, flood data and more to help.
Australian National Mapviii
Queensland Spatial Educators’ Toolkit Senior Secondary 14
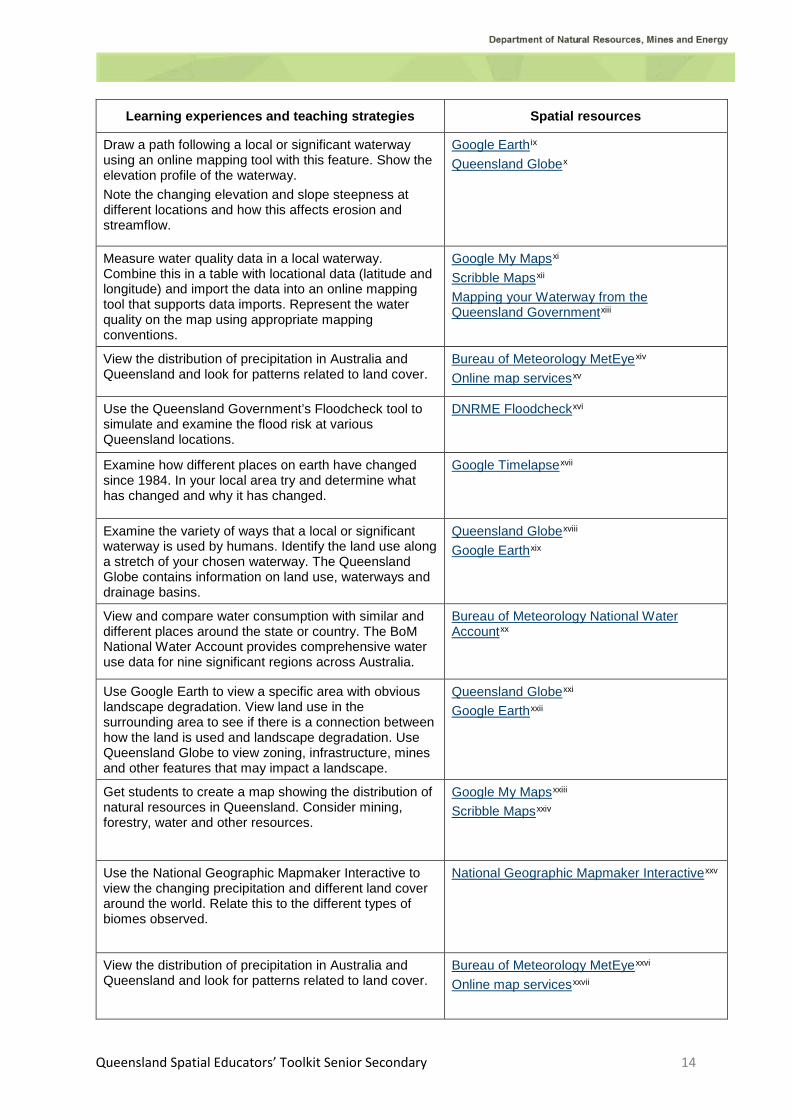
Learning experiences and teaching strategies Spatial resources
Draw a path following a local or significant waterway using an online mapping tool with this feature. Show the elevation profile of the waterway. Note the changing elevation and slope steepness at different locations and how this affects erosion and streamflow.
Google Earthix Queensland Globex
Measure water quality data in a local waterway. Combine this in a table with locational data (latitude and longitude) and import the data into an online mapping tool that supports data imports. Represent the water quality on the map using appropriate mapping conventions.
Google My Mapsxi Scribble Mapsxii Mapping your Waterway from the Queensland Governmentxiii
View the distribution of precipitation in Australia and Queensland and look for patterns related to land cover.
Bureau of Meteorology MetEyexiv Online map servicesxv
Use the Queensland Government’s Floodcheck tool to simulate and examine the flood risk at various Queensland locations.
DNRME Floodcheckxvi
Examine how different places on earth have changed since 1984. In your local area try and determine what has changed and why it has changed.
Google Timelapsexvii
Examine the variety of ways that a local or significant waterway is used by humans. Identify the land use along a stretch of your chosen waterway. The Queensland Globe contains information on land use, waterways and drainage basins.
Queensland Globexviii Google Earthxix
View and compare water consumption with similar and different places around the state or country. The BoM National Water Account provides comprehensive water use data for nine significant regions across Australia.
Bureau of Meteorology National Water Accountxx
Use Google Earth to view a specific area with obvious landscape degradation. View land use in the surrounding area to see if there is a connection between how the land is used and landscape degradation. Use Queensland Globe to view zoning, infrastructure, mines and other features that may impact a landscape.
Queensland Globexxi Google Earthxxii
Get students to create a map showing the distribution of natural resources in Queensland. Consider mining, forestry, water and other resources.
Google My Mapsxxiii Scribble Mapsxxiv
Use the National Geographic Mapmaker Interactive to view the changing precipitation and different land cover around the world. Relate this to the different types of biomes observed.
National Geographic Mapmaker Interactivexxv
View the distribution of precipitation in Australia and Queensland and look for patterns related to land cover.
Bureau of Meteorology MetEyexxvi Online map servicesxxvii
Queensland Spatial Educators’ Toolkit Senior Secondary 15
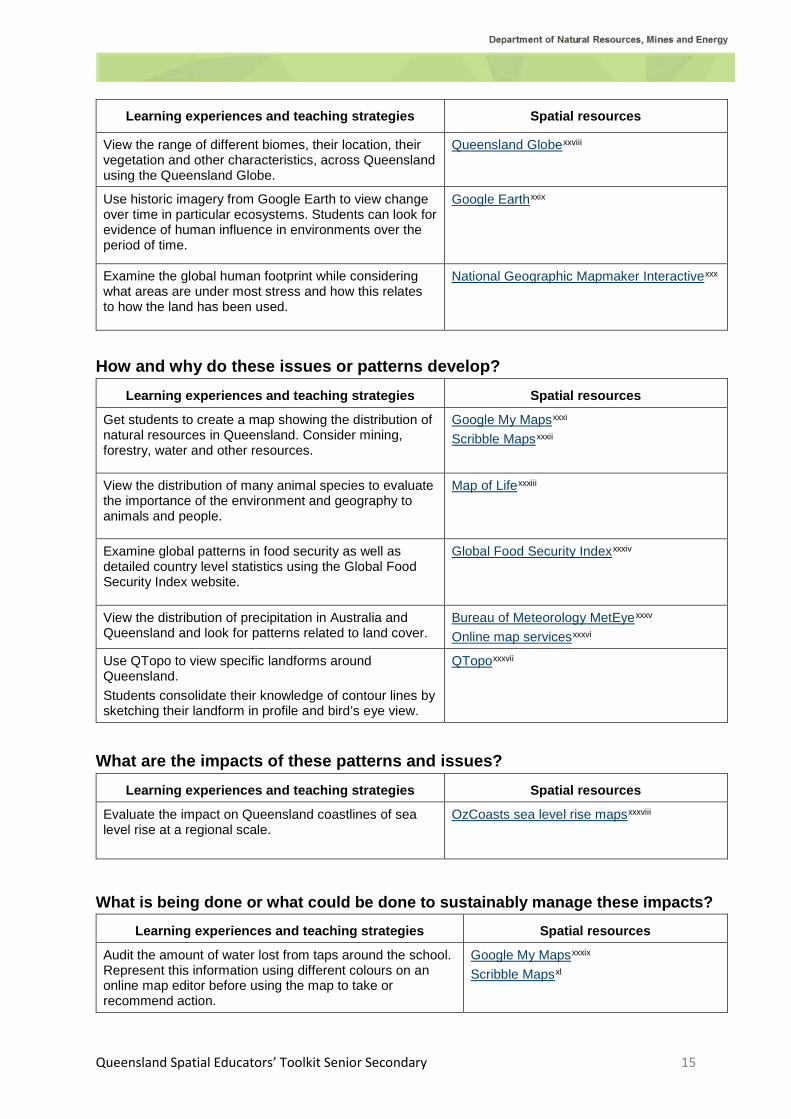
Learning experiences and teaching strategies Spatial resources
View the range of different biomes, their location, their vegetation and other characteristics, across Queensland using the Queensland Globe.
Queensland Globexxviii
Use historic imagery from Google Earth to view change over time in particular ecosystems. Students can look for evidence of human influence in environments over the period of time.
Google Earthxxix
Examine the global human footprint while considering what areas are under most stress and how this relates to how the land has been used.
National Geographic Mapmaker Interactivexxx
How and why do these issues or patterns develop? Learning experiences and teaching strategies Spatial resources
Get students to create a map showing the distribution of natural resources in Queensland. Consider mining, forestry, water and other resources.
Google My Mapsxxxi Scribble Mapsxxxii
View the distribution of many animal species to evaluate the importance of the environment and geography to animals and people.
Map of Lifexxxiii
Examine global patterns in food security as well as detailed country level statistics using the Global Food Security Index website.
Global Food Security Indexxxxiv
View the distribution of precipitation in Australia and Queensland and look for patterns related to land cover.
Bureau of Meteorology MetEyexxxv Online map servicesxxxvi
Use QTopo to view specific landforms around Queensland. Students consolidate their knowledge of contour lines by sketching their landform in profile and bird’s eye view.
QTopoxxxvii
What are the impacts of these patterns and issues? Learning experiences and teaching strategies Spatial resources
Evaluate the impact on Queensland coastlines of sea level rise at a regional scale.
OzCoasts sea level rise mapsxxxviii
What is being done or what could be done to sustainably manage these impacts? Learning experiences and teaching strategies Spatial resources
Audit the amount of water lost from taps around the school. Represent this information using different colours on an online map editor before using the map to take or recommend action.
Google My Mapsxxxix Scribble Mapsxl
Queensland Spatial Educators’ Toolkit Senior Secondary 16
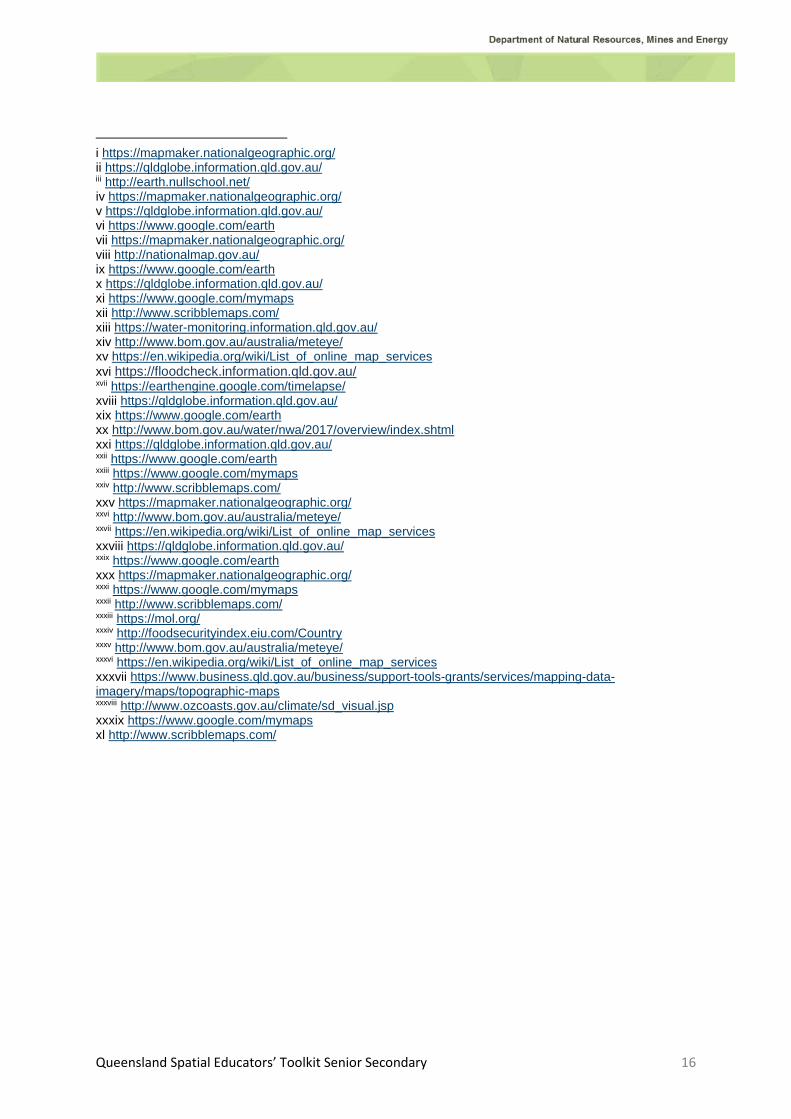
i https://mapmaker.nationalgeographic.org/ ii https://qldglobe.information.qld.gov.au/ iii http://earth.nullschool.net/ iv https://mapmaker.nationalgeographic.org/ v https://qldglobe.information.qld.gov.au/ vi https://www.google.com/earth vii https://mapmaker.nationalgeographic.org/ viii http://nationalmap.gov.au/ ix https://www.google.com/earth x https://qldglobe.information.qld.gov.au/ xi https://www.google.com/mymaps xii http://www.scribblemaps.com/ xiii https://water-monitoring.information.qld.gov.au/ xiv http://www.bom.gov.au/australia/meteye/ xv https://en.wikipedia.org/wiki/List_of_online_map_services xvi https://floodcheck.information.qld.gov.au/ xvii https://earthengine.google.com/timelapse/ xviii https://qldglobe.information.qld.gov.au/ xix https://www.google.com/earth xx http://www.bom.gov.au/water/nwa/2017/overview/index.shtml xxi https://qldglobe.information.qld.gov.au/ xxii https://www.google.com/earth xxiii https://www.google.com/mymaps xxiv http://www.scribblemaps.com/ xxv https://mapmaker.nationalgeographic.org/ xxvi http://www.bom.gov.au/australia/meteye/ xxvii https://en.wikipedia.org/wiki/List_of_online_map_services xxviii https://qldglobe.information.qld.gov.au/ xxix https://www.google.com/earth xxx https://mapmaker.nationalgeographic.org/ xxxi https://www.google.com/mymaps xxxii http://www.scribblemaps.com/ xxxiii https://mol.org/ xxxiv http://foodsecurityindex.eiu.com/Country xxxv http://www.bom.gov.au/australia/meteye/ xxxvi https://en.wikipedia.org/wiki/List_of_online_map_services xxxvii https://www.business.qld.gov.au/business/support-tools-grants/services/mapping-data-imagery/maps/topographic-maps xxxviii http://www.ozcoasts.gov.au/climate/sd_visual.jsp xxxix https://www.google.com/mymaps xl http://www.scribblemaps.com/
Queensland Spatial Educators’ Toolkit Senior Secondary 17
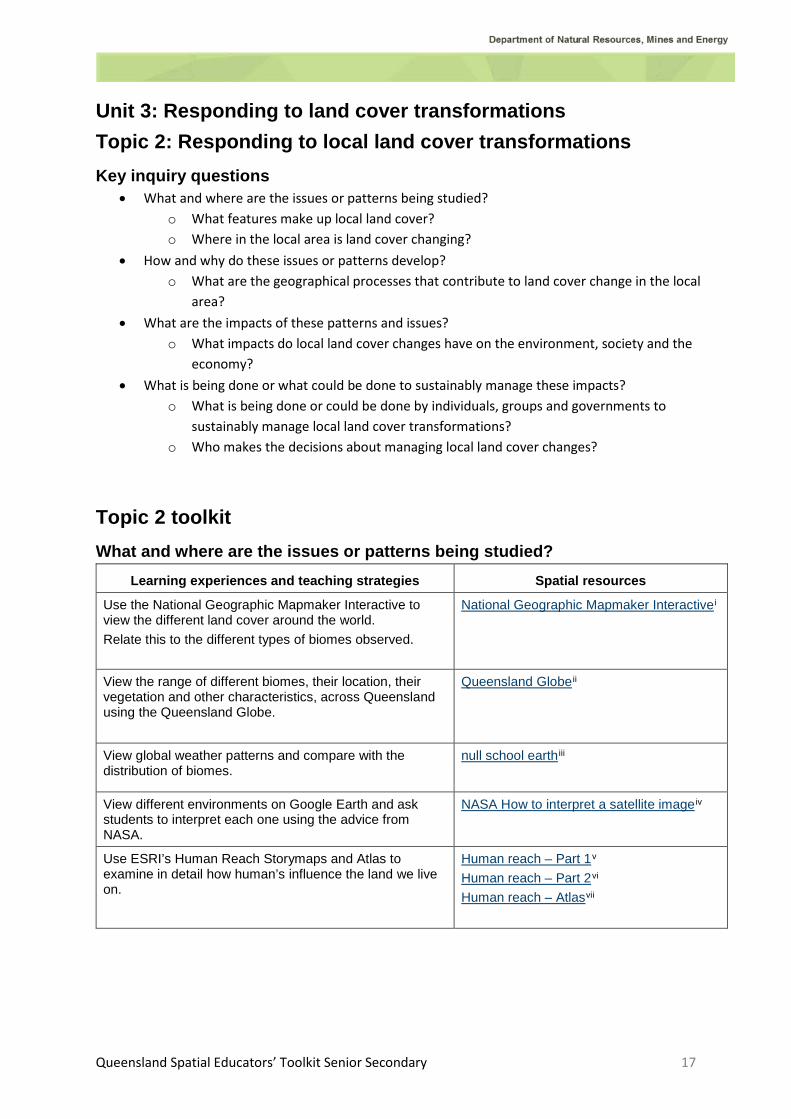
Unit 3: Responding to land cover transformations Topic 2: Responding to local land cover transformations Key inquiry questions
• What and where are the issues or patterns being studied? o What features make up local land cover? o Where in the local area is land cover changing?
• How and why do these issues or patterns develop? o What are the geographical processes that contribute to land cover change in the local
area? • What are the impacts of these patterns and issues?
o What impacts do local land cover changes have on the environment, society and the economy?
• What is being done or what could be done to sustainably manage these impacts? o What is being done or could be done by individuals, groups and governments to
sustainably manage local land cover transformations? o Who makes the decisions about managing local land cover changes?
Topic 2 toolkit What and where are the issues or patterns being studied?
Learning experiences and teaching strategies Spatial resources
Use the National Geographic Mapmaker Interactive to view the different land cover around the world. Relate this to the different types of biomes observed.
National Geographic Mapmaker Interactivei
View the range of different biomes, their location, their vegetation and other characteristics, across Queensland using the Queensland Globe.
Queensland Globeii
View global weather patterns and compare with the distribution of biomes.
null school earthiii
View different environments on Google Earth and ask students to interpret each one using the advice from NASA.
NASA How to interpret a satellite imageiv
Use ESRI’s Human Reach Storymaps and Atlas to examine in detail how human’s influence the land we live on.
Human reach – Part 1v Human reach – Part 2vi Human reach – Atlasvii
Queensland Spatial Educators’ Toolkit Senior Secondary 18
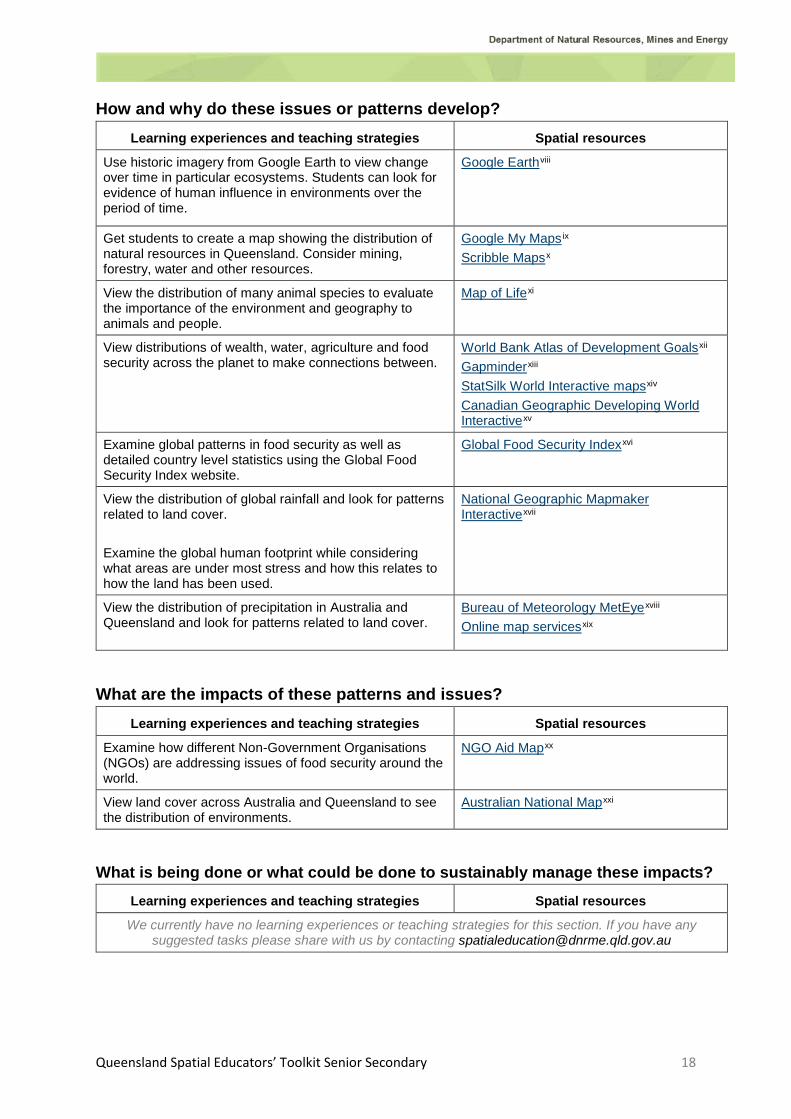
How and why do these issues or patterns develop? Learning experiences and teaching strategies Spatial resources
Use historic imagery from Google Earth to view change over time in particular ecosystems. Students can look for evidence of human influence in environments over the period of time.
Google Earthviii
Get students to create a map showing the distribution of natural resources in Queensland. Consider mining, forestry, water and other resources.
Google My Mapsix Scribble Mapsx
View the distribution of many animal species to evaluate the importance of the environment and geography to animals and people.
Map of Lifexi
View distributions of wealth, water, agriculture and food security across the planet to make connections between.
World Bank Atlas of Development Goalsxii Gapminderxiii StatSilk World Interactive mapsxiv Canadian Geographic Developing World Interactivexv
Examine global patterns in food security as well as detailed country level statistics using the Global Food Security Index website.
Global Food Security Indexxvi
View the distribution of global rainfall and look for patterns related to land cover. Examine the global human footprint while considering what areas are under most stress and how this relates to how the land has been used.
National Geographic Mapmaker Interactivexvii
View the distribution of precipitation in Australia and Queensland and look for patterns related to land cover.
Bureau of Meteorology MetEyexviii Online map servicesxix
What are the impacts of these patterns and issues? Learning experiences and teaching strategies Spatial resources
Examine how different Non-Government Organisations (NGOs) are addressing issues of food security around the world.
NGO Aid Mapxx
View land cover across Australia and Queensland to see the distribution of environments.
Australian National Mapxxi
What is being done or what could be done to sustainably manage these impacts? Learning experiences and teaching strategies Spatial resources
We currently have no learning experiences or teaching strategies for this section. If you have any suggested tasks please share with us by contacting [email protected]

Queensland Spatial Educators’ Toolkit Senior Secondary 19
i https://mapmaker.nationalgeographic.org/ ii https://qldglobe.information.qld.gov.au/ iii http://earth.nullschool.net/ iv http://earthobservatory.nasa.gov/Features/ColorImage/ v https://storymaps.esri.com/stories/2018/anthropocene/1-human-reach.html vi https://storymaps.esri.com/stories/2018/anthropocene/2-the-land.html vii https://storymaps.esri.com/stories/2018/anthropocene-atlas/2-the-land.html viii https://www.google.com/earth ix https://www.google.com/mymaps x http://www.scribblemaps.com/ xi https://mol.org/ xii http://datatopics.worldbank.org/sdgatlas/ xiii http://www.gapminder.org/ xiv http://www.statsilk.com/maps/world-stats-interactive-maps-index#most-popular-interactive-visualizations xv http://worldmap.canadiangeographic.ca/ xvi http://foodsecurityindex.eiu.com/Country xvii https://mapmaker.nationalgeographic.org/ xviii http://www.bom.gov.au/australia/meteye/ xix https://en.wikipedia.org/wiki/List_of_online_map_services xx http://foodsecurity.ngoaidmap.org/ xxi http://nationalmap.gov.au/
Queensland Spatial Educators’ Toolkit Senior Secondary 20
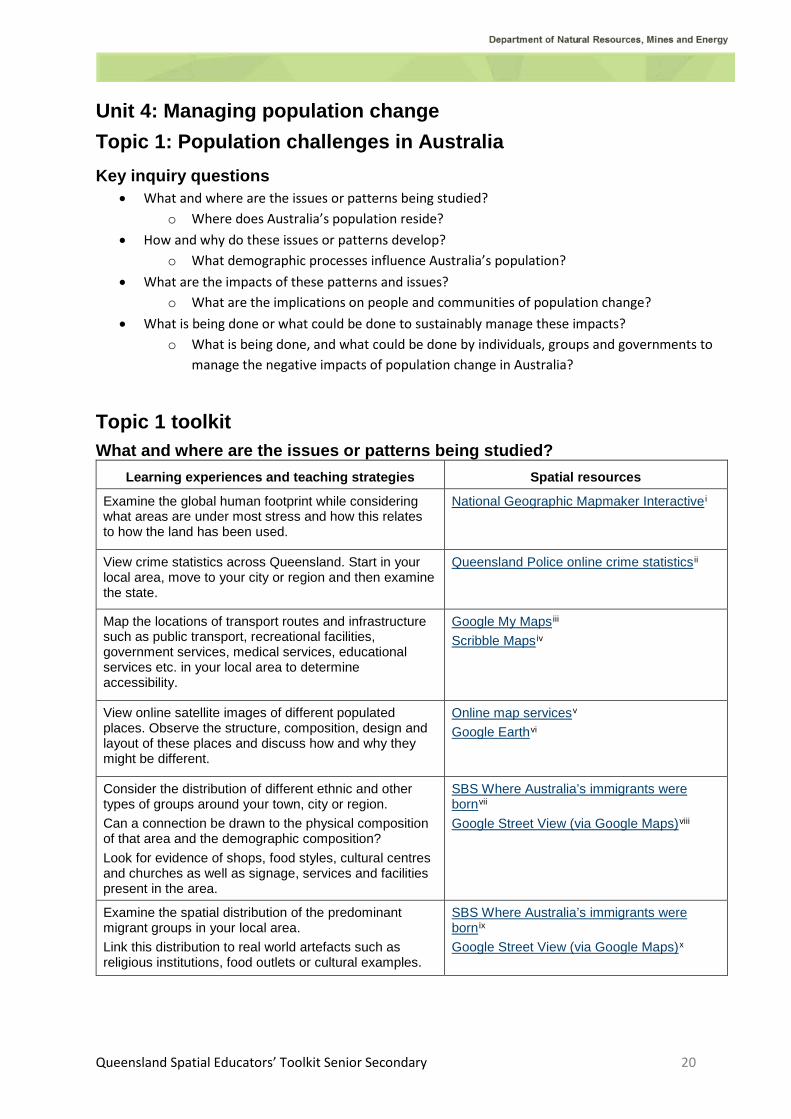
Unit 4: Managing population change Topic 1: Population challenges in Australia Key inquiry questions
• What and where are the issues or patterns being studied? o Where does Australia’s population reside?
• How and why do these issues or patterns develop? o What demographic processes influence Australia’s population?
• What are the impacts of these patterns and issues? o What are the implications on people and communities of population change?
• What is being done or what could be done to sustainably manage these impacts? o What is being done, and what could be done by individuals, groups and governments to
manage the negative impacts of population change in Australia?
Topic 1 toolkit What and where are the issues or patterns being studied?
Learning experiences and teaching strategies Spatial resources
Examine the global human footprint while considering what areas are under most stress and how this relates to how the land has been used.
National Geographic Mapmaker Interactivei
View crime statistics across Queensland. Start in your local area, move to your city or region and then examine the state.
Queensland Police online crime statisticsii
Map the locations of transport routes and infrastructure such as public transport, recreational facilities, government services, medical services, educational services etc. in your local area to determine accessibility.
Google My Mapsiii Scribble Mapsiv
View online satellite images of different populated places. Observe the structure, composition, design and layout of these places and discuss how and why they might be different.
Online map servicesv Google Earthvi
Consider the distribution of different ethnic and other types of groups around your town, city or region. Can a connection be drawn to the physical composition of that area and the demographic composition? Look for evidence of shops, food styles, cultural centres and churches as well as signage, services and facilities present in the area.
SBS Where Australia’s immigrants were bornvii Google Street View (via Google Maps)viii
Examine the spatial distribution of the predominant migrant groups in your local area. Link this distribution to real world artefacts such as religious institutions, food outlets or cultural examples.
SBS Where Australia’s immigrants were bornix Google Street View (via Google Maps)x
Queensland Spatial Educators’ Toolkit Senior Secondary 21
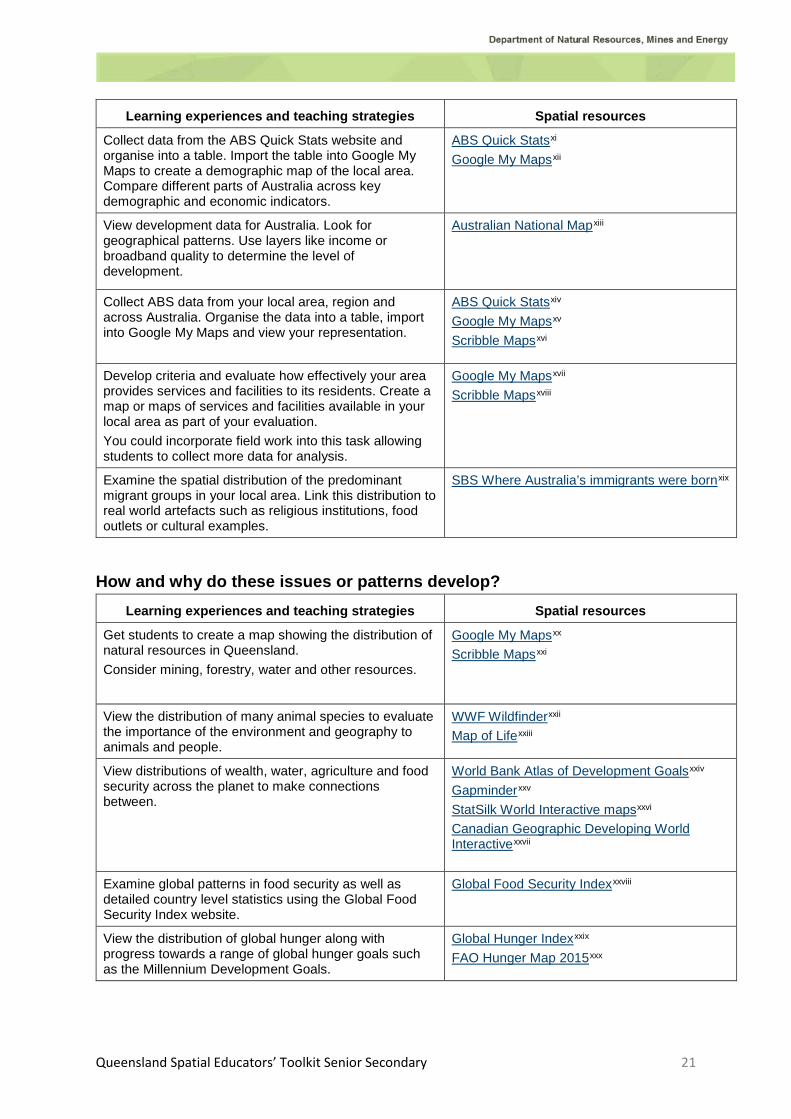
Learning experiences and teaching strategies Spatial resources
Collect data from the ABS Quick Stats website and organise into a table. Import the table into Google My Maps to create a demographic map of the local area. Compare different parts of Australia across key demographic and economic indicators.
ABS Quick Statsxi Google My Mapsxii
View development data for Australia. Look for geographical patterns. Use layers like income or broadband quality to determine the level of development.
Australian National Mapxiii
Collect ABS data from your local area, region and across Australia. Organise the data into a table, import into Google My Maps and view your representation.
ABS Quick Statsxiv Google My Mapsxv Scribble Mapsxvi
Develop criteria and evaluate how effectively your area provides services and facilities to its residents. Create a map or maps of services and facilities available in your local area as part of your evaluation. You could incorporate field work into this task allowing students to collect more data for analysis.
Google My Mapsxvii Scribble Mapsxviii
Examine the spatial distribution of the predominant migrant groups in your local area. Link this distribution to real world artefacts such as religious institutions, food outlets or cultural examples.
SBS Where Australia’s immigrants were bornxix
How and why do these issues or patterns develop? Learning experiences and teaching strategies Spatial resources
Get students to create a map showing the distribution of natural resources in Queensland. Consider mining, forestry, water and other resources.
Google My Mapsxx Scribble Mapsxxi
View the distribution of many animal species to evaluate the importance of the environment and geography to animals and people.
WWF Wildfinderxxii Map of Lifexxiii
View distributions of wealth, water, agriculture and food security across the planet to make connections between.
World Bank Atlas of Development Goalsxxiv Gapminderxxv StatSilk World Interactive mapsxxvi Canadian Geographic Developing World Interactivexxvii
Examine global patterns in food security as well as detailed country level statistics using the Global Food Security Index website.
Global Food Security Indexxxviii
View the distribution of global hunger along with progress towards a range of global hunger goals such as the Millennium Development Goals.
Global Hunger Indexxxix FAO Hunger Map 2015xxx
Queensland Spatial Educators’ Toolkit Senior Secondary 22
What are the impacts of these patterns and issues? Learning experiences and teaching strategies Spatial resources
Examine how different Non-Government Organisations (NGOs) are addressing issues of food security around the world.
NGO Aid Mapxxxi
Evaluate the impact on Queensland coastlines of sea level rise at a regional scale.
OzCoasts sea level rise mapsxxxii
What is being done or what could be done to sustainably manage these impacts? Learning experiences and teaching strategies Spatial resources
We currently have no learning experiences or teaching strategies for this section. If you have any suggested tasks please share with us by contacting [email protected]
i https://mapmaker.nationalgeographic.org/ ii https://www.police.qld.gov.au/forms/CrimeStatsDesktop.asp iii https://www.google.com/mymaps iv http://www.scribblemaps.com/ v https://en.wikipedia.org/wiki/List_of_online_map_services vi https://www.google.com/earth vii http://www.sbs.com.au/news/map/where-australias-immigrants-were-born-brisbane viii https://www.google.com.au/maps ix http://www.sbs.com.au/news/map/where-australias-immigrants-were-born-brisbane x https://www.google.com.au/maps xi http://www.abs.gov.au/websitedbs/censushome.nsf/home/quickstats xii https://www.google.com/mymaps xiii http://nationalmap.gov.au/ xiv http://www.abs.gov.au/websitedbs/censushome.nsf/home/quickstats xv https://www.google.com/mymaps xvi http://www.scribblemaps.com/ xvii https://www.google.com/mymaps xviii http://www.scribblemaps.com/ xix http://www.sbs.com.au/news/map/where-australias-immigrants-were-born-brisbane xx https://www.google.com/mymaps xxi http://www.scribblemaps.com/ xxii http://www.worldwildlife.org/science/wildfinder/ xxiii https://mol.org/ xxiv http://datatopics.worldbank.org/sdgatlas/ xxv http://www.gapminder.org/ xxvi http://www.statsilk.com/maps/world-stats-interactive-maps-index#most-popular-interactive-visualizations xxvii http://worldmap.canadiangeographic.ca/ xxviii https://foodsecurityindex.eiu.com/ xxix https://www.globalhungerindex.org/results.html xxx http://www.fao.org/hunger/en/ xxxi http://foodsecurity.ngoaidmap.org/ xxxii http://www.ozcoasts.gov.au/climate/sd_visual.jsp
Queensland Spatial Educators’ Toolkit Senior Secondary 23
Unit 4: Managing population change Topic 2: Global population change Key inquiry questions
• What and where are the issues or patterns being studied? o Where does the world’s population reside?
• How and why do these issues or patterns develop? o What demographic processes influence global population?
• What are the impacts of these patterns and issues? o What are the implications on people and communities of population change?
• What is being done or what could be done to sustainably manage these impacts? o What is being done, and what could be done by individuals, groups and governments to
manage the negative impacts of population change?
Topic 2 toolkit What and where are the issues or patterns being studied?
Learning experiences and teaching strategies Spatial resources
View the global distribution of major disease outbreaks and incidences. Examine the links between geography, development and the different types of diseases evident around the world.
Global Incident Mapi WHO Health Emergency Dashboard interactive mapii Healthmap.orgiii
Examine global trends in migration specific to individual countries.
Global trends in migration – ESRIiv
How and why do these issues or patterns develop? Learning experiences and teaching strategies Spatial resources
View global development indicators to see why migrants leave their home countries. Consider the push and pull factors that motivate people to migrate.
World Bank Atlas of Development Goalsv Gapmindervi Nation Mastervii World Mapperviii View distributions of wealth, water, agriculture and food
security across the planet to make connections between.
View cartograms and maps showing a range of economic, social, environmental, political and cultural indicators.
Examine different social, economic and cultural indicators across the globe to highlight differences in development between countries around the world.
Examine how different Non-Government Organisations (NGOs) are addressing issues of food security around the world.
NGO Aid Mapix
View development data for Australia. Look for geographical patterns. Use layers like income or broadband quality to determine the level of development.
Australian National Mapx

Queensland Spatial Educators’ Toolkit Senior Secondary 24
What are the impacts of these patterns and issues? Learning experiences and teaching strategies Spatial resources
Create a tour showing the spread, distribution and/or impacts of a particular disease across the globe or in a specific region.
Google Tour Builderxi Google Tour Creatorxii Odyssey.jsxiii
What is being done or what could be done to sustainably manage these impacts?
Learning experiences and teaching strategies Spatial resources
View background information and progress on achieving the Millennium Development Goals using the MDG layer in Google Earth. This can be found in the layers section under ‘Global awareness’.
Google Earthxiv
i http://outbreaks.globalincidentmap.com ii https://extranet.who.int/publicemergency iii http://www.healthmap.org/en iv http://coolmaps.esri.com/Migration/Trends/ v http://datatopics.worldbank.org/sdgatlas/ vi http://www.gapminder.org/ vii http://www.nationmaster.com viii http://www.worldmapper.org ix http://foodsecurity.ngoaidmap.org x http://nationalmap.gov.au xi https://tourbuilder.withgoogle.com xii https://vr.google.com/tourcreator/ xiii http://cartodb.github.io/odyssey.js xiv https://www.google.com/earth