quaternary science reviews - s u
TRANSCRIPT

lable at ScienceDirect
Quaternary Science Reviews 149 (2016) 288e305
Contents lists avai
Quaternary Science Reviews
journal homepage: www.elsevier .com/locate/quascirev
Complex patterns of glacier advances during the late glacial in theChagan Uzun Valley, Russian Altai
Natacha Gribenski a, b, *, Krister N. Jansson a, b, Sven Lukas c, Arjen P. Stroeven a, b,Jonathan M. Harbor a, b, d, Robin Blomdin a, b, Mikhail N. Ivanov e, Jakob Heyman f,Dmitry A. Petrakov e, Alexei Rudoy g, Tom Clifton h, Nathaniel A. Lifton d, h,Marc W. Caffee d, h
a Geomorphology & Glaciology, Department of Physical Geography, Stockholm University, Swedenb Bolin Centre for Climate Research, Stockholm University, Swedenc School of Geography, Queen Mary University of London, UKd Department of Earth, Atmospheric, and Planetary Sciences, Purdue University, USAe Faculty of Geography, Lomonosov Moscow State University, Russiaf Department of Earth Sciences, University of Gothenburg, Swedeng Department Geology and Geography, National Research Tomsk State University, Russiah Department of Physics and Astronomy, Purdue Rare Isotope Measurement Laboratory (PRIME Lab), Purdue University, USA
a r t i c l e i n f o
Article history:Received 7 March 2016Received in revised form25 July 2016Accepted 26 July 2016Available online 11 August 2016
Keywords:AltaiPaleoglaciationSurging glacierGeomorphologySedimentology10Be and 26Al surface exposure datingMoraines
* Corresponding author. Geomorphology & GlacioloE-mail address: [email protected] (N
http://dx.doi.org/10.1016/j.quascirev.2016.07.0320277-3791/© 2016 Published by Elsevier Ltd.
a b s t r a c t
The Southern part of the Russian Altai Mountains is recognized for its evidence of catastrophic glaciallake outbursts. However, little is known about the late Pleistocene paleoglacial history, despite the in-terest in such reconstructions for constraining paleoclimate. In this study, we present a detailed pale-oglaciological reconstruction of the Chagan Uzun Valley, in the Russian Altai Mountains, combining forthe first time detailed geomorphological mapping, sedimentological logging, and in situ cosmogenic 10Beand 26Al surface exposure dating of glacially-transported boulders. The Chagan Uzun Valley exhibits themost impressive glacial landforms of this sector of the Altai, with extensive lobate moraine beltsdeposited in the intramontane Chuja Basin, reflecting a series of pronounced former glacial advances.Observations of “hillside-scale” folding and extensive faulting of pre-existing soft sediments within theouter moraine belts, together with the geomorphology, strongly indicate that these moraine belts wereformed during surge-like events. Identification of surge-related features is essential for paleoclimateinference because these features correspond to a glacier system that is not in equilibrium with thecontemporary climate, but instead largely influenced by various internal and external factors. Therefore,no strict relationship can be established between climatic variables and the pronounced distal glacialextent observed in the Chagan Uzun Valley/Chuja basin. In contrast, the inner (up-valley) glacial land-forms of the Chagan Uzun valley were likely deposited during retreat of temperate valley glaciers, closeto equilibrium with climate, and so most probably triggered by a general warming. Cosmogenic agesassociated with the outermost, innermost, and intermediate moraines all indicate deposition timesclustered around 19 ka. However, the actual deposition time of the outermost moraine may slightlypredate the 10Be ages due to shielding caused by subsequent lake water coverage. This chronology in-dicates a Marine Isotope Stage (MIS) 2 last maximum extent of the Chagan Uzun Glacier, and an onset ofthe deglaciation around 19 ka. This is consistent with other regional paleoclimate proxy records and withthe Northern Hemisphere glaciation chronology. Finally, this study also highlights the highly dynamicenvironment in this area, with complex interactions between glacial events and the formation anddrainage of lakes.
© 2016 Published by Elsevier Ltd.
gy, Department of Physical Geography, Stockholm University, Sweden.. Gribenski).

N. Gribenski et al. / Quaternary Science Reviews 149 (2016) 288e305 289
1. Introduction
Reconstructions of the former extents of mountain glaciers canbe a useful paleoclimate proxy because their advance and retreatare largely controlled by changes in temperature and precipitation(Cuffey and Paterson, 2010). However, non-climatic factors (such asinternal ice dynamics, topography or bed geology) can also influ-ence the advance or retreat of a glacier (e.g., Benn and Lehmkuhl,2000; Glasser et al., 2005). Moreover, the fragmented nature ofpreserved glacial landforms and difficulties in constraining theirages are additional uncertainties to be considered when using suchrecords for paleoclimate reconstructions (Kirkbride and Brazier,1998; Kirkbride and Winkler, 2012; Barr and Lovell, 2014).Despite these limitations this archive offers considerable advantagerelative to more traditional high-resolution stratigraphic andcontinuous proxies (e.g., ice-core, lacustrine, and speleothem re-cords): their wide geographical distribution provides a broaderdistribution of location-specific nodes yielding information aboutformer local or regional climate conditions (Schaefer et al., 2006;Kirkbride and Winkler, 2012). This information is particularlyuseful for testing and developing general circulation models (GCM)(Solomina et al., 2008; Jomelli et al., 2009), especially for areaslocated at the confluence of major climatic systems because theseregions are more sensitive to changes in atmospheric circulationpatterns (Rupper and Roe, 2008).
Central Asia, which comprises the Pamir, Tian Shan, Kunlun, andAltai mountains (Fig. 1), is located at the confluence of mid-latitudeWesterlies and the Siberian High pressure system (Aizen et al.,2006; Shahgedanova et al., 2010). Numerous mountain glaciersand associated landforms have been mapped in this region (eg.,Sapozhnikov, 1911; Novikov, 1988; Butvilovsky, 1993; Bussemer,2001; Shahgedanova et al., 2010; Stroeven et al., 2013; Blomdinet al., 2016). Despite the potential of the area for understandingthe climate system, relatively few studies provide robust paleo-glacial reconstructions, especially within the Altai Mountains.
This paper provides a detailed paleoglacial reconstruction of theChagan Uzun valley, located in the Kuray-Chuja intermontane basinarea, in the southeastern part of the Russian Altai (Fig. 1). This areahas attracted attention due to its history of extensive glacier-
Fig. 1. The general geomorphological setting of the region. The Chagan Uzun Valley is locatemap show the study area. (For interpretation of the references to colour in this figure lege
impounded paleolakes and related discharge events (e.g. Rudoy,1981, 2002; Rudoy and Baker, 1993; Carling et al., 2002; Herget,2005; Reuther et al., 2006), reported as among the largest floodevents on Earth (Baker et al., 1993; Margold et al., 2011). Re-constructions of these ice-dammed lakes and their dynamics havealso been used to infer the timing of former glacier expansions andretreat (Okishev,1982; Rudoy and Baker,1993; Reuther et al., 2006).The first descriptive paleoglacial studies of the Chagan Uzun valleyappear in the 1960s (Shukina, 1960; Popov, 1962), while the firstattempts at absolute dating were done in 1970s (Svitoch, 1978;Svitoch and Parunin, 1976). However, the ages were unreliabledue to methodological weaknesses. Likewise, there is a lack ofreliable age control for glacial features in the Kuray-Chuja basinarea, which has thus far hampered the reconstruction of reliableglacier chronologies in this area. In this study, we focus on under-standing the former glacial dynamics from the glacial depositsidentified in the Chagan Uzun Valley. Detailed geomorphologicaland sedimentological investigations provide a framework for in situcosmogenic 10Be and 26Al surface exposure dating and for makingpaleoclimate inferrences. We also discuss the interaction betweenglacial advances and lake formation and drainage.
1.1. General geographical context
The Chagan Uzun Valley is located in the southern part of theRussian Altai Mountains, in Central Asia (Fig. 1). The Altai Moun-tains extend more than 1500 km across the borderlands betweenKazakhstan, Russia, China and Mongolia, comprising alternatingranges and tectonic depressions that are roughly orientated NW-SEand E-W. The large-scale arrangement is controlled by sub-paralleland subsidiary intersecting fault systems, primarily originatingfrom India-Eurasia convergence (Delvaux et al., 1995).
Key topographic features within the southern Russian Altai arethe Kuray and Chuja basins: two large and interconnected basinsdrained by the Chuja River (Fig. 1). These tectonic depressions,initiated in the late Eocene-Oligocene, have been enhanced byintense vertical movement of around 2500 m during the latePliocene and subsequently filled with up to 1200 m of sediments(Delvaux et al., 1995; Carling et al., 2002). The Kuray and Chuja
d at the south-western margin of the Chuja basin. Yellow box and red dot in the insetnd, the reader is referred to the web version of this article.)

N. Gribenski et al. / Quaternary Science Reviews 149 (2016) 288e305290
basins, with floors at ~1500 and ~1700e1800 m above sea level (ma.s.l.), respectively, are bounded by the North Kuray Range to thenorth, and the North and South Chujski ranges to the south. Indi-vidual peaks reach altitudes above 4000 m a.s.l. (Fig. 1). Numerouslobate moraine complexes, formed during previous periods ofglacier expansion, are concentrated at the southern margin of thebasins. The most prominent series of these lobate moraines occursin the southwestern part of the Chuja basin along the Chagan Uzunvalley (Fig. 1).
The Chagan and the Taldura rivers join to form the Chagan UzunRiver, which cuts through the Chagan Uzun glacial deposits formore than 15 km, and then joins the Chuja River (Fig. 1). Thecatchment of the Chagan Uzun drainage system is predominantlycomposed of gneisses and schists, but also includes sedimentaryand lightly metamorphosed rocks (sandstones, siltstones andsericite-chlorite shales) and granitic intrusions (Dmitrieva et al.,1959). Numerous seismic dislocation features attest to the hightectonic activity of the area (Rogozhin et al., 2007). It is likely thatlarge-magnitude earthquakes have triggered large landslides in thearea, as in 2003, when an Ms 7.5 earthquake triggered thedetachment of a mass of ~3.107 m3 along the Chagan-Taldurainterfluve (Rogozhin et al., 2007).
1.2. Glacial lakes of the Kuray and Chuja basins
The interconnected Kuray and Chuja basins, which are enclosedby high mountain ranges (Fig. 1), form an ideal setting for thedevelopment of ice-impounded lakes. Glaciers expanding acrossnarrow gorges at the exit of the Kuray Basin (Maaschej Glacier,emanating from the North Chujski Range, and Chibit and Belgebashglaciers emanating from the North Kuray Range) and between theKuray and Chuja basins (Kuehtanar Glacier; Fig. 1) are considered tohave repetitively dammed the Chuja River in the past (Rudoy, 1981;Baker et al., 1993; Herget, 2005). River damming by glaciers hascaused the repeated formation of extensive glacial lakes withineither one or both basins (Obruchev, 1914; Okishev, 1982; Bakeret al., 1993; Rudoy and Baker, 1993; Rudoy, 1998). The existenceof these paleo-lakes is confirmed by the presence of lacustrinesediments and numerous shorelines in the Kuray and Chuja basins,between 1615 and 2000 m a.s.l. and 1940e2100 m a.s.l., respec-tively (Carling et al., 2002, 2011). Higher lake levels, up to 2250 ma.s.l., have been suggested by other authors (Rudoy, 2002; Rusanov,2008) but remain unconfirmed (Herget, 2005; Bohorquez et al.,2015). Isolated large boulders on basin floors and on shorelineshave previously been interpreted as dropstones melted out fromicebergs drifting on these lakes (Rudoy, 1981; Carling, 1996; Carlinget al., 2011). Landslide deposits identified near the mouth of theKuehtanar Valley (Fig. 1) have also been suggested as havingtemporarily dammed the Chuja River. However, this process couldonly generate minor lakes (maximum elevation of 1750 m a.s.l.) inthe Chuja Basin alone (Butvilovsky, 1993; Agatova et al., 2014).
Sudden drainage of the largest of these late Pleistocene glaciallakes produced peak discharges that are among the largest knownon Earth (>107 m3 s�1) (e.g., Baker et al., 1993; Rudoy, 2002; Herget,2005; Reuther et al., 2006). Main evidence for these catastrophicdrainage events are large gravel dune fields found in the two basinsand further downstream in the Katun Valley (Carling, 1996; Rudoy,1998; Carling et al., 2002) and giant gravel bars at the confluence ofthe Chuja and Katun rivers, near the villages of Inja and Jaloman(Rudoy and Baker,1993; Carling et al., 2002; Herget, 2005) (Fig.1). Asequence of three lacustrine units interbedded with flood graveldeposits has been identified in Inja Valley (Fig. 1), providing evi-dence for at least three flooding events (Carling et al., 2002; Herget,2005), although it is likely that more events occurred during thePleistocene (Rudoy, 1998, 2002; Carling et al., 2002; Herget, 2005).
Based on 10Be ages obtained from boulders located on the giantgravel bars near Jaloman and from dropstones in both basins,Reuther et al. (2006) dated the last and largest late Pleistocenecataclysmic flood in the area (lake level ~2100 m a.s.l. and watervolume ~600 km3) at 15.8 ± 1.8ka (original age calculated usingStone (2000) production rate and Lal (1991)/Stone (2000) scalingfactor). However, recalculating these 10Be ages using the recentproduction rate by Borchers et al. (2016) and the “Sa” scalingscheme of Lifton et al. (2014), as used in this study (cf Methods,section 2.), upgrades the timing of this outburst event to 18.7 ± 1.6ka.
A much smaller lake, with an elevation up to 1800 m a.s.l. at itsmaximum filling, is suggested to have existed nearly throughoutthe entire Holocene (Rusanov, 2010; Agatova et al., 2014). Thetiming of this smaller lake is based on the presence of Late Pleis-tocene Holocene ostracode fauna in lacustrine sediments locatedaround 1750e1800 m a.s.l, and on radiocarbon dates from soilformation post-dating the existence of this lake (Agatova et al.,2014). Additional chronological data associated with lake epi-sodes and/or drainage events are reported in the literature ca. 15,20, 25, 32 and > 45 ka. These ages are based on radiocarbon andthermoluminescence dating of lacustrine deposits, shorelines andalluvial units (Carling et al., 2002; Herget, 2005). However, the lackof documentation regarding the methods used and characteristicsof the sampled material hampers an assessment of data quality.
1.3. Existing chronological constraints on the glacial history
Despite the rich record of glacial landforms identified in theRussian Altai (Popov, 1962; Butvilovsky, 1993; Blomdin et al., 2016),especially along the southern margins of the Chuja and Kuray ba-sins, there is a lack of robust chronological data for inferring theglacial expansion and retreat patterns in this region.
Several attempts using different techniques to date the morainedeposits in the Kuray-Chuja basin area (including the Chagan Uzunvalley) have been made over the past. These include radiocarbon(e.g, Markov, 1978; Okishev, 1982; Butvilovsky, 1993), varve-counting (Sheinkman, 2011), thermoluminescence (Svitoch, 1978;Rudoy, 1998; Sheinkman, 2011) and Optically-Stimulated Lumi-nescence (Infra-red wave length stimulation, IRSL; Lehmkuhl et al.,2007). These data provide highly variable glacial chronologies, witha last glacial maximum timing varying from ~20 ka (Lehmkuhlet al., 2007) to ~60 ka (Svitoch, 1978) or >80 ka (Sheinkman,2011), and additional glacial advances suggested between ~20and 30 ka (Markov, 1978; Okishev, 1982; Butvilovsky, 1993; Rudoy,1998) and ~13 ka (Okishev,1982; Butvilovsky,1993). However, mostof these chronological data have to be considered cautiouslybecause of the limitations of the applied methods, given thegeologic setting, or because of insufficient documentation. Forexample, an important constraint when using OSL techniques is theneed for full signal resetting (bleaching) prior to deposition ofsediments. The bleaching efficiency depends on sediments daylightexposure, which has been shown to be problematic in glacial set-tings and might therefore lead to an overestimation of ages (e.g.,Gemmell, 1988; Duller, 2006; Lukas et al., 2007; Alexanderson andMurray, 2012; Blomdin et al., 2012). Full resetting is even morechallenging when using TL, because it requires longer light expo-sure time and a source of heat, which is also problematic in glacialenvironments (Forman, 1988). The varve-counting approachadopted by Sheinkman (2011) lacks a robust description of themethodology and so the reliability of the ages cannot be indepen-dently assessed. Likewise, for most of the pre-Holocene 14C agesfrom this area, insufficient information regarding sample charac-teristics and/or locations hampers an evaluation of their reliabilityand their use.
N. Gribenski et al. / Quaternary Science Reviews 149 (2016) 288e305 291
The development of cosmogenic dating techniques in the late20th century led to major advances in geochronology and iscurrently widely used in geomorphology, including paleoglaciology(Cerling and Craig, 1994; Fabel and Harbor, 1999; Cockburn andSummerfield, 2004; Balco, 2011). Reuther (2007) applied 10Besurface exposure dating on moraines from the Chibit and Maschejglaciers (Fig. 1) to reconstruct the Late Pleistocene glacial history ofthe area. They found well-clustered exposure ages with a mean of13.8 ± 1.4 ka for the Chibit Glacier moraine (ages calculated usingStone (2000) production rate and Lal (1991)/Stone (2000) scalingfactor) but were unable to obtain reliable ages for the MaschejGlacier moraine due to low quartz contents of the collected sam-ples. They also sampled three boulders in the Chagan Uzun valley.However, besides poor AMS performance for two of the boulders,their deposition couldn't be unequivocally related to a Chagan Uzunglacier advance and they were rather regarded as dropstones. Inaddition to the 13.8 ± 1.4 ka glacial extent, Reuther et al. (2006)suggested an earlier glacial advance period before 16 ka, based onthe paleolake outburst dated at 15.8 ± 1.8 ka (cf section 1.2), whichwas attributed to the climatically-induced downwasting of the icedam. However, updated 10Be ages (using Borchers et al. (2016)production rate and Lifton et al. (2014) “Sa” scaling factor), showsthat the Chibit moraine were most probably formed around 16.3 kaand the paleolake outburst occurred around 18.7 ka. Finally, evi-dence for Late Holocene (Little Ice Age (13th to 18th century) and2.3 to 1.7 ka) glacial re-advances are reported by Agatova et al.(2014), based on radiocarbon dating and dendrochronologyapplied to several glacial valleys in the south-eastern Russian Altai.
Paleoglacial studies performed in the Chuja River basin show alack of robust and direct glacial chronologies and highlight the needof detailed dating campaigns with suitable techniques to identifythe patterns of glacier expansion and retreat in the SouthernRussian Altai. This study presents a detailed geomorphological andchronological reconstruction of the paleoglacial history in theChagan Uzun Valley, located in the South Russian Altai, relying onremote sensing analysis, field evidence and using in situ 10Be sur-face exposure dating.
2. Methods
2.1. Geomorphological mapping
Detailed geomorphological mapping covering 750 km2 wasconducted in the Chagan Uzun Valley. To reconstruct former iceextent, dynamics, and flow directions, the following glacial land-forms were mapped using criteria summarized in Table 1: moraineridges, meltwater channels, and ice-scoured landscapes. In
Table 1Identification criteria and significance of landforms and deposits mapped in the Chagan
Landform Identification criteria
Moraine ridge Prominent ridges extended across valley floors and/or alLinear, curved, sinuous or saw-toothed plan form.
Meltwater channels Linear depression on bedrock or sediment. Can be parallthe valley slope. Can also be parallel to, or cross-cut, mor
Roches moutonn�ees Bare bedrock features, with stoss- and lee-side topograpon rock surface.
Lacustrine deposits Thick and extensive deposit of silt sediments. Yellow-beitrue colour images.
Landslide features Scar: edge located on upper slope part, marking abrupt sslope below the scarp. Linear, more or less concave shapMassive unconsolidated accumulation of unsorted materslope, usually overhung by scarp.
addition, major landforms and deposits of non-glacial origin,intrinsically linked with the geomorphic evolution of the area(landslides associated features and extensive lacustrine deposits),were also recorded.
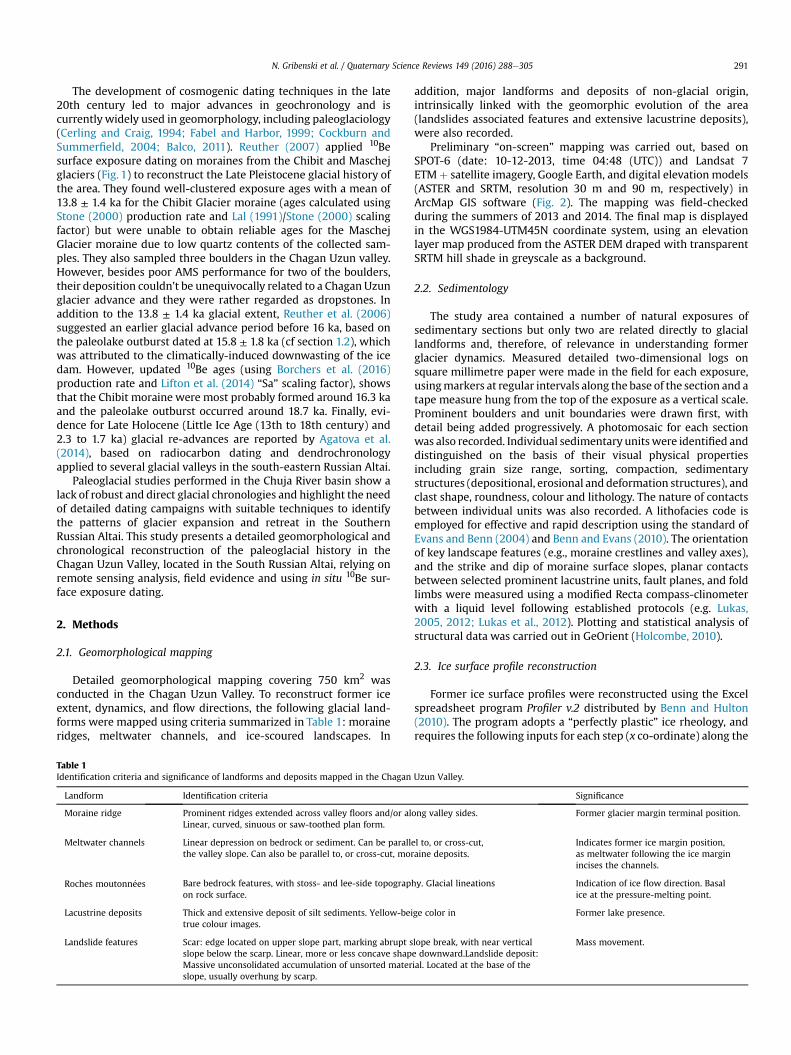
Preliminary “on-screen” mapping was carried out, based onSPOT-6 (date: 10-12-2013, time 04:48 (UTC)) and Landsat 7ETMþ satellite imagery, Google Earth, and digital elevation models(ASTER and SRTM, resolution 30 m and 90 m, respectively) inArcMap GIS software (Fig. 2). The mapping was field-checkedduring the summers of 2013 and 2014. The final map is displayedin the WGS1984-UTM45N coordinate system, using an elevationlayer map produced from the ASTER DEM draped with transparentSRTM hill shade in greyscale as a background.
2.2. Sedimentology
The study area contained a number of natural exposures ofsedimentary sections but only two are related directly to glaciallandforms and, therefore, of relevance in understanding formerglacier dynamics. Measured detailed two-dimensional logs onsquare millimetre paper were made in the field for each exposure,usingmarkers at regular intervals along the base of the section and atape measure hung from the top of the exposure as a vertical scale.Prominent boulders and unit boundaries were drawn first, withdetail being added progressively. A photomosaic for each sectionwas also recorded. Individual sedimentary unitswere identified anddistinguished on the basis of their visual physical propertiesincluding grain size range, sorting, compaction, sedimentarystructures (depositional, erosional and deformation structures), andclast shape, roundness, colour and lithology. The nature of contactsbetween individual units was also recorded. A lithofacies code isemployed for effective and rapid description using the standard ofEvans and Benn (2004) and Benn and Evans (2010). The orientationof key landscape features (e.g., moraine crestlines and valley axes),and the strike and dip of moraine surface slopes, planar contactsbetween selected prominent lacustrine units, fault planes, and foldlimbs were measured using a modified Recta compass-clinometerwith a liquid level following established protocols (e.g. Lukas,2005, 2012; Lukas et al., 2012). Plotting and statistical analysis ofstructural data was carried out in GeOrient (Holcombe, 2010).
2.3. Ice surface profile reconstruction
Former ice surface profiles were reconstructed using the Excelspreadsheet program Profiler v.2 distributed by Benn and Hulton(2010). The program adopts a “perfectly plastic” ice rheology, andrequires the following inputs for each step (x co-ordinate) along the
Uzun Valley.
Significance
ong valley sides. Former glacier margin terminal position.
el to, or cross-cut,aine deposits.
Indicates former ice margin position,as meltwater following the ice marginincises the channels.
hy. Glacial lineations Indication of ice flow direction. Basalice at the pressure-melting point.
ge color in Former lake presence.
lope break, with near verticale downward.Landslide deposit:ial. Located at the base of the
Mass movement.
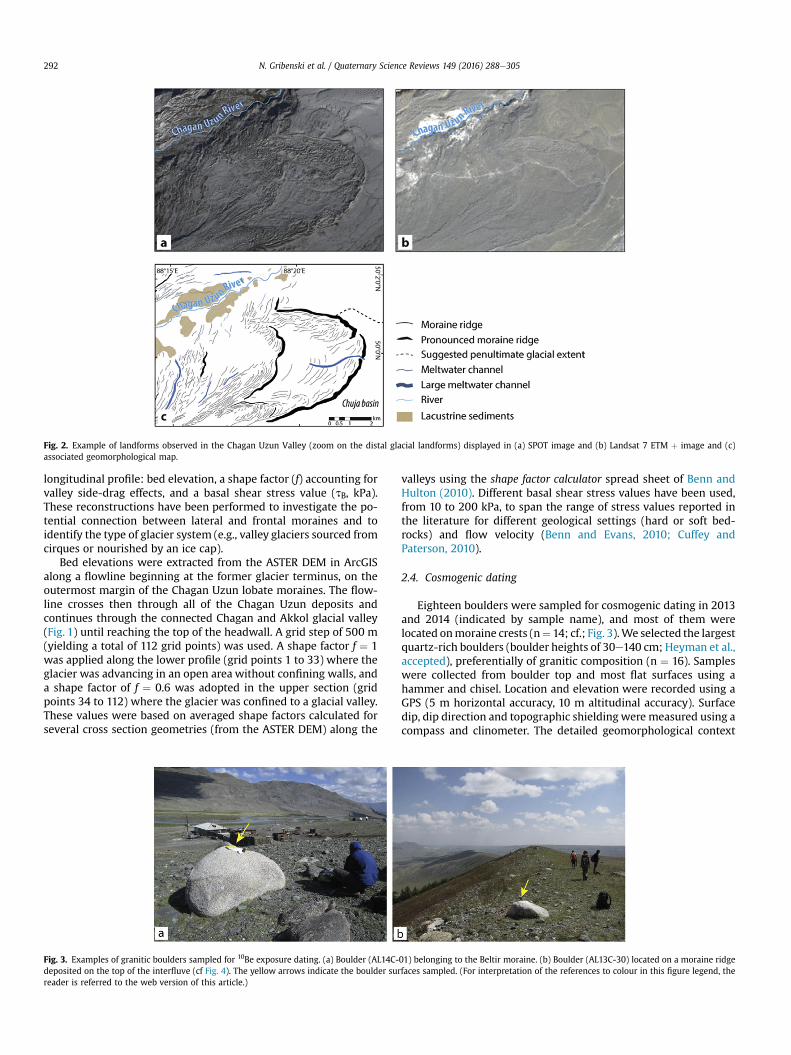
Fig. 2. Example of landforms observed in the Chagan Uzun Valley (zoom on the distal glacial landforms) displayed in (a) SPOT image and (b) Landsat 7 ETM þ image and (c)associated geomorphological map.
N. Gribenski et al. / Quaternary Science Reviews 149 (2016) 288e305292
longitudinal profile: bed elevation, a shape factor (f) accounting forvalley side-drag effects, and a basal shear stress value (tB, kPa).These reconstructions have been performed to investigate the po-tential connection between lateral and frontal moraines and toidentify the type of glacier system (e.g., valley glaciers sourced fromcirques or nourished by an ice cap).
Bed elevations were extracted from the ASTER DEM in ArcGISalong a flowline beginning at the former glacier terminus, on theoutermost margin of the Chagan Uzun lobate moraines. The flow-line crosses then through all of the Chagan Uzun deposits andcontinues through the connected Chagan and Akkol glacial valley(Fig. 1) until reaching the top of the headwall. A grid step of 500 m(yielding a total of 112 grid points) was used. A shape factor f ¼ 1was applied along the lower profile (grid points 1 to 33) where theglacier was advancing in an open area without confining walls, anda shape factor of f ¼ 0.6 was adopted in the upper section (gridpoints 34 to 112) where the glacier was confined to a glacial valley.These values were based on averaged shape factors calculated forseveral cross section geometries (from the ASTER DEM) along the
Fig. 3. Examples of granitic boulders sampled for 10Be exposure dating. (a) Boulder (AL14C-deposited on the top of the interfluve (cf Fig. 4). The yellow arrows indicate the boulder surreader is referred to the web version of this article.)
valleys using the shape factor calculator spread sheet of Benn andHulton (2010). Different basal shear stress values have been used,from 10 to 200 kPa, to span the range of stress values reported inthe literature for different geological settings (hard or soft bed-rocks) and flow velocity (Benn and Evans, 2010; Cuffey andPaterson, 2010).
2.4. Cosmogenic dating
Eighteen boulders were sampled for cosmogenic dating in 2013and 2014 (indicated by sample name), and most of them werelocated onmoraine crests (n¼ 14; cf.; Fig. 3).We selected the largestquartz-rich boulders (boulder heights of 30e140 cm; Heyman et al.,accepted), preferentially of granitic composition (n ¼ 16). Sampleswere collected from boulder top and most flat surfaces using ahammer and chisel. Location and elevation were recorded using aGPS (5 m horizontal accuracy, 10 m altitudinal accuracy). Surfacedip, dip direction and topographic shielding were measured using acompass and clinometer. The detailed geomorphological context
01) belonging to the Beltir moraine. (b) Boulder (AL13C-30) located on a moraine ridgefaces sampled. (For interpretation of the references to colour in this figure legend, the

Table 2Details of 10Be and 26Al cosmogenic nuclide analyses and corresponding surface exposure ages.
Sample Moraine complex Location (�N/�E) Alt. (m a.s.l.) Thick. (cm) Shield.Factor
[10Be] (105 at.g�1) [26Al](105 at.g�1) 10Be ages (ka), Sa Ext. unc. Int. unc. 26Al ages (ka), Sa Ext. unc. Int. unc. Meanand std
AL13C-30 Moraine fragmenton interfluve(up-valley)
49.95213/88.08892 2399 3 1.000 5.474 ± 0.074 39.999 ± 0.780 19.4 1.5 0.3 20.0 2.1 0.4 19.2 ± 0.4a
AL13C-31 49.95208/88.08964 2395 3 1.000 5.296 ± 0.150 38.379 ± 0.745 18.9 1.5 0.5 19.0 2.0 0.4AL13C-32 49.95244/88.09602 2378 3 1.000 6.751 ± 0.090 36.034 ± 0.708 24.1 1.8 0.3 18.0 2.0 0.3AL13C-33 Moraine fragment
on interfluve(down-valley)
49.96234/88.13419 2235 1.6 0.997 4.881 ± 0.107 32.316 ± 0.949 19.4 1.5 0.4 18.2 1.9 0.5 19.4 ± 0.4b
AL13C-34 49.96252/88.13432 2238 2.5 1.000 7.995 ± 0.099 48.855 ± 0.810 31.4 2.4 0.4 27.2 2.9 0.4
AL13C-26 Interfluve kameterrace
49.94995/88.11057 2214 3 0.999 4.310 ± 0.057 29.463 ± 0.541 17.6 1.4 0.2 17.0 1.8 0.3 18.5 ± 0.8AL13C-27 49.94995/88.10899 2227 3 0.999 4.498 ± 0.059 32.010 ± 0.536 18.2 1.4 0.2 18.0 2.0 0.3AL13C-28 49.94894/88.10675 2232 2.5 1.000 4.879 ± 0.108 33.941 ± 0.849 19.5 1.5 0.4 19.2 2.1 0.5AL13C-29 49.94883/88.10642 2232 3.5 1.000 4.629 ± 0.086 34.146 ± 0.642 18.7 1.4 0.3 19.0 2.0 0.4AL14C-01 Beltir Moraine 49.97573/88.17863 1982 2.3 0.999 4.318 ± 0.060 29.166 ± 0.574 20.8 1.6 0.3 20.0 2.0 0.4 19.7 ± 1.2AL14C-02 49.97573/88.17863 1982 2.8 0.999 4.223 ± 0.063 27.187 ± 0.520 20.5 1.5 0.3 19.0 2.0 0.3AL14C-03 49.97489/88.17643 1988 1 1.000 3.830 ± 0.064 25.411 ± 0.563 18.3 1.5 0.3 17.1 1.8 0.4AL14C-04 49.97489/88.17656 1982 2.5 0.995 3.917 ± 0.062 28.829 ± 0.663 19.1 1.5 0.3 20.0 2.0 0.4AL13C-35 Outermost moraine
(CUMC 1)50.01659/88.35239 1952 3 1.000 3.914 ± 0.068 e 19.5 1.5 0.3 e e 19.2 ± 1.8c
AL13C-36 50.01604/88.35457 1956 3 0.998 4.341 ± 0.086 e 21.5 1.7 0.4 e e
AL13C-37 50.0137/88.36292 1925 2.5 1.000 6.997 ± 0.084 e 34.9 2.7 0.4 e e
AL13C-38 50.00481/88.3769 1876 3 0.996 3.366 ± 0.074 e 17.9 1.4 0.4 e e
AL13C-39 50.00429/88.3771 1876 2.5 0.990 3.316 ± 0.105 e 17.7 1.5 0.5 e e
The samples were measured using the 10Be isotope ratio standardization 07KNSTD (Nishiizumi et al., 2007) and the 26Al isotope ratio standardization KNSTD (Nishiizumi, 2004). Final 10Be and 26Al concentrations includemeasured blank corrections (correcting value based on averaged nuclide concentrations of the blanks processed during the AMS measurements of the samples): 65.204 ± 29.100 10�3 at.g�1 Be carrier and 98.209 ± 14.78710�3 at.g�1 Al carrier for AL13C-26 to 34 and AL14C-01 to 04; 387.286 ± 39.809 10�3 at.g�1 Be carrier for AL13C-35 to 39.All ages were calculated using the CRONUScalc program (Marrero et al., 2016), and using the CRONUS-Earth 10Be and 26Al production rates assessed by Borchers et al. (2016). These are minimum ages with no post-depositionalerosion assumed. The adopted rock density is 2.65 g.cm�3.
a AL13C-32 rejected for mean and standard deviation calculation, due to complex exposure history.b AL13C-34 rejected for mean and standard deviation calculation, due to complex exposure history.c AL13C-37 rejected for mean and standard deviation calculation, as identified as an outlier.
N.G
ribenskiet
al./Quaternary
ScienceReview
s149
(2016)288
e305
293

N. Gribenski et al. / Quaternary Science Reviews 149 (2016) 288e305294
was recorded through notes and photographs of sample locations.Key sample information is provided in Table 2.
All samples were prepared for 10Be analysis. Additionally, 26Alanalyses were carried out for 13 samples to investigate any po-tential burial-exposure history of the corresponding boulders (Lal,1991; Nishiizumi et al., 1993; Gosse and Phillips, 2001).
Laboratory processing and measurement of the rock sampleswere performed at the Purdue Rare Isotope Measurement Labora-tory (PRIMELab). After sample crushing and sieving (250e500mm),quartz was isolated following modified procedures based on Kohland Nishiizumi (1992). Quartz was then dissolved in HF and HNO3and spiked with a Be carrier. Standard anion and cation exchangecolumnprocedureswere used for Al and Be separation (e.g., Strelowet al., 1972; Ochs and Ivy-Ochs, 1997). Target holders (cathodes) forAMSmeasurements were filled with the resulting Be and Al oxides,mixed with Nb and Ag powders, respectively.
Ages were calculated using the online CRONUScalc program(Marrero et al., 2016), and using the CRONUS-Earth 10Be and 26Alproduction rates assessed by Borchers et al. (2016) (also see Phillipset al. (2016) summary paper). Ages are reported using the time- andnuclide-dependent scaling scheme LSDn (or “Sa”; Lifton et al.,2014). Topographic shielding has been accounted for in our agecalculations, but not potential post-depositional surface erosioneffects, as no reliable long-term erosion rates are available in thearea. However, erosion rates of 1e3 mm/ka, as used by others inCentral Asia (e.g. Koppes et al., 2008; Rother et al., 2014), wouldresult in an increase of ~1e6% of the reported ages <30 ka (up to10% for the ages >30ka).
3. Results and interpretation
3.1. Glacial geomorphology
3.1.1. ResultsThe Chagan Uzun Valley system is roughly oriented SW-NE and
displays numerous glacial features (Figs. 1 and 4). The upper part ofthe system is composed of three main tributary valleys: the Chagan
Fig. 4. Geomorphological map of the Chagan Uzun Valley, with the four Chagan Uzun Morainboxes indicate the location of the sediment exposures a) CHU 1 and b) CHU 2. Moraine ridgespreserved on the Chagan-Taltura interfluve.
Valley, (draining the Akkol river), the Taldura Valley and the Kus-kunnur Valley (Figs.1 and 4), which exhibit characteristic profiles ofglacial troughs. In the middle part of the system, where the threevalleys join, there is a rich record of lateral moraine ridges andmeltwater channels. An abrupt transition between hard bedrock,characterised by a well-developed ice-scoured landscape withnumerous roches moutonn�ees, and soft bedrock occurs a few ki-lometers up-valley from the Chagan-Taldura river junction (Fig. 4).The two rivers are separated by a prominent interfluve, which alsodisplays fragments of moraine ridges and kame terraces (Fig. 4).
Slopes of the distal, lowermost, section of the interfluve havebeen steepened by weathering processes and large landslides,revealing a large sedimentary section facing the Chagan River(Figs. 4 and 5).
A first set of small, well-defined frontal moraine ridges isidentified close to the Chagan-Taldura drainage divide, on theChagan valley side. The Beltir settlement is located (Fig. 4) on thisfeature. Downstream of this set of moraine ridges lies the mostprominent geomorphological feature (>100 km2) consisting of se-ries of moraines expanding in the Chuja basin and exhibiting adouble-lobate outline (Figs. 1 and 4). This landscape displays amultitude of narrow superimposed ridges and a few pronouncedridges with steep distal slopes (Fig. 4). The pattern and concen-tration of narrow ridges, combined with meltwater channels andpronounced ridges allow us to identify four different morainecomplexes (Chagan Uzun Moraine Complexes, CUMC 1 (mostdistal) to CUMC 4, (most proximal)) in addition to the Beltir mo-raines. CUMC 1 and 2 exhibit a similar morphology: both form awide and chaotic belt of multiple fragmented narrow moraineridges of varying orientation, bordered by a pronounced welldefined outer ridge with a steep distal slope. The outline of CUMC 1describes a double lobate shape, while the CUMC 2 splays intomoreand smaller lobes, exhibiting a more interdigitating pattern (Fig. 4).Large lateral meltwater channels are absent in this area. CUMC 3displays a transitional pattern from multiple chaotic narrow ridgesbordered by a pronounced distal ridge, to relatively continuous andaligned narrow ridges associated with well-developed large
e Complexes (CUMC 1 to 4) and the small well-defined Beltir moraine ridges. The blackand kame terraces (not visible at the scale; hence, represented by the asterisk) are also

Fig. 5. View of the Chagan section (in the background) and the landslide deposits in front of it, in the Chagan Valley. The shacks are indicated for the scale.
N. Gribenski et al. / Quaternary Science Reviews 149 (2016) 288e305 295
meltwater channels in the inner part (Fig. 4). CUMC 4 clearly differsfrom the distal CUMCs and is more similar to the up-valley Beltirmoraines, with well-defined sublinear aligned ridges curving to-wards the valley axis. These ridges are associated with large lateralmeltwater channels.
Other noteworthy features are thick accumulations of laminatedsilts (>tens of meters thick) exposed along the Chagan Uzun Riverwhich cuts through the different CUMCs (Fig. 4). These deposits arealso found beyond the CUMC 1. Besides, shorelines at and below c.1970 m a.s.l. have been cut into the prominent distal sides of CUMC1 and 2.
3.1.2. InterpretationThe ice-scoured landscape observed in the bare bedrock sec-
tions of the Chagan Uzun tributary valleys indicate the presence ofa temperate glacier with a wet-based thermal regime (Sugden andJohn, 1976; Sugden et al., 1992; Glasser, 2002).
The three glaciers (Chagan, Taldura and Kuskunnur) thatextended out of the South Chujski Range (Fig. 1) coalesced to formthe Chagan Uzun glacier system at the time of CUMC 1e4 deposi-tion. At maximum extent, this glacier system formed two coherentlobes extending into the sediment filled Chuja Basin. The wide-spread and chaotic occurrence of the CUMC 1 and 2 narrowmoraine ridges and the well-defined steep distal margins aretypical of glacial landforms resulting from the melting of stagnantice (hummocky moraine; Hambrey, 1994; Evans and Rea, 2003). Thenumerous and multi-directional narrow ridges may correspond tothe former pattern of debris within the decaying parent ice(controlled moraine; Benn and Evans, 1998; Evans, 2009). Thepresence and elevation of shorelines on the outer slopes of CUMC 1and 2 indicate their contact with a former glacial lake in the ChujaBasin. However, the lobate shapes of the moraine complexes, theirwell-defined and steep distal slopes, and the absence of formersubaqueous fans or gentler reworked slopes along their fringes,indicate that those units have initially been formed in a terrestrialor shallow subaqueous environment (e.g., Lønne, 1995; Powell,2003; Ottesen and Dowdeswell, 2006). The distinct geo-morphology of CUMC 4, with a succession of sub-parallel, well-defined, moraine ridges and large meltwater channels, indicatesthe former presence of an active glacier margin (Boulton and Eyles,1979; Benn et al., 2003). This interpretation is valid for the Beltirmoraines as well, even though they were deposited by a smallervalley glacier constrained to the lower Chagan valley. The presencein the distal section of CUMC 3 of geomorphological assemblagessimilar to those in glacial complexes down-valley (CUMC 1 and 2)and more ordered glacial landforms in its proximal section, mightindicate two glacial events (with the latter overprinting the
former), or it could reflect a transitional phase in glacier dynamicsduring deglaciation.
Finally, the accumulations of thinly-laminated silts observedalong the Chagan Uzun River indicate the former presence of lakes.These lacustrine sediments may have been accumulated in exten-sive glacial lakes filling the Chuja Basin and/or within proglacialmoraine-dammed lakes.
3.2. Sedimentology
The study area contains several natural exposures of sedimen-tary sections. The most impressive exposure, the Chagan section, islocated at the distal part of the Chagan-Taldura interfluve and re-veals a sediment section 200 m high and 4 km long. This section islaterally complex and can be divided into two main units: (i) alower yellowish-brownish unit with highly oxidised andweatheredsediments, interpreted as Pliocene in age based on the presence offish that are marker fossils (Popov, 1972; Shukina, 1960) and (ii) anupper unit, composed of a Quaternary succession of glacial andglaciofluvial sediments, reflecting successive episodes of glacialadvance and retreat (Shukina, 1960; Chernomorskiy et al., 1958;Popov, 1972; Rogozhin et al., 2007). However, two smaller sec-tions directly related to the studied glacial landforms CUMC 3 and4, CHU 1 and CHU 2 sections, are more highly relevant to an un-derstanding of the paleo-dynamics of the Chagan Uzun Glaciersystem. Their sedimentological characteristics are described andinterpreted below.
3.2.1. Results3.2.1.1. Section CHU 1. This section, which has been exposed byriver undercutting (50.01150�N, 88.23595�E; Fig. 4), is located inthe 50 m-high proximal hillside of a moraine belt belonging toCUMC 3. The crestline of the moraine belt near the river is orien-tated 320� and arcs around to 225� in the south, with the hillsideitself trending 145e325�. Several smaller exposures are visiblethroughout the hillside (Fig. 6a, b) and near the center of thearcuate moraine ridge, while a distinct exposure near the crestlinefurthest towards the NW is orientated almost perpendicular to thecrest (190�) (Fig. 6aed).
Sediments in the disparate exposures occur repeatedly and canbe grouped into two distinct lithofacies associations (LFAs) (Fig. 6a,b). LFA 1 comprises white-yellowish rhythmically-coupled, hori-zontally laminated silts and clays (Flv) with individual laminaebeing 1e5 mm thick, separated by dark-grey, 1-2 mm-thick claylaminae. Isolated clasts of up to 1 cm are rare. Interbedded withinLFA 1 are lenticular units of silty-sandy, matrix-supported, strati-fied diamicton (Dms) that reach 0.5 m in thickness and a maximum

Fig. 6. (a) Scaled sketch of disparate exposures in the hillside at CHU 1, with the distinct lithofacies, and (b) photograph of the whole hillside from the opposite side of the river. Top-left frames in (a) and (b) marks the position of (c) log and (d) photograph of a clear exposure along a footpath at the top and northwestern-most point of CHU1. Here, the inflectionpoint of an overturned fold is visible in crudely-stratified gravel units (cf LFA 2 description in 3.2.1). The inset lower-hemisphere Schmidt stereonet in (a) shows the strike and dip ofmeasured unit contacts (solid lines), poles to planes (dots) and the calculated fold axis (dashed line).
N. Gribenski et al. / Quaternary Science Reviews 149 (2016) 288e305296
lateral extent of 10 m. The clast content is estimated at 30e60% byarea and clast sizes range from fine-gravel to boulders (0.4 mmaximum a-axis length). Bullet-shapes are frequent and, visually,subangular and subrounded clasts dominate; all lithologies arelocal. Widespread reverse faulting has been observed throughout,with two styles of faulting, one within individual packages oflaminae not thicker than ~1 m and broadly subparallel to laminaealignment; and a second dipping at >30� and traversing thethickness of entire packages of LFA 1 at the scale of several meters.Associated displacements, indicated through clear tracer horizonsand folded contacts with surrounding coarser units, range from 1 to7 cm, with the greater displacements occurring along the secondtype of faults. LFA 2 dominantly consists of gravels of local prove-nance that are horizontally-bedded (Gh) or are massive withimbricated clasts (Gmi). Individual lithofacies within LFA 2 are: (a)medium to coarse gravel clearly imbricated in a white-ish mediumto coarse-sandy matrix; (b) black fine to medium massive gravel,with less-clear imbrication than in aforementioned cases; and (c)dark-grey to black medium to coarse gravel with a coarse-sandymatrix, clear imbrication and a massive appearance. Near the topof the exposure (Fig. 6c, d), these units describe a tight overturnedfold-core, with gravel A-B-planes and thus imbrications followingthe fold. Tracing of individual LFAs across the hillslope is aided byclear colour contrasts and grain size differences. The contacts be-tween both LFAs are sharp, with LFA 2 in places extending into theunderlying LFA 1 in half-channel structures (Fig. 6a, b).
Eight undisturbed planar contacts of individual units within LFA1 were measured across the whole hillside. During the measure-ments, a northern cluster emerged (n ¼ 2) where strike and dipdirection are offset by nearly 90� from the remaining (n ¼ 6)(Fig. 6a). If all eight measurements are used, the mean fold axisstrikes NE-SW (025e205�) (Fig. 6a); if the northern cluster isconsidered separately, it indicates a mean fold axis striking NeS
(003e183�), while the mean fold axis of the remaining southerlymeasurements strikes 044e224�.
3.2.1.2. Section CHU 2. This exposure is part of a much-longerroadside exposure in CUMC 4 (49.986017�N, 88.213933�E; Fig. 4)and crosses most of two moraine ridges at right angles. While theouter moraine of this set of ridges, which are part of the largercomplex, is not exposed, the majority of the inter-ridge sedimentsrepresent very gently-deformed (mainly buckled) laminated siltsand clays (akin to LFA 1 described above), but with a notableabsence of isolated clasts and diamictic units. CHU 2 is located inthe distal slope of the inner moraine ridge, the crestline of which isorientated 180�, swinging around to 240� towards Beltir. Theexposure contains two lithofacies (Fig. 7): The first is composed ofwhite-yellowish rhythmically-coupled, horizontally-laminatedsilts and clays (Flv). The second lithofacies consists of lenses ofsilty-sandy, matrix-supported, stratified diamicton up to 0.25 mthick with numerous fine- to coarse-gravel pods and clasts withmaximum a-axes of 0.3 m (Fig. 7b). These lenses are augen-shapedthroughout, and some are folded (A in Fig. 7a). Some lenses areoffset along normal and reverse faults (B in Fig. 7a; maximumdisplacement: 10 cm). Four measurements on normal-fault planes(1e4 in Fig. 7a) give a mean strike of 027e207�, with a mean dip of80� to the SE. Both lithofacies units are subparallel to the distalmoraine surface they underlie. Smaller exposures near the crestlineand on the proximal side reveal that this subparallelism continuesacross the moraine, describing an anticlinal structure in phase withthe land surface.
3.2.2. Interpretation3.2.2.1. Section CHU 1. The rhythmically-laminated nature of fine-grained sediments (Flv) with isolated clasts and isolated,laterally-coherent, beds of stratified diamictons (Dms) strongly

Fig. 7. (a) Log of exposure CHU 2, located in the distal slope of a moraine ridge belonging to CUMC 4, with distinct lithofacies, faults and augen-shaped lenses (also with reversefault). (b) Close-up photograph of augen-shaped lenses just above the three prominent normal faults labelled 2e4 in (a). The trowel is ca. 28 cm long. (c) Overview photograph ofsection CHU 2.
N. Gribenski et al. / Quaternary Science Reviews 149 (2016) 288e305 297
indicate that LFA 1 represents a succession of glaciolacustrinesediments (e.g. Fyfe, 1990; Benn, 1996; Bennett et al., 2000). Itseems likely that the majority of this succession was deposited inpositions distal to the ice margin due to a relatively low occurrenceof aforementioned isolated clasts, interpreted as dropstones, and ascarcity of units that indicate a higher-energy environment. How-ever, the distinct and continuous diamicts point to a more proximalsource at times. Based on their matrix component and stratifica-tion, they are interpreted as subaqueous debris flows (cf. Benn andEvans, 1993; Benn, 1996; Golledge, 2003; Lukas and Merritt, 2004).An ice margin close to this site is also consistent with the localised,sub-horizontal, non-pervasive disturbance within individual lami-nated packages (faults of type 1, above) (Lukas and Merritt, 2004;Phillips et al., 2007). LFA 2 structures, most notably the varyinggrain sizes within the coarse-sand to gravel spectrum and well-developed imbrications (Gmi), indicate a high-energy terrestrialenvironment that is characterised by varying water flow velocities,and is interpreted as proglacial outwash in a braided river(Collinson et al., 2006; Benn and Evans, 2010). Partial reworking ofLFA 1 when LFA 2was deposited is evident by the sharp contact andthe half-channel structures which are interpreted as small scoursand consistent with a relatively distal deposition of this outwashunit (cf. Marren, 2005).
The clear proglacial character of both LFAs indicates that theyexisted prior to being deformed into large ridges, as indicated bythe overturned fold structures most clearly evident in the top partof the exposure (Fig. 6c, d). The imbricationwithin LFA 2 (Fig. 6c, d)is present in both limbs of the fold, demonstrating internalcoherence even during folding, but also illustrating the difficulty ofusing imbrication as a bottom-up criterion; for this, more un-equivocal sedimentary structures such as ripples in sandy units orclear gradational sequences would be necessary (Reading, 1996;Collinson et al., 2006). When the unit fragments exposed in thehillside are linked in the most intuitive manner, a large overturnedfold with a fold axis broadly parallel to the crestline of theinnermost moraine (orientation ~320�) can be reconstructed.However, the overall fold probably appears more distorted due to
its apparent exposure rather than being exposed at right angles (cf.Twiss and Moores, 2007). Using planar unit contact measure-ments, tentative tracing of the change in fold axis orientationalong the moraine crestline was possible, and this is broadlyconsistent with the overall trend of the moraine crestline fromnorth to south (Fig. 4). Evidence for pervasive reverse faulting,potentially through the entire sedimentary package, is alsoconsistent with high stresses imparted on the sedimentary suc-cession, leading to brittle failure.
The sub-parallelism of the investigated fold axis with crestlineorientation and the coincidence of the fold core with the top of themoraine demonstrates a clear connection between folding andmoraine formation by sustained ice push (cf. Benn, 1992; Benn andEvans, 1993; Lukas, 2005, 2012; Benediktsson et al., 2008). Giventhat fold axes are aligned normal to the direction of stress (Twissand Moores, 2007), the measurements indicate that the glacier inthis case flowed from ~SW to ~ NE, accompanied by more localstresses acting at right angles to the former ice margin.
3.2.2.2. Section CHU 2. The lithofacies described above are highlysimilar to LFA 1 in section CHU 1, with the rhythmically-laminatedfines (Flv) interpreted as glaciolacustrine sediments and the dia-mictic units (Dms) as subaqueous debris flows. However, a crucialdifference at this site allows further insights into glacier dynamicsto be gained, and this is the ubiquitous presence of augen shapes.These shapes provide clear indications of shearing of pre-existingsediments as they were overridden by the glacier; thus, the lith-ofacies at this site are interpreted as glaciotectonites (cf. Banham,1977; Benn and Evans, 1996, 2010; Lukas, 2005; Evans et al.,2006; Lukas et al., 2012), and because mixing between Flv andDms is very limited, this glaciotectonism is classed as non-penetrative (cf. Benn and Evans, 1996, 2010). The dip of all unitsis sub-parallel to distal and proximal moraine slopes and indicatesthe formation of this moraine by ice push, broadly consistent withglacier flow from the southwest. Finally, the mapped orientation offault planes (297�) is also consistent with a direction of ice push atright angles, broadly from the southwest; in line with findings from

Fig. 8. Reconstructed ice surface profiles for the maximum extent of the Chagan Uzunglacier (CUMC 1) using in a) constant shear stress (10, 25, 50, 100 or 200 kPa), or in b)variable shear stresses, adapted to the bedrock type (25 kPa in the soft sedimentdomain; 50, 100 or 200 kPa, in the hardrock domain). Profiles with constant shearstress (25 and 200 kPa) are shown in dash lines for comparison. The figure c) displaysice surface profiles reconstructed for each identified extents, with a focus on the lowersection of the profile, dominated by soft bedrock and so where low shear stress valueswere applied (20 kPa, represented by the full line, and 15 and 25 kPa, respectivelyrepresented by the upper and lower dash lines). The moraine fragments and kameterrace located on the interfluve and used as 10Be sampling sites are also represented,to investigate the potential connections between these lateral marginal features andthe frontal landforms.
N. Gribenski et al. / Quaternary Science Reviews 149 (2016) 288e305298
Pleistocene push moraines elsewhere (e.g. Lukas, 2005, 2012).However, we cannot exclude a seismic origin of the faults.
3.3. Ice surface profile reconstructions
3.3.1. ResultsThe results of the ice surface profile reconstructions of the
Chagan Uzun Glacier (Fig. 8) show, firstly, ice profiles calculated forits maximum extent (CUMC 1) using a range of basal shear stress(tB) values applied equally along the whole profile (Fig. 8a). Inaccordance with the input basal drag, reconstructed ice thicknessesvary significantly, with a difference of ~1000m in themiddle part ofthe glacier between tB max ¼ 200 kPa and tB min ¼ 10 kPa.
Secondly, ice profiles of the Chagan Uzun Glacier at itsmaximum extent are modelled using varying shear stresses along
the profile to reflect changes in catchment geology (Fig. 8b). Indeed,the upper part of the Chagan Uzun catchment consists of glacialvalley incised in hard bedrock while thick accumulations of pre-existing soft lacustrine sediments were encountered by the Cha-gan Uzun glacier in the lower part of the profile, at its entrance inthe open Chuja basin. Therefore, a range of higher shear stresses(50e200 kPa), more appropriate for valley glaciers on hard bedrock(Cuffey and Paterson, 2010;Marshall et al., 2011), was applied to theupper domain and much lower shear stresses (�25 kPa), consistentwith values reported for unconstrained glaciers on deformablebeds (e.g., Alley et al., 1987; Humphrey et al., 1993; Benn andClapperton, 2000; Glasser and Jansson, 2005; Cuffey andPaterson, 2010) were applied to the lower domain. Diminishingthe shear stress in the distal part of the profile also results in a slightlowering of the ice surface in the upper domain, even though highshear stress values aremaintained in this upper area. For example, adifference of around 100 m in elevation is observed close to theheadwall between the ice surface profile reconstructed using auniform shear stress of 200 kPa and when the shear stress isdecreased to 25 kPa in the lower deformable bed domain.
Finally, Fig. 8c displays ice surface profiles reconstructed for allfive terminal positions identified (CUMC 1 to 4 and the Beltir mo-raines), with a focus on the lower part of the profile, where lowvalues of shear stress (15e25 kPa) are applied, in agreement withthe deformable nature (soft sediments) of the bed. The positions oflateral glacial landforms located on the interfluve, and used as 10Besampling sites, are also indicated. Although longer glaciers werethicker, for the same shear stress value, the difference in surfaceelevation between the five extents remains moderate (200 mmaximum between the Beltir and CUMC 1 ice profiles).
3.3.2. InterpretationThe assumption of a constant basal shear stress along the flow
line (Fig. 8a) is unrealistic considering that distinct differences ingeology and geomorphology do occur. However, ice surface re-constructions using this simplistic approach still show the criticaldependence of the resulting ice profiles to the basal drag applied(Fig. 8a).
A more realistic implementation of a variable basal shear stress(Fig. 8b), adapted to the encountered bedrock type, results in thereconstruction of generally thinner glaciers. According to theseresults, the Chagan Uzun glacier at its maximum extent still couldhave been either a valley glacier sourced from a cirque or nourishedfrom an icefield/cap/dome, depending if the shear stress in the hardrock domain was rather closer to 50 kPa or 200 kPa, respectively.Unfortunately, at this stage, no more precise paleo-shear stressescan be estimated.
Finally, based on the suite of ice surface profile reconstructionsperformed for each of the five identified frontal positions (Fig. 8c),none of the lateral ice-marginal landforms sampled on the inter-fluve can be connected to the Beltir moraines. The upper and lowermoraine fragments are most plausibly linked to the outer CUMC 1or 2, and to the CUMC 1, 2 or 3, respectively. The kame terrace, atsomewhat lower elevation, may instead most plausibly be linked tothe CUMC 3 or CUMC 4. However, given the acknowledged un-certainties of the basal shear stress regime, it is currently notpossible to establish with more precision which downvalley CUMCbest connects to the interfluve glacial landforms.
3.4. Cosmogenic surface exposure results and age landformdetermination
Boulders sampled for surface exposure dating were collectedfrom two moraine ridge fragments located on the top of theinterfluve (n ¼ 5), a lower kame terrace also located on the

Fig. 9. Summary figure of the geomorphological, sedimentological and chronological data collected in the Chagan Uzun Valley. (a) Geomorphological map of Chagan Uzun valleywith location of 10Be exposure ages. Rejected ages are in grey. (b) Simplified sketch of a profile starting from the interfluve and crossing through the entire Chagan Uzun glacialdeposits (white line on the map), with the indication of the main geomorphological and sedimentological features observed. The graph above indicates the global age attributed toeach glacial feature sampled (link highlighted by the grey bars), equal to the mean and the standard deviation of the corresponding original 10Be age data set (in red in a). All theinferred global ages are indistinguishable within their uncertainties and cluster around 19.2 ka. (For interpretation of the references to colour in this figure legend, the reader isreferred to the web version of this article.)
N. Gribenski et al. / Quaternary Science Reviews 149 (2016) 288e305 299
interfluve and overlooking the Chagan River (n ¼ 4), the Beltirmoraines (n ¼ 4), and the outermost ridge of the CUMC 1 (n ¼ 5)(Fig. 9; Table 2). All the samples were successfully analysed.
Three samples from the interfluvemoraine ridges produced 10Beexposure ages between 18.9 ka and 19.4 ka and two produced olderages at 24.1 ka and 31.4 ka (Fig. 9a, Table 2). Surface exposure agesfrom boulders located on the interfluve kame terrace range from17.6 ka to 19.5 ka, and from the Beltir moraine range from 18.3 ka to20.8 ka. Finally, exposure ages from the outermost moraine rangefrom 17.7 ka to 21.5 ka, except for one older at 34.9 ka (Fig. 9a,Table 2). Apart from the five boulders on the outermost moraine(CUMC 1), for which no 26Al analyses were carried out, only twosamples did not produce concordant 26Al and 10Be ages (AL13C-32
and 34; Table 2). These two samples, located on the interfluvemoraine fragments, yielded [26Al]/[10Be] ratios significantly belowthe production rate ratio (7.1 here, based on site-specific 26Al and10Be production rates), reflecting significant periods of burial(Fig. 10). These two samples also have the two oldest apparent 10Beexposure ages on the interfluve, even though burial should lead toyounger apparent exposure ages. These results indicate that theseboulders have experienced a complex exposure history includingprior exposure (inheritance) and burial periods. Those samples aretherefore considered unreliable for dating the interfluve morainefragments and are consequently rejected from further analysis anddiscussion. Another outlier, based on Peirce's criterion (Ross, 2003),is sample AL13C-37, located on the outermost moraine (34.9 ± 0.4
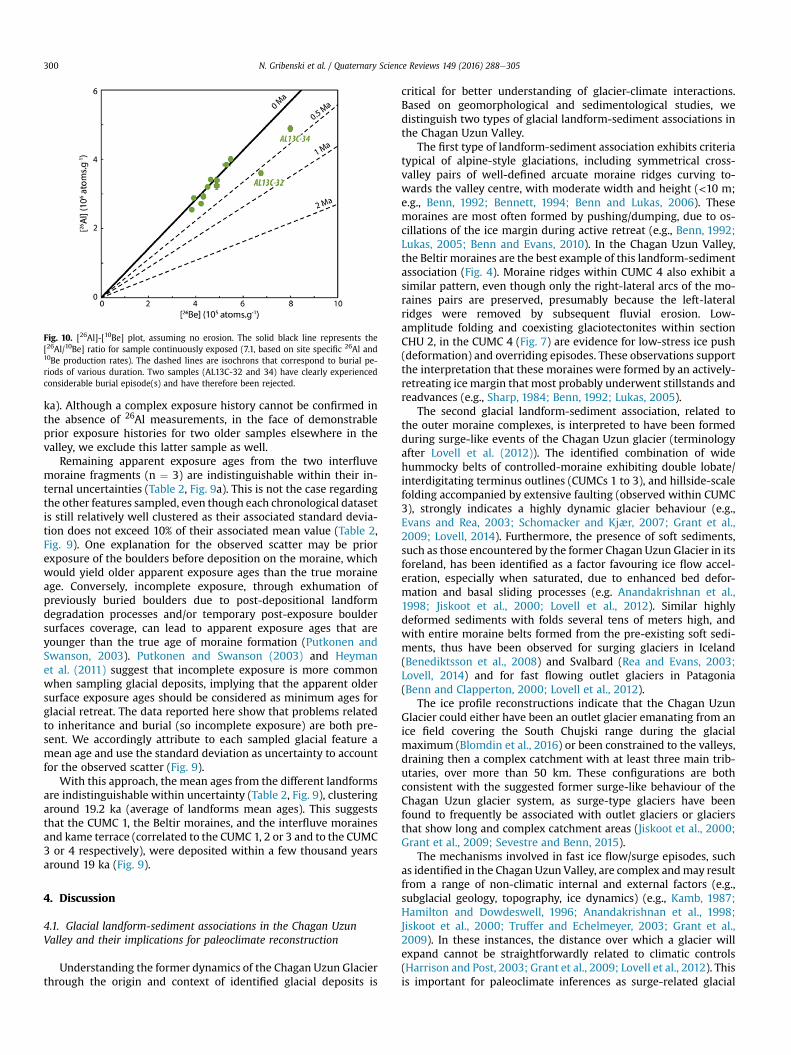
Fig. 10. [26Al]-[10Be] plot, assuming no erosion. The solid black line represents the[26Al/10Be] ratio for sample continuously exposed (7.1, based on site specific 26Al and10Be production rates). The dashed lines are isochrons that correspond to burial pe-riods of various duration. Two samples (AL13C-32 and 34) have clearly experiencedconsiderable burial episode(s) and have therefore been rejected.
N. Gribenski et al. / Quaternary Science Reviews 149 (2016) 288e305300
ka). Although a complex exposure history cannot be confirmed inthe absence of 26Al measurements, in the face of demonstrableprior exposure histories for two older samples elsewhere in thevalley, we exclude this latter sample as well.
Remaining apparent exposure ages from the two interfluvemoraine fragments (n ¼ 3) are indistinguishable within their in-ternal uncertainties (Table 2, Fig. 9a). This is not the case regardingthe other features sampled, even though each chronological datasetis still relatively well clustered as their associated standard devia-tion does not exceed 10% of their associated mean value (Table 2,Fig. 9). One explanation for the observed scatter may be priorexposure of the boulders before deposition on the moraine, whichwould yield older apparent exposure ages than the true moraineage. Conversely, incomplete exposure, through exhumation ofpreviously buried boulders due to post-depositional landformdegradation processes and/or temporary post-exposure bouldersurfaces coverage, can lead to apparent exposure ages that areyounger than the true age of moraine formation (Putkonen andSwanson, 2003). Putkonen and Swanson (2003) and Heymanet al. (2011) suggest that incomplete exposure is more commonwhen sampling glacial deposits, implying that the apparent oldersurface exposure ages should be considered as minimum ages forglacial retreat. The data reported here show that problems relatedto inheritance and burial (so incomplete exposure) are both pre-sent. We accordingly attribute to each sampled glacial feature amean age and use the standard deviation as uncertainty to accountfor the observed scatter (Fig. 9).
With this approach, the mean ages from the different landformsare indistinguishable within uncertainty (Table 2, Fig. 9), clusteringaround 19.2 ka (average of landforms mean ages). This suggeststhat the CUMC 1, the Beltir moraines, and the interfluve morainesand kame terrace (correlated to the CUMC 1, 2 or 3 and to the CUMC3 or 4 respectively), were deposited within a few thousand yearsaround 19 ka (Fig. 9).
4. Discussion
4.1. Glacial landform-sediment associations in the Chagan UzunValley and their implications for paleoclimate reconstruction
Understanding the former dynamics of the Chagan Uzun Glacierthrough the origin and context of identified glacial deposits is
critical for better understanding of glacier-climate interactions.Based on geomorphological and sedimentological studies, wedistinguish two types of glacial landform-sediment associations inthe Chagan Uzun Valley.
The first type of landform-sediment association exhibits criteriatypical of alpine-style glaciations, including symmetrical cross-valley pairs of well-defined arcuate moraine ridges curving to-wards the valley centre, with moderate width and height (<10 m;e.g., Benn, 1992; Bennett, 1994; Benn and Lukas, 2006). Thesemoraines are most often formed by pushing/dumping, due to os-cillations of the ice margin during active retreat (e.g., Benn, 1992;Lukas, 2005; Benn and Evans, 2010). In the Chagan Uzun Valley,the Beltir moraines are the best example of this landform-sedimentassociation (Fig. 4). Moraine ridges within CUMC 4 also exhibit asimilar pattern, even though only the right-lateral arcs of the mo-raines pairs are preserved, presumably because the left-lateralridges were removed by subsequent fluvial erosion. Low-amplitude folding and coexisting glaciotectonites within sectionCHU 2, in the CUMC 4 (Fig. 7) are evidence for low-stress ice push(deformation) and overriding episodes. These observations supportthe interpretation that these moraines were formed by an actively-retreating ice margin that most probably underwent stillstands andreadvances (e.g., Sharp, 1984; Benn, 1992; Lukas, 2005).
The second glacial landform-sediment association, related tothe outer moraine complexes, is interpreted to have been formedduring surge-like events of the Chagan Uzun glacier (terminologyafter Lovell et al. (2012)). The identified combination of widehummocky belts of controlled-moraine exhibiting double lobate/interdigitating terminus outlines (CUMCs 1 to 3), and hillside-scalefolding accompanied by extensive faulting (observed within CUMC3), strongly indicates a highly dynamic glacier behaviour (e.g.,Evans and Rea, 2003; Schomacker and Kjær, 2007; Grant et al.,2009; Lovell, 2014). Furthermore, the presence of soft sediments,such as those encountered by the former Chagan Uzun Glacier in itsforeland, has been identified as a factor favouring ice flow accel-eration, especially when saturated, due to enhanced bed defor-mation and basal sliding processes (e.g. Anandakrishnan et al.,1998; Jiskoot et al., 2000; Lovell et al., 2012). Similar highlydeformed sediments with folds several tens of meters high, andwith entire moraine belts formed from the pre-existing soft sedi-ments, thus have been observed for surging glaciers in Iceland(Benediktsson et al., 2008) and Svalbard (Rea and Evans, 2003;Lovell, 2014) and for fast flowing outlet glaciers in Patagonia(Benn and Clapperton, 2000; Lovell et al., 2012).
The ice profile reconstructions indicate that the Chagan UzunGlacier could either have been an outlet glacier emanating from anice field covering the South Chujski range during the glacialmaximum (Blomdin et al., 2016) or been constrained to the valleys,draining then a complex catchment with at least three main trib-utaries, over more than 50 km. These configurations are bothconsistent with the suggested former surge-like behaviour of theChagan Uzun glacier system, as surge-type glaciers have beenfound to frequently be associated with outlet glaciers or glaciersthat show long and complex catchment areas (Jiskoot et al., 2000;Grant et al., 2009; Sevestre and Benn, 2015).
The mechanisms involved in fast ice flow/surge episodes, suchas identified in the Chagan Uzun Valley, are complex andmay resultfrom a range of non-climatic internal and external factors (e.g.,subglacial geology, topography, ice dynamics) (e.g., Kamb, 1987;Hamilton and Dowdeswell, 1996; Anandakrishnan et al., 1998;Jiskoot et al., 2000; Truffer and Echelmeyer, 2003; Grant et al.,2009). In these instances, the distance over which a glacier willexpand cannot be straightforwardly related to climatic controls(Harrison and Post, 2003; Grant et al., 2009; Lovell et al., 2012). Thisis important for paleoclimate inferences as surge-related glacial

N. Gribenski et al. / Quaternary Science Reviews 149 (2016) 288e305 301
features therefore cannot be approached or quantified with tradi-tional Equilibrium Line Altitude (ELA) reconstructions (Benn andLehmkuhl, 2000) since this approach requires steady-state condi-tions with the glacier (ice mass and geometry) being in equilibriumwith climate (Benn and Lehmkuhl, 2000). However, there is still arequirement for climate conditions conducive to glacier growthuntil, at a critical level, surging commences (e.g., Clarke et al., 1986;Dowdeswell et al., 1991; Harrison et al., 2008; Striberger et al.,2011). Based on a global compilation of surge-type glaciers,Sevestre and Benn (2015) identified an optimal “surge” climateenvelope, the upper and lower limits of which are defined by linearrelations between mean summer temperature (MST, in �C) andmean winter precipitation (MWP, in mm.a�1). Thus surge-typeglaciers do not occur above MST ¼ 0.001*MWPþ8.4 and belowMST¼ 0.0014*MWP-0.97. Based on these boundaries, and given thelocal present-day MST (~12.5 �C) and MWP (~27 mm.a�1) (datafrom Kosh-Agash weather station, Fig. 1; www.ncdc.noaa.gov), ourstudy area is currently above the “surge” climate envelope, indi-cating that local past MST and MWP had to be respectively lowerand higher for allowing the occurrence of the “paleo-surge”.However, determining more precise past MST and MWP valuesbased on the Sevestre and Benn (2015) climate boundaries alone ischallenging. Indeed, extreme scenarios where only one climaticparameter varied, implying either a decrease of the current MSTby > 4 �C or an increase of the MWP by > 4000 mm.a�1, are un-realistic, especially for precipitation. Because of the wide range ofpossible MST-MWP combinations of intermediary values thatsatisfy the defined “surge” climate conditions, this prohibits, at thisstage, more precise past climate inferences.
4.2. The effect of glacial lakes on cosmogenic exposure chronology
The presence and dynamics of glacial lakes potentially compli-cates the interpretation of apparent exposure ages from the ChaganUzun Valley. We identify three different scenarios in which glaciallakes may impact on individual exposure ages: (a) Water mayshield the sample and therefore partially or fully interrupt(depending on the water column depth) the accumulation ofcosmogenic nuclides (Reuther, 2007; Dehnert and Schlüchter,2008; Stroeven et al., 2015); (b) Toppling or tilting of bouldersduring high-energy drainage events (Reuther et al., 2006); and (c)Boulders have an ice-rafted origin (dropstones). Each of thesescenarios would result in apparent surface exposure ages under-estimating the true depositional age of the glacial feature sampled.
These scenarios are only relevant for the boulders located onfeatures which have been covered by glacial lakes. This is not thecase for the interfluve units (fragmented ridges and kame terrace),as their elevations (>2200 m a.s.l.) are above the highest shorelinereported from the Chuja Basin (2100 m a.s.l.; Carling et al., 2002).The elevation of the sampled boulders from the Beltir moraine isaround 1980 m a.s.l., so below the highest shoreline found in ChujaBasin. However, the absence of shorelines or other lake-relatedlandforms or deposits (non-reworked) in the close surroundings,at equivalent or higher elevation than the Beltir moraines, indicatesthat such great glacial lake episodes predate the formation of thisunit. The three potential complications of glacial lakes on exposureages have to be considered for the boulders located on the distalCUMC 1 moraine (~1875e~1955 m a.s.l) as its coverage by a glaciallake is proven by the presence of higher shorelines (up to ~1970 ma.s.l.) on the directly upstream and stratigraphically-younger CUMC2.
4.2.1. Effect of periods of shielding by glacial lakesA rock surface beneath water will have lower 10Be production
rates than one exposed subaerially. For example, ~1.5 m of water
will reduce the production rate by a factor of two; and productiondrops to near zero for water depths �6 m (Reuther, 2007; Dehnertand Schlüchter, 2008). In our study, samples from boulders locatedon the outermost moraine (CUMC 1) produce ages ranging between17.7 and 21.5 ka (mean age attributed to the CUMC 1: 19.2 ± 1.8 ka).Based on the difference in elevation between these boulders andthe highest shorelines on the younger CUMC 2 moraine, the boul-ders were covered, at least once, by a water column of several tensof meters, clearly fully interrupting 10Be accumulation. Althoughthere is no doubt that the apparent CUMC 1 exposure ages un-derestimate the true deposition age of the unit, it is challenging todetermine by how much. This will directly depend on the durationfor (and depth to) which these boulders were covered by lakewaters.
Herget (2005) estimated the minimum time required for com-plete filling of the glacial lake in the Chuja and Kuray basins to themaximum reported level (2100 m a.s.l.) to be 130 years, assumingsteady climate conditions, a stationary ice dam and no loss throughevaporation. This estimated time would increase considerably iflosses by ice-dam leakage and evaporationwere taken into account(Herget, 2005). The Kuray-Chuja glacial lake needs to have beensustained at >1960 m a.s.l. for several thousand years to have asignificant impact on the cosmogenic ages, and its persistence willhave entirely relied on the stability of the ice dam as no alternativespillways existed. Because ice dam stability is not only controlled byglacier oscillations, but also by a mechanical threshold above whichthe water accumulated cannot be supported, glacial lakes aregenerally short-lived features (Evans and Clague, 1994; Walder andCosta, 1996; Tweed and Russell, 1999). For example, the ice damformed by the non-retreating Perito Moreno blocking one of LagoArgentino's lateral channels in Patagonia, has collapsed (andreformed) 17 times since the beginning of the 20th century inresponse to rising water level (Depetris and Pasquini, 2000;Pasquini and Depetris, 2011). Similarly, Glacial Lake Missoula,blocked by a lobe of the Cordilleran Ice sheet, drained more than 20times over the course of a few thousand years (Hanson et al., 2012;Benito and O'Connor, 2016). Relatively short-lived glacial lakes aretherefore also expected to have filled the Chuja and Kuray basinsdue to mechanical failure associated with rising lake levels (Tweedand Russell, 1999; Herget, 2005; Carling et al., 2010). In addition, itis likely that no large lakes developed after ~19 ka, based on themost recent large glacial lake drainage dated at ~18.7 ka by Reutheret al. (2006). Pollen diagrams from lake cores collected on thenearby Ulagan Plateau (Fig.1) also indicate the onset of deglaciationin the area to have occurred before 16 ka (Blyakharchuk et al.,2004). No high-resolution pre-20 ka paleoclimate proxy recordsexist close to the study area. Ice core analysis from the Guliya icecap, on the Qinghai-Tibetan Plateau (Thompson et al., 1997), how-ever, indicates abrupt and oscillatory changes in temperature andpressure system over the last glacial cycle, and especially during thelast glacial stage (from 15 to 33 ka). Loess sequence analysis fromKurtak, in Middle Siberia (Zander et al., 2003) indicates soil formingperiod interrupted by cyclic cold and dry climate conditions be-tween 50 and 20 ka. Variations in climate indicated by both recordsindicate that our study area, positioned in-between these twodistanced locations, was also subjected to climate oscillations.These variations were likely reflected in mass balance changes forthe coalescing valley glaciers damming the Chuja River (Baker et al.,1993; Herget, 2005), as valley glaciers in this region are very sen-sitive to climate changes (Rupper and Roe, 2008), arguing againstglacial dams maintained over long continuous periods. Further-more, neither the terminal setting (narrow gorges), nor glaciallandforms or glacier geometries (length and catchment) indicate a-priori that surging behaviour could also apply to the glaciersdamming the Chuja river.

N. Gribenski et al. / Quaternary Science Reviews 149 (2016) 288e305302
The apparent exposure ages underestimate the deposition timeof the CUMC 1 (mean apparent age 19.2 ± 1.8 ka). However, thisoffset is not expected to exceed more than a few thousand years.Indeed, if the CUMC 1 was for example deposited ~30 ka, the globalapparent age would require glacial lake submergence for a totalperiod of 10 ka, which is unrealistic considering the variability ofclimate change over this period and mechanical factors controllingthe stability of the ice dam.
4.2.2. Effects of boulder toppling during drainage events andpotential dropstone origin
Reuther et al. (2006) suggested that the potential toppling ofboulders during a drainage event could yield dates reflecting thedrainage event itself and not the age of moraine deposition. Theboulders sampled along the CUMC 1 are situated outside areasaffected by strong turbulent conditions during the lake drainage,based on numerical simulation of the catastrophic drainage of theKuray-Chuja glacial lake (Bohorquez et al., 2015) and the distribu-tion of diluvial bedforms (Carling et al., 2002; Herget, 2005). Thegeneral morphology of the CUMC 1 is fairly well preserved, alsosupporting limited erosion from drainage events (Reuther, 2007).We therefore suggest that processes such as toppling and tilting ofboulders have not affected the exposure history of the samplesanalysed in this study.
Similarly, an ice-rafted origin for the dated boulders on CUMC 1is regarded as unlikely because all boulders, except for one sample(AL13C-38, 17.9 ± 1.4 ka), were well-embedded in the parentmoraine ridge. Although AL13C-38 may be a dropstone, its agewould not affect significantly themean age determined for CUMC 1.
5. Paleoglacial history of the Chagan Uzun Valley, andpaleoclimate and paleolake history
The Chagan Uzun Valley gathers a spectrum of glacial landformsreflecting a transition between two main glacial systems with verydifferent dynamic and climatic implications. Distal moraine com-plexes were formed during surge-like events of outlet glaciers, orcoalescing valley glaciers sustained by cold/wet conditions, while theinner glacial deposits are associatedwith retreat phases of temperatealpine glaciers at balancevelocity (Jiskoot, 2011). Exposure ages of theoutermost CUMC 1, the inner-most Beltir moraines, and glaciallandforms locatedontheupvalley interfluve, correlated to theCUMCs1, 2 or 3 and to CUMCs 3 or 4, indicate deposition times clusteredaround 19.2 ka, indistinguishable within their errors (Fig. 9). How-ever, the actual deposition time of the outermost CUMC 1 is likelyslightly underestimated due to subsequent lake water coverage. Thechronological record thus indicates that the Chagan Uzun Valleyexperienced last glacialmaximumcondition during theMIS2 (14e29ka, Lisiecki andRaymo,2005) anda transition fromglacial todeglacialconditions in a period of a few thousand years around 19 ka. Thischronologyagreeswith IRSLages fromsilt coveringamoraine ridgeofthe CUMC 3 indicating a minimummoraine age of 22.9 ± 2.9 ka, andfrom sand and silt layers within till sediments related to last glacialmaximumicemargins in theKuray-Chujabasin area, ranging from28to 19 ka (Lehmkuhl et al., 2007, 2011).
The reconstructed glacial chronology for the Chagan Uzun Valleyis also consistent with other regional and local proxies. Cold and dryconditions before 19.5 ka are indicated by major loess accumulationin Central Siberia dated to 22± 4 ka (Zander et al., 2003), and loess ontop of fluvial terraces in the Katun River, downstream the Chuja andKuraybasins, dated to21.3±2.3 ka (Lehmkuhlet al., 2007), bothusingIRSL techniques. The switch fromcold glacialmaximumconditions towarmer interglacial conditions in this regions is best documented inthe Guliya ice core, from the Qinghai-Tibetan Plateau (Thompsonet al., 1997), for which the timing of the last d18O minima
(associated to the coldest temperatures on record) has been esti-mated to 18 ± 1 ka, followed by an important rise in the d18O values.Within errors, the change in O isotopes matches the switch fromglacial to deglacial conditions observed in the Chagan Uzun Valley.Finally, Reuther et al. (2006) identified and dated an outburst eventsuggested to be associated to the drainage of the last late Pleistoceneglacial lake developed in the Kuray and Chuja basins (Reuther et al.,2006). The final lake drainage was most probably linked to a gen-eral warming of the climate as no other lakes developed subse-quently. This event also should have post-dated the deposition of theCUMC1 and 2, but pre-dated the formation of the inner ChaganUzundeposits, based on the glacial lake shorelines only imprinted in theouter deposits. This supports the association of the drainage eventwith an onset of deglaciation. The recalculated cosmogenic ages,using the same production rate and scaling model as used in thisstudy, indicate a glacial lake drainage at 18.7± 1.2 ka, consistent withthe timing of deglaciation observed in the Chagan Uzun Valley.
6. Conclusion
The Chagan Uzun Valley exhibits the most impressive assem-blage of glacial landforms and sediments in the Kuray and Chujabasins. Geomorphological and sedimentological evidence showthat two different styles of glacial dynamics prevailed in this valley:
- Surge-like behaviour of glaciers formed the distal lobe-shapedeposits.
- Temperate alpine glaciers at balance velocity formed the innermoraine sets during recessional phases.
The succession of moraine complexes associated with surge-likedynamic in the distal area of the Chagan Uzun Valley, and withglaciers in steady-state in the inner part, reflects a transition be-tween glacial conditions and the retreating phase. However,because of the unsteady nature of glaciers experiencing surge-likeevents, the pronounced maximum extent of the former ChaganUzun Glacier in the Chuja Basin cannot be strictly attributed toclimatic control.
Cosmogenic dating of the outermost and innermost morainecomplexes, and of lateral glacial landforms deposited on an inter-fluve and associated to intermediary phases, all indicate agesclustered around 19.2 ka. An underestimation of the age of theoutermost extent of up to a few thousand years is possible due tosubsequent lakewater coverage. This chronology supports aMarineIsotope Stage (MIS) 2 last maximum extent of the Chagan UzunGlacier, and an onset of deglaciation around 19 ka. This is inagreement with other local and regional paleoenvironmentalregional proxies.
Acknowledgements
This work was supported by Swedish Research Council grants toKrister N. Jansson and Arjen P. Stroeven (No. 2009e4411 and2011e4892, respectively). Additional support for fieldwork andsample processing was provided by the Swedish Society for An-thropology and Geography (SSAG) and from the Margit Alhtin andCarl Mannerfelt stipends to R. Blomdin and N. Gribenski. M.W. Caffeeand N.A. Lifton acknowledge support from the U.S. National ScienceFoundation grant EAR-1153689. SPOT-6 images were providedthrough the Geoportal of Lomonosov Moscow State University.
References
Agatova, A.R., Nepop, R.K., Slyusarenko, I.Y., Myglan, V.S., Nazarov, A.N.,Barinov, V.V., 2014. Glacier dynamics, palaeohydrological changes and

N. Gribenski et al. / Quaternary Science Reviews 149 (2016) 288e305 303
seismicity in southeastern Altai (Russia) and their influence on human occu-pation during the last 3000 years. Quat. Int. 324, 6e19.
Aizen, V.B., Aizen, E.M., Joswiak, D.R., Jujita, K., Tekeuchi, N., Nikitin, S.A., 2006.Climatic and atmospheric circulation pattern variability from ice-core isotope/geochemistry records (Altai, Tien Shan and Tibet). Ann. Glaciol. 43, 49e60.
Alexanderson, H., Murray, A.S., 2012. Luminescence signals from modern sedimentsin a glaciated bay, NW Svalbard. Quat. Geochronol. 10, 250e256.
Alley, R.B., Blankenship, D.D., Bentley, C.R., Rooney, S.T., 1987. Till beneath ice streamB 3. Till deformation: evidence and implications. J. Geophys. Res. 92,8921e8929.
Anandakrishnan, S., Blankenship, D.D., Alley, R.B., Stoffa, P.L., 1998. Influence ofsubglacial geology on the position of a West Antarctic ice stream from seismicobservations. Nature 394, 62e65.
Baker, V.R., Benito, G., Rudoy, A.N., 1993. Paleohydrology of late Pleistocene super-flooding, Altay Mountains, Siberia. Science 259, 348e350.
Balco, G., 2011. Contributions and unrealized potential contributions of cosmogenic-nuclide exposure dating to glacier chronology, 1990-2010. Quat. Sci. Rev. 30,3e27.
Banham, P.H., 1977. Glacitectonites in till stratigraphy. Boreas 6, 101e105.Barr, I.D., Lovell, H., 2014. A review of topographic controls on moraine distribution.
Geomorphology 226, 44e64.Benediktsson, I.€O., M€oller, P., Ing�olfsson, �O., van der Meer, J.J.M., Kjær, K.H., Krüger, J.,
2008. Instantaneous end moraine and sediment wedge formation during the1890 glacier surge of Brúarj€okull. Icel. Quat. Sci. Rev. 27, 209e234.
Benito, G., O'Connor, J.E., 2016. Number and size of last-glacial Missoula floods inthe Columbia river valley between the Pasco Basin, Washington, and Portland,Oregon. Geol. Soc. Am. Bull. 115, 624e638.
Benn, D.I., 1992. The genesis and significance of 'hummocky moraine': evidencefrom the Isle of Skye, Scotland. Quat. Sci. Rev. 11, 781e799.
Benn, D.I., 1996. Subglacial and subaqueous processes near a glacier grounding line:sedimentological evidence from a former ice-dammed lake, Achnasheen,Scotland. Boreas 25, 23e36.
Benn, D.I., Evans, D.J.A., 1993. Glaciomarine deltaic deposition and ice-marginaltectonics: the 'loch Don Sand Moraine', Isle of Mull, Scotland. J. Quat. Sci. 8,279e291.
Benn, D.I., Evans, D.J.A., 1996. The interpretation and classification of subglacially-deformed materials. Quat. Sci. Rev. 15, 23e52.
Benn, D.I., Evans, D.J.A., 1998. Glaciers and Glaciation. Arnold, London.Benn, D.I., Clapperton, C.M., 2000. Pleistocene glacitectonic landforms and sedi-
ments around central Magellan Strait, southernmost Chile: evidence for fastoutlet glaciers with cold-based margins. Quat. Sci. Rev. 19, 591e612.
Benn, D.I., Lehmkuhl, F., 2000. Mass balance and equilibrium line altitudes of gla-ciers in high mountain environments. Quat. Int. 65/66, 15e29.
Benn, D.I., Kirkbride, M.P., Owen, L.A., Brazier, V., 2003. Glaciated valley land-systems. In: Evans, D.J.A. (Ed.), Glacial Landsystems. Arnold, London,pp. 372e406.
Benn, D.I., Lukas, S., 2006. Younger Dryas glacial landsystems in North West Scot-land: an assessment of modern analogues and palaeoclimatic implications.Quat. Sci. Rev. 25, 2390e2408.
Benn, D.I., Evans, D.J.A., 2010. Glaciers and Glaciation, second ed. Arnold, London.802 pp.
Benn, D.I., Hulton, N.R.J., 2010. An Excel TM spread sheet program for reconstructingthe surface profile of former mountain glaciers and ice caps. Comput. Geosci.36, 605e610.
Bennett, M.R., 1994. Morphological evidence as a guide to deglaciation followingthe Loch Lomond Readvance: a review of research approaches and models.Scott. Geogr. Mag. 110, 24e32.
Bennett, M.R., Huddart, D., McCormick, T., 2000. The glaciolacustrine landform-sediment assemblage at Heinabergsj€okull, Iceland. Geogr. Ann. 82A, 1e16.
Blomdin, R., Murray, A., Thomsen, K.J., Buylaert, J.P., Sohbati, R., Jansson, K.N.,Alexanderson, H., 2012. Timing of the deglaciation in southern Patagonia:testing the applicability of K-Feldspar IRSL. Quat. Geochronol. 10, 264e272.
Blomdin, R., Heyman, J., Stroeven, A.P., H€attestrand, C., Harbor, J.M., Gribenski, N.,Jansson, K.N., Petrakov, D.A., Ivanov, M.N., Alexander, O., Rudoy, A.N.,Walther, M., 2016. Glacial geomorphology of the Altai and Western SayanMountains, Central Asia. J. Maps 12 (1), 123e136.
Blyakharchuk, T., Wright, H.E., Borodavko, P.S., Van Der Knaap, W.O., Ammann, B.,2004. Late glacial and Holocene vegetational changes on the ulagan high-mountain plateau, Altai mountains, southern Siberia. Palaeogeogr. Palae-oclimatol. Palaeoecol. 209, 259e279.
Bohorquez, P., Carling, P.A., Herget, J., 2015. Dynamic simulation of catastrophic latePleistocene glacial-lake drainage, Altai Mountains, central Asia. Int. Geol. Rev.http://dx.doi.org/10.1080/00206814.2015.1046956.
Borchers, B., Marrero, S.M., Balco, G., Caffee, M., Goehring, B., Lifton, N.,Nishiizumi, K., Phillips, F.M., Schaefer, J., Stone, J.O., 2016. Geological calibrationof spallation production rates in the CRONUS-Earth project. Quat. Geochronol.31, 188e198.
Boulton, G.S., Eyles, N., 1979. Sedimentation by valley glaciers: a model and geneticclassification. In: Schluter, C. (Ed.), Moraines and Varves. Balkema, Rotterdam,pp. 11e23.
Bussemer, S., 2001. Jungquart€are Vergletscherung im Bergaltai und in angrenzen-den Gebirgen- Analyse des Forschungsstandes. Mittl. Geogr. Ges. München 85,45e64.
Butvilovsky, V.V., 1993. Last Glaciation and Holocene Palaeogeography of the Altai:Cataclysmic Model: Tomsk. Tomsk State University, 252 pp. (in Russian).
Carling, P.A., 1996. Morphology, sedimentology and palaeohydraulic significance oflarge gravel dunes, Altai Mountains, Siberia. Sedimentology 43, 647e664.
Carling, P.A., Kirkbride, A.D., Parnachov, S., Borodavko, P.S., Berger, G.W., 2002. LateQuaternary catastrophic flooding in the Altai Mountains of south-centralSiberia: a synoptic overview and an introduction to flood deposit sedimen-tology. In: Martini, I.P., Baker, V.R., Garz�on, G. (Eds.), Flood and MegafloodProcesses and Deposits: Recent and Ancient Examples, 32. International Asso-ciation of Sedimentologists, Special Publication, pp. 325e336.
Carling, P.A., Villanueva, I., Herget, J., Wright, N., Borodavko, P., Morvan, H., 2010.Unsteady 1D and 2D hydraulic models with ice dam break for Quaternarymegaflood, Altai Mountains, southern Siberia. Glob. Planet. Change 70, 24e34.
Carling, P.A., Knaapen, M., Borodvako, P., 2011. Palaeoshorelines of Glacial LakeKuray-Chuja, South-central Siberia: Form, Sediments and Process, 354.Geological Society, London, pp. 111e128. Special Publications.
Cerling, T.E., Craig, H., 1994. Geomorphology and in-situ cosmogenic isotopes. Annu.Rev. Earth Planet. Sci. 22, 273e317.
Chernomorskiy, M.A., Musienko, Z.V., Rakovets, O.A., Trifonov, N.P., 1958. USSRGeological Map, 1:200 000, Gorny Altai Series, M-45-XXIII, XXIX. Ministry ofGeology and Preservation of Natural Resources.
Clarke, G.K.C., Schmok, J.P., Ommanney, C.S.L., Collins, S.G., 1986. Characteristics ofsurge-type glaciers. J. Geophys. Res. 91 (B7), 7165e7180.
Cockburn, H., Summerfield, M.A., 2004. Geomorphological applications of cosmo-genic isotope analysis. Prog. Phys. Geogr. 28, 1e42.
Collinson, J.D., Mountney, N.P., Thompson, D.B., 2006. Sedimentary Structures, thirded. Terra Publishing, Harpenden. 292 pp.
Cuffey, K.M., Paterson, W.S.B., 2010. The Physics of Glaciers, fourth ed. Butterworth-Heinemann, Oxford, UK. 693 pp.
Dehnert, A., Schlüchter, C., 2008. Sediment burial dating using terrestrial cosmo-genic nuclides. Eiszeitalter und Gegenwart. Quat. Sci. J. 57, 210e225.
Delvaux, D., Theunissen, K., Van der Meer, R., Berzin, N., 1995. Dynamics andpaleostress of the Cenozoic Kurai-Chuya depression of Gorny Altai (SouthSiberia): tectonic and climatic control. Russ. Geol. Geophys. 36, 26e45.
Depetris, P.J., Pasquini, A.I., 2000. The hydrological signal of the Moreno glacierdamming of lake Argentino (Southern Andean Patagonia): the ENSO connec-tion. Glob. Planet. Change 26, 367e374.
Dmitrieva, V.K., Volochkovich, K.L., Savosina, A.K., Shmidt, G.A., 1959. USSRGeological Map, 1:200 000, Gorny Altai Series, M-45-XXII, XXVIII. Ministry ofGeology and Preservation of Natural Resources.
Dowdeswell, J.A., Hamilton, G.S., Hagen, J.O., 1991. The duration of the active phaseon surge-type glaciers: contrasts between Svalbard and other regions. J. Glaciol.37, 388e400.
Duller, G.A.T., 2006. Single grain optical dating of glacigenic deposits. Quat. Geo-chronol. 1, 296e304.
Evans, D.J.A., 2009. Controlled moraines: origins, characteristics and palae-oglaciological implications. Quat. Sci. Rev. 28, 183e208.
Evans, S.G., Clague, J.J., 1994. Recent climatic change and catastrophic geomorphicprocesses in mountain environments. Geomorphology 10, 107e128.
Evans, D.J.A., Rea, B.R., 2003. Surging glacier landsystem. In: Evans, D.J.A. (Ed.),Glacial Landsystems. Arnold, London, pp. 259e288.
Evans, D.J.A., Benn, D.I., 2004. A Practical Guide to the Study of Glacial Sediments.Arnold, London, p. 266.
Evans, D.J.A., Phillips, E.R., Hiemstra, J.F., Auton, C.A., 2006. Subglacial till: formation,sedimentary characteristics and classification. Earth Sci. Rev. 78, 115e176.
Fabel, D., Harbor, J., 1999. The use of in-situ produced cosmogenic radionuclides inglaciology and glacial geomorphology. Ann. Glaciol. 28, 103e110.
Forman, S.L., 1988. The solar resetting of thermoluminescence of sediments in aglacier-dominated fiord environment in Spitsbergen: geochronology implica-tions. Arct. Alp. Res. 20, 243e253.
Fyfe, G., 1990. The effect of water depth on ice-proximal glaciolacustrine sedi-mentation: Salpausselk€a I, southern Finland. Boreas 19, 147e164.
Gemmell, A.M.D., 1988. Thermoluminescence dating of glacially transported sedi-ments: some considerations. Quat. Sci. Rev. 7, 277e285.
Glasser, N.F., 2002. The large Roches moutonn�ees of upper Deeside. Scott. Geogr. J.118 (2), 129e138.
Glasser, N.F., Jansson, K.N., 2005. Fast-flowing outlet glaciers of the last glacialmaximum Patagonian icefield. Quat. Res. 63, 206e211.
Glasser, N.F., Jansson, K.N., Harrison, S., Rivera, A., 2005. Geomorphological evidencefor variations of the North Patagonian icefield during the Holocene. Geo-morphology 71, 263e277.
Golledge, N.R., 2003. A former ice-dammed lake in Glen Luibeg, CairngormMountains, Scotland. Quat. Newsl. 101, 13e24.
Gosse, J.C., Phillips, F.M., 2001. Terrestrial in situ cosmogenic nuclides: theory andapplication. Quat. Sci. Rev. 20, 1475e1560.
Grant, K.L., Stokes, C.R., Evans, I.S., 2009. Identification and characteristics of surge-type glaciers on Novaya Zemlya, Russian Arctic. J. Glaciol. 55, 960e972.
Hambrey, M., 1994. Glacial Environments. UCL Press, London, 304 pp.Hamilton, G.S., Dowdeswell, J.A., 1996. Controls on glacier surging in Svalbard.
J. Glaciol. 42, 157e168.Hanson, M.A., Lian, O.B., Clague, J.J., 2012. The sequence and timing of large late
Pleistocene floods from glacial Lake Missoula. Quat. Sci. Rev. 31, 67e81.Harrison, W.D., Post, A.S., 2003. How much do we really know about glacier surg-
ing? Ann. Glaciol. 36, 1e6.Harrison, W.D., Eisen, O., Fahnestock, M.A., Moran, M.T., Motyka, R.J., Nolan, M.,
Raymond, C.F., 2008. Another surge of variegated glacier, Alaska, USA, 2004/04.J. Glaciol. 54 (184), 192e194.

N. Gribenski et al. / Quaternary Science Reviews 149 (2016) 288e305304
Herget, J., 2005. Reconstruction of ice-dammed lake outburst floods in the Altaimountains, Siberia. In: Geological Society of America, Special Paper 386.Geological Society of America, Boulder, Colorado, 118 pp.
Heyman, J., Stroeven, A.P., Harbor, J.M., Caffee, M.W., 2011. Too young or too old:evaluating cosmogenic exposure dating based on an analysis of compiledboulder exposure ages. Earth Planet. Sci. Lett. 302, 71e80.
Heyman, J., Applegate, P.J., Blomdin, R., Gribenski, N., Harbor, J.M., Stroeven, A.P.,accepted. Boulder height-exposure age relationships from a global glacial 10Becompilation. Quat. Geochronol..
Holcombe, R., 2010. GeOrient v9.x. http://www.holcombe.net.au/software/rodh_software_georient.htm. Last accessed 15.09.2015.
Humphrey, N., Kamb, B., Fahnestock, M., Engelhardt, H., 1993. Characteristics of thebed of the lower Columbia Glacier, Alaska. J. Geophys. Res. 98, 837e846.
Jiskoot, H., 2011. Dynamics of glaciers. In: Singh, V.P., Singh, P., Haritashya, U.K.(Eds.), Encyclopedia of Snow, Ice and Glaciers. Springer, Dordrecht, TheNetherlands, pp. 245e256.
Jiskoot, H., Murray, T., Boyle, P., 2000. Controls on the distribution of surge-typeglaciers in Svalbard. J. Glaciol. 46, 412e422.
Jomelli, V., Favier, V., Rabatel, A., Brunstein, D., Hoffmann, G., Francou, B., 2009.Fluctuations of glaciers in the tropical Andes over the last millennium andpalaeoclimatic implications: a review. Palaeogeogr. Palaeoclimatol. Palaeoecol.281, 269e282.
Kamb, B., 1987. Glacier surge mechanism based on linked cavity configuration of thebasal water conduit system. J. Geophys. Res. 92, 9083e9100.
Kirkbride, M.P., Brazier, V., 1998. A critical evaluation of the use of glacier chro-nologies in climatic reconstruction, with reference to New Zealand. Quat. Res.Assoc. 6, 55e64.
Kirkbride, M.P., Winkler, S., 2012. Correlation of Late Quaternary moraines: impactof climate variability, glacier response, and chronological resolution. Quat. Sci.Rev. 46, 1e29.
Kohl, C., Nishiizumi, K., 1992. Chemical isolation of quartz for measurement ofin-situ produced cosmogenic nuclides. Geochim. Cosmochim. Acta 56,3583e3587.
Koppes, M., Gillespie, A.R., Burke, R.M., Thompson, S.C., Stone, J., 2008. Late qua-ternary glaciation in the Kyrgyz Tien Shan. Quat. Sci. Rev. 27, 846e866.
Lal, D., 1991. Cosmic ray labeling of erosion surfaces: in situ nuclide production ratesand erosion rates. Earthand Planet. Sci. Lett. 104, 424e439.
Lehmkuhl, F., Frechen, M., Zander, A., 2007. Luminescence chronology of fluvial andaeolian deposits in the Russian Altai (southern Siberia). Quat. Geochronol. 2,195e201.
Lehmkuhl, F., Klinge, M., Stauch, G., 2011. The extent and timing of Late Pleistoceneglaciations in the Altai and neighbouring mountain systems. In: Ehlers, J.,Gibbard, P.L., Hughes, P.D. (Eds.), Developments in Quaternary Science - Extentand Chronology - a Closer Look, 15, pp. 967e979.
Lifton, N., Sato, T., Dunai, T.J., 2014. Scaling in situ cosmogenic nuclide productionrates using analytical approximations to atmospheric cosmic-ray fluxes. EarthPlanet. Sci. Lett. 386, 149e160.
Lisiecki, L.E., Raymo, M.E., 2005. A Pliocene-Pleistocene stack of 57 globallydistributed benthic 18O records. Paleoceanography 20, 1e17.
Lønne, I., 1995. Sedimentary facies and depositional architecture of ice-contactglaciomarine systems. Sediment. Geol. 98, 13e43.
Lovell, H., 2014. On the Ice-sediment-landform Associations of Surging Glaciers onSvalbard. Unpublished PhD thesis. Queen Mary University of London, School ofGeography, 295 pp.
Lovell, H., Stokes, C.R., Bentley, M.J., Benn, D.I., 2012. Evidence for rapid ice flow andproglacial lake evolution around the central Strait of Magellan region, south-ernmost Patagonia. J. Quat. Sci. 27 (6), 625e638.
Lukas, S., 2005. A test of the englacial thrusting hypothesis of 'hummocky' moraineformation - case studies from the north-west Highlands, Scotland. Boreas 34,287e307.
Lukas, S., 2012. Processes of annual moraine formation at a temperate alpine valleyglacier: insights into glacier dynamics and climatic controls. Boreas 41,463e480.
Lukas, S., Merritt, J.W., 2004. Evidence for a former ice-dammed lake in Coire Mhic-sith. In: Lukas, S., Merritt, J.W., Mitchell, W.A. (Eds.), The Quaternary of theCentral Grampian Highlands: Field Guide. Quaternary Research Association,London, pp. 149e158.
Lukas, S., Spencer, J.Q.G., Robinson, R.A.J., Benn, D.I., 2007. Problems associated withluminescence dating of Late Quaternary glacial sediments in the NW ScottishHighlands. Quat. Geochronol. 2, 243e248.
Lukas, S., Graf, A., Coray, S., Schlüchter, C., 2012. Genesis, stability and preservationpotential of large lateral moraines of Alpine valley glaciers - towards a unifyingtheory based on Findelengletscher, Switzerland. Quat. Sci. Rev. 38, 27e48.
Margold, M., Jansson, K.N., Stroeven, A.P., Jansen, J.D., 2011. Glacial Lake vitim, a3000-km3 outburst flood from Siberia to the arctic ocean. Quat. Res. 76,393e396.
Markov, K.K. (Ed.), 1978. Section the Latest Deposits of the Altai. Izdatel’stvo Mos-cowskogo Universiteta, Moscow, 208 pp. (in Russian).
Marren, P.M., 2005. Magnitude and frequency in proglacial rivers: a geomorpho-logical and sedimentological perspective. Earth Sci. Rev. 70, 203e251.
Marrero, S.M., Phillips, F.M., Borchers, B., Lifton, N., Aumer, R., Balco, G., 2016.Cosmogenic nuclide systematics and the CRONUScalc program. Quat. Geo-chronol. 31, 160e187.
Marshall, S.J., White, E.C., Denuth, M.N., Bolch, T., Wheate, R., Menounos, B.,Beedle, M.J., Shea, J.M., 2011. Glacier water resources on the eastern slopes of
the Canadian Rocky Mountains. Can. Water Resour. J./Revue Can. des ressourceshydriques 36, 109e134.
Nishiizumi, K., 2004. Preparation of 26Al AMS standards. Nucl. Instrum. MethodsPhys. Res. B 223, 388e392.
Nishiizumi, K., Kohl, C.P., Arnold, J.R., 1993. Role of in-situ cosmogenic nuclides 10Beand 26Al in the study of diverse geomorphic processes. Earth Surf. Process.Landforms 18, 407e425.
Nishiizumi, K., Imamura, M., Caffee, M.W., Southon, J.R., Finkel, R.C., McAninch, J.,2007. Absolute calibration of 10Be AMS standards. Nucl. Instrum. Methods Phys.Res. B 258, 403e413.
Novikov, I.S., 1988. Geology-geomorphological Research in the Mountain Altai.Bibliography for 1836-1986. Novosibirsk. Institution of Geology and Geophysics,68 pp. (in Russian).
Obruchev, V.A., 1914. Altai essays (Essay first). Notes on tracks of ancient glaciationin the Russian Altai. Geography 4, 50e93 (In Russian).
Ochs, M., Ivy-Ochs, S., 1997. The chemical behavior of Be, Al, Fe, Ca and Mg duringAMS target preparation from terrestrial silicates modeled with chemicalspeciation calculations. Nucl. Instrum. Methods Phys. Res. B 123, 235e240.
Okishev, P.A., 1982. Dynamic of Glaciations in Altai during Late-pleistocene andHolocene. Tomsk, Iadatel’stvo Tomskogo Universiteta, 209 pp. (in Russian).
Ottesen, D., Dowdeswell, J.A., 2006. Assemblages of submarine landforms producedby tidewater glaciers in Svalbard. J. Geophys. Res. 111, 1e16.
Pasquini, A.I., Depetris, P.J., 2011. Southern Patagonia's Perito Moreno glacier, lakeArgentino, and Santa Cruz river hydrological system: an overview. J. Hydrol.405, 48e56.
Phillips, E.R., Merritt, J.W., Auton, C.A., Golledge, N.R., 2007. Microstructures insubglacial and proglacial sediments: understanding fault, folds and fabric andthe influence of water on the style of deformation. Quat. Sci. Rev. 26,1499e1528.
Phillips, F.M., Argento, D.C., Balco, G., Caffee, M.W., Clem, J., Dunai, T., Finkel, R.,Goehring, B., Gosse, J.C., Hudson, A., Jull, T.A., Kelly, M., Kurz, M., Lal, D.,Lifton, N., Marrero, S.M., Nishiizumi, K., Reedy, R., Schaefer, J., Stone, J.O.,Swanson, T., Zreda, M.G., 2016. The cronus-earth project: a synthesis. Quat.Geochronol. 31, 119e154.
Popov, V.E., 1962. On closed systems of marginal glacier formations in valleys ofSouth-Western corner of Chyia steppe in the Mountain Altai. Glaciology of Altai.Tomsk 1, 188e221 (in Russian).
Popov, V.E., 1972. The possibility of using geomorphological criteria to determinethe age of the Quaternary deposits in Chagan-Uzun reference outcrop Altai.Altai Glaciology 7. Tomsk 104e114 (in Russian).
Powell, R.D., 2003. Subaquatic landsystems:fjords. In: Evans, D.J.A. (Ed.), GlacialLandsystmes. Arnold, London, pp. 313e347.
Putkonen, J., Swanson, T., 2003. Accuracy of cosmogenic ages for moraines. Quat.Res. 59, 255e261.
Rea, B.R., Evans, D.J.A., 2003. Plateau icefield landsystems. In: Evans, D.J.A. (Ed.),Glacial Landsystems. Arnold, pp. 407e431.
Reading, H.G. (Ed.), 1996. Sedimentary Environments: Processes, Facies and Stra-tigraphy, third ed. Blackwell, Oxford.
Reuther, A.U., 2007 (PhD thesis). Surface Exposure Dating of Glacial Deposits Formthe Last Glacial Cycle. Evidence from the Eastern Alps, the Bavarian Forest, theSouthern Carpathians and the Altai Mountains, 21. Relief Boden Pal€aoklima,p. 246.
Reuther, A.U., Herget, J., Ivy-Ochs, S., Borodavko, P., Kubik, P.W., Heine, K., 2006.Constraining the timing of the most recent cataclysmic flood event from ice-dammed lakes in the Russian Altai Mountains, Siberia, using cosmogenic insitu 10Be. Geology 34, 913e916.
Rogozhin, E.A., Ovsyuchenko, A.N., Marakhanov, A.V., Ushanova, E.A., 2007. Tectonicsetting and geological manifestations of the 2003 Altai Earthquake. Geo-tectonics 41, 87e104.
Ross, S.M., 2003. Peirce's criterion for the elimination of suspect experimental data.J. Eng. Technol. 20, 38e41.
Rother, H., Lehmkuhl, F., Fink, D., Nottebaum, V., 2014. Surface exposure datingreveals MIS-3 glacial maximum in the Khangai Mountains of Mongolia. Quat.Res. 82, 297e308.
Rudoy, A.N., 1981. To the history of pre-glacial lakes of Chuya Basin, Altai mountains.Data of glaciological research. Acad. Sci. USSR 41, 213e218 (in Russian).
Rudoy, A.N., 1998. Mountain ice-dammed lakes of Southern Siberia and their in-fluence on the development and regime of the intracontinental runoff systemsof North Asia in the late Pleistocene. In: Benito, G., Baker, V.R., Gregory, K.J.(Eds.), Palaeohydrology and Environmental Change. Wiley, Chichester,pp. 215e234.
Rudoy, A.N., 2002. Glacier-dammed lakes and geological work of glacial superfloodsin the late Pleistocene, southern Siberia, Altai mountains. Quat. Int. 87/1,119e140.
Rudoy, A.N., Baker, V.R., 1993. Sedimentary effects of cataclysmic late Pleistoceneglacial outburst flooding, Altay Mountains, Siberia. Sediment. Geol. 85, 53e62.
Rupper, S.B., Roe, G.H., 2008. Glacier changes and regional climate - a mass andenergy balance approach. J. Clim. 21, 5384e5401.
Rusanov, G.G., 2008. Maximal level of Chuya glacier-dammed lake in the MountainAltai. Geomorphology 1, 65e71 (In Russian).
Rusanov, G.G., 2010. The Holocene climate changes in Chuya depression (GornyAltai) on the basis of ostracod fauna analysis (Izmenenija klimata Chujskojkotloviny Gornogo Altaja v golocene po faune ostracod). Prog. Mod. Nat. Sci.[Uspehi sovremennogo estestvoznanija] 10, 20e25 (in Russian).
Sapozhnikov, V.V., 1911. Trails through Russian Altai. Tomsk, 169 pp.

N. Gribenski et al. / Quaternary Science Reviews 149 (2016) 288e305 305
Schaefer, J.M., Denton, G.H., Barrell, D.J.A., Ivy-Ochs, S., Kubik, P.W., Andersen, B.G.,Phillips, F.M., Lowell, T.V., Schlüchter, C., 2006. Near-synchronous interhemi-spheric termination of the last glacial maximum in mid-latitudes. Science 312,1510e1513.
Schomacker, A., Kjær, K.H., 2007. Origin and de-icing of multiple generations oficecored moraines at Brúarj€okull. Icel. Boreas 36, 411e425.
Sevestre, H., Benn, D.I., 2015. Climatic and geometric controls on the global distri-bution of surge-type glaciers: implications for a unifying model of surging.J. Glaciol. 61, 646e662.
Shahgedanova, M., Nosenko, G., Khromova, T., Muraveyev, A., 2010. Glaciershrinkage and climatic change in the Russian Altai from the mid-20th century:an assessment using remote sensing and PRECIS regional climate model. J. Phys.Res. 115, 1e12.
Sharp, M.J., 1984. Annual moraine ridges at Skalafellsj€okull, south-east Iceland.J. Glaciol. 30, 82e93.
Shukina, E.N., 1960. Patterns of distribution and stratigraphy of Quaternary sedi-ments in the territory of the Altai. Tr. GIN AN SSSR 26, 127e164 (in Russian).
Sheinkman, V.S., 2011. Glaciation in the high mountains of Siberia. In: Ehlers, J.,Gibbard, P.L., Hughes, P.D. (Eds.), Developments in Quaternary Science, 15,pp. 883e907.
Solomina, O., Haeberli, W., Kull, C., Wiles, G., 2008. Historical and Holocene gla-ciereclimate variations: general concepts and overview. Glob. Planet. Change60, 1e9.
Stone, J.O., 2000. Air pressure and cosmogenic isotope production. J. Geophys. Res.105, 23 753e23 759.
Strelow, F., Weinert, C., Eloff, C., 1972. Distribution coefficients and anion exchangebehavior of elements in oxalic acid-hydrochloric acid mixtures. Anal. Chem. 44,2352e2356.
Striberger, J., Bj€orck, S., Benediktsson, I.€O., Snowball, I., Uvo, C., Ing�olfsson, �O.,Kjaer, K.H., 2011. Climatic control of the surge periodicity of an Icelandic outletglacier. J. Quat. Sci. 26, 561e565.
Stroeven, A.P., H€attestrand, C., Heyman, J., Kleman, J., Mor�en, B.M., 2013. Glacialgeomorphology of the Tian Shan. J. Maps 9, 505e512.
Stroeven, A.P., Heyman, J., Fabel, D., Bj€orck, S., Caffee, M.W., Fredin, O., Harbor, J.M.,2015. A new Scandinavian reference 10Be production rate. Quat. Geochronol. 29,104e115.
Sugden, D.E., John, B., 1976. Glaciers and Landscape. Edward Arnold publishers,London.
Sugden, D.E., Glasser, N.F., Clapperton, C.M., 1992. Evolution of large roches mou-tonnees. Geogr. Ann. 74A, 253e264.
Svitoch, A.A., 1978. On age of glacial and fluvioglacial sediments in Chagan-Uzuncatchment (Mountain Altai). Herald of MSU, Series 5. Geography 4, 114e116(in Russian).
Svitoch, A.A., Parunin, O.G., 1976. On age of the terminal moraine in Chagan-Uzunvalley (Mountain Altai). Glaciology of Altai. Tomsk 10, 102e103 (in Russian).
Thompson, L.G., Yao, T., Davis, M.E., Henderson, K.A., Thompson, E.M., Lin, P.N.,Beer, J., Synal, H.A., Cole-Dai, J., Bolzan, J.F., 1997. Tropical climate instability: thelast glacial cycle from a QinghaieTibetan ice core. Science 276, 1821e1825.
Truffer, M., Echelmeyer, K.A., 2003. Of isbrae and ice streams. Ann. Glaciol. 36,66e72.
Tweed, F.S., Russell, A.J., 1999. Controls on the formation and sudden drainage ofglacier-impounded lakes: implications for j€okulhlaup characteristics. Prog.Phys. Geogr. 23, 79e110.
Twiss, R.J., Moores, E.M., 2007. Structural Geology, second ed. Freeman, New York.736 pp.
Walder, J.S., Costa, J.E., 1996. Outburst floods from glacier-dammed lakes: the effectof mode of lake drainage on flood magnitude. Earth Surf. Process. Landforms 21,701e723.
Zander, A., Frechen, M., Zykina, V., Boenigk, W., 2003. Luminescence chronology ofthe upper Pleistocene loess record at Kurtak in middle Siberia. Quat. Sci. Rev. 22,999e1010.