quarterly progress report to doe-netl david p. cercone
TRANSCRIPT

1
QUARTERLY PROGRESS REPORT
To DOE-NETL
David P. Cercone, Program Manager Award Number: DE-FE0006821
SMALL SCALE FIELD TEST DEMONSTRATING CO2 SEQUESTRATION IN ARBUCKLE SALINE AQUIFER AND BY CO2-EOR AT WELLINGTON FIELD,
SUMNER COUNTY, KANSAS
Project Director/Principal Investigator: W. Lynn Watney
Senior Scientific Fellow Kansas Geological Survey
Ph: 785-864-2184, Fax: 785-864-5317 [email protected]
Joint Principal Investigator: Yevhen ‘Eugene’ Holubnyak
[email protected] Ph: 785-864-2070
Prepared by Lynn Watney, Yevhen Holubnyak, Jennifer Hollenbach, Tiraz Birdie, Mina
Fazelalavi, Tandis Bidgoli, Drew Schwab, Alex Nolte, George Tsoflias, John Victorine, Brandon Graham, John Doveton, Jason Bruns, Brett Blazer, Dana Wreath
Date of Report: April 28, 2017 DUNS Number: 076248616
Recipient: University of Kansas Center for Research &
Kansas Geological Survey 1930 Constant Avenue Lawrence, KS 66047
Project/Grant Period: 10/1/2011 through 9/30/2017 Twenty Second Quarterly Report
Period Covered by the Report: January 1, 2017 through March 31, 2017
Signature of Submitting Official:
Yevhen ‘Eugene’ Holubnyak

2
EXECUTIVE SUMMARY PROJECT OBJECTIVES The objectives of this project are to understand the processes that occur when a maximum of 70,000 metric tonnes of CO2 are injected into two different formations to evaluate the response in different lithofacies and depositional environments. The evaluation will be accomplished through the use of both in situ and indirect MVA (monitoring, verification, and accounting) technologies. The project will optimize for carbon storage accounting for 99% of the CO2 using lab and field testing and comprehensive characterization and modeling techniques.
CO2 will be injected under supercritical conditions to demonstrate state-of-the-art MVA tools and techniques to monitor and visualize the injected CO2 plume and to refine geomodels developed using nearly continuous core, exhaustive wireline logs, and well tests and a multi- component 3D seismic survey. Reservoir simulation studies will map the injected CO2 plume and estimate tonnage of CO2 stored in solution, as residual gas, and by mineralization and integrate MVA results and reservoir models shall be used to evaluate CO2 leakage. A rapid-response mitigation plan will be developed to minimize CO2 leakage and provide comprehensive risk management strategy. A documentation of best practice methodologies for MVA and application for closure of the carbon storage test will complete the project. The CO2 shall be supplied from a reliable facility and have an adequate delivery and quality of CO2.
SCOPE OF WORK Budget Period 1 includes updating reservoirs models at Wellington Field and filing Class II and Class VI injection permit application. Static 3D geocellular models of the Mississippian and Arbuckle shall integrate petrophysical information from core, wireline logs, and well tests with spatial and attribute information from their respective 3D seismic volumes. Dynamic models (composition simulations) of these reservoirs shall incorporate this information with laboratory data obtained from rock and fluid analyses to predict the properties of the CO2 plume through time. The results will be used as the basis to establish the MVA and as a basis to compare with actual CO2 injection. The small scale field test shall evaluate the accuracy of the models as a means to refine them in order to improve the predictions of the behavior and fate of CO2 and optimizing carbon storage.
Budget Period 2 includes completing a Class II underground injection control permit; drilling and equipping a new borehole into the Mississippian reservoir for use in the first phase of CO2 injection; establishing MVA infrastructure and acquiring baseline data; establishing source of CO2 and transportation to the injection site; building injection facilities in the oil field; and injecting CO2 into the Mississippian-age spiculitic cherty dolomitic open marine carbonate reservoir as part of the small scale carbon storage project.
In Budget Period 3, contingent on securing a Class VI injection permit, the drilling and completion of an observation well will be done to monitor injection of CO2 under supercritical conditions into the Lower Ordovician Arbuckle shallow (peritidal) marine dolomitic reservoir.
Monitoring during pre-injection, during injection, and post injection will be accomplished with MVA tools and techniques to visualize CO2 plume movement and will be used to reconcile

3
simulation results. Necessary documentation will be submitted for closure of the small scale carbon storage project.
PROJECT GOALS The proposed small scale injection will advance the science and practice of carbon sequestration in the Midcontinent by refining characterization and modeling, evaluating best practices for MVA tailored to the geologic setting, optimize methods for remediation and risk management, and provide technical information and training to enable additional projects and facilitate discussions on issues of liability and risk management for operators, regulators, and policy makers.
The data gathered as part of this research effort and pilot study will be shared with the Southwest Sequestration Partnership (SWP) and integrated into the National Carbon Sequestration Database and Geographic Information System (NATCARB) and the 6th Edition of the Carbon Sequestration Atlas of the United States and Canada.
Project Deliverables by Task 1.5 Well Drilling and Installation Plan (Can be Appendix to PMP or Quarterly Report) 1.6 MVA Plan (Can be Appendix to PMP or Quarterly Report) 1.7 Public Outreach Plan (Can be Appendix to PMP) 1.8 Arbuckle Injection Permit Application Review go/no go Memo 1.9 Mississippian Injection Permit Application Review go/no go Memo 1.10 Site Development, Operations, and Closure Plan (Can be Appendix to PMP) 2.0 Suitable geology for Injection Arbuckle go/no go Memo 3.0 Suitable geology for Injection Mississippian go/no go Memo 11.2 Capture and Compression Design and Cost Evaluation go/no go Memo 19 Updated Site Characterization/Conceptual Models (Can be Appendix to Quarterly) 21 Commercialization Plan (Can be Appendix to Quarterly Report). 30 Best Practices Plan (Can be Appendix to Quarterly or Final Report)
CO2-EOR Accomplishments
1. Day-to-day field operations similar to that reported in previous two quarters (Q20 and Q21) and are a continuation of Tasks 12–15
2. Continued monitoring of CO2 plume movement a. Recorded volumes of CO2 produced, oil, and brine recovered b. Only seven wells are being monitored based on past geochemical analyses that indicate
the CO2 plume has largely stabilized. Wells are currently being sampled for on-site (performed by KGS) and lab-based geochemical analyses (performed by Baker Chemicals). CO2 gas quality measurements are being performed by Berexco staff.
3. The primary CO2 plume has been managed by pressure maintenance including use of two nearby injection wells and targeted fluid withdrawal in eight surrounding wells. The CO2 injection conforms largely to the stratigraphic architecture recorded in the geocellular model. Key work for the remainder of the CO2-EOR phase is to continue measuring all inputs and

4
outputs to obtain accurate measurement of CO2 sequestered in the reservoir and the incremental oil produced from a single injection cycle.
4. On March 31, 2017 the daily CO2 amount recorded was 1-8 MCFD. As of March 31, 2017, the cumulative produced CO2 accounts for 18% of the injected volume (no change from December, 2016).
5. The re-processed 3D seismic was analyzed using AVAZ (Amplitude Variation with AZimuth) pre-stack methods which allowed mapping of fracture density and orientation in the Mississippian reservoir and the Arbuckle saline acquirer.
6. CO2 fluid substitution seismic modeling in the Mississippian was completed. 7. Data collected for the project is constantly being updated and pre-processed for uploading
into web-based interactive database catalogue (Figure 1).
http://www.kgs.ku.edu/PRS/Ozark/Summary/CO2_II.html
Figure 1. Wellington Field project data processing and archiving activities.
Geological storage and Class VI Permit Accomplishments
1. Wellington project team continues earthquake activity with 15 seismometer stations on loan from IRIS, 3 KGS seismometers and regional USGS stations: over 1,900 earthquakes have been documented (magnitude 0.4-2.5) since April 2015, northward progression from Oklahoma is recorded, 1.5 TB of Wellington earthquake data provided to DOE NETL in February 2017, several publications are in preparations or have been accepted.

5
2. Since mid-April 2016, continuous (1-sec) baseline pressure measurements have been acquired in the perforated lower Arbuckle zone in the shut-in Class VI injector. Because of this monitoring, the well has not been retrofitted for installation of MVA tools (BP2 Milestone).
3. In this quarter KGS and Berexco have received additional 14 Requests for Information (RfI) from EPA team. Per verification from EPA Region VII Director, all RfI with the exception of financial responsibility questions were successfully addressed and closed.
4. Significant accomplishment for this quarter is determination of Area of Review (AoR) and closure of CO2 plume migration modeling RfI’s.
5. Berexco’s financial and insurance teams are researching viable approaches for providing insurance or alternative methods to satisfy financial responsibility requirements for UIC Class VI permit.
Q22 TASKS
Site Characterization of Mississippian Reservoir for CO2-EOR –Wellington Field
The CO2 injection was completed in 165 days or approximately 5 months with an average of 120 tonnes per day of CO2 injected (Figures 1 and 2). Oil production rates remain at about 22–25 BOPD with no sign of decline. On March 31, 2017 the daily CO2 amount recorded was 0 MCFD; however, some wells occasionally still produce CO2 with the total average production rate of 1-8 MCFD. As of March 31, 2017, the cumulative produced CO2 remains at approximately 18% of the injected volume. Only the seven innermost wells are currently being sampled for on-site (performed by KGS) and lab-based geochemical analyses (performed by Baker Chemicals). The low amounts of recovered CO2 (Figures 2 and 3) and evidence of diffusion in brine data indicate the flood is conformable and is not bypassing through conductive fractures. Key observations this quarter:
1) Incremental oil production is 2X greater than before injection (Figure 2); 2) The pH in well 69 stabilized (5.41) and still remains at the same level since December, 2016; 3) The temperature in Well 47 continues to fluctuate from 9° to 15° C; 4) The amount of CO2 vented remains very low (Figures 2 and 3).
These observations are consistent with the cessation of CO2 injection and the flood-front sweeping laterally away from the injector. In addition, efforts were made in the field to control CO2-related corrosion within the pilot area.

6
Figure 2. CO2 injected and CO2 and oil recovered in pilot scale injection in the Mississippian oil reservoir in Wellington Field.
0.001
0.010
0.100
1.000
10.000
100.000
1,000.000
10,000.000
100,000.000
Jan-16 Jan-16 Mar-16 Mar-16 Apr-16 May-16 Jun-16 Jul-16 Aug-16 Sep-16 Oct-16 Nov-16 Dec-16 Jan-17 Feb-17 Mar-17 Apr-17 May-17
CO2 Purchased Daily (MCF) CO2 Produced Daily (MCF)
Cumulative CO2 Produced (MCF) Incremental Oil Daily (bbls)
Cumulative Incremental Oil (bbls) Cum. Ratio Produced/Purchased CO2
Daily Ratio Produced/Purchased CO2 Daily Water Injection (bbls)
Efficiency, injected CO2 (MCF) /oil produced (STB)
CO2 injection starts 1-09-16
Pause CO2 injection
CO2 injection ends 6-25-16
Oil recovery starts 2-26-16
CO2 venting starts 2-29-16 CO2 venting
inconsistent 3-31-17

7
Figure 3. Update for incremental and cumulative barrels of oil recovered, comparison of CO2 recovered vs. purchased. CO2 recovered has remained at low levels compared to the amount of CO2 that has been injected. Incremental oil has actually increased slightly since water injection began indicating that the CO2 is being pushed rather uniformly away from the injection well, #2-32. The response closely resembles what has been forecast from the simulations.
0
10
20
30
40
50
60
70
80
90
Dec-15 Jan-16 Feb-16 Mar-16 Apr-16 May-16 Jun-16 Jul-16 Aug-16 Sep-16 Oct-16 Nov-16 Dec-16 Jan-17 Feb-17 Mar-17
Oil
prod
uctio
n ra
te, B
OPD
Incremental Oil Daily (bbls)
0.001
0.01
0.1
1
10
100
1000
10000
100000
Dec-15 Jan-16 Feb-16 Mar-16 Apr-16 May-16 Jun-16 Jul-16 Aug-16 Sep-16 Oct-16 Nov-16 Dec-16 Jan-17 Feb-17 Mar-17
CO2 V
olum
e, M
CFPD
CO2 Purchased Daily (MCF)
CO2 Produced Daily (MCF)
Daily Ratio Produced/Purchased CO2
0
2000
4000
6000
8000
10000
Dec-15 Jan-16 Feb-16 Mar-16 Apr-16 May-16 Jun-16 Jul-16 Aug-16 Sep-16 Oct-16 Nov-16 Dec-16 Jan-17 Feb-17 Mar-17
Cum
mul
ativ
e oi
l, bb
ls
Cumulative Incremental Oil (bbls)

8
Figure 3. Total CO2 vented in MCFD. The amount vented has declined to 1–8 MCFD.
Seismic reflection monitoring of the CO2 injection in KGS 2-32
One 2D seismic line was acquired along KGS 2-32 by Paragon in early summer of 2016 (June-July) immediately following completion of the CO2 injection in the Mississippian reservoir. The new 2D seismic line, along with two previously acquired 2D lines and the original 3D survey were processed by Fairfield. The processed data were delivered in December 2016.
1. The re-processed 3D seismic was analyzed using AVAZ (Amplitude Variation with AZimuth) pre-stack methods which allowed mapping of fracture density and orientation in the Mississippian reservoir and the Arbuckle saline acquirer. Fracture orientation prediction from AVAZ aligns with fractures observed in KGS wells and the main fault mapped in the 3D data (Figure 4). Furthermore, seismically mapped fractures in the Mississippian reveal reservoir permeable paths that are in agreement with borehole monitoring of CO2 migration through the reservoir (Figure 5).
2. CO2 fluid substitution seismic modeling in the Mississippian was completed and it predicts 15% change in zero-offset (stacked seismic) reflectivity. Modeling of pre-stack seismic predicts reflectivity change up to 45% introduced by the presence of CO2 in the pore space.
3. Analysis of the new 2D stacked seismic line is inconclusive due to low reflectivity change, potentially as large as 15% according to modeling, masked by noise. Ongoing analysis is examining data in the pre-stack domain employing AVO (Amplitude Variation with Offset) analysis and impedance inversion in order to determine if seismic reflection imaged the CO2 plume in the Mississippian.
0
100
200
300
400
500
600
700
800
Dec-15 Jan-16 Feb-16 Mar-16 Apr-16 May-16 Jun-16 Jul-16 Aug-16 Sep-16 Oct-16 Nov-16 Dec-16 Jan-17 Feb-17 Mar-17
CO2 P
rodu
ced
Daily
, MCF
D CO2 Produced Daily (MCF)

9
Figure 4. Re-processed 3D seismic analysis results for Mississippian reservoir illustrating fracture network density and orientations.
Figure 5. Re-processed 3D seismic analysis: discrete fracture network in agreement with field CO2 MVA data

10
Induced seismicity monitoring at Wellington Field and surrounding area
Monitoring earthquake activity is accomplished using 15 seismometer stations on loan from IRIS, 3 KGS seismometers and regional USGS stations (Figure 6).
1. Over 1900 earthquakes have been documented from April 2015 to present, ranging in magnitude from 0.4 to 2.5, constituting a uniquely dense, high-resolution1 seismicity data set.
2. No seismicity was detected at the Mississippian CO2 injection. 3. The regional earthquake data has revealed a northward progression of seismicity during the
monitoring period, from the Oklahoma border to now reaching the Wichita metropolitan area.
4. Time-lapse analysis of seismic anisotropy by observation of S-wave splitting shows that fluid pore pressures in the area have increased. This is the first direct observation of pore fluid pressure induced earthquakes in the region (Nolte et al., in review Science Advances).
5. This unprecedented pore pressure increase inferred by earthquake observations has also been monitored by pressure/temperature sensing in KGS 1-32 at the lower Arbuckle (30 m above basement).
6. 1.5 TB of Wellington earthquake data provided to DOE NETL, Pittsburgh, PA in February 2017 for comparison of Wellington events to Farnsworth EOR seismicity.
Figure 6. Visualization of Wellington Field earthquake catalog.
1 It should be noted that the USGS reports earthquakes greater than magnitude 2.5, thus information on smaller magnitude induced events is only available through the Wellington network.

11
Economical Monitoring of Pore Pressures in the Arbuckle Aquifer at Wellington, Kansas
In support of the Class VI injection permit, KGS is required to acquire background pre-injection pressures in the Arbuckle aquifer. This subject has acquired urgency since disposal of brine from oil and gas operations within the Arbuckle in Kansas and Oklahoma has resulted in increased pore pressures, which are suspected to be the source of induced seismicity in the region. Information about pressures is necessary to validate geomechanical and groundwater flow models, both of which are necessary to develop technical tools for predicting the likelihood of earthquakes at the Wellington site and to allow injections to commence. Downhole pressure in the proposed Wellington Arbuckle injection well (KGS 1-28) have been recorded continuously at a depth of approximately 5,000 feet since spring 2015 at an interval of 1 second. The acquired data has enabled KGS to identify increasing pressure trends at the site and additionally, the hydraulic manifestations of several earthquakes in the region.
It is commonly assumed that gauges for monitoring pressure in deep aquifers need to be installed at the perforation depth to obtain useful data. However, an experiment at the Wellington site was recently conducted to demonstrate that both pressure changes and absolute pressures within deep aquifers can be accurately estimated by monitoring pressures at the top of the water column in a well. Such shallow data can be obtained for a fraction of the cost of acquiring downhole pressure data, thereby enabling economic monitoring of deep aquifers. The water level at KGS 1-28 is at approximately 508 feet below ground. A shallow 50 psi pressure gage was attached in this well 522.5 feet below ground, approximately 14.5 feet below the top of the water column. The pressure was recorded in the shallow gage for a period of one week at 1 minute interval. The comparison of pressures in the shallow and deep gages is presented and discussed in Appendix A.
Due to a need for additional pressure data and to seek low-cost methods of acquiring downhole pressures, the shallow gauge will be reinstalled in KGS 1-28 in the coming month using a transmitting cable to capture measurements at 1 sample per second. These observations will help mitigate concerns regarding increased seismicity in the region and will help to calibrate the existing dataset providing a higher resolution. Pending successful measurements, this technique will be deployed for more long-term observation in wells surrounding injection activities.
SUMMARY
1. Produced (i.e., vented) CO2 accounts for 18% of the CO2 injected, no significant changes from previous quarter.
2. The Wellington seismometer array provides a dependable earthquake catalog and is updated on a weekly basis.
3. CO2 fluid substitution seismic modeling in the Mississippian was completed and it predicts 15% change in zero-offset (stacked seismic) reflectivity.

12
4. Additional confirmations of Arbuckle saline aquifer reginal pore pressure increase are continue to arrive from various sources
5. Mapping of fracture density and orientation in the Mississippian reservoir and the Arbuckle saline acquirer was performed and it is currently in agreement with field performance and geochemistry data.
6. Shallow vs. deep pressure monitoring techniques were compared and initial results are being prepared for a peer-revived publication.
7. AoR related RfIs were successfully closed with EPA UIC Class VI well permit review team.
PROJECT SCHEDULE
Schedule and costs for Arbuckle CO2 injection
Wellington project currently is scheduled to end is September 30, 2017. The information for the Determinations and Findings (D&F) was submitted February, 2017. This new D&F suggest changes in scope of work for Wellington project if difficulties with EPA UIC well Class VI permit are going to continue.
Under currently approved by EPA Post Injection Site Closure plan, KGS and Berexco are expected to continue MVA activities for four years after CO2 injection is ceased. This additional requirement changes previous schedule estimations. The updated Gantt Chart is provided below (Figure 7). This requirement will also expand required budget for the project (see Budgetary Information section).

13

14
Figure 7. Previous page. Updated Gantt Chart of Wellington Project with revised schedule for proposed BP3 Arbuckle injection.
MILESTONE STATUS REPORT
Task Budget Period Number Milestone Description Status
Task 2. 1 1 Site characterization of Arbuckle Saline Aquifer System – Wellington Field Completed
Task 3. 1 2 Site Characterization of Mississippian reservoir for CO2 EOR – Wellington Field Completed
Task 10. 2 3 Pre-injection MVA – establish background baseline readings Completed Task 13. 2 4 Retrofit Arbuckle injection well (#1-28) for MVA tool installation Completed
Task 18. 3-yr1 5 Compare simulation results with MVA Data and analysis and submit update of site characterization, modeling, and monitoring plan Completed
Task 22. 3-yr1 6 Recondition Mississippian boreholes around Mississippian CO2-EOR injector Completed
Task 27. 3-yr2 7 Evaluate CO2 geologic storage potential of CO2 EOR pilot Completed
Task 28. 3-yr2 8 Evaluate potential of incremental oil recovery and CO2 geologic storage by CO2 EOR – Wellington Field In Progress
FUTURE PLANS
1. Continue post-injection monitoring on a monthly basis for wells that are responding to flood. 2. Continue weekly sampling of wells to monitor production including CO2, oil, and brine
recovered 3. Perform XRD and XRF geochemical sampling on recovered cores from wells KGS 1-32,
KGS 2-32, and KGS Cutter 1 to verify geochemical fluid changes observed during MVA activities and to improve geochemical modeling.
4. Perform on-site and lab geochemical analysis for select wells with the exception of alkalinity that is limited only to measurements at the well.
5. Continue operation of the Wellington seismometer array. 6. Continue baseline pressure measurements in the perforated lower Arbuckle zone of the shut-
in Class VI injection well. 7. Continue to acquire SAR satellite images and recording cGPS for analysis of ground motion 8. Continue contrast 2-D seismic (pre-and post-CO2 injection in the Mississippian) to determine
plume’s extent. 9. Passive seismic monitoring will continue as a very important component for DOE and EPA.
PRODUCTS
Publications, conference papers, and presentations
Schwab, D.R., Bidgoli, T.S., and Taylor, M.H., accepted with revisions, Characterizing the potential for injection-induced fault reactivation through subsurface structural mapping

15
and stress field analysis, Wellington Field, Sumner County, Kansas: Journal of Geophysical Research.
Nolte K.A., Tsoflias G.P., Bidgoli T.S. and L.W. Watney, Shear-Wave Anisotropy Reveals Pore Fluid Pressure Induced Seismicity in the US Midcontinent, Science Advances (in review).
Nolte K.A., G.P. Tsoflias, Bidgoli T. and W.L. Watney (2017) Temporal Changes in Shear-Wave Anisotropy in the US Midcontinent, Society of Exploration Geophysicists 87th Annual Meeting Transactions (in review).
Molina Z., Nolte K. and G. Tsoflias (2017), Monitoring Induced Seismicity in Sumner County, Kansas, KU Undergraduate Research Symposium, Lawrence, Kansas, April 22, 2017.
Nolte A., Tsoflias G. P., Bidgoli T. S. and W. L. Watney (2017), Direct Evidence of Pore Fluid Pressure Increases Inducing Seismicity in the US Midcontinent Through Analysis of Shear-Wave Anisotropy, 2017 Annual Meeting of the Kansas Interdisciplinary Carbonate Consortium, Lawrence, Kansas, March 5-7¸ 2017.
Nolte A., Tsoflias G. P. and W. L. Watney (2017), Monitoring the Northward Advance of Injection Induced Seismicity in Southern Kansas, 2017 Annual Meeting of the Kansas Interdisciplinary Carbonate Consortium, Lawrence, Kansas, March 5-7¸ 2017.
Graham B., Tsoflias G. P. and W. L. Watney (2017), Seismic Determination of Azimuthal Anisotropy in the Mississippian Chert and Arbuckle from 3D P-P Reflection Data in Wellington Field, South-Central Kansas, 2017 Annual Meeting of the Kansas Interdisciplinary Carbonate Consortium, Lawrence, Kansas, March 5-7¸ 2017.
Graham B., Tsoflias G. P. and W. L. Watney (2017), Re-processing of 3D Seismic for Enhanced Imaging of the Mississippian and Arbuckle at Wellington Field, South-Central Kansas, 2017 Annual Meeting of the Kansas Interdisciplinary Carbonate Consortium, Lawrence, Kansas, March 5-7¸ 2017.
Haga L., Tsoflias G. P. and W. L. Watney (2017), Time-Lapse Imaging of CO2 Injection at the Mississippian Reservoir, Wellington Field, South-central Kansas, 2017 Annual Meeting of the Kansas Interdisciplinary Carbonate Consortium, Lawrence, Kansas, March 5-7¸ 2017.
Holubnyak, Y., Watney, W., Birdie, T., Rush, J., Fazelalavi, M., Wreath, D., Pilot Scale CO2 EOR in Mississippian Carbonate Reservoir at Wellington Field in South-Central Kansas, Energy Procedia, 2017, EGYPRO30710
16
Holubnyak, Y., Williams, E., Watney, W., Bidgoli, T., Rush, J., Fazelalavi, M., Gerlach, P., Calculation of CO2 Storage Capacity for Arbuckle Group in Southern Kansas: Implications for a Seismically Active Region, 2017, Energy Procedia, EGYPRO30482
PARTICIPANTS & OTHER COLLABORATING ORGANIZATIONS
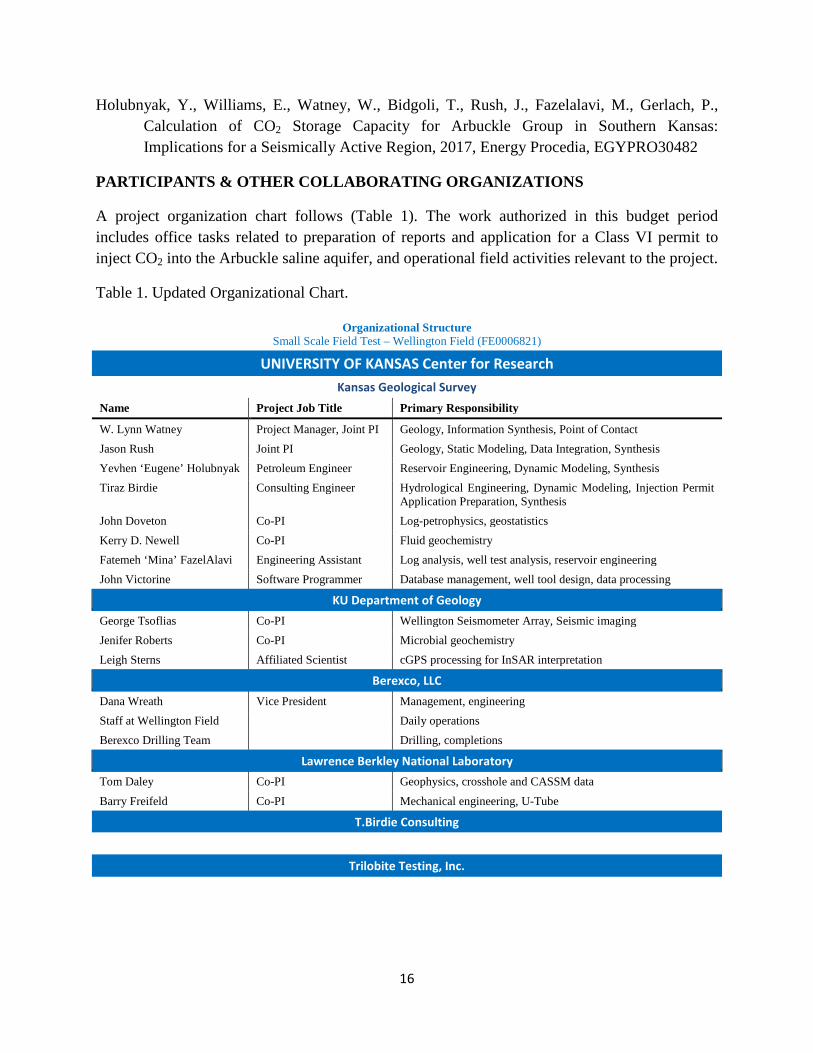
A project organization chart follows (Table 1). The work authorized in this budget period includes office tasks related to preparation of reports and application for a Class VI permit to inject CO2 into the Arbuckle saline aquifer, and operational field activities relevant to the project.
Table 1. Updated Organizational Chart.
Organizational Structure Small Scale Field Test – Wellington Field (FE0006821)
UNIVERSITY OF KANSAS Center for Research Kansas Geological Survey
Name Project Job Title Primary Responsibility
W. Lynn Watney Project Manager, Joint PI Geology, Information Synthesis, Point of Contact Jason Rush Joint PI Geology, Static Modeling, Data Integration, Synthesis Yevhen ‘Eugene’ Holubnyak Petroleum Engineer Reservoir Engineering, Dynamic Modeling, Synthesis Tiraz Birdie Consulting Engineer Hydrological Engineering, Dynamic Modeling, Injection Permit
Application Preparation, Synthesis John Doveton Co-PI Log-petrophysics, geostatistics Kerry D. Newell Co-PI Fluid geochemistry Fatemeh ‘Mina’ FazelAlavi Engineering Assistant Log analysis, well test analysis, reservoir engineering John Victorine Software Programmer Database management, well tool design, data processing
KU Department of Geology
George Tsoflias Co-PI Wellington Seismometer Array, Seismic imaging Jenifer Roberts Co-PI Microbial geochemistry Leigh Sterns Affiliated Scientist cGPS processing for InSAR interpretation
Berexco, LLC
Dana Wreath Vice President Management, engineering Staff at Wellington Field Daily operations Berexco Drilling Team Drilling, completions
Lawrence Berkley National Laboratory
Tom Daley Co-PI Geophysics, crosshole and CASSM data Barry Freifeld Co-PI Mechanical engineering, U-Tube
T.Birdie Consulting
Trilobite Testing, Inc.

17
IMPACT
The response of the CO2-EOR has been successful. Downhole pressure monitoring is important in validating hypotheses to explain the effects of large scale injection and induced seismicity in Mid. Continent region. All of information requested by EPA by has been submitted for the application of a Class VI injection permit with exception of financial responsibility documents.
CHANGES/PROBLEMS
P.I. Lynn Watney has been away since November 1, 2016 due to an illness. He is expected to return to the office in early June, 2017. During this period of time Yevhen ‘Eugene’ Holubnyak (Joint PI) will fulfill the obligations of the project P.I. Lynn Watney has forwarded all files relevant to the project to the joint P.I., which includes draft reports, memos, and proposals related to the project. Funds are very tight due to the no cost time extensions necessary to permit review and response to for the Class VI permit.
Jason Rush has accepted an offer from Occidental Petroleum Corporation and left KGS Energy Section crew. Dr. John Doveton has retired from KGS in early April, 2017. The search for candidates for these positions has started. Meanwhile, Yevhen Holubnyak, current P.I. for the project, would like to add Dr. Tandis Bidgoli in a role of Co-PI to DE-FE0006821. The request letter is drafted in will be provided to DOE Management separately.

18
BUDGETARY INFORMATION
Cost Status Report

19
APPENDIX A
Economical Monitoring of Pore Pressures in the Arbuckle Aquifer at Wellington, Kanas
In support of the Class VI injection permit, KGS is required to acquire background pre-injection pressures in the Arbuckle aquifer. This subject has acquired urgency since disposal of brine from oil and gas operations within the Arbuckle in Kansas and Oklahoma has resulted in increased pore pressures, which are suspected to be the source of induced seismicity in the region. Information about pressures is necessary to validate geomechanical and groundwater flow models, both of which are necessary to develop technical tools for predicting the likelihood of earthquakes at the Wellington site and to allow injections to commence. Downhole pressure in the proposed Wellington Arbuckle injection well (KGS 1-28) have been recorded continuously at a depth of approximately 5,000 feet since spring 2015 at an interval of 1 second. The acquired data has enabled KGS to identify increasing pressure trends at the site and additionally, the hydraulic manifestations of several earthquakes in the region.
While the pressure from the deep gage has been invaluable, it is fairly expensive to acquire. It is commonly assumed that gages for monitoring pressure in deep aquifer need to be installed at the perforation depth. An experiment at the Wellington site was recently conducted to demonstrate that both pressure changes and absolute pressures within deep aquifers can be accurately estimated by monitoring pressures at the top of the water column in a well. Such shallow data can be obtained for a fraction of the cost of acquiring downhole pressure data, thereby enabling economic monitoring of deep aquifers. The water level at KGS 1-28 is at approximately 508 feet below ground. A shallow 50 psi pressure gage was attached in this well 522.5 feet below ground, approximately 14.5 feet below the top of the water column. The pressure was recorded in the shallow gage for a period of one week at 1 minute interval. The comparison of pressures in the shallow and deep gages is presented and discussed below.
Pre-injection Period
The pressure in the shallow and deep gages between 12:30 pm and 2:00 pm at the start of the test is presented in Figure 1. A pressure drop of approximately 0.2 psi is recorded during this period. Due to low sensitivity of the deep gage, the measurements oscillated in a range of approximately 0.1 psi, and are a reflection of noise in the data. On the other hand, the relatively more sensitive shallow gage recorded steady non-oscillatory measurements, and closely followed the pressure trend in the deep gage. As can be noted from Figure A1 pressure fluctuations in each gage are nearly identical.
Injection Period
As brine injection commenced at 2:00 pm and water levels rose, the pressure in the deep and shallow gages had an identical rise (Figure A2). As pressure in the shallow gage exceeded 50 psi, the gage was removed in order to prevent damage.

20
De-pressurization Period
As water levels subsided following cessation of injection, the shallow gage was re-inserted at approximately 4:40 pm. The pressure in both the gages during the de-pressurization phase is presented in Figure A3, from which a nearly identical pressure trend can again be inferred in both the shallow and deep gages.
Post-Injection
Pressure in the two gages for the post-injection period is presented in Figure A4. The pressure varies within a range of approximately 0.15 psi due to tidal effects, but a slight increasing trend is also present. The tidal fluctuations in both gages are fairly synchronized and of similar magnitude.
Estimating Downhole Pore Pressure
The absolute downhole pressure at the elevation of the deep gage was estimated by several alternative methods which utilize the pressure data collected in the shallow well. The results are presented in Table A1 and indicate that the downhole pressure can be estimated to within 0.03% accuracy.
Summary and Conclusion
The pressure data collected during the pressure monitoring test confirms that pressure variations in the shallow and deep gages are of similar magnitude. Additionally, it is demonstrated that it is also possible to accurately estimate the absolute downhole pressure using pressure information recorded in a shallow gage. These results are encouraging and make it possible to economically measure pressure variations in deep aquifer using a shallow pressure gage. The experiment is to continue at the Wellington site in order to validate the results over a longer period of time. The data acquisition interval for the shallow gage has been reduced to one second in order to coincide with the data logging period in the deep well. The acquired data will allow KGS to determine if the very minute seismic pressure responses measured in the deep gaga can also be captured in the shallow gage. The results will be documented in the next quarterly report.

21
Figure A1. Pre-injection pressure in shallow and deep wells in KGS #1-28.
Figure A2. Pressures in shallow and deep gages during brine injection in KGS #1-28 on June 7, 2016.

22
Figure A3. Pressure in shallow and deep wells during recovery (de-pressurization) phase of the injection test.
Figure A4. Post-injection pressures in shallow and deep gages in KGS #1-28.

23
Table A1. Estimated downhole pressure in deep gage at KGS 1-28 using information in the shallow pressure gage.
Method Pressure Gradient Average Density of
Water Column Equation I
Calculated Pressure (psi) 2122.52 2122.78 2123.27 Measured Pressure (psi) 2122.65 2122.65 2122.65 Error (psi) 0.13 -0.13 -0.62 Error (%) 0.006% -0.006% -0.03%