quarterly performance & activity report
TRANSCRIPT
QUARTERLY PERFORMANCE &
ACTIVITY REPORT
Quarter 4 – 2019/2020

Quarterly Performance & Activity Report – Quarter 4 - 2019/20
Page 2 of 36
Contents
Theme 1 – Natural & Built Heritage ............................................. 4
Activity Snapshot 4
Theme 2 – Community & Culture................................................... 6
Library Visits 6
Target not met due to COVID-19 Impacts
Activity Snapshot 9
Theme 3 – Infrastructure ............................................................. 11
Activity Snapshot ........................................................................................... 11
Theme 4 – Health & Wellbeing ...................................................... 13
Waste Disposal Rate 13
Target of < 60.8% surpassed with a total of 59% of waste disposed to landfill during the Quarter 4
Recycling Rate 14
Target of > 39.2% exceeded with 41% of waste recycled during Quarter 4
Activity Snapshot 15
Theme 5 – Business & Employment ............................................ 18
Tourism Customer Satisfaction with Visitor Information Services 18
Target met for Quarter 4 with an average rating of high.
Visitor Information Centre Bookings 20
Quarter 4 revenue collected showed a continuing downturn compared to the same period in 2018/19, largely driven by the impacts of COVID-19.
Cycle Hub – Bike Hire Revenue 22

Quarterly Performance & Activity Report – Quarter 2 - 2019/20
Page 3 of 36
Quarter 4 Bike Hire Revenue impacted by COVID-19
Activity Snapshot 23
How We Work – Good Governance ................................................. 24
Customer Request Completion Rate ............................................. 24
Quarter 4 target exceeded.
Customer Request Resolution Rate 25
Quarter 4 target not met, however result only 1.5% below target
Operational Expenditure Against Budget 27
Quarter 4 target range met
Capital Expenditure Against Budget 28
Quarter 4 target not met
Staff Development - Training 30
Target met for 2019/20.
Staff Development – Performance Partnering 31
Target not met for 2019/20.
Staff Retention 32
Target met for 2019/20.
Activity Snapshot 33
Legend
Target not met
Target at risk or not improving
Heading toward target or progress acceptable
Target achieved
Measure under review
Quarterly Performance & Activity Report – Quarter 4 – 2019/20
Page 4 of 36
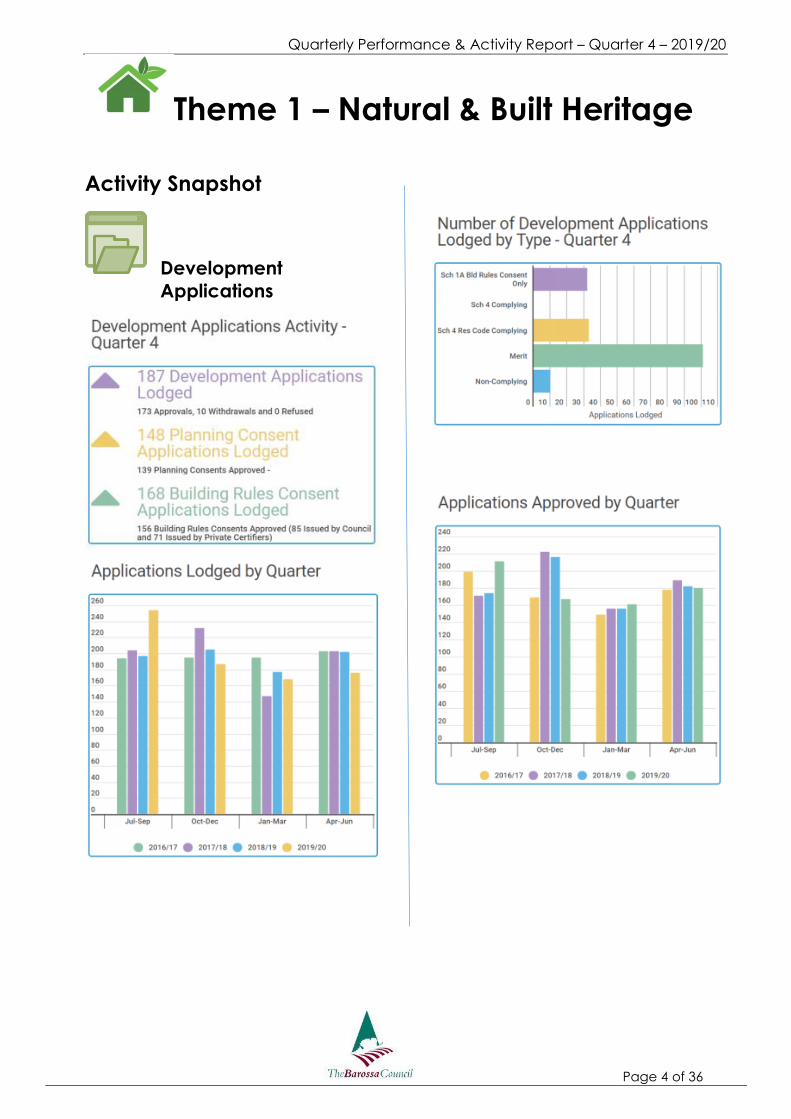
Theme 1 – Natural & Built Heritage
Activity Snapshot
Development
Applications

Quarterly Performance & Activity Report – Quarter 4 – 2019/20
Page 5 of 36
Quarterly Performance & Activity Report – Quarter 4 – 2019/20
Page 6 of 36
Theme 2 – Community & Culture
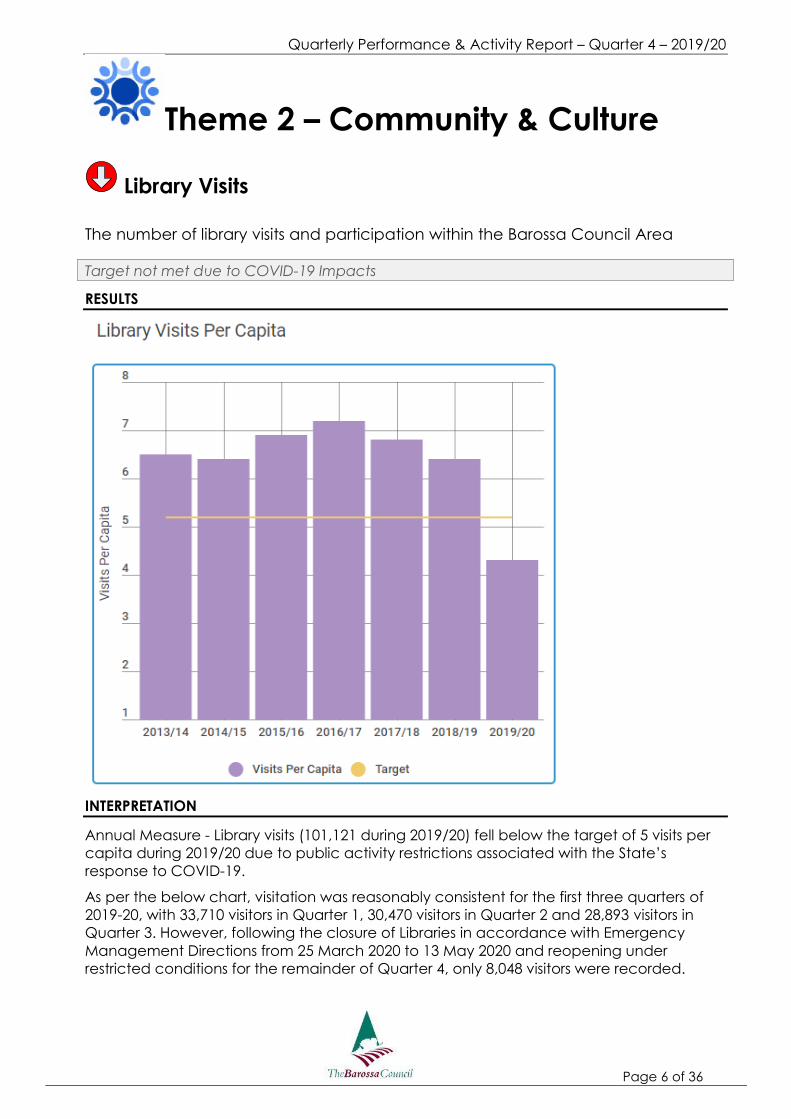
Library Visits
The number of library visits and participation within the Barossa Council Area
Target not met due to COVID-19 Impacts
RESULTS
INTERPRETATION
Annual Measure - Library visits (101,121 during 2019/20) fell below the target of 5 visits per
capita during 2019/20 due to public activity restrictions associated with the State’s
response to COVID-19.
As per the below chart, visitation was reasonably consistent for the first three quarters of
2019-20, with 33,710 visitors in Quarter 1, 30,470 visitors in Quarter 2 and 28,893 visitors in
Quarter 3. However, following the closure of Libraries in accordance with Emergency
Management Directions from 25 March 2020 to 13 May 2020 and reopening under
restricted conditions for the remainder of Quarter 4, only 8,048 visitors were recorded.

Quarterly Performance & Activity Report – Quarter 4 – 2019/20
Page 7 of 36
Negative impacts associated with COVID-19 were also seen across activity data recorded
for PC and Wifi Use in Public Libraries, number of library events held and the number of
items loaned as seen below.

Quarterly Performance & Activity Report – Quarter 4 – 2019/20
Page 8 of 36
Other more positive impacts were also recorded as a result of Council’s response to
COVID-19 in the provision of Library Services, with a shift to digital service delivery resulting
in a massive increase in digital resource use across Quarter 4.
RESPONSE
Council has endeavored to provide continuity of Library services in accordance with
limitations set by the State’s Emergency Directions during the COVID-19 pandemic as
Libraries are a particularly important contributor to community wellbeing and connection.
Whilst face to face service delivery has been restricted, the library team has introduced
broader Facebook engagement with children’s sessions being delivered across this
platform along with Storytime, Rattle and Rhyme and Lego Crew videos session posted
each week by the library children’s team, including reading from the Mayor, CEO and
Directors. Facebook followers has increased by 586 or 43% since April.
Other online services included eBooks and eMagazines, access to Studiosity for online
learning support, Ancestry, Computer School and Lynda online learning. There was a
significant increase in the use of the online Encyclopedia Britannica with highest use in
April and May during the school closure times. Overall 61% of online use was during
Quarter 4 reflecting the high use during the closure.
Home service deliveries continued during the closed period, except for services to homes
which were restricted during COVID closures.

Quarterly Performance & Activity Report – Quarter 4 – 2019/20
Page 9 of 36
Activity Snapshot
Community Assistance
Grants
Youth
Volunteer Management

Quarterly Performance & Activity Report – Quarter 4 – 2019/20
Page 10 of 36
* The above charts do not represent Council’s full volunteering
profile, with additional volunteers currently contributing to the
community committees and other programs which don’t
currently formally collect volunteer data.
Library Services
Quarterly Performance & Activity Report – Quarter 4 – 2019/20
Page 11 of 36
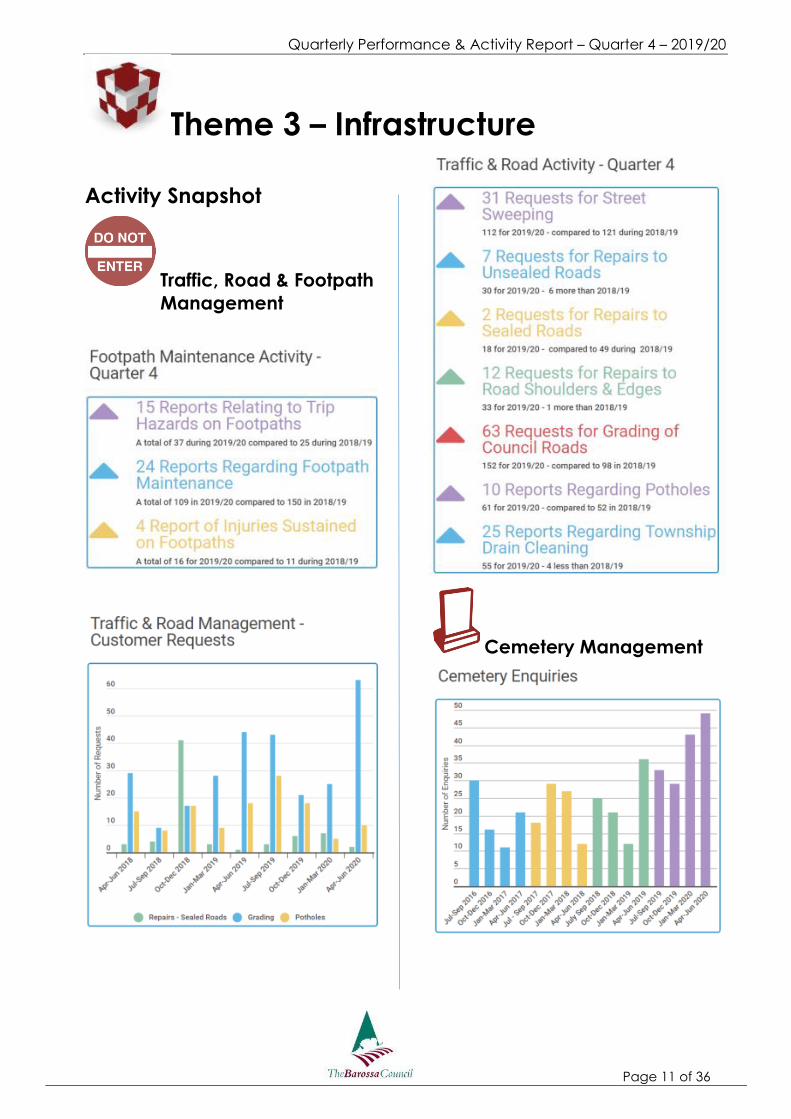
Theme 3 – Infrastructure
Activity Snapshot
Traffic, Road & Footpath
Management
Cemetery Management
Quarterly Performance & Activity Report – Quarter 4 – 2019/20
Page 12 of 36
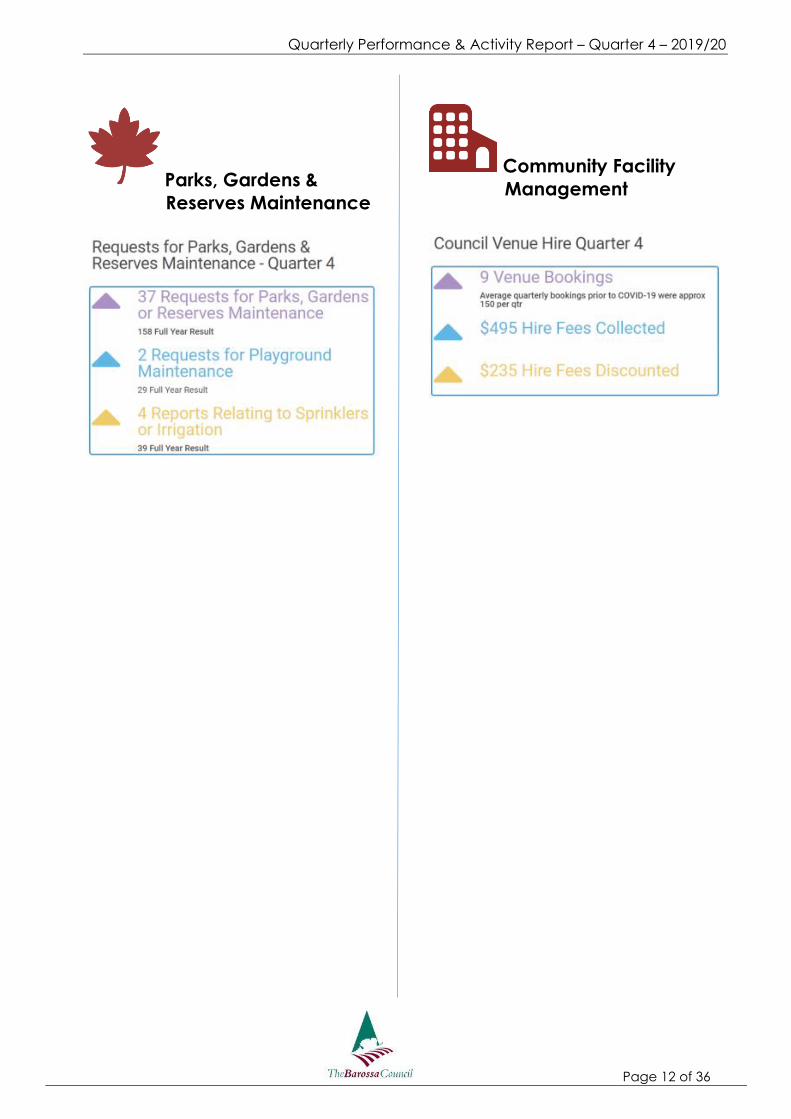
Parks, Gardens &
Reserves Maintenance
Community Facility
Management

Quarterly Performance & Activity Report – Quarter 4 – 2019/20
Page 13 of 36
Theme 4 – Health & Wellbeing Waste Disposal Rate
Percentage of waste disposed to landfill
Target of < 60.8% surpassed with a total of 59% of waste disposed to landfill during the
Quarter 4
RESULTS
INTERPRETATION
During the fourth quarter for 2019/20, Council recorded a waste to landfill rate of 59%,
beating the target of less than 60.8% waste to landfill.
During 2019/20, 4,808 tonnes of rubbish (landfill waste) was collected, which is on par with
the 2018/19 figure of 4,797.
RESPONSE
It is noted that the target has been consistently met or exceeded for general waste to
landfill this year. The target will be reviewed and updated in Quarter 1 next year.

Quarterly Performance & Activity Report – Quarter 4 – 2019/20
Page 14 of 36
Recycling Rate
Percentage of waste recycled
Target of > 39.2% exceeded with 41% of waste recycled during Quarter 4
RESULTS
INTERPRETATION
Recycling statistics consist of both co-mingled recycling collected via Council’s yellow
lidded bins and organic material collected via the currently voluntary green lidded bin
green waste collection service.
During the fourth quarter for 2019/20, Council recorded a recycling rate of 41% (24%
yellow lidded waste and 17% green waste), surpassing the target of greater than 39.2%.
During 2019/20, 1,967 tonnes of yellow lidded recycling and 1,474 tonnes of green waste
were collected, which represents an increase in both recycling and green waste
compared to 2018/19 (yellow – 1,912 and green – 1,195). As a result, the 2019/20 annual
recycling result (42%) improved by 3% compared to 2018/19 (39%).
RESPONSE
It is noted that the target has been consistently met or exceeded for recycling this year.
The target will be reviewed and updated in Quarter 1 next year.

Quarterly Performance & Activity Report – Quarter 4 – 2019/20
Page 15 of 36
Activity Snapshot
Animal Management
*Note – large increase in Jan-Mar 2018 2019 was due to
66 reports relating to wasps.
Waste Management
*Note – overall recycling rate reported on page 13
includes both recycling and green waste as recyclable
materials diverted from landfill.
Quarterly Performance & Activity Report – Quarter 4 – 2019/20
Page 16 of 36
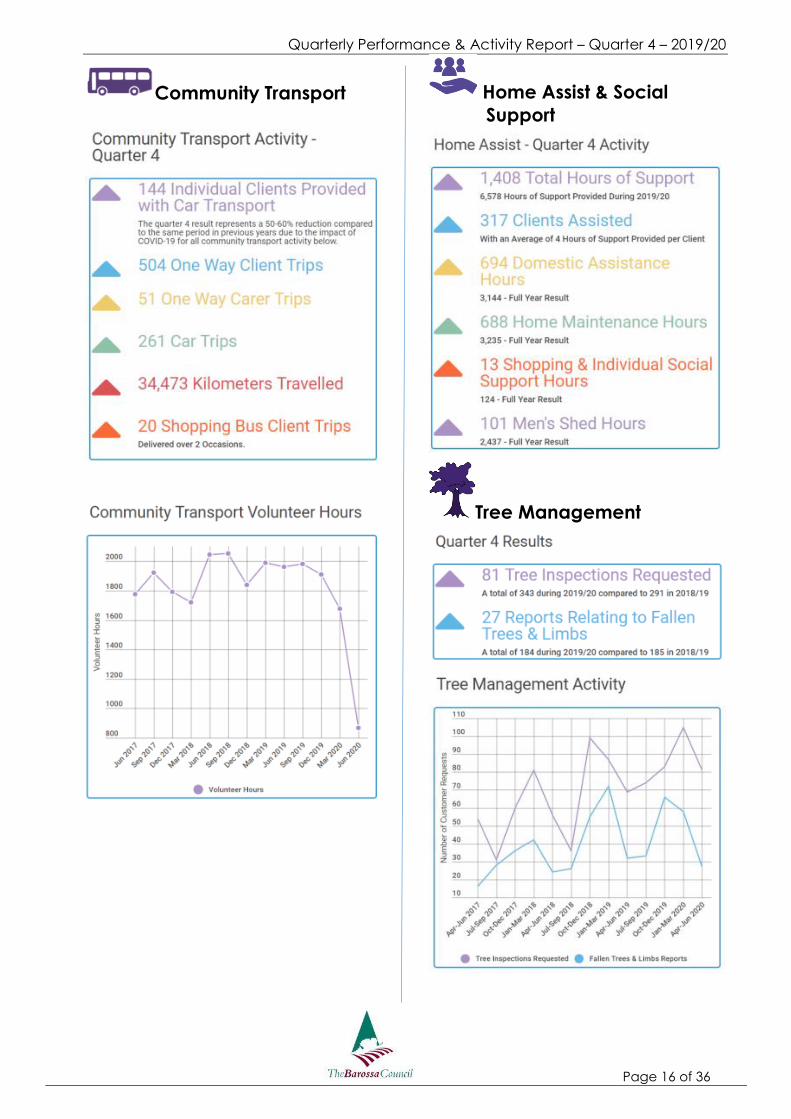
Community Transport
Home Assist & Social
Support
Tree Management
Quarterly Performance & Activity Report – Quarter 4 – 2019/20
Page 17 of 36
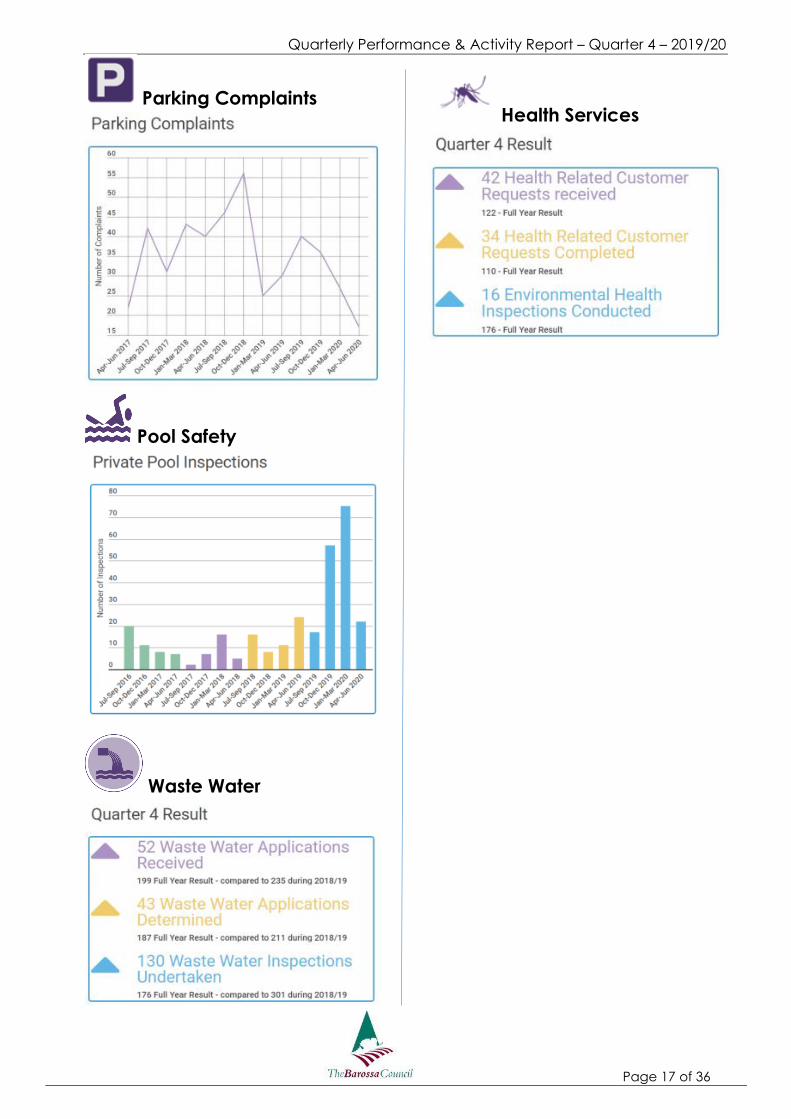
Parking Complaints
Pool Safety
Waste Water
Health Services

Quarterly Performance & Activity Report – Quarter 4 – 2019/20
Page 18 of 36
Theme 5 – Business & Employment
Tourism Customer Satisfaction with Visitor Information
Services
Average Customer Satisfaction Rating
Target met for Quarter 4 with an average rating of high.
RESULTS
INTERPRETATION
During 2019/20, this measure transitioned to new counting rules and an alternate data
source to increase the reliability of data. As a result, this measure is now reported bi-
annually based on data sourced from the SA Accredited Visitor Information Centre
Network Survey, which has more representative numbers of respondents.
Based on data released in February 2020, 101 customer ratings were collected using a
scale of 1 to 5, where 1 = low and 5 = high. The survey produced an average rating for
customer service of 4.93 (high) which exceeded the target of 4 and was slightly higher
than the State average of 4.9. Results also indicated an average rating for information
display and range of 4.85, and an average rating for the range and quality of souvenirs of
4.8. In addition, 58.4% of visitors surveyed said that they definitely feel that based on

Quarterly Performance & Activity Report – Quarter 4 – 2019/20
Page 19 of 36
advice received at the Visitor Information Centre they would experience more, stay
longer or spend more money than they had intended
RESPONSE
No response required.

Quarterly Performance & Activity Report – Quarter 4 – 2019/20
Page 20 of 36
Visitor Information Centre Bookings
Booking Revenue (Accommodation/Tours/Tickets)
Quarter 4 revenue collected showed a continuing downturn compared to the same
period in 2018/19, largely driven by the impacts of COVID-19.
RESULTS
INTERPRETATION
Total booking revenue for the second quarter equaled $14,805 compared to $103.959 at
the same time in 2019/20. Quarter 3 also saw a significant drop compared to the same
period the previous year, with just $62,235 in revenue collected.
Tourism activity in the Barossa and Visitor Information Centre Services have been severely
impacted by COVID-19 particularly as a result of the Barossa Cluster of infections identified
in March 2020 and the resulting restrictions on non-essential travel within the Barossa
region. The government’s Emergency Directions also placed further limitations on face to
face service delivery during the third and fourth quarters impacting on revenue and
visitation.
In addition to a decrease in booking revenue, Quarter 4 also saw a significant reduction in
visitation to the visitor centre in accordance with government restrictions. A total of 2,125
visitors were recorded at the Centre during the period, which represents an 82% decrease
compared to the same period in 2019/20. Not surprisingly, given State border restrictions,
only 28 of the visitors that have attended the centre were from outside of SA. This supports
anecdotal accounts that most visitors to the region over the past quarter are South

Quarterly Performance & Activity Report – Quarter 4 – 2019/20
Page 21 of 36
Australians on day trips, ultimately impacting on length of stay and accommodation
revenue.
Despite the recent impact of COVID-19 on the fourth quarter result, overall Council’s
annual visitor and enquiry numbers are only just behind 2018/19 figures recorded as per
the figures highlighted in the activity snapshot on page 24, showing strong growth outside
of the pandemic scenario.
RESPONSE
No response required.

Quarterly Performance & Activity Report – Quarter 4 – 2019/20
Page 22 of 36
Cycle Hub – Bike Hire Revenue
Sales Revenue
Quarter 4 Bike Hire Revenue impacted by COVID-19
RESULTS
INTERPRETATION
During Quarter 4 the Cycle Hub was closed in accordance with COVID-19 restrictions
therefore no revenue was generated. Prior to the impact of COVID-19, the Cycle hub had
seen an increase in bike hire numbers (213) and revenue ($7,603) across the third quarter
compared to 2018/19 (167 bikes hired and $5,796 revenue).
RESPONSE
No response required.

Quarterly Performance & Activity Report – Quarter 4 – 2019/20
Page 23 of 36
Activity Snapshot
Visitor Information
Centre & Cycle Hub

Quarterly Performance & Activity Report – Quarter 4 – 2019/20
Page 24 of 36
How We Work – Good Governance
Customer Request Completion Rate Percentage of Customer Requests Completed (On Time and Overdue)
Quarter 4 target exceeded.
RESULTS
INTERPRETATION
The fourth Quarter for 2019/20 saw a 103.2% request completion rate, exceeding the
target of 85%. This measure is calculated using the number of requests completed year to
date (regardless of when they were logged or due) versus the number of requests due for
the same period. As a result, it is possible for the number of requests completed during the
period to exceed the number logged.
RESPONSE
Council has implemented a raft of improvements to administrative processes and
electronic systems within the customer service supply chain via the Customer Service
Reboot Project to improve the close out of requests and delivery of a quality customer
experience. The Project has included a full review of customer request configuration, roles
and responsibilities within the lifecycle of a request, arrangements for updating Customers
and closing the loop on the status of request and broadening of mobility options for both
staff and customer’s in logging, responding to and tracking requests.

Quarterly Performance & Activity Report – Quarter 4 – 2019/20
Page 25 of 36
Customer Request Resolution Rate
Percentage of Customer Requests Resolved on Time
Quarter 4 target not met, however result only 1.5% below target and trending up
RESULTS
INTERPRETATION
The targeted resolution rate was missed by only 1.5% met during Quarter 4, with 83.52% of
requests completed by the nominated due date.
The significant improvements in the resolution rate seen over the past 12 to 18 months are
a direct result of efforts under the Change Program to improve processes and systems
within the customer request lifecycle.
As demonstrated in the chart below, the number of requests received during the fourth
quarter grew significantly with 5,134 requests compared to 3,473 in 2018/19. This increase
in requests was driven largely by the introduction of a new request type during the fourth
quarter to capture general requests for service or advice received by our Customer
Support Officers and closed out immediately at this first point of contact. The new request
type was introduced in April 2020 and by 30 June, 1697 requests had been entered into
Council’s Customer Request Management System. Despite the high number of incoming
customer requests, a total of 5,128 requests were completed during the fourth quarter,
reflecting ongoing efforts to resolve both current and long standing (overdue) requests.

Quarterly Performance & Activity Report – Quarter 4 – 2019/20
Page 26 of 36
RESPONSE
As identified in the previous measure, key strategic projects currently being implemented
to address customer request close out issues, to identify system and administrative process
improvements and to clarify customer service standards have resulted in continued
progress towards achieving the nominated target.
An important contributor to the improved resolution rate has also been the alignment of
the setup of requests within Council’s Customer Request Management System with
approved service levels ensuring that the timeframes to respond are accurate and
measurable.
In addition to a focus on the resolution of customer requests within a timely manner,
Council has also focused on improving our Customer’s experience. As such, new customer
request entry and status options were introduced during the third Quarter with the
implementation of new online services via Council’s website. It is anticipated that this
functionality, along with increased capacity to close out requests in the field, more
accurate customer request data and clarification of roles and responsibilities will also result
in an improved customer experience and closing of the loop.
Quarterly Performance & Activity Report – Quarter 4 – 2019/20
Page 27 of 36
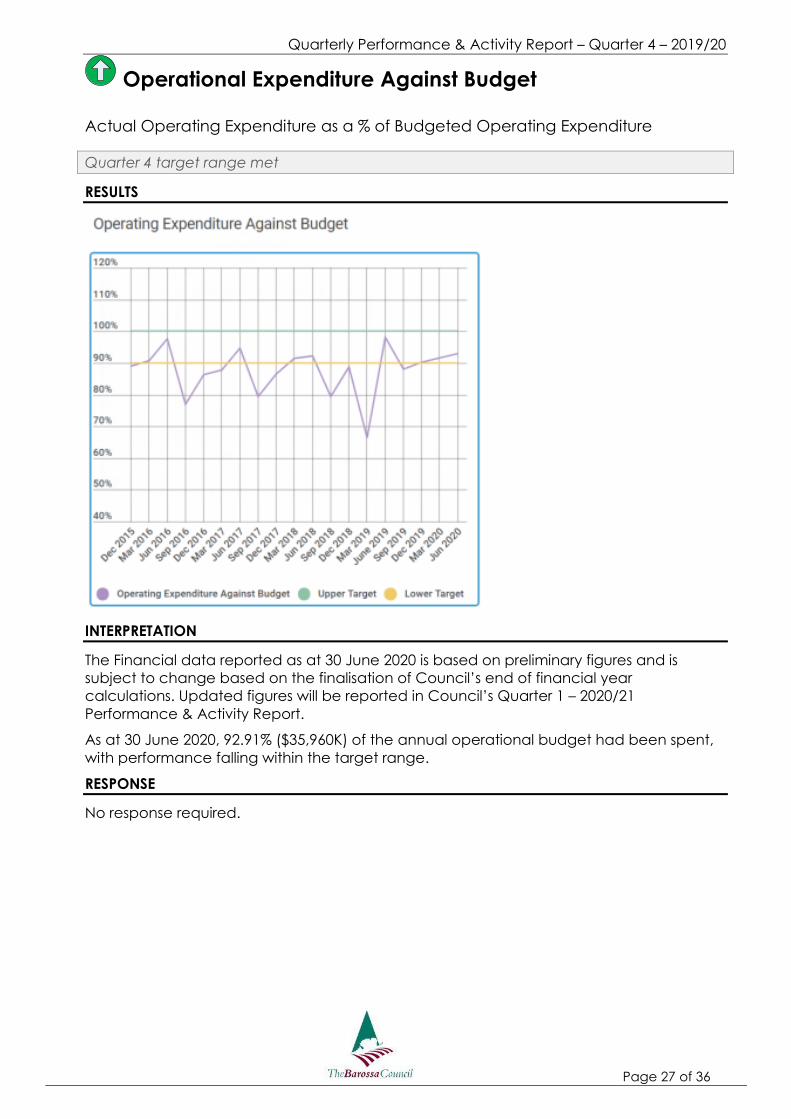
Operational Expenditure Against Budget
Actual Operating Expenditure as a % of Budgeted Operating Expenditure
Quarter 4 target range met
RESULTS
INTERPRETATION
The Financial data reported as at 30 June 2020 is based on preliminary figures and is
subject to change based on the finalisation of Council’s end of financial year
calculations. Updated figures will be reported in Council’s Quarter 1 – 2020/21
Performance & Activity Report.
As at 30 June 2020, 92.91% ($35,960K) of the annual operational budget had been spent,
with performance falling within the target range.
RESPONSE
No response required.

Quarterly Performance & Activity Report – Quarter 4 – 2019/20
Page 28 of 36
Capital Expenditure Against Budget
Actual Capital Expenditure as a percentage of Budgeted Capital Expenditure
Quarter 4 target not met
RESULTS
INTERPRETATION
The Financial data reported as at 30 June 2020 is based on preliminary figures and is
subject to change based on the finalisation of Council’s end of financial year
calculations. Updated figures will be reported in Council’s Quarter 1 – 2020/21
Performance & Activity Report.
As at 30 June 2020, 74.45% ($14,044,060) of the $18,864,083 adjusted capital budget had
been spent.
RESPONSE
Works & Engineering budget performance, before Q4 adjustments, finished up at 80%
spend against budget at 30 June 2020. A number of projects were not able to be
completed due to circumstances beyond officer’s control such as Angaston Main street
upgrade ($250k), and Calton Road drainage ($250k). The balance of the remaining
unspent project funds was predominately made up of savings or deferrals such as unused
road re-sheet unallocated budget and shoulder budget ($130k), savings in the Tanunda
WWTP ($117k), footpath savings ($76k) and plant deferral ($40k).

Quarterly Performance & Activity Report – Quarter 4 – 2019/20
Page 29 of 36
Based on estimated Q4 budget changes, removal of The Big Project budget comparison
for projects that did not receive grant funding and final end of year accounting
adjustments it is estimated the capital budget performance result will be 87.6% or only
2.4% from the target 90%.

Quarterly Performance & Activity Report – Quarter 4 – 2019/20
Page 30 of 36
Staff Development - Training
Percentage of staff with an approved training needs analysis
Target met for 2019/20.
RESULTS
INTERPRETATION
Annual Measure - All employees have an individual training plan which is scheduled for
review on a 12-month cycle.
As at 30 June 2020 the rate of staff with an approved Training Needs Analysis equaled
88%.
RESPONSE
No response required.

Quarterly Performance & Activity Report – Quarter 4 – 2019/20
Page 31 of 36
Staff Development – Performance Partnering
Percentage of staff who have completed performance partnering
Target not met for 2019/20.
RESULTS
INTERPRETATION
Annual Measure – Council achieved a performance partnering completion rate of 40% for
2019/20.
During 2019/20, 63 of 156 employees completed Performance Partnering.
RESPONSE
Performance partnering workbooks were due to be completed by the end of March 2020,
however as a result of COVID-19 and the implementation of working from home
arrangements performance partnering activity was delayed.

Quarterly Performance & Activity Report – Quarter 4 – 2019/20
Page 32 of 36
Staff Retention
Percentage of employees retained
Target met for 2019/20.
RESULTS
INTERPRETATION
Annual Measure – During 2019/20, Council recorded a retention rate of 92%.
The above measure is calculated using resignations versus headcount. It does not include
turnover due to cessation of fixed term contracts, casual contracts or retirement.
During 2019/20 there were 12 resignations.
RESPONSE
Council continues to support the retention of staff through the development and
implementation of contemporary organisational development and human resource
management practices.

Quarterly Performance & Activity Report – Quarter 4 – 2019/20
Page 33 of 36
Activity Snapshot
Rate Management
Local Government
Records Searches
Customer Requests

Quarterly Performance & Activity Report – Quarter 4 – 2019/20
Page 34 of 36
Procurement
Knowledge &
Technology Services
Human Resources &
Payroll
Council Decision Making

Quarterly Performance & Activity Report – Quarter 4 – 2019/20
Page 35 of 36
Communications &
Engagement

Quarterly Performance & Activity Report – Quarter 4 – 2019/20
Page 36 of 36
Appendix 1 – Measure Reporting Frequency
Theme 1 – Natural & Built Heritage
Building Rules Consent Processing - Quarterly
Planning Consent Processing - Quarterly
Theme 2 – Community & Culture
Library Visits - Annual
Theme 3 – Infrastructure
Asset Sustainability - Annual
Asset Spending Ratio – Annual
Theme 4 – Health & Wellbeing
Waste Disposal Rate – Quarterly
Recycling Rate - Quarterly
Theme 5 – Business & Employment
Tourism Customer Satisfaction with Visitor Information Services - Quarterly
Visitor Information Centre Booking – Quarterly
Cycle Hub – Bike Hire Revenue – Quarterly
How We Work – Good Governance
Operating Surplus/(Deficit) Ratio – Annual
Net Financial Liabilities Ratio – Annual
Customer Request Completion Rate - Quarterly
Customer Request Resolution Rate – Quarterly
Operational Expenditure Against Budget - Quarterly
Capital Expenditure Against Budget - Quarterly
Organisational Culture Improvement - Biennial
Staff Development – Training – Annual
Staff Development – Performance Partnering – Annual
Staff Retention – Annual