quarter 1: 2019 market and trade report - raisins sa
TRANSCRIPT
Market and Trade Report
Quarter 1: 2019
Quarter 1: 2019 Market and Trade Report
• Generally, South African dried grape exports fell by 18% in Q1 2019 compared to Q1 2018
• The reason for the decrease, remains difficult to explain. In general the market sentiment was really positive. Usually volumes are sold out before the new Northern Hemisphere seasons ends in September, but volumes sold has decreased if compared to Q1 2018;
• It’s already noted that specially Thompson prices are under pressure internationally, although until now packers have remain optimistic to sell product at levels of $2650
• Goldens, due to its limited availability along with Currents have been sold out;
• Germany was the biggest export market for South African dried grapes in volume terms. 2475 tons were exported in Q1 2019, a 5% increase from Q1 2018.
• Germany had a 27% volume share in South Africa’s dried grape exports in Q1 2019
• Algeria was the second largest export market for South African dried grapes. 2206 tons were exported in Q1 2019, a 24% increase from Q1 2018
• There was a 21% decrease in the trade balance volume in South African dried grapes between Q1 2018 and Q1 2019
• Higher global market share has been noted for South African dried grapes.
• South Africa exported 9114 tons of dried grapes worth USD24 663 000 to the EU in Q1 2019.
• South African dried grape exports to African markets in Q1 2019 amounted to 2412 tons and were valued at USD6 234 000.
• South Africa exported 514 tons of dried grapes worth USD1 679 000 to Asian in Q1 2019.
• South Africa exported 1122 tons of dried grapes worth USD2 517 000 to North American Free Trade Agreement (NAFTA) markets in Q1 2019.
• The weather conditions for drying could be considered ASS excellent, albeit some losses were experienced, estimated at roughly 6,000 ton dried mass;
1. Quarterly Highlights
PAGE

Quarter 1: 2019 Market and Trade Report
• The South African Currant crop, which is grown around the Vredendal region, was expected to be smaller than last year’s and reflects the ongoing impact of the drought. The reported intake is 1604 ton, a 700 ton decrease if compared to 2018. This is mainly due to the aftermath of the 2017/18 drought situation;
• Packers in South Africa were very busy with their produce in the first quarter so that they ship as much as possible to their destinations before Ramadan begins on the 6th of May
• This year’s Australian total vine fruits crop will be similar in volume to the 2018 crop, at around 17000 tonnes
• The Turkish dried vine fruit market remains stable with prices of both sultanas and raisins unchanged week on week with Turkish no 9 sultanas offered between USD2200-2300/tonne fob Izmir and Turkish raisins at a modest premium of USD100-USD150/tonne
• The new year began with a concern over possible Turkish Sultana shortages
• The decision by the EU to extend the exit date for the UK to leave the EU until October 31 has brought some welcome relief to UK buyers and importers, as this may reduce the necessity to stockpile for the immediate future.
• Easter brought increase in UK demand for all types of dried vine fruits.
• Exports of US raisins between August 2018 and March 2019 have seen a reduction of over 25% at around 38000 (short) tons compared with 63500 tons over the same period last year
• It is expected that SA crop will grow strongly, due to higher prices, improved cultivars also large investments is undertake by Government and it is expected the Industry could reach 95,000 ton over the next 3-5 years;
• This supports Industry’s activities to pursue generic market efforts.
1. Quarterly Highlights
PAGE
Quarter 1: 2019 Market and Trade Report
2. Overview of major producers
2.1 South Africa
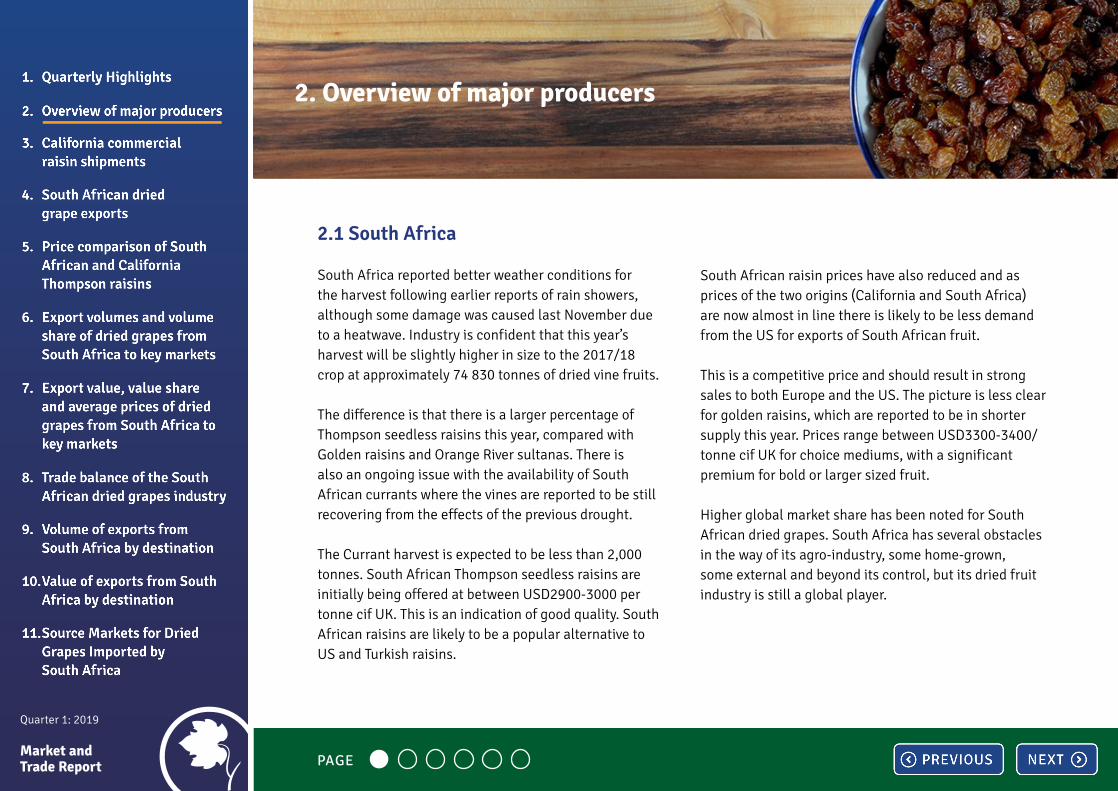
South Africa reported better weather conditions for the harvest following earlier reports of rain showers, although some damage was caused last November due to a heatwave. Industry is confident that this year’s harvest will be slightly higher in size to the 2017/18 crop at approximately 74 830 tonnes of dried vine fruits.
The difference is that there is a larger percentage of Thompson seedless raisins this year, compared with Golden raisins and Orange River sultanas. There is also an ongoing issue with the availability of South African currants where the vines are reported to be still recovering from the effects of the previous drought.
The Currant harvest is expected to be less than 2,000 tonnes. South African Thompson seedless raisins are initially being offered at between USD2900-3000 per tonne cif UK. This is an indication of good quality. South African raisins are likely to be a popular alternative to US and Turkish raisins.
South African raisin prices have also reduced and as prices of the two origins (California and South Africa) are now almost in line there is likely to be less demand from the US for exports of South African fruit.
This is a competitive price and should result in strong sales to both Europe and the US. The picture is less clear for golden raisins, which are reported to be in shorter supply this year. Prices range between USD3300-3400/tonne cif UK for choice mediums, with a significant premium for bold or larger sized fruit.
Higher global market share has been noted for South African dried grapes. South Africa has several obstacles in the way of its agro-industry, some home-grown, some external and beyond its control, but its dried fruit industry is still a global player.
PAGE
Quarter 1: 2019 Market and Trade Report
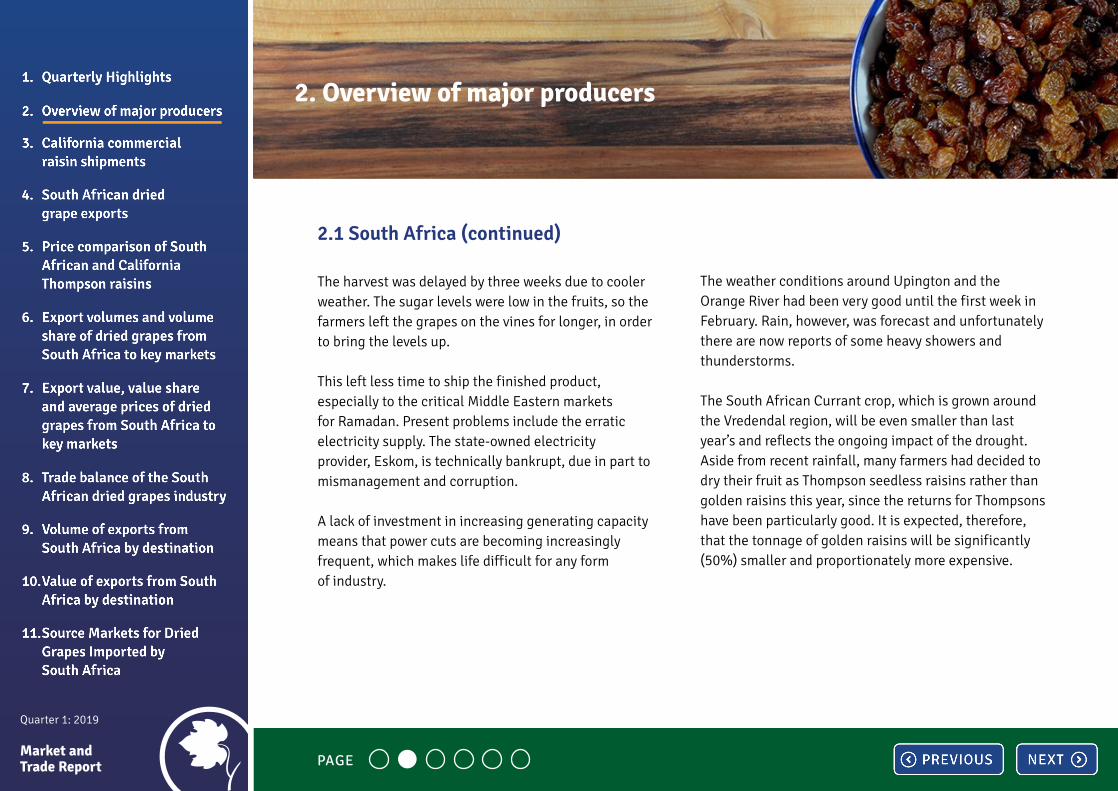
2.1 South Africa (continued)
The harvest was delayed by three weeks due to cooler weather. The sugar levels were low in the fruits, so the farmers left the grapes on the vines for longer, in order to bring the levels up.
This left less time to ship the finished product, especially to the critical Middle Eastern markets for Ramadan. Present problems include the erratic electricity supply. The state-owned electricity provider, Eskom, is technically bankrupt, due in part to mismanagement and corruption.
A lack of investment in increasing generating capacity means that power cuts are becoming increasingly frequent, which makes life difficult for any form of industry.
The weather conditions around Upington and the Orange River had been very good until the first week in February. Rain, however, was forecast and unfortunately there are now reports of some heavy showers and thunderstorms.
The South African Currant crop, which is grown around the Vredendal region, will be even smaller than last year’s and reflects the ongoing impact of the drought. Aside from recent rainfall, many farmers had decided to dry their fruit as Thompson seedless raisins rather than golden raisins this year, since the returns for Thompsons have been particularly good. It is expected, therefore, that the tonnage of golden raisins will be significantly (50%) smaller and proportionately more expensive.
2. Overview of major producers
PAGE

Quarter 1: 2019 Market and Trade Report
2.2 Australia
This year’s Australian total vine fruits crop will be similar in volume to the 2018 crop, at around 17000 tonnes. The 2018 crop enjoyed strong growth of 30.7% over the previous season, with sultanas accounting for 48.4%, Sunmuscats at 16.3% and currants at 10.4%. Exports for 2018 reached 5,613 tonnes, an increase of over 50% from the previous year.
Adelaide is reported to have experienced record temperatures of 46.3°C this year and, although the weather is fine this year, the completion of this year’s harvest may be up to two weeks later than last year. Early indications suggest that this year’s prices of sultanas and raisins will be a little higher than last year, due to increased costs for the producers.
2.3 Turkey
The Turkish dried vine fruit market remains stable with prices of both sultanas and raisins unchanged week on week with Turkish no 9 sultanas offered between USD2200-2300/tonne fob Izmir and Turkish raisins at a modest premium of USD100-USD150/tonne on this figure. Turkish raisin and sultana prices are broadly unchanged with specially cleaned standard number nine sultanas quoted between USD2250-2300 per tonne fob Izmir for shipments through until the end of August. Prices of Turkish sultanas and raisins have stabilised over the past few days, with reports of little activity on the local Izmir bourse.
Packers are, however, still purchasing fruit direct from the growers at relatively high prices with raw material for sultanas around TRY10.5 per kilo (USD2.00/kg). Exports of both Turkish sultanas and raisins have reached around 137000 tonnes up to February 9, compared with 140265 tonnes for the same period last year. The average export price for Turkish sultanas is USD2107/tonne fob Izmir.
2. Overview of major producers
PAGE
Quarter 1: 2019 Market and Trade Report
2.3 Turkey (continued)
Although it is still too early to make any accurate predictions for the size of the 2019 Turkish sultana crop, weather conditions remain favourable with cold temperatures and good rainfall. This means that the vines are dormant, which should encourage a better crop this year if there are no rain or frost problems later in the season.
Exports of Turkish sultanas and raisins have reached 178702 tonnes between September 1 2018 and April 13 2019, compared with 184423 tonnes in the same period last year. This means that there should be sufficient raw material to last until the new crop becomes available in August, but it does seem likely that prices will remain at today’s high levels for the foreseeable future.
2.4 UK
The decision by the EU to extend the exit date for the UK to leave the EU until October 31 has brought some welcome relief to UK buyers and importers, as this may reduce the necessity to stockpile for the immediate future. Easter brought increase in UK demand for all types of dried vine fruits. The start of the traditional British Easter was always heralded by the arrival of the Hot Cross bun in bakeries and retail outlets. Traditional recipes for Hot Cross buns contained a high percentage of currants, as well as raisins and sultanas.
This gave the product a special fruity taste. Recently however, the high cost of dried vine fruits and the lack of availability of currants has meant that other ingredients need to be found and these range from apple pieces to cranberries, chocolate pieces and salted caramel. The UK has many loyal customers for currants, but the coming year may see a fall in demand as customers, frustrated with the lack of availability, change their recipes and look for alternative ingredients.
2. Overview of major producers
PAGE

Quarter 1: 2019 Market and Trade Report
2.4 UK (continued)
Most major UK manufacturers and retailers have already increased their stocks of raw material to take into account possible interruptions in supply and this has resulted in a significant increase in sales of Turkish vine fruits to the UK, which trade at discounted value substantially lower than SA and the US.
The UK market has grown by 12% negatively in value and remains constant in volume. Raisins SA is working closely with the National Dried Fruit Trade Association to see how we improve the negative perception and negative public debate on Raisins being unhealthy. Misperception is significantly reduced demand in the world’s largest Dried Vine Fruit market.
2.5 Greece
Greece has for centuries been the principal supplier of currants, which come from a small black grape, unlike the white grape used for sultanas and raisins. Cultivation has centred around the Peloponnese area of Greece with some smaller quantities sourced from the Ionian islands of Zakynthos and Cephalonia. The available tonnage for export has reduced from crops of over 30000-40000 tonnes to this year’s disappointing figure of between 12000-14000 tonnes.
The good news is that, to date, weather conditions for the new crop of Greek currants are reported to be good and a better crop is anticipated. Meanwhile, offers are limited and prices high at between EUR2950-3150 per tonne (USD3314-3538/tonne) fob Piraeus for provincial quality. The continuing shortage of offers of Greek currants is causing problems for UK manufacturers who have traditionally used currants as an ingredient for products such as hot cross buns and mincemeat as well as for speciality products such as Garibaldi biscuits.
2. Overview of major producers
PAGE
Quarter 1: 2019 Market and Trade Report
2.6 Iran
Iran had traditionally been a major supplier of both sultanas and raisins to Germany, Holland and the UK, but following economic sanctions and the ongoing difficulties of trading with Iran, exports to the EU have slowed. This has meant that the UK in particular has gradually relied more and more on the purchase of both sultanas and raisins from a single source, namely Turkey, with currants purchased from Greece.
2.7 USA
Exports of US raisins between August 2018 and March 2019 have seen a reduction of over 25% at around 38000 (short) tons compared with 63500 tons over the same period last year. The recent reduction in the price of Californian raisins should help to increase exports of US raisins, as these continue to be regarded throughout Europe as a premium product. As an indication, select US Thompson seedless raisins are being quoted between USD1.38-1.40 per pound c&f Felixstowe for shipments until October.
2. Overview of major producers
PAGE

Quarter 1: 2019 Market and Trade Report
3. California commercial raisin shipments August 2018 –March 2019
Packaged (short) tons August 17-March 18 August 18-March 19 % Change
Natural Seedless 182346 130545 -28%
Domestic & Canada 118798 92311 -22%
Export Free 63548 38234 -28%
Dipped Seedless 677 510 -25%
Domestic & Canada 649 456 -30%
Export Free 27 54 97%
Golden Seedless 13206 11043 -16%
Domestic & Canada 9.041 8226 -9%
Export Free 4165 2816 -32%
Zante Currants 1820 1523 -16%
Domestic & Canada 1042 1008 -3%
Export Free 778 515 -34%
Other Seedless 6199 4567 -26%
PAGE
Quarter 1: 2019 Market and Trade Report
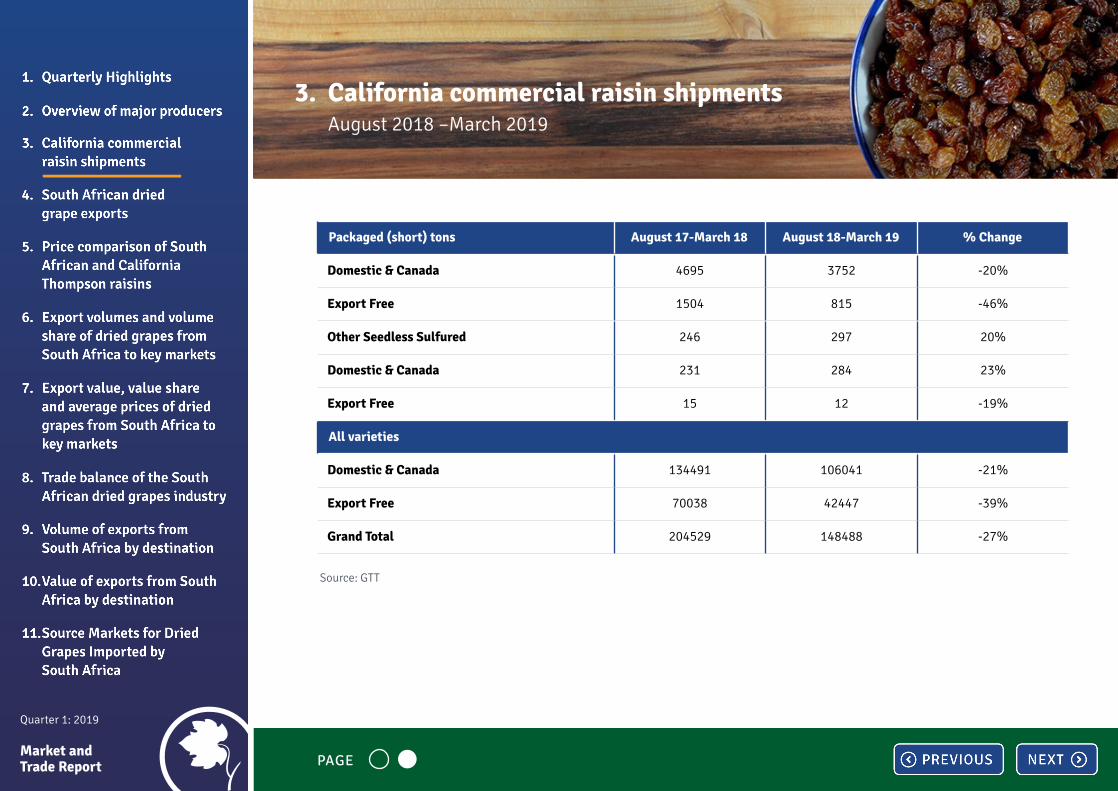
Packaged (short) tons August 17-March 18 August 18-March 19 % Change
Domestic & Canada 4695 3752 -20%
Export Free 1504 815 -46%
Other Seedless Sulfured 246 297 20%
Domestic & Canada 231 284 23%
Export Free 15 12 -19%
All varieties
Domestic & Canada 134491 106041 -21%
Export Free 70038 42447 -39%
Grand Total 204529 148488 -27%
Source: GTT
3. California commercial raisin shipments August 2018 –March 2019
PAGE
Quarter 1: 2019 Market and Trade Report
70000
60000
50000
40000
30000
20000
10000
0
Epor
ts (t
onne
s)
2002
33693
2003
34519
2004
27647
2005
21977
2006
23610
2007
41162
2008
38747
2009
23182
2010
40383
2011
16950
2012
24923
2013
32194
2014
35041
2015
52897
2016
46485
2017
48804
2018
61181
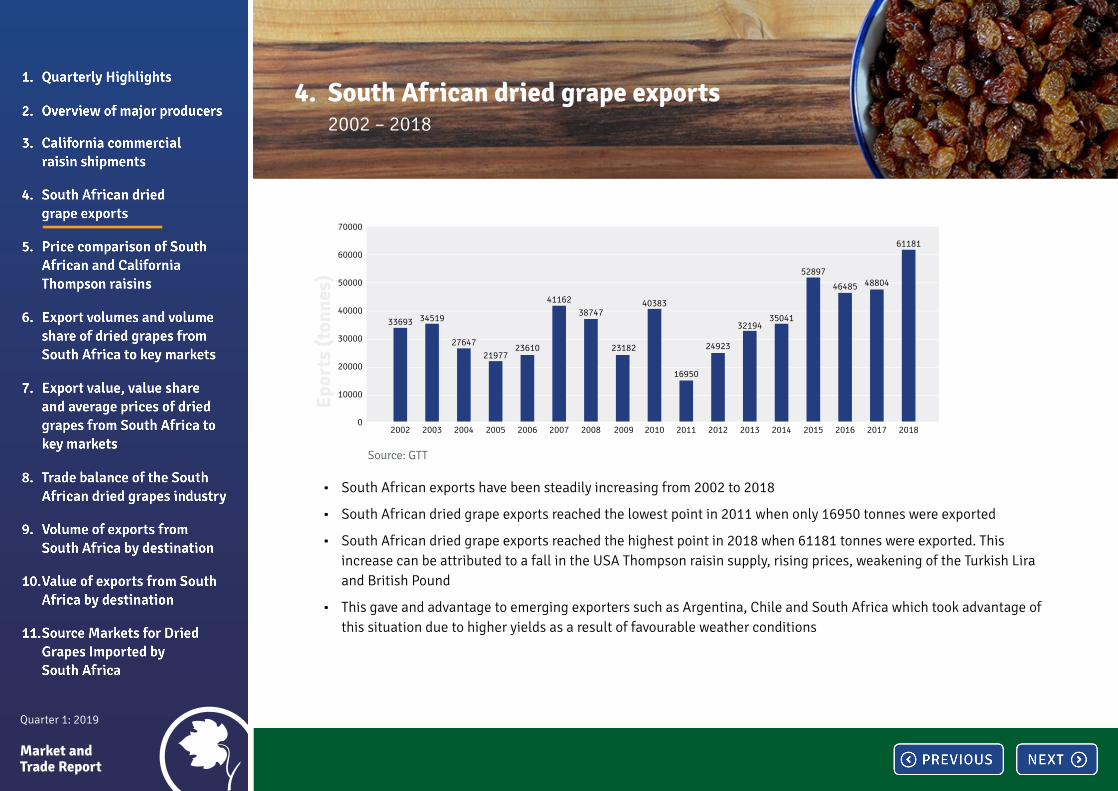
• South African exports have been steadily increasing from 2002 to 2018
• South African dried grape exports reached the lowest point in 2011 when only 16950 tonnes were exported
• South African dried grape exports reached the highest point in 2018 when 61181 tonnes were exported. This increase can be attributed to a fall in the USA Thompson raisin supply, rising prices, weakening of the Turkish Lira and British Pound
• This gave and advantage to emerging exporters such as Argentina, Chile and South Africa which took advantage of this situation due to higher yields as a result of favourable weather conditions
Source: GTT
4. South African dried grape exports 2002 – 2018

Quarter 1: 2019 Market and Trade Report
5. Price comparison of South African and California Thompson raisins
Source: GTT
• The first quarter in 2019 was marked by a decrease in the price of California Thompsons from USD3.50/kg in January 2019 to USD3.36/kg in March 2019
• The decrease in the price of California Thompsons has been observed since August 2018
• The export price of South African Thompsons rose from USD2.48/kg in January 2019 to USD2.73/kg in March 2019
• The price of South African Thompsons in February and March 2019 has been the highest since January 2018
4
3,5
3
2,5
2
1,5
Jan-
2018
Feb-
2018
Mar
-201
8
Apr
-201
8
May
-201
8
Jun-
2018
Jul-
2018
Aug
-201
8
Sep-
2018
Oct
-201
8
Nov
-201
8
Dec
-201
8
Jan-
2019
Feb-
2019
Mar
-201
9
South Africa USA
Expo
rt P
rice
(USD
/kg)

Quarter 1: 2019 Market and Trade Report
2018-Q1 2019-Q1 Volume share
ImportersExported quantity,
TonnesExported quantity,
Tonnesy-o-y
growth2018-Q1 2019-Q1
World 11161 9114 -18%
Germany 2357 2475 5% 21% 27%
Algeria 1781 2206 24% 16% 24%
United States of America 907 575 -37% 8% 6%
France 532 519 -2% 5% 6%
Netherlands 968 510 -47% 9% 6%
Canada 897 446 -50% 8% 5%
United Kingdom 888 416 -53% 8% 5%
Denmark 241 362 50% 2% 4%
United Arab Emirates 290 238 -18% 3% 3%
Belgium 206 238 16% 2% 3%
China 214 105 -51% 2% 1%
Source: ITC Trademap
6. Export volumes and volume share of dried grapes from South Africa to key markets (Q1 2018 and Q1 2019)
PAGE
Quarter 1: 2019 Market and Trade Report
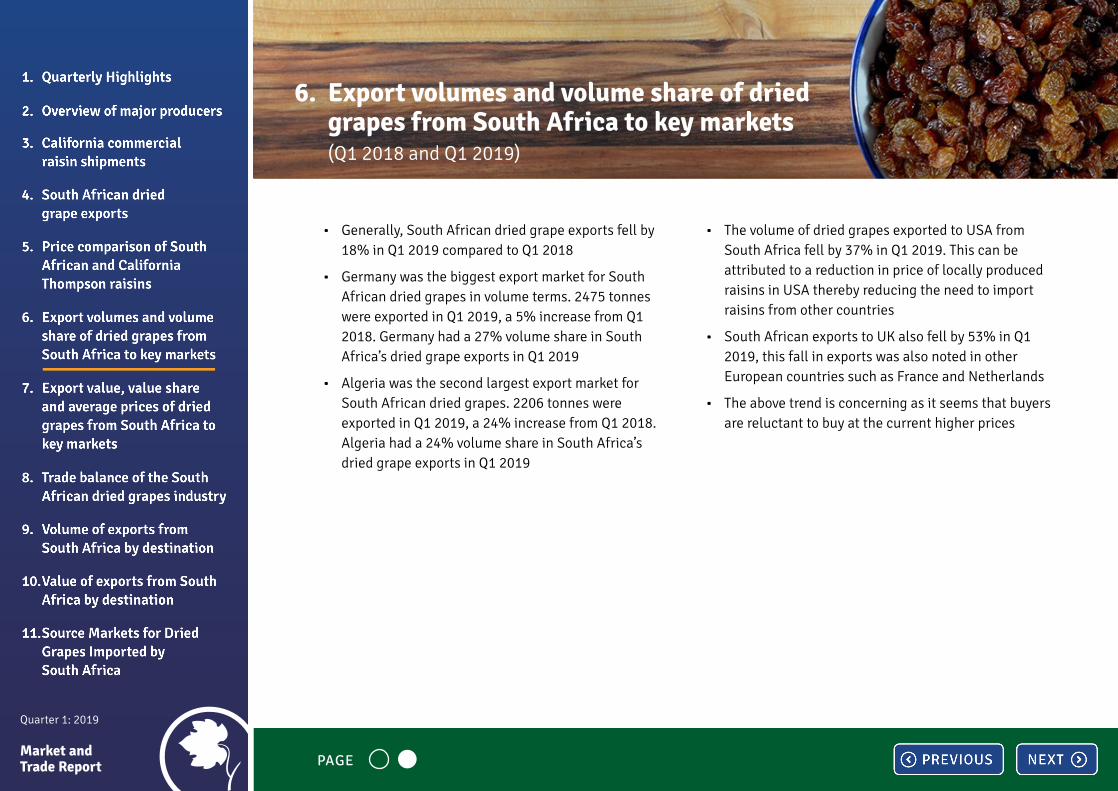
• Generally, South African dried grape exports fell by 18% in Q1 2019 compared to Q1 2018
• Germany was the biggest export market for South African dried grapes in volume terms. 2475 tonnes were exported in Q1 2019, a 5% increase from Q1 2018. Germany had a 27% volume share in South Africa’s dried grape exports in Q1 2019
• Algeria was the second largest export market for South African dried grapes. 2206 tonnes were exported in Q1 2019, a 24% increase from Q1 2018. Algeria had a 24% volume share in South Africa’s dried grape exports in Q1 2019
• The volume of dried grapes exported to USA from South Africa fell by 37% in Q1 2019. This can be attributed to a reduction in price of locally produced raisins in USA thereby reducing the need to import raisins from other countries
• South African exports to UK also fell by 53% in Q1 2019, this fall in exports was also noted in other European countries such as France and Netherlands
• The above trend is concerning as it seems that buyers are reluctant to buy at the current higher prices
6. Export volumes and volume share of dried grapes from South Africa to key markets (Q1 2018 and Q1 2019)
PAGE

Quarter 1: 2019 Market and Trade Report
USD’000 Volume share Average price USD/kg
ImportersExported
value 2018-Q1
Exported value
2019-Q1
y-o-y growth
2018-Q1 2019-Q1 2018-Q1 2019-Q1y-o-y
growth
World 26036 24663
Germany 4740 6884 45% 18% 28% 2.01 2.78 38%
Algeria 4795 5718 19% 18% 23% 2.69 2.59 -4%
France 1498 1406 -6% 6% 6% 2.81 2.71 -4%
Denmark 744 1313 76% 3% 5% 3.08 3.63 18%
Canada 1759 1212 -31% 7% 5% 1.96 2.71 38%
USA 1518 1187 -22% 6% 5% 1.67 2.06 23%
Netherlands 2435 1160 -52% 9% 5% 2.52 2.27 -10%
UK 1997 1089 -45% 8% 4% 2.25 2.62 16%
Source: ITC Trademap
7. Export value, value share and average prices of dried grapes from South Africa to key markets (Q1 2018 and Q1 2019)
PAGE
Quarter 1: 2019 Market and Trade Report
USD’000 Volume share Average price USD/kg
ImportersExported
value 2018-Q1
Exported value
2019-Q1
y-o-y growth
2018-Q1 2019-Q1 2018-Q1 2019-Q1y-o-y
growth
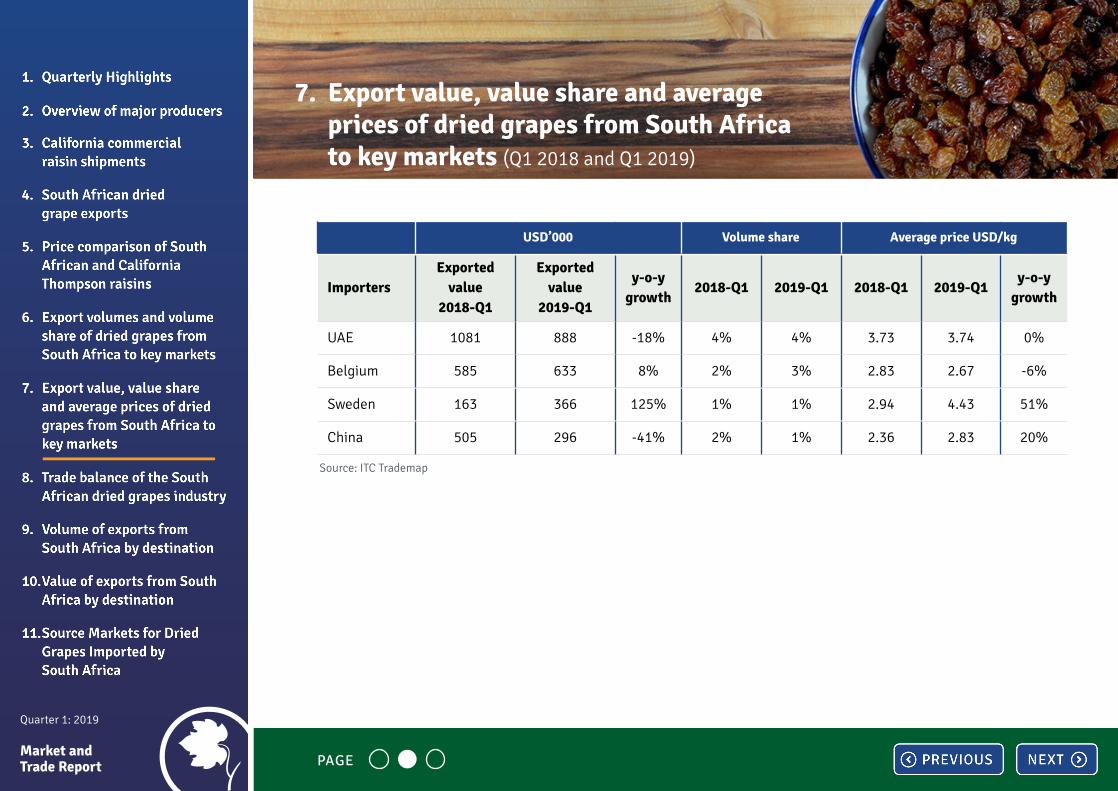
UAE 1081 888 -18% 4% 4% 3.73 3.74 0%
Belgium 585 633 8% 2% 3% 2.83 2.67 -6%
Sweden 163 366 125% 1% 1% 2.94 4.43 51%
China 505 296 -41% 2% 1% 2.36 2.83 20%
Source: ITC Trademap
7. Export value, value share and average prices of dried grapes from South Africa to key markets (Q1 2018 and Q1 2019)
PAGE
Quarter 1: 2019 Market and Trade Report
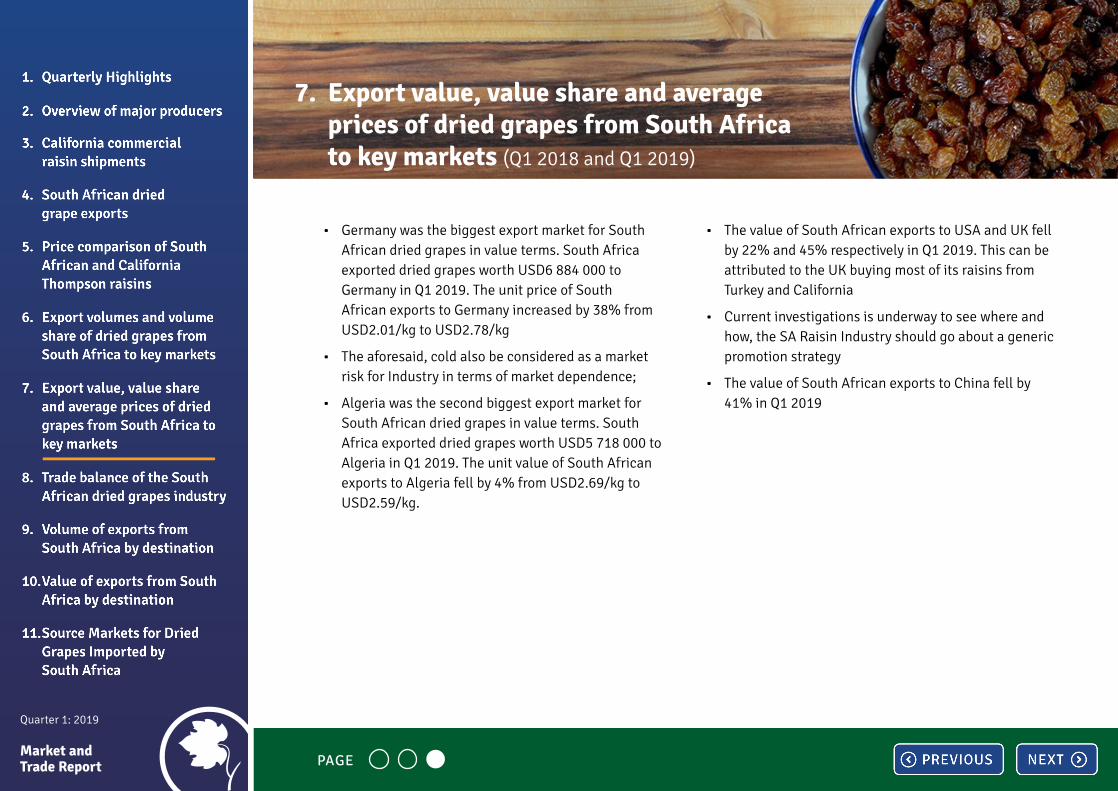
• Germany was the biggest export market for South African dried grapes in value terms. South Africa exported dried grapes worth USD6 884 000 to Germany in Q1 2019. The unit price of South African exports to Germany increased by 38% from USD2.01/kg to USD2.78/kg
• The aforesaid, cold also be considered as a market risk for Industry in terms of market dependence;
• Algeria was the second biggest export market for South African dried grapes in value terms. South Africa exported dried grapes worth USD5 718 000 to Algeria in Q1 2019. The unit value of South African exports to Algeria fell by 4% from USD2.69/kg to USD2.59/kg.
• The value of South African exports to USA and UK fell by 22% and 45% respectively in Q1 2019. This can be attributed to the UK buying most of its raisins from Turkey and California
• Current investigations is underway to see where and how, the SA Raisin Industry should go about a generic promotion strategy
• The value of South African exports to China fell by 41% in Q1 2019
7. Export value, value share and average prices of dried grapes from South Africa to key markets (Q1 2018 and Q1 2019)
PAGE

Quarter 1: 2019 Market and Trade Report
8. Trade balance of the South African dried grapes industry Q1 2013 – Q1 2019 (quantity and value)
Q1 2013 Q1 2014 Q1 2015 Q1 2016 Q1 2017 Q1 2018 Q1 2019
Imports tons 140 148 153 340 514 581 716
Exports tons 9070 9589 9231 9604 8897 11161 9113
• There was a 21% decrease in the trade balance volume in South African dried grapes between Q1 2018 and Q1 2019
• The trade balance in Q1 2018 was 10580 tons compared to 8397 tons in Q1 2019
14000
12000
10000
8000
6000
4000
2000
0
180%
160%
140%
120%
100%
80%
60%
40%
20%
0%
-20%
-40%Q1 2013
2919
Q1 2014
7345
Q1 2015
9078
Q1 2016
9264
Q1 2017
8383
Q1 2018
10580
Trad
e ba
lanc
e (t
onne
s)
y-o-
y gr
owth
Trade Balance y-o-y growth
Q1 2019
8397
-10%
26%
-21%
2%
24%
152%
Source: ITC Trademap
PAGE
Quarter 1: 2019 Market and Trade Report
Source: ITC Trademap
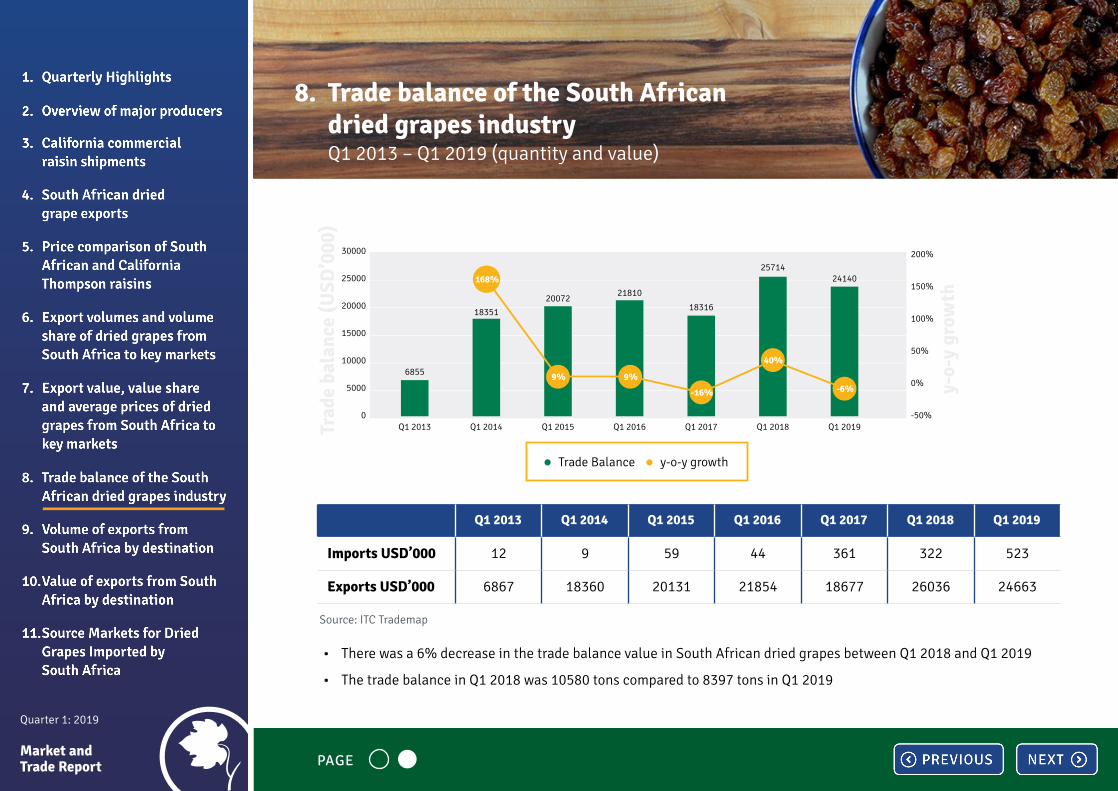
• There was a 6% decrease in the trade balance value in South African dried grapes between Q1 2018 and Q1 2019
• The trade balance in Q1 2018 was 10580 tons compared to 8397 tons in Q1 2019
Q1 2013 Q1 2014 Q1 2015 Q1 2016 Q1 2017 Q1 2018 Q1 2019
Imports USD’000 12 9 59 44 361 322 523
Exports USD’000 6867 18360 20131 21854 18677 26036 24663
30000
25000
20000
15000
10000
5000
0
200%
150%
100%
50%
0%
-50%
50%
Trad
e ba
lanc
e (U
SD’0
00)
y-o-
y gr
owth
Trade Balance y-o-y growth
Q1 2013
6855
Q1 2014
18351
Q1 2015
20072
Q1 2016
21810
Q1 2017
18316
Q1 2018
25714
Q1 2019
24140
9% 9%
-16%
40%
-6%
168%
8. Trade balance of the South African dried grapes industry Q1 2013 – Q1 2019 (quantity and value)
PAGE

Quarter 1: 2019 Market and Trade Report
9. Volume of exports from South Africa by destination Q1 2015-Q1 2019
10000
9000
8000
7000
6000
5000
4000
3000
2000
1000
02015 Q1 2016 Q1 2017 Q1 2018 Q1 2019 Q1
Tonn
es
Germany
United States of America
Canada
Algeria
Netherlands
United Kingdom
France
Denmark
China
United Arab Emirates
Belgium
Source: ITC Trademap
PAGE
Quarter 1: 2019 Market and Trade Report
9. Volume of exports from South Africa by destination Q1 2015-Q1 2019
12000
10000
8000
6000
4000
2000
0
30000
25000
20000
15000
10000
5000
0Q1 2015 Q1 2016 Q1 2017 Q1 2018 Q1 2019
2185420131
18677
26036
24663Q
uant
ity
(ton
nes)
Valu
e (U
SD’0
00)
7182
11161
91148897
9604
Source: ITC Trademap
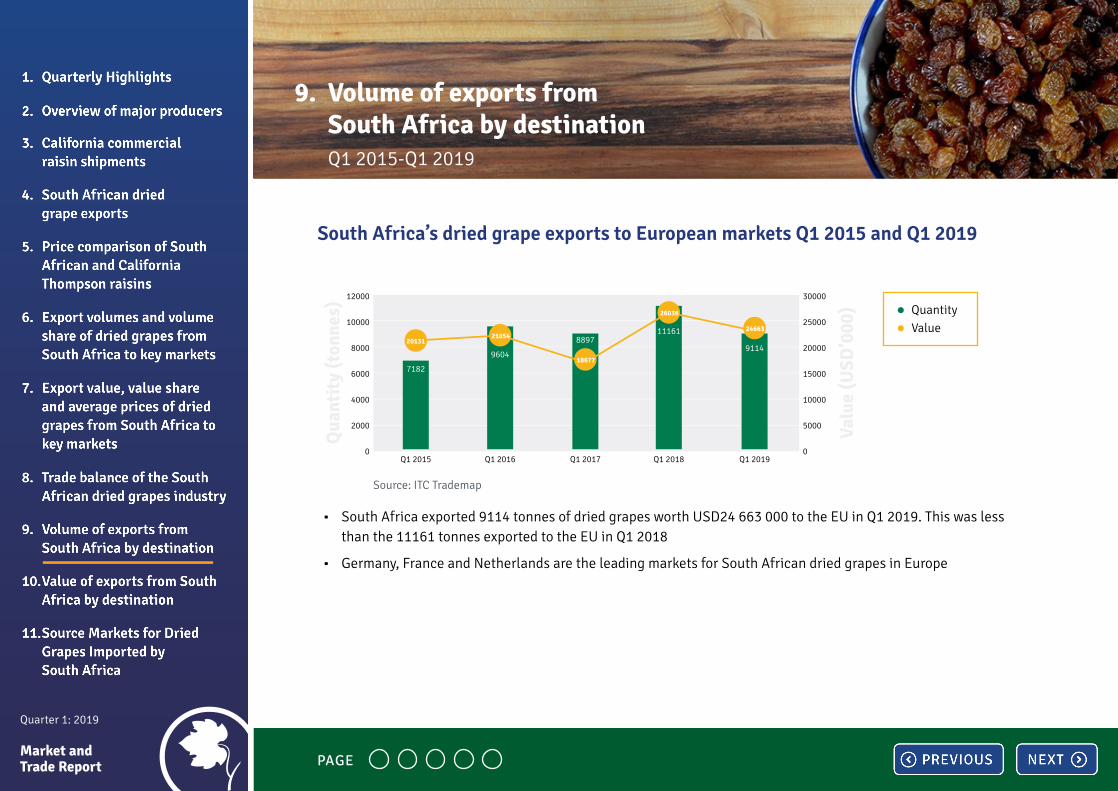
• South Africa exported 9114 tonnes of dried grapes worth USD24 663 000 to the EU in Q1 2019. This was less than the 11161 tonnes exported to the EU in Q1 2018
• Germany, France and Netherlands are the leading markets for South African dried grapes in Europe
South Africa’s dried grape exports to European markets Q1 2015 and Q1 2019
PAGE
Quarter 1: 2019 Market and Trade Report
9. Volume of exports from South Africa by destination Q1 2015-Q1 2019
Qua
ntit
y (t
onne
s)
Valu
e (U
SD’0
00)
4500
4000
3500
3000
2500
2000
1500
1000
500
0
9000
8000
7000
6000
5000
4000
3000
2000
1000
0Q1 2015 Q1 2016 Q1 2017 Q1 2018 Q1 2019
6199
8377
3120
5319
6234
3882
2006
2412
1862
1998
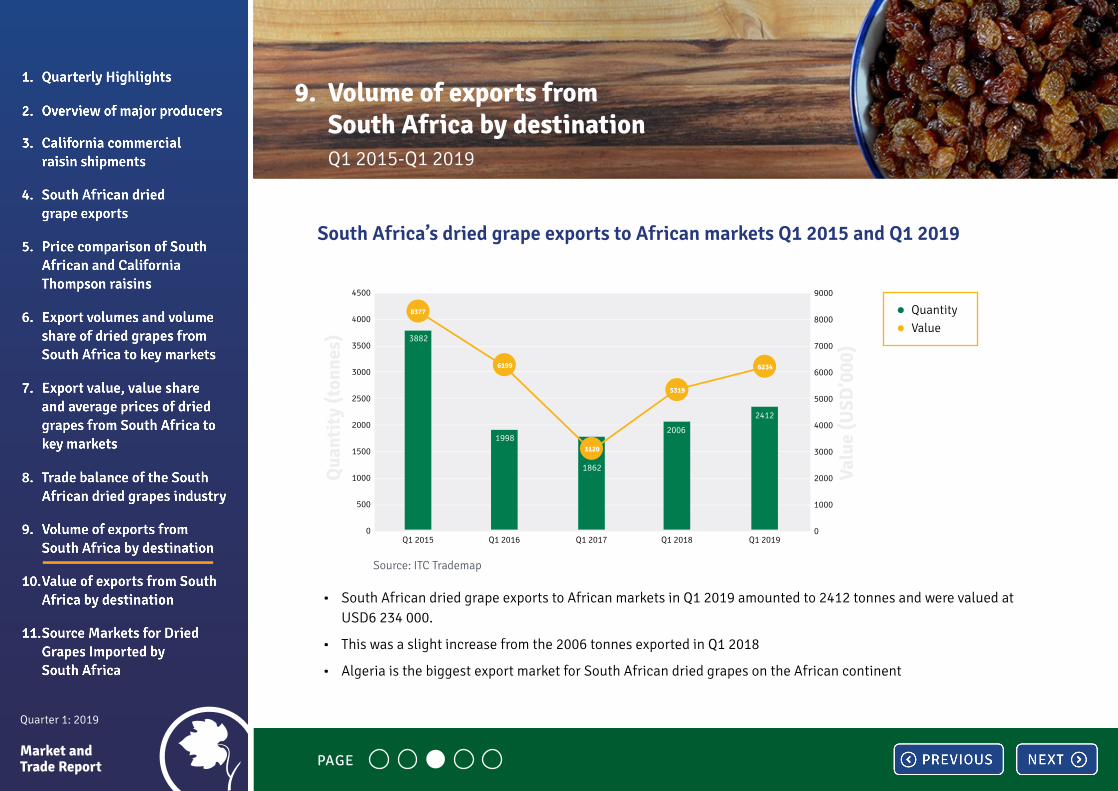
• South African dried grape exports to African markets in Q1 2019 amounted to 2412 tonnes and were valued at USD6 234 000.
• This was a slight increase from the 2006 tonnes exported in Q1 2018
• Algeria is the biggest export market for South African dried grapes on the African continent
South Africa’s dried grape exports to African markets Q1 2015 and Q1 2019
Source: ITC Trademap
PAGE
Quarter 1: 2019 Market and Trade Report
9. Volume of exports from South Africa by destination Q1 2015-Q1 2019
Qua
ntit
y (t
onne
s)
Valu
e (U
SD’0
00)
900
800
700
600
500
400
300
200
100
0
2500
2000
1500
1000
500
0Q1 2015 Q1 2016 Q1 2017 Q1 2018 Q1 2019
646
1058 1001
2396
1679
57
873
514
382310
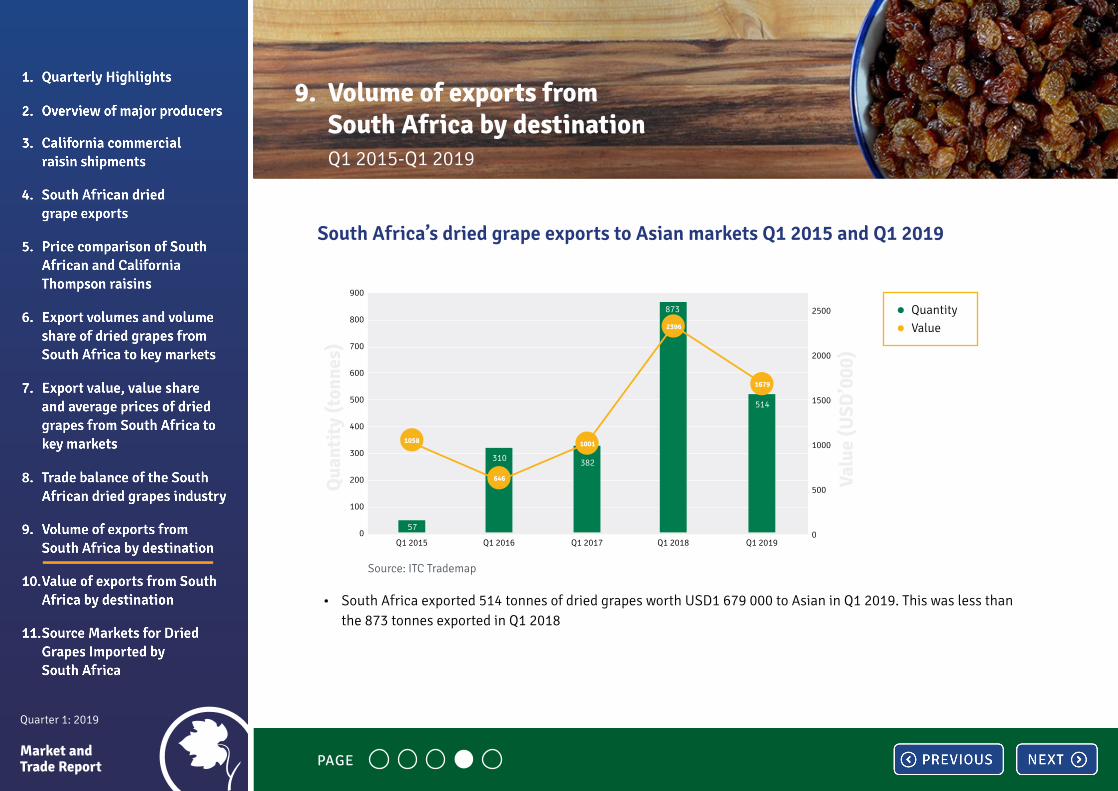
• South Africa exported 514 tonnes of dried grapes worth USD1 679 000 to Asian in Q1 2019. This was less than the 873 tonnes exported in Q1 2018
South Africa’s dried grape exports to Asian markets Q1 2015 and Q1 2019
Source: ITC Trademap
PAGE
Quarter 1: 2019 Market and Trade Report
9. Volume of exports from South Africa by destination Q1 2015-Q1 2019
Qua
ntit
y (t
onne
s)
Valu
e (U
SD’0
00)
2000
1800
1600
1400
1200
1000
800
600
400
200
0
3500
3000
2500
2000
1500
1000
500
0Q1 2015 Q1 2016 Q1 2017 Q1 2018 Q1 2019
2670
1680
1956
3277
2517
869
1805
1122
953
1436
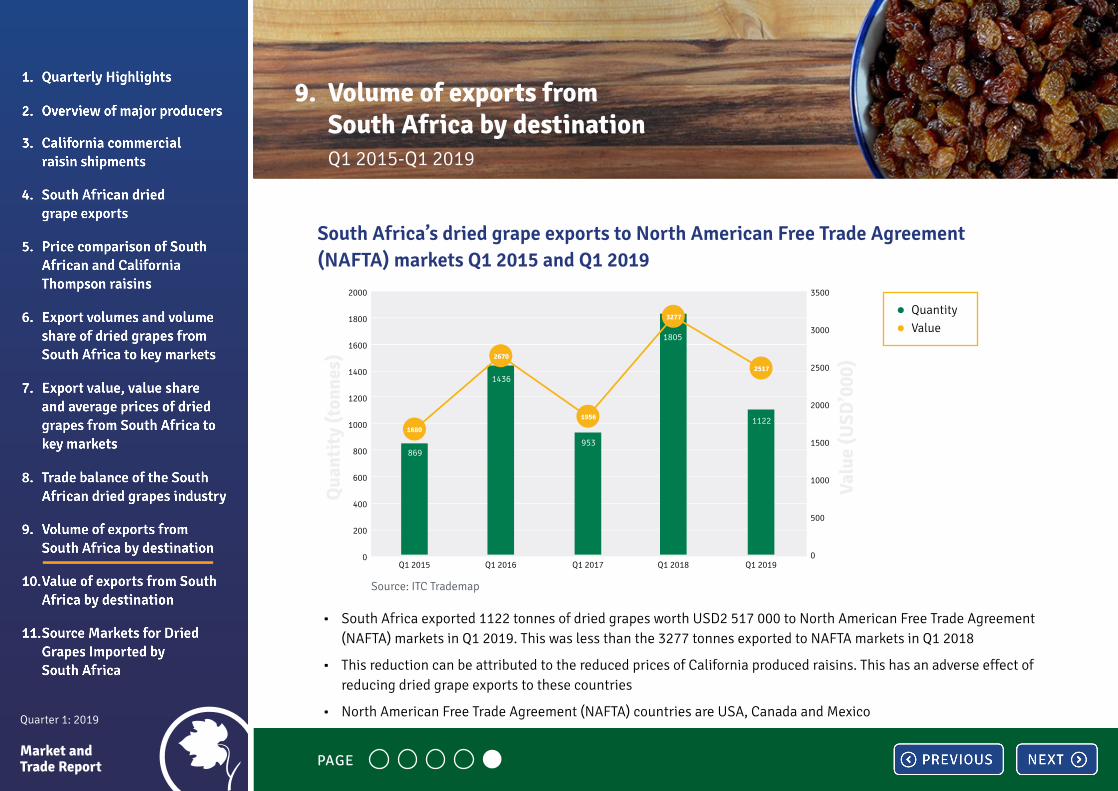
• South Africa exported 1122 tonnes of dried grapes worth USD2 517 000 to North American Free Trade Agreement (NAFTA) markets in Q1 2019. This was less than the 3277 tonnes exported to NAFTA markets in Q1 2018
• This reduction can be attributed to the reduced prices of California produced raisins. This has an adverse effect of reducing dried grape exports to these countries
• North American Free Trade Agreement (NAFTA) countries are USA, Canada and Mexico
South Africa’s dried grape exports to North American Free Trade Agreement (NAFTA) markets Q1 2015 and Q1 2019
Source: ITC Trademap
PAGE

Quarter 1: 2019 Market and Trade Report
10. Value of exports from South Africa by destination Q1 2015-Q1 2019
30000
25000
20000
15000
10000
5000
02015 Q1 2016 Q1 2017 Q1 2018 Q1 2019 Q1
USD
’000
Germany
United States of America
Canada
Algeria
Netherlands
United Kingdom
France
Denmark
Sweden
United Arab Emirates
Belgium
Spaim
• Germany was the biggest export market for South African dried grapes both in terms of value and quantity in Q1 2019
• Algeria is also a big export market for South African raisins
• Other leading export markets are Denmark, Canada, USA, UK, Netherlands and Belgium
Source: ITC Trademap
Quarter 1: 2019 Market and Trade Report
11. Source Markets for Dried Grapes Imported by South Africa
USD
'000
600
500
400
300
200
100
02015 Q1 2016 Q1 2017 Q1 2018 Q1 2019 Q1
Turkey
Namibia
United States of America
United Arab Emirates
Uzbekistan
United Kingdom
Source: ITC Trademap
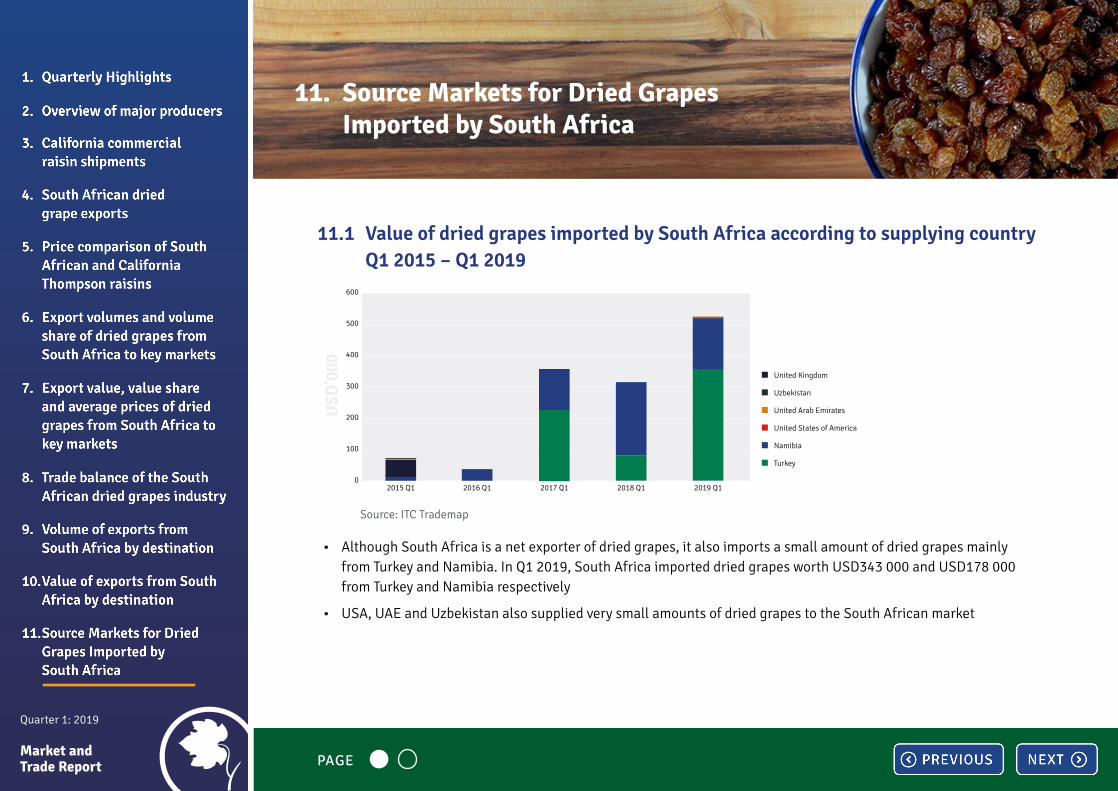
• Although South Africa is a net exporter of dried grapes, it also imports a small amount of dried grapes mainly from Turkey and Namibia. In Q1 2019, South Africa imported dried grapes worth USD343 000 and USD178 000 from Turkey and Namibia respectively
• USA, UAE and Uzbekistan also supplied very small amounts of dried grapes to the South African market
11.1 Value of dried grapes imported by South Africa according to supplying country Q1 2015 – Q1 2019
PAGE

Quarter 1: 2019 Market and Trade Report
11. Source Markets for Dried Grapes Imported by South Africa
• Namibia exported 554 tonnes of dried grapes to South Africa in Q1 2019
• Turkey exported 158 tonnes of dried grapes to South Africa in Q1 2019
• Turkish imports were less than Namibian imports but were more expensive, this shows that it is much cheaper for South Africa to import dried grapes from Namibia, possibly because of the close proximity.
11.2 Volume of dried grapes imported by South Africa according to supplying country Q1 2015 – Q1 2019
Kilo
gram
s
Area Nes
Namibia
80000
70000
60000
50000
40000
30000
20000
10000
02015 Q1 2016 Q1 2017 Q1 2018 Q1 2019 Q1
Turkey
United States of America
United Arab Emirates
Uzbekistan
United Kingdom
Source: ITC Trademap
PAGE