quantum leap beckons - mutual funds india · better distribution, ... amfi is dedicated to...
TRANSCRIPT

Quantum leap beckons India’s mutual funds industry is at another inflection point
June 2017

Analytical contacts
Jiju Vidyadharan
Senior Director, Funds & Fixed Income Research
Piyush Gupta
Associate Director, Funds & Fixed Income Research
Yatendra Chauhan
Associate Director, Funds & Fixed Income Research
Prahlad Salian
Manager, Funds & Fixed Income Research
Ashish Ravalia
Manager, Funds & Fixed Income Research
Parth Pandya
Senior Research Analyst, Funds & Fixed Income Research
For Feedback/Suggestions please write to: AMFI – [email protected] / CRISIL - [email protected]

Contents
Message from AMFI ........................................................................................................................... 4
Message from CRISIL ......................................................................................................................... 5
An evolving story ............................................................................................................................... 7
At historic highs ............................................................................................................................... 11
The inflection-point-triggers ........................................................................................................... 15
Getting the masses to SIP it ........................................................................................................................ 17
Pension money heralds a new dawn ............................................................................................................ 21
Technology critical to growth ...................................................................................................................... 23
Wealth creation, inclusion opportunity for all ............................................................................................. 26
Better distribution, awareness and investor servicing the propellants ....................................................... 37
Other industry trends ...................................................................................................................... 41
Industry tilted towards debt assets even as equity sees sharp rise ............................................................ 42
Preference for actively managed and open-ended funds............................................................................. 45
Industry split equally between individual and institutional investors .......................................................... 49
Mutual funds, the new stabilizing agent in the equity market .................................................................... 57
Balanced funds see high interest ................................................................................................................ 59
Geographic penetration of industry assets ................................................................................................. 63
Mutual funds’ share of household savings increasing ................................................................................. 65
Opportunity to invest in alternate investment avenues ............................................................................... 67
AMFI’s Investor Awareness Campaign : ‘Mutual Funds Sahi Hai’ – Making Mutual Funds a part of everyday
conversations ............................................................................................................................................... 69
Annexure ...................................................................................................................................................... 71

4
Message from AMFI
Association of Mutual Funds in India (AMFI) is a non-profit, trade association of the asset management
companies (AMCs) of all Mutual Funds registered with the regulator, Securities and Exchange Board of India
(SEBI). There are currently 42 mutual funds (including 2 infrastructure debt funds) in the country.
AMFI functions under the broad guidance of the Board of Directors which comprises of 15 directors from
various categories of mutual funds and operates on a co-operative model.
AMFI is dedicated to developing the Indian Mutual Fund industry on professional, healthy and ethical lines,
and to enhance and maintain standards in all areas in the best interest of investors and other stake holders.
Over the past 21 years since it was established, AMFI has evolved as a respectable trade body, owing to active
involvement of its members and has strived towards adopting uniform best practices across various areas,
such as disclosures, operations & risk management, valuation of securities, customer service and investor
protection and communication, in the best interest of the investors.
While the industry has been growing steadily in terms of funds under management, there’s a need to increase
a better awareness about mutual funds as a distinct and preferred asset class, so that the customer base
could expand significantly for a sustainable growth as the MF industry is poised to leapfrog to the next level.
This would require active participation of all stakeholders, including intermediaries.
The ‘Mutual Funds Sahi Hai’ campaign, an investor awareness outreach media campaign in different
languages initiated by AMFI recently under SEBI’s guidance, is one such effort to spread awareness about
mutual funds as a distinct asset class and dispel the myths associated with mutual funds.
This Fact Book has been compiled by AMFI & CRISIL jointly, and offers a bird’s eye view of the Indian mutual
fund industry.
We are grateful to CRISIL team for their help and support in preparing this Fact Book.
We hope the reader’s will find the Fact Book insightful and useful, and welcome any comments or suggestions
to improve the same in the coming years.
A. Balasubramanian
Chairman
Association of Mutual funds in India (AMFI)

5
Message from CRISIL
The Indian mutual funds industry has been instrumental in deepening financial inclusion by providing a
platform for retail investors to participate in India’s growth story. Investors today can pick and choose mutual
funds easily at lower costs no matter where they are.
The industry has grown more than three times in the past five years in terms of depth and breadth of coverage.
Two standout aspects of this surge, captured well in this Fact Book, are
1. How retail investor folios, which have been declining since the Global Financial Crisis, have rebounded
to reach a record 52.31 million; and,
2. How mutual funds have emerged as the new stabilising force in the equity market, as reflected in the
increasing share of equity mutual funds in the total equity market cap from 2.9% to 5.5% in past three
years ended March 31, 2017.
Improving investor awareness and product choice, consistent long-term returns, tax benefits, open
architecture distribution, strong execution, good customer service and better turnaround times over the years
have contributed to this growth.
The stage is now set for another quantum leap, with favourable structural factors such as far greater
participation of individual investors through systematic investment plans (nearly 50% of net equity flows last
fiscal), influx of pension money and growing realisation among the investing public that mutual funds are an
ideal wealth creation opportunity.
We see growing penetration in Tier II and Tier III, or the B15 cities, and retirement-oriented funds and solutions
as the next catalysts of sustained growth. B15 cities have already witnessed an impressive 30% compound
annual growth in assets under management (AUM) over the past 3 years, while retirement money has
catapulted the AUMs of exchange traded funds 7 times since August 2015.
Continued focus on investors by AMCs and distributors, and the adoption of technology will be the key to
conquer hinterland. In addition to traditional models of distribution through banks, independent financial
advisors, and broker dealers, emergence of platforms and online channels will be making a difference to the
industry's reach.
Ashu Suyash
MD & CEO
CRISIL Ltd.

6
True to its mandate of making markets function better, CRISIL has facilitated growth of the mutual fund
industry through a number of investor education initiatives, and innovative analytics and solutions. For
instance, the CRISIL Mutual Fund Ranking is a well-accepted performance evaluation standard for investment
decisions. CRISIL has also contributed copious amount of research, benchmarks and indices.
Going forward, the industry has to find more innovative ways to spread financial literacy and improve investor
services at ever-lower costs to encourage retail participation. On their part, investors could choose funds
across equity and debt to derive maximum value.
I hope this report by CRISIL and AMFI will be useful to all stakeholders – AMCs, intermediaries and investors
alike, and will give them unique insights into an ever-evolving landscape.

7
An evolving story

8

9

10

11
At historic highs

12
At historic highs
The mutual fund industry has come a long way from its humble beginnings in
1963, when the Unit Trust of India was formed. The past couple of decades have
seen it gather pace, with assets under management (AUM) soaring past the Rs 19
trillion mark, marking an impressive 18% compound annual growth since the turn of
the century.
The surge in assets has been backed by robust inflows and mark-to-market (MTM) gains on
securities held.
The past five fiscals have been especially positive for the industry. The industry has witnessed
net inflows in all these years, with fiscal 2017 attracting the maximum at Rs 3.43 trillion.
The industry has also evolved to adopt global best practices with the end investor in mind. Some of the
key developments here include removal of entry load, allocating a portion of TER for investor education
and penetration to the hinterland, introduction of direct plans and adaptation of technology to ease the
overall investment process.
Mutual fund penetration data as of December 2016 (data pertains to open-ended mutual funds)
Data pertains to month-end AUM as of March; AUM growth pertains to period ended March 2017
Source: AMFI, ICI, IMF, CRISIL Research
0.00
3.00
6.00
9.00
12.00
15.00
18.00
21.00
FY
00
FY
01
FY
02
FY
03
FY
04
FY
05
FY
06
FY
07
FY
08
FY
09
FY
10
FY
11
FY
12
FY
13
FY
14
FY
15
FY
16
FY
17
AU
M (
Rs
tri
llio
n)
Mutual fund AUM trend24% CAGR
10
2%
76
%
65
%
59
%
57
%
55
%
54
%
50
%
30
%
26
%
11
%
10
%
US
Fra
nc
e
Ca
na
da
Bra
zil
UK
Ge
rma
ny
Wo
rld
So
uth
…
Ja
pa
n
Ko
rea
Ch
ina
Ind
ia
AU
M a
s %
of
GD
P
Mutual fund penetration
Industry penetration low at 10% compared with global average of 54%.
Variables in place for the industry to take a quantum leap
78
42 4
84
32 5
42
94
1
1,5
38
-28
3
83
1
-49
4
-22
0
76
5
54
1 1,0
33
1,3
42
3,4
30
-2000
-1000
0
1000
2000
3000
4000
FY
02
FY
03
FY
04
FY
05
FY
06
FY
07
FY
08
FY
09
FY
10
FY
11
FY
12
FY
13
FY
14
FY
15
FY
16
FY
17
Ne
tflo
ws
(R
s b
illi
on
) MF industry flows
Industry AUM up 24% CAGR
in last five years led by
inflows of Rs 7 trillion
At historic highs

13
Long way to go, but the course is set
Despite the growth in assets, India accounts for
less than 1% of the global mutual fund industry.
Also, mutual fund penetration, as measured by
AUM to GDP ratio, is an unimpressive 10%
compared with the global average of 54%.
But the stage seems set for a quantum leap.
Factors working this time around are structural,
which include growing participation of retail
investors through systematic investment plans or
SIPs, influx of pension money, adoption of
technology by the players and a growing realisation
among the investing public that mutual funds are
an ideal wealth creation opportunity. If anything,
the industry needs to focus more on financial
awareness, investor servicing and a stronger
impetus on intermediaries for sustainable growth.

14

15
The inflection-point-triggers

16

17
Getting the masses to SIP it
The surge in industry assets has been backed by a resurgence in mutual
fund penetration. Retail investor folios, on a decline in the aftermath of the
financial crisis, have reversed course in the past three fiscals and today stand at a
whopping 52.31 million.
Retail investors back with a bang
Source : AMFI
Hearteningly, the asset growth is coming from both
top 15 (T15) and beyond top 15 (B15) cities. In fact,
B15 cities are witnessing higher growth rates.
What’s more, a large proportion of the inflows is in
the form of sticky long-term money, coming
through the SIP route that entails regular
investment in the scheme chosen.
1. The B15 cities have seen faster growth in
assets, at 30% compound annual growth rate
(CAGR) in the past three years ended March
2017, compared with T15 cities (27%). Further,
individual investors’ (retail + HNIs1) assets
1 HNIs (high net worth individuals), defined as individuals
investing Rs 5 lakh or more
have witnessed higher growth in B15 cities at
35% compared with 28% for T15 cities. The
increase in B15 investor base and assets could
be an outcome of SEBI’s move to incentivise
fund houses for garnering assets from the
hinterland, by allowing them to charge
additional expense ratio up to 30 basis points
(bps) on daily net assets for inflows beyond T15
cities.
Getting the masses to SIP it

18
Data pertains to monthly average AUM; composition of T15 and B15 AUM as of March 2017
Source: AMFI

19
Mutual funds currently have about 14 million SIP
accounts. For the record, the industry collected Rs
439.21 billion through SIPs in fiscal 2017,
equivalent to almost 50% of the net flows in equity
funds for the year.
SIP folios and contributions trending north
Source: AMFI
SIP brings in discipline to investments, reduces associated market volatility
The rise in the SIP investment recently has been
backed by the fundamental advantage of SIPs, i.e.
adding discipline to investments. Going through
the SIP route helps even out the volatility, too. This
is because of a phenomenon called rupee-cost
averaging, or the fact that one gets to buy more
units in a falling market, to compensate for the
fewer units bought on highs. This holds for both
equity and debt schemes.
0.00
2.00
4.00
6.00
8.00
10.00
12.00
14.00
16.00
18.00
20.00
0
5
10
15
20
25
30
35
40
45
50
Ap
r-1
6
Ma
y-1
6
Jun
-16
Jul-
16
Au
g-1
6
Se
p-1
6
Oct
-16
No
v-1
6
De
c-1
6
Jan
-17
Feb
-17
Ma
r-1
7
No
. of
SIP
acc
ou
nts
(in
mil
lio
n)
SIP
co
ntr
ibu
tio
n (
Rs
bil
lio
n)
SIP Contribution No. of SIP Accounts (RHS)

20
SIP performance of various categories
Equity
Hybrid Debt
Money market
CRISIL-AMFI Fund Performance Indices are weighted average index of funds ranked under respective category in CRISIL Mutual Fund
Ranking
Please refer to annexure for the detailed definitions of CRISIL-AMFI indices
Data as on March 31, 2017
Source: CRISIL Research
0.00%
10.00%
20.00%
30.00%
3 years 5 years 7 years 10 years
CRISIL – AMFI Large Cap Fund Performance Index CRISIL – AMFI Small & Midcap Fund Performance Index
CRISIL – AMFI Diversified Equity Fund Performance Index CRISIL – AMFI ELSS Fund Performance Index
0.00%
5.00%
10.00%
15.00%
20.00%
3 years 5 years 7 years
CRISIL – AMFI Balance Fund Performance Index
CRISIL – AMFI MIP Fund Performance Index
0.00%
5.00%
10.00%
15.00%
3 years 5 years 7 years
CRISIL – AMFI Income Fund Performance Index
CRISIL – AMFI Gilt Fund Performance Index
CRISIL – AMFI Short Term Debt Fund Performance Index
0.00%
2.00%
4.00%
6.00%
8.00%
10.00%
1 year 3 years 5 years
CRISIL – AMFI Ultra Short Fund Performance Index
CRISIL – AMFI Liquid Fund Performance Index

21
Pension money heralds a new dawn
Globally, mutual funds are a preferred investment product for retirement
planning. In the US, for instance, defined contribution plans and individual
retirement accounts added up to $7.6 trillion, or 46% of total mutual fund
assets, as of December 2016.
Retirement planning has a huge potential for getting tapped in India, too, and can
drastically improve mutual fund penetration if channelled through the industry.
The US and Australia – where retirement funds invest through mutual funds – have an
mutual fund AUM to GDP ratio of about 102% and 128%, respectively. Among the emerging
economies, Chile is a stellar example of pension funds leading to financial market growth.
The country has privately managed pension funds (similar to the 401k of the US) called
administradoras de fondos de pensiones.
Mutual fund AUM to GDP ratio (%): India versus others
Source: ICI, IMF, CRISIL Research
Till recently, the Indian mutual fund industry was
largely deprived of retirement money, which is
long-term in nature. But things have started
changing with the Employees’ Provident Fund
Organisation (EPFO), the biggest retirement
manager in the country allocating a portion of its
incremental inflows into equity ETFs.
Investing in equity aligns with the long-term
investment horizons associated with retirement
planning, and helps boost the vesting corpus. EPFO
0%
2%
4%
6%
8%
10%
12%
0%
20%
40%
60%
80%
100%
120%
140%
2008 2009 2010 2011 2012 2013 2014 2015 2016
AU
M t
o G
DP
ra
tio
(%
)-In
dia
AU
M t
o G
DP
ra
tio
(%
)
Brazil Chile China Canada
United States United Kingdom Australia India (RHS)
Pension money heralds a new dawn

22
started with allocating 5% of its incremental inflow
of around Rs 1 lakh crore in FY16 to equities,
before increasing this to 10% in FY17, and now
plans to use up its full quota allowed, which is
15%.
This has boosted the assets of equity ETFs by
almost seven times since August 2015 (when EPFO
started its investment) to Rs 429 billion as of
March 2017.
Equity ETF assets have rocketed
Data pertains to month-end AUM
Equity ETFs represented by Other ETFs
Source: AMFI
Though these numbers are a small part of the
industry assets today, it is an encouraging start
and should aid growth by bringing in long-term
money. Further, information that the biggest
retirement manager in the country is investing in
mutual funds would also increase awareness about
the benefits of investing through mutual funds for
retirement planning.
-100
0
100
200
300
400
500
Ma
r-0
8
Ma
r-0
9
Ma
r-1
0
Ma
r-1
1
Ma
r-1
2
Ma
r-1
3
Ma
r-1
4
Ma
r-1
5
Ma
r-1
6
Ma
r-1
7
Rs
bil
lio
n
Netflows Equity ETFs assets

23
Technology critical to growth
Technology is expected to play a pivotal role in taking the industry to the
next level, by helping surmount the challenges stemming from India’s vast
geography and the fact that physical footprints in smaller locations are
commercially unviable. With user-end facilitations, technology can allow investors
in far-flung reaches to pick and invest in mutual funds more easily, leading to a
reduction in intermediation costs, which could be passed on to them.
Technology also gels well with India’s demographic structure, where the median age is less
than 30 years. Also termed as millennials, this youth segment can be the biggest opportunity
for the mutual fund industry as they are tech savvy and are at ease with using technology to
conduct the entire gamut of financial transactions.
To be sure, technology has made inroads into almost all spheres of our lives today, with most
necessities available at the touch of a button on a smart phone or a computer. India has about 1.17
billion2 mobile users, of which 389 million3 use the mobile to access the internet. The total number of
internet users in the country stands at 432 million4 .The recent push by the government towards a digitally
empowered economy adds to the allure.
The industry has realised the virtues of using technology to make a strong case for a share of the household
financial savings pie. The proliferation of online platforms, rise of robo advisory firms, access to e-wallets and
prospects of investing from e-commerce platforms all point to this. Meanwhile, the growing popularity of
social media/ messaging services such as Facebook and Whatsapp has led some mutual fund companies to
use these for reaching out to investors and keeping them updated on their investments.
2 Data as of April 2017, Source: TRAI 3 Data as of December 2016, Source: IAMAI and IMRB 4 Data as of December 2016, Source: IAMAI and IMRB
Technology critical to growth

24
Online platforms
Following are routes / modes currently available to
investors for online investment in mutual funds,
both as web and mobile-enabled (app) platforms:
1. Mutual Fund websites: Mutual Funds have
enabled online investment on their respective
websites, which allow investors to seamlessly
invest in/redeem/switch their mutual fund
units in the schemes of the respective fund
house.
2. RTA platforms: The Registrars & Transfer
Agents (RTAs) of mutual funds (such as CAMS
and KARVY) have also enabled online
investment in mutual fund units and tracking
facility thereof on their respective websites in
respect of the mutual funds serviced by them.
3. MF Utility (MFU): MFU is a technological
platform promoted by the Indian Mutual Fund
Industry under the aegis of AMFI, as a non-
profit, shared infrastructure for investor &
distributor convenience, operational efficiency
and reduction in transaction processing cost of
the MF industry. The prime objective of MFU is
to consolidate all transactions received from
multiple sources and transmit the same to the
Registrars, bringing in operational efficiency by
reducing multiplicity and duplication of
activities. MFU portal operates as a
“Transaction Aggregating System” for the
Mutual Fund Industry as a whole. MFU is
established on a co-operative model, with all
participating AMCs being equal shareholders of
MFU. Being browser based utility, MFU
promotes industry level self-service for
investors/distributors/RIAs and provides
multiple modes of access and transaction
submission options. Investors and
distributors/RIAs can submit transactions
either online or physical and make physical and
e-payments.
MFU provides broad and neutral “Points of
Service” (POS) for enhanced coverage and
geographical reach, investors and
distributors/RIAs enjoy the convenience of
submitting transactions in a single place
irrespective of the Mutual Fund in which they
transact. This saves a lot of time, effort and
cost to the distributors/RIAs.
MFU is modelled on the lines of “Fundserv”
(http://www.fundserv.com), the Canadian
online eco-system, established in 1993 by and
for the Canadian investment industry, that
facilitates seamless fund transactions.
Similar collaborative efforts also found in other
overseas markets, such as “Fund Online Korea
(http://fundonlinekorea.com/eng/index.do)
and “FundRich” of Taiwan
(https://www.fundrich.com.tw/)
4. Stock Exchange platforms: One can also buy
mutual funds units through BSE - StAR MF and
NSE Mutual Fund Service System (NSE-MFSS).
These are primarily online order collection
systems provided by BSE and NSE to eligible
members for placing subscription or
redemption orders.
5. Online aggregators/ third-party platforms:
Portals of aggregators or distributors also
allow one to invest in schemes of multiple
mutual fund houses.
25
Robo advisory
Robo advisor is an automated programme that
dispenses financial planning advice to investors.
Instead of receiving recommendations from a
human financial advisor across a table, the
investor receives suggestions from a computer or a
smart phone. The companies that develop such
programs are called robo advisory firms.
While robo advisory firms have been in existence
since the start of the 21st century, with the world’s
largest financial market, the US, incubating the
first ones. In India, they have been around since
2009, and have seen steady growth in demand and
recognition. In addition to the advancement of
technology, the regulator’s move to lower
commission expenses is also pushing distributors
towards the category in a bid to reduce costs.
However, since the process is automated, the
solutions are readymade and may not quite
address all financial planning problems. Investors
may also want the human element in the final
product buying, especially since mutual funds are a
push product more than a pull product.
Access to e-wallets and instant redemption facility
Last year’s demonetisation move by the
government was a watershed moment for the
financial system in the country, and a bumper for
the e-wallet industry as adoption of the medium
jumped manifold. To convert the money available
with e-wallets, of around Rs 20,600 crore5 into
productive investments and ease access to the
mutual fund industry, SEBI has allowed investment
in mutual funds up to Rs 50,000 per financial year
via e-wallets.
5 Indian m-wallet market: Forecast 2022 conducted by
ASSOCHAM jointly with research firm RNCOS
However, fund houses need to ensure that an e-
wallet issuer is not offering any incentives as cash
back, directly or indirectly, for investing in mutual
fund schemes through it. The e-wallet's balance,
loaded through cash or debit card, or net banking,
can only be used for subscription to mutual fund
schemes.
While the current proportion of investment through
this route may be small, there is great potential
considering the penetration of e-wallets has
touched almost 200 million already. This
penetration, coupled with the ability to seamlessly
place an order, transfer money and piggyback on
the existing KYC verification through a single
window of either e-wallet or an e-tail website,
should help accelerate the penetration of mutual
funds. Meanwhile, another move of the regulator to
allow instant access facility for up to Rs 50,000 or
90% of the folio value, whichever is lower, in liquid
funds should also help. Access to mutual funds
through e-wallets, coupled with the instant access
facility, makes mutual funds a good alternative to
keeping money idle in bank accounts. Liquid funds
can emerge as a first touch point to on board
investors while also helping them derive higher
yield on their surplus cash. Global precedence of
such a move has been positive, as seen in China.
Online digital and mobile wallet players such as
Alibaba, WeChat and Baidu have money market
funds linked to them, thus enabling investors to
generate returns on their spare money.

26
Wealth creation, inclusion opportunity for all
Political stability at the Centre and some deft manoeuvring by the
government have seen India emerge as the fastest growing major economy,
despite real GDP growth based on the new series coming in at 7.1% last fiscal.
As per IMF estimates, the Indian economy is the sixth-largest after the US, China,
Japan, Germany and the UK, and slated to grow faster than most major economies for
at least five more years.
India is growing faster than most major economies
Source: International Monetary Fund (IMF) estimates
-6
-4
-2
0
2
4
6
8
10
12
2010 2011 2012 2013 2014 2015 2016 2017 2018 2019 2020 2021 2022
% c
ha
ng
e i
n G
DP
Brazil China India United Kingdom United States
Wealth creation, inclusion opportunity for all

27
As economic growth puts more money in the hands of
people, household savings are looking up, too. As per
data from the Ministry of Statistics and Programme
Implementation, gross financial savings have been on
a secular uptrend since fiscal 2012 and breached the
Rs 15 trillion mark in fiscal 2016.
With interest rates declining in sync with the Reserve
Bank of India’s (RBI’s) monetary easing stance, the
allure of traditional
investment avenues such as bank fixed deposits is
waning. For instance, the rate of interest offered by
SBI for a one-year fixed deposit is 6.90%6. On the
other hand, the equity markets – as represented by
the benchmark indices S&P BSE Sensex and Nifty 50
– are at record highs. A quest for higher yields is,
therefore, but natural, even for the most conservative,
FD-only investor.
Markets have rallied in the past five years to reach all-time highs
Total returns indices have been considered for Nifty 50 and S&P BSE SENSEX
Source: NSE, BSE, CRISIL Research
Mutual funds have emerged as a tool that allows all
types of investors, irrespective of risk profile and
return horizon, to participate in the financial markets
and benefit from India’s growth story. Here’s how.
6 https://www.sbi.co.in/portal/web/interest-rates/domestic-term-deposits-below-one-crore
800
1,000
1,200
1,400
1,600
1,800
2,000
Ma
r-1
2
Ma
y-1
2
Jul-
12
Se
p-1
2
No
v-1
2
Jan
-13
Ma
r-1
3
Ma
y-1
3
Jul-
13
Se
p-1
3
No
v-1
3
Jan
-14
Ma
r-1
4
Ma
y-1
4
Jul-
14
Se
p-1
4
No
v-1
4
Jan
-15
Ma
r-1
5
Ma
y-1
5
Jul-
15
Se
p-1
5
No
v-1
5
Jan
-16
Ma
r-1
6
Ma
y-1
6
Jul-
16
Se
p-1
6
No
v-1
6
Jan
-17
Ma
r-1
7
Inve
stm
en
t gr
ow
th (R
s)
Nifty 50 S&P BSE SENSEX

28
Equity mutual funds as long-term wealth creators
Equity mutual funds have created wealth in
multiples for investors over the long term. For
example, Rs 1,000 invested in equity funds
(represented by CRISIL-AMFI Equity Fund
Performance Index) in 1999 would have grown 26.6
times, compared with 13.2 times, 9.9 times and 9.6
times on the Nifty 500, Nifty 50 and S&P BSE
Sensex, respectively
Growth of Rs 1,000 in equity mutual funds versus benchmarks
CRISIL-AMFI Fund Performance Indices are weighted average index of funds ranked under respective categories in CRISIL Mutual Fund
Ranking
Please refer to annexure for the detailed definitions of CRISIL-AMFI Equity Fund Performance Index
Total returns indices have been considered for Nifty 500, Nifty 50 and S&P BSE SENSEX
Data since the inception of Nifty 50 Total Returns Index, i.e. June 30, 1999
Source: CRISIL Research, NSE, BSE
0
5,000
10,000
15,000
20,000
25,000
30,000
Ju
n-9
9
Ma
r-0
0
De
c-0
0
Se
p-0
1
Ju
n-0
2
Ma
r-0
3
De
c-0
3
Se
p-0
4
Ma
y-0
5
Fe
b-0
6
No
v-0
6
Au
g-0
7
Ma
y-0
8
Fe
b-0
9
No
v-0
9
Au
g-1
0
Ap
r-1
1
Ja
n-1
2
Oc
t-1
2
Ju
l-1
3
Ap
r-1
4
Ja
n-1
5
Oc
t-1
5
Ju
n-1
6
Ma
r-1
7
Inv
es
tme
nt
gro
wth
(R
s)
CRISIL – AMFI Equity Fund Performance Index Nifty 500 Nifty 50 S&P BSE SENSEX
Category / IndexCRISIL – AMFI Equity Fund
Performance IndexNifty 500 Nifty 50 S&P BSE Sensex
Growth of Rs 1,000 since
June 30, 199926,594 13,203 9,913 9,582

29
Variety of equity products for various risk-return profiles
Mutual funds also provide investors with a variety
of products under the equity banner to invest as
per their risk-return profile and preference. Large
cap funds, small and midcap funds, and diversified
equity funds are the major types of equity mutual
funds based on the size of the market
capitalisation of the stocks used to build their
portfolios.
For tax efficiency, there are the equity linked
savings schemes (ELSS) which provide income tax
exemption under Section 80C of the Income Tax
Act. There are also sector funds, which focus on
stocks belonging to a particular sector for
investment.
Equity mutual funds offer reasonable returns across timeframes
Index 3-years 5-years 7-years 10-years
CRISIL – AMFI Large Cap Fund Performance Index 15.46% 14.38% 11.02% 11.74%
CRISIL – AMFI Small & Midcap Fund Performance Index 26.79% 22.47% 16.98% 15.05%
CRISIL – AMFI Diversified Equity Fund Performance Index 18.15% 15.79% 11.63% 12.53%
CRISIL – AMFI ELSS Fund Performance Index 18.90% 17.13% 12.64% 12.67%
Nifty 50 12.38% 13.00% 9.69% 10.40%
S&P BSE SENSEX 11.42% 12.95% 9.43% 10.07%
Nifty 500 16.53% 14.93% 10.45% 11.04%
Nifty Free Float Midcap 100 27.40% 18.98% 13.66% 15.02%
S&P BSE Midcap 27.37% 19.03% 12.57% 11.64%
CRISIL-AMFI Fund Performance Indices are weighted average index of funds ranked under respective category in CRISIL Mutual Fund
Ranking
Please refer to annexure for the detailed definitions of CRISIL-AMFI indices
Total returns indices have been considered for Nifty 50, S&P BSE SENSEX, Nifty 500, Nifty Free Float Midcap 100 and S&P BSE Midcap
Data as on March 31, 2017
Annualised return
Source: CRISIL Research, NSE, BSE

30
Sector-based equity funds have fared better than benchmarks
Sector-based equity funds invest in equity
instruments of a particular sector as defined in
their scheme objective. In order to analyse the
performance of sector funds, asset-weighted
indices were constructed since the inception of the
first fund within the respective category, or for the
past 10 years, whichever is later. Infrastructure
funds’ index has been constructed since the
inception of the benchmark Nifty Infrastructure.
Sector-based equity funds’ performance versus respective benchmarks
Index 3-years 5-years 7-years 10-years
Banking and Financial Services category 25.04% 19.31% 15.98% 19.89%
Nifty Bank 18.93% 15.97% 12.39% 14.97%
Infrastructure category 21.11% 13.51% 6.39% 9.49%
Nifty Infrastructure 5.79% 4.29% -1.42% -0.01%
Information Technology category 9.31% 14.15% 11.92% 8.95%
Nifty IT Index 4.80% 10.42% 8.99% 7.52%
Pharmaceuticals category 16.66% 19.80% 16.23% 18.68%
Nifty Pharma 10.90% 15.61% 14.56% 14.35%
Fast Moving Consumer Goods category 16.43% 18.49% 20.88% 18.01%
Nifty FMCG 9.18% 15.54% 18.25% 17.40%
Total returns indices have been considered for Nifty Bank, Nifty Infrastructure, Nifty IT Index, Nifty Pharma and Nifty FMCG
Data as on March 31, 2017
Annualised returns
Source: CRISIL Research, NSE

31
Hybrid funds help simplify asset allocation
Investing in both equity and debt asset classes
becomes important when building a diversified
portfolio. Hybrid mutual funds provide this
investment opportunity under one roof. Balanced
funds and monthly income plans (MIPs) are two
major types of hybrid funds. Balanced funds have a
higher proportion of equity -- usually more than
65% – while MIPs have up to 30% in equity. Both
the hybrid fund categories have beaten their
respective benchmarks in the past 15 years.
Growth of Rs 1,000 in hybrid funds versus benchmarks
CRISIL-AMFI Fund Performance Indices are weighted average index of funds ranked under respective categories in CRISIL Mutual Fund
Ranking
Please refer to annexure for the detailed definitions of CRISIL-AMFI indices
Data since the inception of CRISIL Balanced Fund – Aggressive Index and CRISIL MIP Blended Fund Index, i.e. March 31, 2002
Source: CRISIL Research
0
2,000
4,000
6,000
8,000
10,000
12,000
14,000
Ma
r-0
2
Au
g-0
2
Ja
n-0
3
Ju
n-0
3
No
v-0
3
Ap
r-0
4
Se
p-0
4
Fe
b-0
5
Ju
l-0
5
De
c-0
5
Ma
y-0
6
Oc
t-0
6
Ma
r-0
7
Au
g-0
7
Ja
n-0
8
Ju
n-0
8
No
v-0
8
Ap
r-0
9
Se
p-0
9
Fe
b-1
0
Ju
l-1
0
De
c-1
0
Ma
y-1
1
Oc
t-1
1
Ma
r-1
2
Au
g-1
2
Ja
n-1
3
Ju
n-1
3
No
v-1
3
Ap
r-1
4
Se
p-1
4
Fe
b-1
5
Ju
l-1
5
De
c-1
5
Ma
y-1
6
Oc
t-1
6
Ma
r-1
7
Inv
es
tme
nt
gro
wth
(R
s)
CRISIL – AMFI Balance Fund Performance Index CRISIL Balanced Fund – Aggressive Index
CRISIL – AMFI MIP Fund Performance Index CRISIL MIP Blended Fund Index
Category / Index
CRISIL – AMFI
Balance Fund
Performance Index
CRISIL Balanced Fund
– Aggressive Index
CRISIL – AMFI MIP
Fund Performance
Index
CRISIL MIP
Blended Fund
Index
Growth of Rs 1,000
since March 31, 200212,419 5,896 4,160 3,484
32
Debt funds an alternative to bank fixed deposits
Fixed income investment forms an important part
of any portfolio since it carries a lower risk
compared with equity.
Mutual funds offer multiple options in the fixed-
income realm. These are categorised as long-term
and short-term debt funds based on maturity. Of
the two, long-term debt funds tend to benefit more
during periods of interest rate decline, while short-
term debt funds fare better during periods of rising
interest rates. Additionally, debt funds provide tax
benefit in the form of indexation for holding period
of more than three years.
Growth of Rs 1,000 in long-term debt funds versus 3-year FD Index
CRISIL-AMFI Fund Performance Indices are weighted average index of funds ranked under respective categories in CRISIL Mutual Fund
Ranking
Fixed Deposit Indices have been constructed by taking simple average of FD rates of top 3 (by total deposits) public and private sector
banks
Please refer to annexure for the detailed definitions of CRISIL-AMFI indices and 3-year FD Index
Source: CRISIL Research
0
500
1,000
1,500
2,000
2,500
3,000
3,500
4,000
4,500
5,000
Ap
r-0
0
Ma
r-0
1
Ma
r-0
2
Ma
r-0
3
Ma
r-0
4
Ma
r-0
5
Ma
r-0
6
Ma
r-0
7
Ma
r-0
8
Ma
r-0
9
Ma
r-1
0
Ma
r-1
1
Ma
r-1
2
Ma
r-1
3
Ma
r-1
4
Ma
r-1
5
Ma
r-1
6
Ma
r-1
7
Inv
es
tme
nt
gro
wth
(R
s)
CRISIL – AMFI Income Fund Performance Index CRISIL – AMFI Gilt Fund Performance Index 3 year FD Index
Category / IndexCRISIL – AMFI Income
Fund Performance Index
CRISIL – AMFI Gilt Fund
Performance Index3-year FD Index
Growth of Rs 1000 since
April 01, 20003988 4343 3868

33
Growth of Rs 1,000 in short-term debt funds versus 1-year FD Index
CRISIL-AMFI Fund Performance Indices are weighted average index of funds ranked under respective category in CRISIL Mutual Fund
Ranking
Fixed Deposit Indices have been constructed by taking simple average of FD rates of top 3 (by total deposits) public and private sector
banks
Please refer to annexure for the detailed definitions of CRISIL-AMFI indices and 1-year FD Index
Source: CRISIL Research
1,000
1,500
2,000
2,500
3,000
3,500
Ap
r-0
2
Ma
r-0
3
Ma
r-0
4
Ma
r-0
5
Ma
r-0
6
Ma
r-0
7
Ma
r-0
8
Ma
r-0
9
Ma
r-1
0
Ma
r-1
1
Ma
r-1
2
Ma
r-1
3
Ma
r-1
4
Ma
r-1
5
Ma
r-1
6
Ma
r-1
7
Inv
es
tme
nt
gro
wth
(R
s)
CRISIL – AMFI Short Term Debt Fund Performance Index 1 Year FD Index
Category / IndexCRISIL – AMFI Short Term Debt Fund
Performance Index1-year FD Index
Growth of Rs 1000 since
April 01, 20023056 2916

34
Market phases analysis – CRISIL-AMFI debt fund performance indices
A Income funds B Gilt funds C Short term debt funds D Banks' fixed deposit
Income, gilt and short term debt funds represented by CRISIL-AMFI Income Fund Performance Index, CRISIL-AMFI Gilt Fund Performance
Index and CRISIL-AMFI Short Term Debt Fund Index respectively
CRISIL-AMFI Short Term Debt Fund Index is available from April 2002 (inception)
Banks’ effective fixed deposit rates represented by 3 Year and 1 Year FD Rates, for period less than a year, 1 Year FD Rate has been
considered
Returns for market phase of more than one year are annualised
^ Absolute Returns
CRISIL-AMFI Fund Performance Indices are weighted average index of funds ranked under respective category in CRISIL Mutual Fund
Ranking
Please refer to annexure for the detailed definitions of CRISIL-AMFI indices
Source: CRISIL Research
4.00%
5.00%
6.00%
7.00%
8.00%
9.00%
10.00%
11.00%
20
01
20
02
20
03
20
04
20
05
20
06
20
07
20
08
20
09
20
10
20
12
20
13
20
14
20
15
20
16
20
17
10
ye
ar
G-
se
c y
ield
mo
ve
me
nt
10 Year G-sec yield
Secular decline
in yields in
2001-04
Flat or high interest rate
period of 2004-08
Flat or high interest
rate period of
2008-14
Declining
yields
2014-present
Sharp
correction in
yields in 2008^
Phase Cumulative
11.37% 11.37%
16.42% 16.42%
- -
7.32% 7.32%
Phase Cumulative
4.20% 6.91%
3.25% 8.14%
6.42% 6.65%
6.01% 6.51%
Phase Cumulative
19.18% 9.08%
25.71% 11.06%
5.13% 7.01%
3.30% 6.60%
Phase Cumulative
5.73% 7.59%
3.48% 7.67%
7.90% 7.42%
9.75% 7.97%
Phase Cumulative
10.43% 8.04%
12.05% 8.36%
9.26% 7.73%
8.33% 8.03%

35
Money market funds a better choice than
savings bank account
Savings bank accounts are the most commonly
used option to park surplus cash and to meet day-
to-day liquidity. However, investors can generate
more returns than the 4% that most savings bank
accounts usually offer, by taking slightly more risk
and investing in money market funds. These funds
invest in short-term corporate debt papers,
commercial papers, certificates of deposit and
government treasury bills to generate better
returns with a fair amount of safety.
There are two types of money market funds – liquid
funds and ultra-short term debt funds. While ultra-
short term debt funds usually have maturities of
less than one year, liquid funds have maturities of
less than 90 days. Both these categories provide
liquidity to the investor. However, liquid funds are
better at it since the redemption proceeds are
settled within one working day. In terms of returns,
these are better than the savings bank deposits as
seen from the below table.
Money market funds outperform the Savings Bank Rate index
Index 1-year 3-years 5-years
CRISIL – AMFI Liquid Fund Performance Index 7.20% 8.10% 8.53%
CRISIL – AMFI Ultra Short Fund Performance Index 8.36% 8.60% 8.87%
CRISIL Liquid Fund Index 7.11% 8.04% 8.36%
Savings Bank Rate Index 4.00% 4.00% 4.00%
CRISIL-AMFI Fund Performance Indices are weighted average index of funds ranked under respective category in CRISIL Mutual Fund
Ranking
Savings Bank Rate Index has been constructed using the average savings rate of top 3 (by total deposits) public and private sector banks
Please refer to annexure for the detailed definitions of CRISIL-AMFI indices and Savings Bank Rate Index
Data as on March 31, 2017
Returns for period more than one year are annualised
Source: CRISIL Research

36
Majority of funds outperform their stated benchmarks
A comparison of five-year trailing returns shows
the number of equity-oriented schemes
outperforming their stated benchmarks has
increased in the past five fiscals. In fiscal 2017,
84% of the equity oriented funds outperformed
their stated benchmarks.
A similar analysis for debt-oriented funds shows
that the majority of these, too, have outclassed
their respective benchmarks.
Category Mar-17 Mar-16 Mar-15 Mar-14 Mar-13
Equity-oriented schemes*
Number of schemes 312 304 278 261 241
Schemes outperforming their stated benchmark 84% 84% 82% 66% 59%
Schemes underperforming their stated benchmark 16% 16% 18% 34% 41%
Debt-oriented schemes^
Number of schemes 236 224 207 190 179
Schemes outperforming their stated benchmark 52% 56% 70% 67% 66%
Schemes underperforming their stated benchmark 48% 44% 30% 33% 34%
* Equity-oriented schemes include growth, balanced and ELSS categories, as classified by AMFI
^ Debt-oriented schemes include income, gilt and floating rate categories, as classified by AMFI
Regular plans of open-ended funds, whose stated benchmark values are publicly available, have been considered for the analysis
Annualised point-to-point returns for five years have been considered for analysis as on the last day of the respective fiscal
Source: AMFI, CRISIL research
37
Better distribution, awareness and investor servicing the
propellants
Robust distribution an imperative for sustainable growth
Despite the phenomenal growth seen in recent years, the share of mutual funds
in overall household savings remains low. For a breakout improvement in this trend
to kick in, it is imperative that distributors continue to play a pivotal role in spreading
awareness about mutual fund investing and facilitating these investments as they have
done since the inception of the industry.
Distributors are a key touch point for retail investors not only in B15 cities but also in the
T15. From providing information to helping investors find the appropriate funds, they strive to
make the whole investing process seamless and convenient for investors. They have also played
a major role in the surge in SIP numbers, and in canvassing the merits of disciplined, sustained
investing across market phases.
The benefits of such handholding are not lost on individual investors either. Nearly 86% of the mutual
fund assets of individual investors, including retail and HNI, are in regular plans – a category dominated by
distributors – while barely 14% go for direct plans. All the same, the reach of mutual fund distribution in B15
cities is below that of other financial services, such as banking and insurance. Though the number of
distributors is growing and has more than doubled in the past six years to 85,918 as of March 2017, the number
appears puny compared with over 2 million agents7 the insurance industry has.
Rising wealth and growing awareness through investor education campaigns such as ‘Mutual Funds Sahi Hai’
can emerge as important tools to increase the advisor strength at work for the MF industry growth. Mutual
fund distribution / advisory can emerge as a career option for the youth thus creating an employment
opportunity while also channelising investor’s savings into productive investments.
Distribution base in a secular uptrend
Source: AMFI
7 IRDAI Annual Report 2015-16
39,04047,845
52,19460,372
66,91975,554
85,918
Mar-11 Mar-12 Mar-13 Mar-14 Mar-15 Mar-16 Mar-17
Better distribution, awareness and investor
servicing the propellants
38
The geographic composition of the distributor base
shows their services are more or less evenly
distributed among the eight zones in the country,
covering 10,500 places based on PIN code.
The geographic spread benefits investors, of
course, but also generates employment
opportunity.
Currently (as on May 31, 2017) the total number of
“Feet on Street” in respect of number of mutual
fund distributors stood at 190,811 comprising of
81,843 individual mutual fund distributors and
108,968 employees. AMFI sees that this number
could potentially go up by five times in the next five
years with suitable measures towards distribution
expansion.
Region wise composition of distribution base
States covered Distributors composition
Maharashtra, Madhya Pradesh and Chhattisgarh 31%
Rajasthan and Gujarat 16%
Delhi, Haryana, Punjab, Himachal Pradesh and Jammu & Kashmir 11%
West Bengal, Orissa and North Eastern 11%
Andhra Pradesh and Karnataka 10%
Uttar Pradesh, Uttarakhand 9%
Kerala and Tamil Nadu 8%
Bihar and Jharkhand 5%
Data as of March 2017
Source: India Post, AMFI
Along with market regulator SEBI, AMFI has strived
consistently to widen the distributor base and
energise the distribution system. In 2012, SEBI
allowed a new cadre of distributors, including
retired bank officials, school teachers, postal
agents and other persons such as banking
correspondents, to sell simple/performing mutual
fund schemes with the objective of increasing off-
take of mutual funds among retail investors.
Measures have also been taken to improve
transparency in the disclosure of distributors’
commission expenses and the industry is also
working towards lowering the distribution cost. A
stronger boost to investor education and
awareness, pro-investor measures and expansion
of the distribution base have helped the industry
make in-roads into the hinterland, with B15 cities
now accounting nearly a quarter of the industry
AUM.
AMFI will be shortly introducing a completely
paperless Aadhaar based On-line process for fresh
Registration & Renewal of AMFI Registration
Number (ARN) for MF distributors, in collaboration
with NISM & CAMS.
AMFI is also evaluating the possibility of single
window registration process for distributors that
could eliminate the requirement of empanelling
with each fund house.
On the same lines, AMFI is also evaluating
introduction of a common/standardised
application form to ease the transaction process
for investors.
Clearly, the industry needs distributors to continue
playing a big role in creating awareness about the
products and boosting off-take, especially in
underpenetrated regions. And a quantum leap in

39
growth will ride on an expansion of the distribution
base.
Need for continuous focus on increasing financial awareness
Though the mutual fund industry’s assets are at a
record high, its penetration is skewed towards a
few states and the larger cities. This is because in
most parts of the country, the focus is more on
savings rather than investing. Lack of information
about mutual funds and the perception that it is a
risky product have resulted in investors preferring
banks’ fixed deposits and physical assets such as
gold and realty.
SEBI’s move directing fund houses to spend on
structured investor awareness programme has
definitely helped increase the reach of mutual
funds among the masses. In fiscal 2017, 35 fund
houses conducted 8,203 programmes in 211 cities,
covering over 4 lakh participants.
AMFI’s recent multi-media campaign ‘Mutual
Funds Sahi Hai’, which aims to position mutual
funds as a preferred investment option, and SEBI
allowing celebrity endorsement are welcome
moves to increase investor awareness. There is
ample scope to increase financial awareness,
especially in the untapped rural areas.
‘Mutual Funds Sahi Hai’ spending over time should
focus on creating features for on boarding of
customers through MFU or any such platform in
order to help investors fulfill their needs. This
could be the logical extension of the awareness
campaign to meet the growing need once investors
get on boarded.
Investor servicing an imperative, too
One of the important factors that have held back
investors from mutual funds is the paperwork
involved – filling of forms, updating KYC
documents, in-person verification and tracking the
investment/s, to name some. Launch of e-KYC has
indeed made the onboarding of investors
convenient and paperless.
With greater adoption of technology, including
online platforms, mobile applications, robo-
advisory, usage of e-wallets and e-commerce
(proposed), investors can be assured of a seamless
investment experience, whether in submitting the
documents online, transacting or reviewing
investments on a consolidated and real-time basis,
and that too in a cost-effective way.
However, usage of technology in the hinterland is
lower than in big cities. In order to capture the
large untapped market, it is imperative that the
industry create an environment that makes
investor experience seamless and convenient.
As for measuring the impact, a critical area would
be the quality of investment decisions on the
platforms. The digital players can use analytics to
assist users in finding the right fund match based
on transactions history, monthly surplus, etc. For
instance, someone who usually has Rs 20,000
balance until 20th of each month can be
recommended liquid fund investment for the 20-
day period during which the money lay idle.
Alternatively, e-wallets and ecommerce sites can
offer low-risk investment schemes for investors to
get a taste of mutual funds and then lead them
through the whole basket through regular
channels.
It is also important that investor education and
awareness is given prominence for investments
through such mediums to avoid inaccurate
investment mapping with the individual’s risk-
return profile. Compulsory online risk profiling of
the investor before any fresh investment through
such platforms should be the norm.

40

41
.
Other industry trends
42
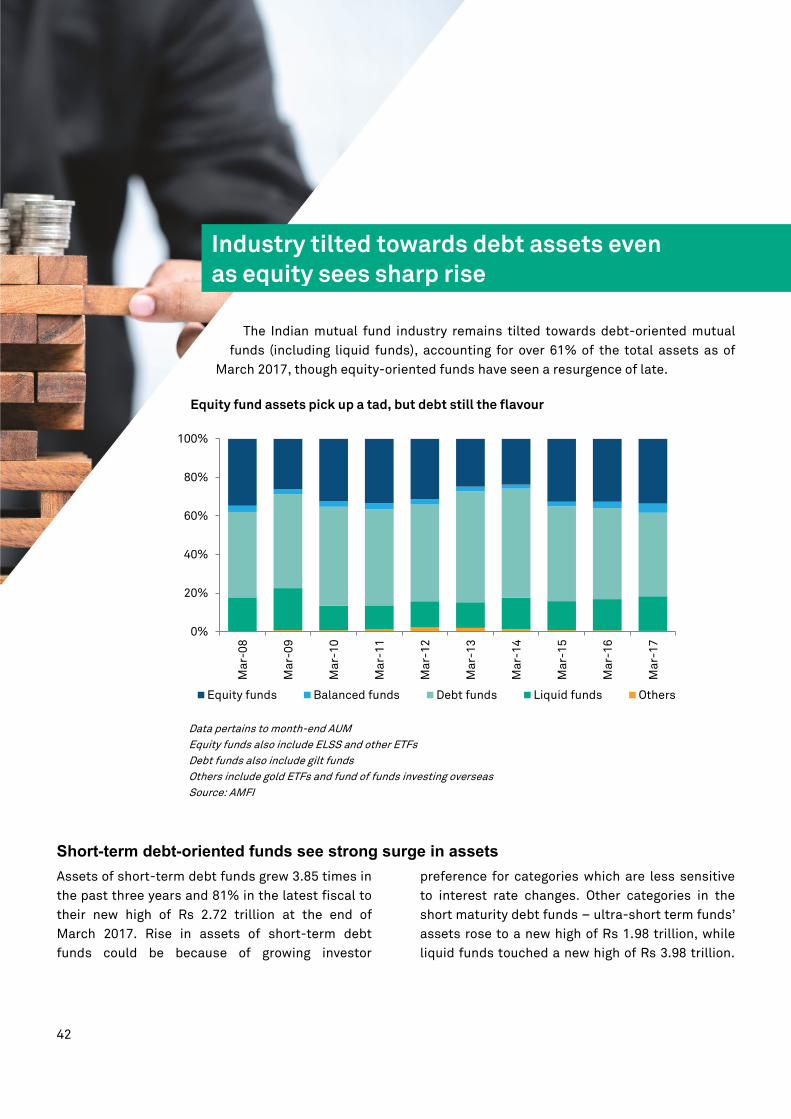
Industry tilted towards debt assets even as equity sees sharp
rise
The Indian mutual fund industry remains tilted towards debt-oriented mutual
funds (including liquid funds), accounting for over 61% of the total assets as of
March 2017, though equity-oriented funds have seen a resurgence of late.
Equity fund assets pick up a tad, but debt still the flavour
Data pertains to month-end AUM
Equity funds also include ELSS and other ETFs
Debt funds also include gilt funds
Others include gold ETFs and fund of funds investing overseas
Source: AMFI
Short-term debt-oriented funds see strong surge in assets
Assets of short-term debt funds grew 3.85 times in
the past three years and 81% in the latest fiscal to
their new high of Rs 2.72 trillion at the end of
March 2017. Rise in assets of short-term debt
funds could be because of growing investor
preference for categories which are less sensitive
to interest rate changes. Other categories in the
short maturity debt funds – ultra-short term funds’
assets rose to a new high of Rs 1.98 trillion, while
liquid funds touched a new high of Rs 3.98 trillion.
0%
20%
40%
60%
80%
100%
Ma
r-0
8
Ma
r-0
9
Ma
r-1
0
Ma
r-1
1
Ma
r-1
2
Ma
r-1
3
Ma
r-1
4
Ma
r-1
5
Ma
r-1
6
Ma
r-1
7
Equity funds Balanced funds Debt funds Liquid funds Others
Industry tilted towards debt assets even
as equity sees sharp rise

43
Debt-oriented funds show short-end skew
Data pertains to quarterly average AUM
Source: AMFI, CRISIL Research
Assets of long-maturity debt funds saw muted
growth in fiscal 2017 amid growing expectations
that the RBI’s interest rate easing cycle is close to
an end. In the February 2017 policy meeting, the
RBI changed its policy stance to neutral from
accommodative. While income funds’ average AUM
managed to grow 12% (lower growth vis-à-vis short
maturity debt) to Rs 1.09 trillion, gilt funds’ assets
shrank 8.49% to Rs 158 billion.
Meanwhile, the flow data shows erratic trend
among the categories. In the latest fiscal, debt
funds – including income, short-term debt, fixed
maturity plans and ultra-short term -- attracted
record high inflows of Rs 1.21 trillion, while liquid
funds saw the largest inflow of Rs 958 billion. Gilt
funds, however, witnessed net outflows of Rs 33
billion following inflows in the preceding two
fiscals amid expectation that interest rate easing
cycle has come to an end.
Net flows into debt-oriented funds shoot up
Source: AMFI, CRISIL Research
0
200
400
600
800
1000
1200
Ma
r-1
1
Ma
r-1
2
Ma
r-1
3
Ma
r-1
4
Ma
r-1
5
Ma
r-1
6
Ma
r-1
7
As
se
ts (
Rs
bil
lio
n)
Long-term debt funds assets' trend
Long term debt funds Gilt funds
0
1000
2000
3000
4000
5000
Ma
r-1
1
Ma
r-1
2
Ma
r-1
3
Ma
r-1
4
Ma
r-1
5
Ma
r-1
6
Ma
r-1
7As
se
ts (
Rs
bil
lio
n)
Short-term debt funds assets' trend
Short term debt funds Liquid funds Ultra Short Term funds
6.50%
6.70%
6.90%
7.10%
7.30%
7.50%
7.70%
7.90%
8.10%
8.30%
8.50%
-600
-400
-200
0
200
400
600
800
1000
1200
1400
FY11 FY12 FY13 FY14 FY15 FY16 FY17
Av
era
ge
10
ye
ar
gil
t y
ield
Ne
tflo
ws
(R
s b
illi
on
)
Debt funds Liquid funds Gilt Funds 10-year gilt yield

44
The rise in debt-oriented fund assets is reflected in
their share of domestic debt market issuances in
the past five years. As of March 2017, mutual
funds’ debt holdings accounted for a tenth of total
debt issuance.
Mutual funds’ share of debt issuances rising
Debt mutual funds also include gilt and liquid funds
Total debt issuance include CPs, CDs, bonds and government securities
Source: AMFI, RBI, SEBI, CCIL, CRISIL Research
45
Preference for actively managed and open-ended funds
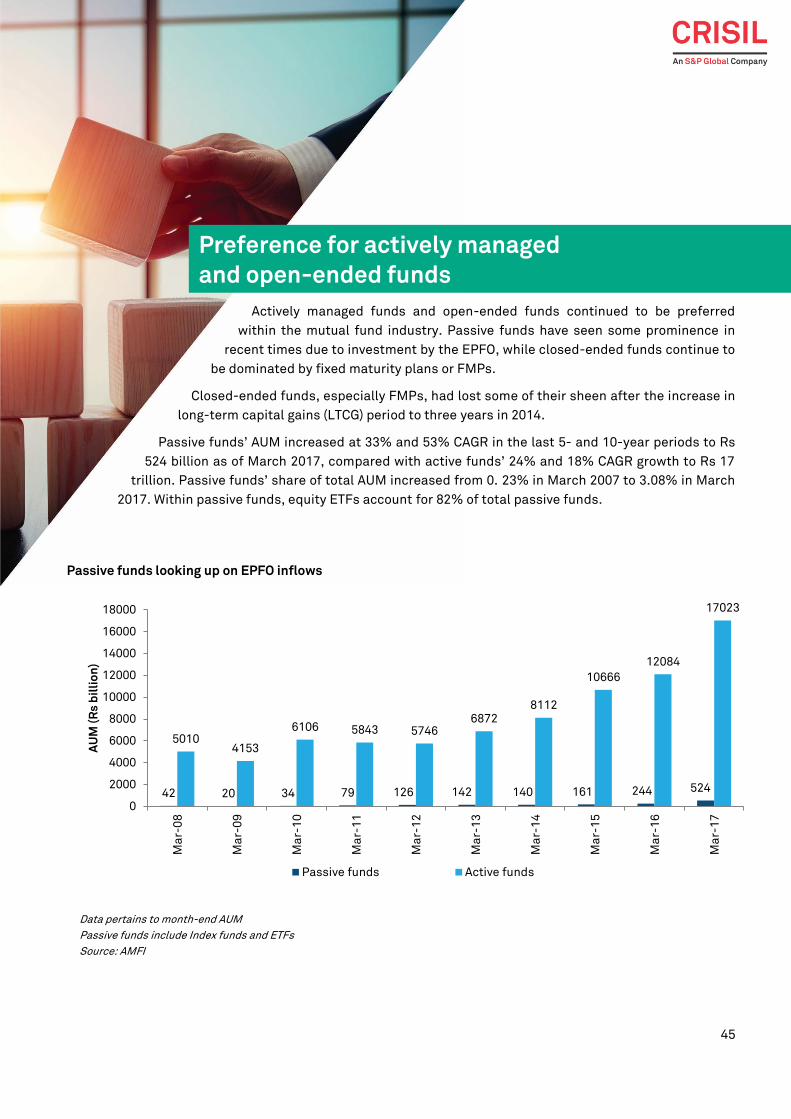
Actively managed funds and open-ended funds continued to be preferred
within the mutual fund industry. Passive funds have seen some prominence in
recent times due to investment by the EPFO, while closed-ended funds continue to
be dominated by fixed maturity plans or FMPs.
Closed-ended funds, especially FMPs, had lost some of their sheen after the increase in
long-term capital gains (LTCG) period to three years in 2014.
Passive funds’ AUM increased at 33% and 53% CAGR in the last 5- and 10-year periods to Rs
524 billion as of March 2017, compared with active funds’ 24% and 18% CAGR growth to Rs 17
trillion. Passive funds’ share of total AUM increased from 0. 23% in March 2007 to 3.08% in March
2017. Within passive funds, equity ETFs account for 82% of total passive funds.
Passive funds looking up on EPFO inflows
Data pertains to month-end AUM
Passive funds include Index funds and ETFs
Source: AMFI
42 20 34 79 126 142 140 161 244 524
50104153
6106 5843 57466872
8112
10666
12084
17023
0
2000
4000
6000
8000
10000
12000
14000
16000
18000
Ma
r-0
8
Ma
r-0
9
Ma
r-1
0
Ma
r-1
1
Ma
r-1
2
Ma
r-1
3
Ma
r-1
4
Ma
r-1
5
Ma
r-1
6
Ma
r-1
7
AU
M (
Rs
bil
lio
n)
Passive funds Active funds
Preference for actively managed
and open-ended funds
46
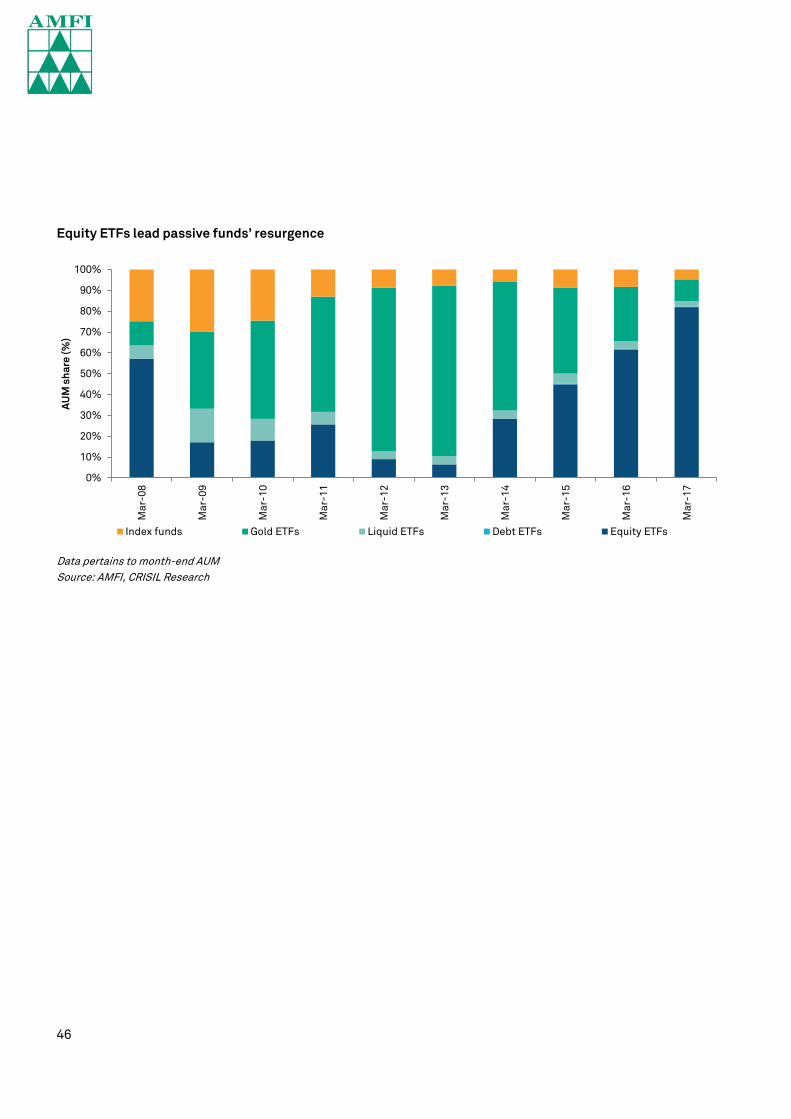
Equity ETFs lead passive funds’ resurgence
Data pertains to month-end AUM
Source: AMFI, CRISIL Research
0%
10%
20%
30%
40%
50%
60%
70%
80%
90%
100%
Ma
r-0
8
Ma
r-0
9
Ma
r-1
0
Ma
r-1
1
Ma
r-1
2
Ma
r-1
3
Ma
r-1
4
Ma
r-1
5
Ma
r-1
6
Ma
r-1
7
AU
M s
ha
re (
%)
Index funds Gold ETFs Liquid ETFs Debt ETFs Equity ETFs

47
Closed-ended funds, wherein investors cannot
redeem their units before the stipulated period,
form 10% of the total AUM as of March 2017, down
from 33% a decade ago. Composition of closed-
ended funds’ assets shows that debt-oriented
funds (predominantly FMPs and capital protection
funds) have dominated the category, but the share
of equity-oriented funds has increased in the past
four years.
Open-ended funds preferred by investors
Rs trillion
Closed-ended schemes include interval funds
Data pertains to month-end AUM
Source: AMFI
Preference for actively managed and
open-ended funds

48
Closed-ended funds continue to remain debt-heavy
Data pertains to month-end AUM
Source: AMFI
81%
71%78%
70%
96% 98% 98% 97%
88% 89% 86%
19%
29%22%
30%
4% 2% 2% 3%
12% 11% 14%
0%
10%
20%
30%
40%
50%
60%
70%
80%
90%
100%
Ma
r-0
7
Ma
r-0
8
Ma
r-0
9
Ma
r-1
0
Ma
r-1
1
Ma
r-1
2
Ma
r-1
3
Ma
r-1
4
Ma
r-1
5
Ma
r-1
6
Ma
r-1
7
AU
M s
ha
re (
%)
Equity funds Debt funds
49
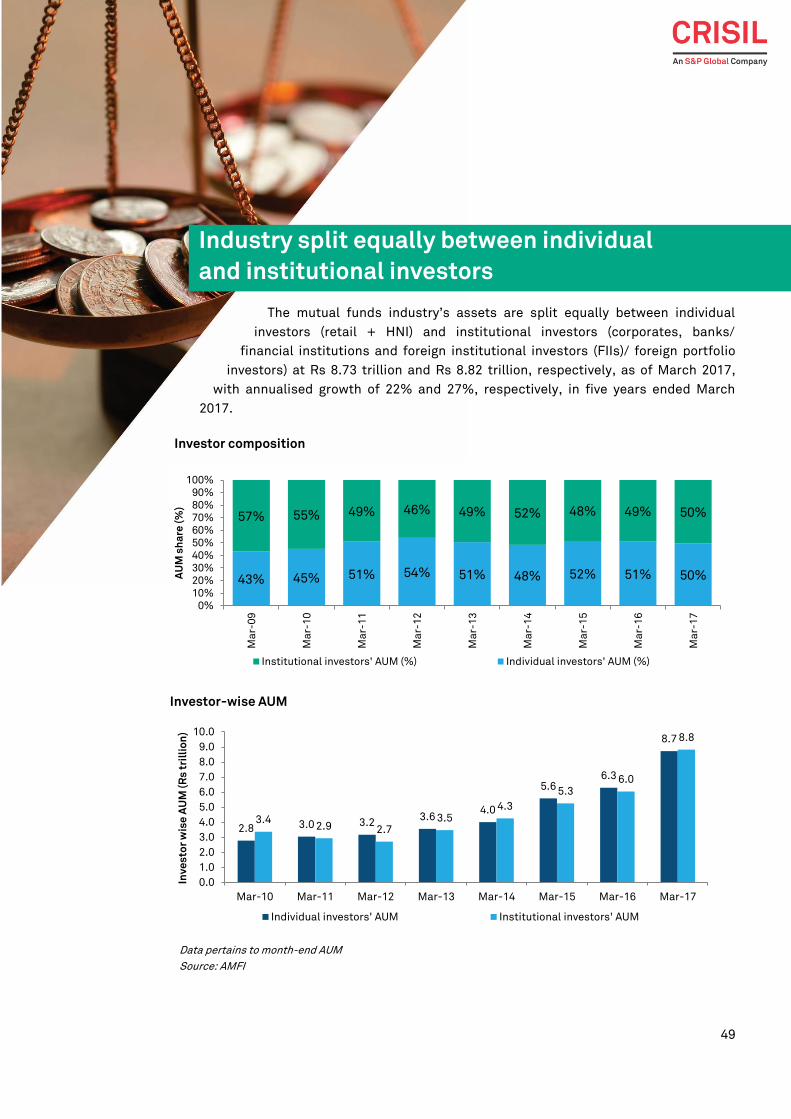
Industry split equally between individual and institutional
investors
The mutual funds industry’s assets are split equally between individual
investors (retail + HNI) and institutional investors (corporates, banks/
financial institutions and foreign institutional investors (FIIs)/ foreign portfolio
investors) at Rs 8.73 trillion and Rs 8.82 trillion, respectively, as of March 2017,
with annualised growth of 22% and 27%, respectively, in five years ended March
2017.
Investor composition
Investor-wise AUM
Data pertains to month-end AUM
Source: AMFI
43% 45% 51% 54% 51% 48% 52% 51% 50%
57% 55% 49% 46% 49% 52% 48% 49% 50%
0%
10%
20%
30%
40%
50%
60%
70%
80%
90%
100%
Ma
r-0
9
Ma
r-1
0
Ma
r-1
1
Ma
r-1
2
Ma
r-1
3
Ma
r-1
4
Ma
r-1
5
Ma
r-1
6
Ma
r-1
7
AU
M s
ha
re (
%)
Institutional investors' AUM (%) Individual investors' AUM (%)
2.8 3.0 3.23.6
4.0
5.66.3
8.7
3.42.9 2.7
3.54.3
5.36.0
8.8
0.0
1.0
2.0
3.0
4.0
5.0
6.0
7.0
8.0
9.0
10.0
Mar-10 Mar-11 Mar-12 Mar-13 Mar-14 Mar-15 Mar-16 Mar-17
Inv
es
tor
wis
e A
UM
(R
s t
rill
ion
)
Individual investors' AUM Institutional investors' AUM
Industry split equally between individual
and institutional investors

50
Institutional investors skewed towards debt investments
Asset-wise composition shows that while
individual investors show higher preference for
equity funds, institutional investors show higher
preference for debt-oriented funds. Institutional
investors have invested nearly 85% of their assets
in debt-oriented funds, including gilt and money
market funds.
Retail investors prefer equity funds, institutions debt
Equity funds also include ELSS and other ETFs
Debt funds also include gilt funds
Data pertains to month-end AUM as of March 2017
Others include gold ETFs and fund of funds investing overseas
Source: AMFI

51
Direct plan adoption higher for institutional investors
Prior to January 2013, there was a single plan
structure for all investors. Then, SEBI mandated
funds houses to offer two types of plans: 1) direct
plans for investors who want to directly purchase
mutual funds from fund houses rather than going
through the distribution channel, and 2) regular
plans, or the original format of schemes, sold
through the distribution channel involving national
distributors, banks, independent financial
advisors, aggregators and digital channels.
The direct route has seen higher preference among
institutional investors, who tend to have a research
team to identify the top performing funds for
investment. Corporates, banks and financial
institutions and FIIs, which make up institutional
investors, account for 86% of total direct plans,
while individual investors (retail and HNI) account
for 69% of regular plans, indicating higher
preference for hand-holding by distributors.
Institutional investors go direct, retail sticks to regular route
Data pertains to average monthly AUM as of March 2017
Source: AMFI
In terms of category, debt (47%) and money market
funds (37%) accounted for the bulk of the direct
plan assets, while equity funds accounted for only
15% as of March 2017.
52
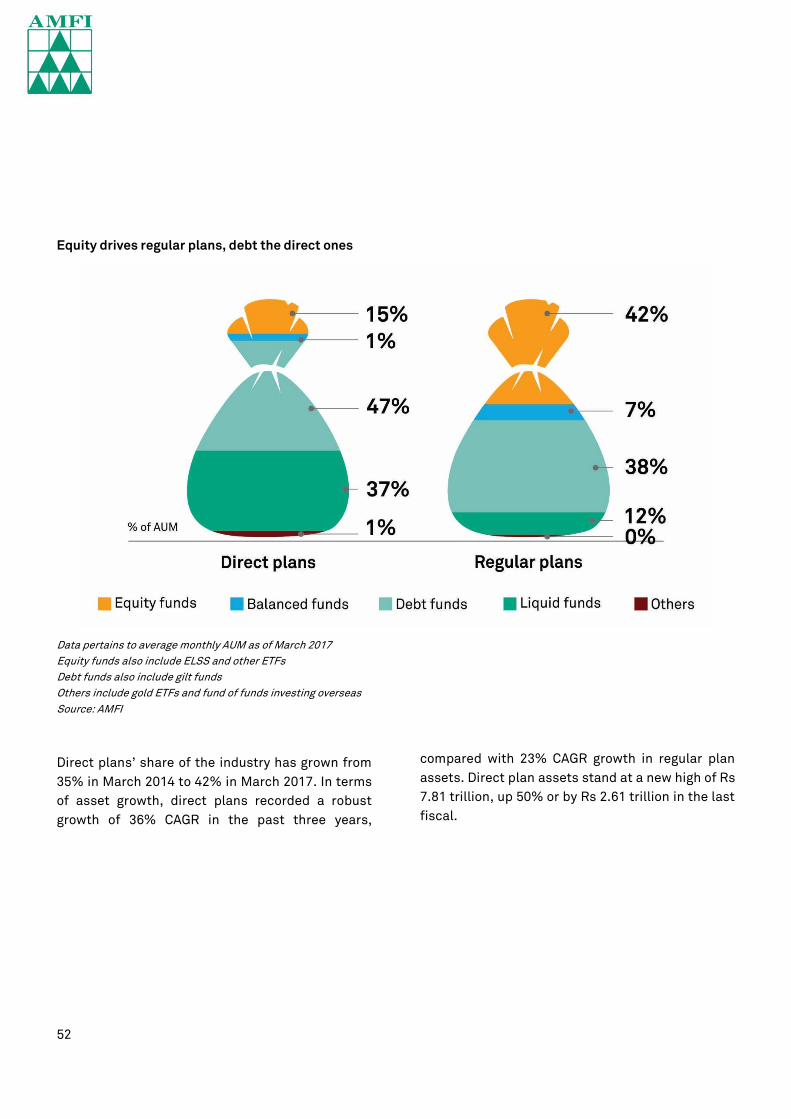
Equity drives regular plans, debt the direct ones
Data pertains to average monthly AUM as of March 2017
Equity funds also include ELSS and other ETFs
Debt funds also include gilt funds
Others include gold ETFs and fund of funds investing overseas
Source: AMFI
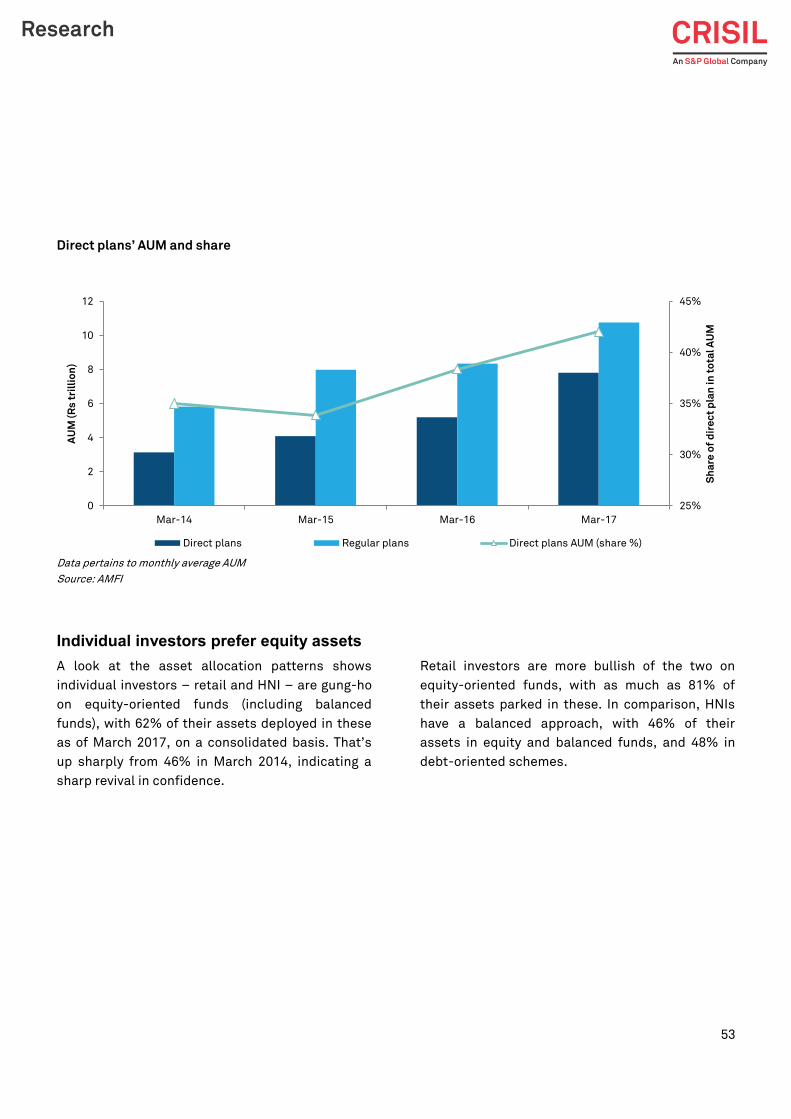
Direct plans’ share of the industry has grown from
35% in March 2014 to 42% in March 2017. In terms
of asset growth, direct plans recorded a robust
growth of 36% CAGR in the past three years,
compared with 23% CAGR growth in regular plan
assets. Direct plan assets stand at a new high of Rs
7.81 trillion, up 50% or by Rs 2.61 trillion in the last
fiscal.
53
Direct plans’ AUM and share
Data pertains to monthly average AUM
Source: AMFI
Individual investors prefer equity assets
A look at the asset allocation patterns shows
individual investors – retail and HNI – are gung-ho
on equity-oriented funds (including balanced
funds), with 62% of their assets deployed in these
as of March 2017, on a consolidated basis. That’s
up sharply from 46% in March 2014, indicating a
sharp revival in confidence.
Retail investors are more bullish of the two on
equity-oriented funds, with as much as 81% of
their assets parked in these. In comparison, HNIs
have a balanced approach, with 46% of their
assets in equity and balanced funds, and 48% in
debt-oriented schemes.
25%
30%
35%
40%
45%
0
2
4
6
8
10
12
Mar-14 Mar-15 Mar-16 Mar-17
Sh
are
of
dir
ec
t p
lan
in
to
tal
AU
M
AU
M (
Rs
tri
llio
n)
Direct plans Regular plans Direct plans AUM (share %)

54
HNIs take the proverbial middle path
Data pertains to month-end AUM
Equity funds also include ELSS and other ETFs
Debt funds also include gilt funds
Others include gold ETFs and fund of funds investing overseas
Source: AMFI
Assets of equity funds have surged at a CAGR of
44% in the past three fiscals to a record Rs 5.88
trillion as of March 2017, riding on SIP-led inflows
and uptrend in the equity markets. Inflows have
increased progressively: Rs 733 billion in fiscal
2015, Rs 827 billion in fiscal 2016 and Rs 944 billion
in fiscal 2017.

55
Equity funds’ AUM and net flows
Data pertains to month-end AUM
Data pertains to total netflows for the fiscal year
Equity funds also include ELSS and other ETFs
Source: AMFI
Retail ticket size increasing
Another positive trend that has emerged among
individual investors is the rising ticket size of
investments. In the past eight years, the average
investment of retail investors has grown four-fold
from Rs 19,199 in March 2009 to Rs 75,801 in
March 2017, while that of HNIs increased from Rs
1.51 million to Rs 1.90 million. For retail and HNI
investors taken together, the ticket size stood at
Rs 159,187 as of March 2017, showing steady
growth.
However, this is just the beginning when seen in
the global context. The ticket size of individual
investors in India is $2,455 (Rs 159,187), a fraction
of $125,000 in the US. However, it is expected to
only grow from here as disposable incomes rise.
-400
-200
0
200
400
600
800
1000
0
1000
2000
3000
4000
5000
6000
7000
Ma
r-0
8
Ma
r-0
9
Ma
r-1
0
Ma
r-1
1
Ma
r-1
2
Ma
r-1
3
Ma
r-1
4
Ma
r-1
5
Ma
r-1
6
Ma
r-1
7
Ne
tflo
ws
(R
s b
illi
on
)
AU
M (
Rs
bil
lio
n)
Net flows (RHS) Equity funds AUM

56
* Data pertains to December 2016
^ Data pertains to March 2017
Ticket size is computed as assets managed for a given investor category divided by number of accounts for that category
Source: AMFI, CRISIL Research, ICI

57
Mutual funds, the new stabilizing agent in the equity market
Historically, the Indian equity market has been driven by FIIs. However, the FII
money – also dubbed hot money – has also been a major source of volatility in the
market.
This has started to change of late. The strong influx of sticky, long-term money in equity
mutual funds from systematic investments by retail investors has emerged as a huge
stabilising factor. For instance, when FIIs sold Rs 146 billion worth of equities in FY16,
mutual funds bought Rs 661 billion.
Mutual funds soaking up FIIs-led choppiness
Total returns index has been considered for Nifty 50
Source: SEBI, NSDL, NSE
Mutual funds’ emergence as a stabilising factor is
reflected in the fact that their share of the equity
market capitalisation has nearly doubled from just
2.9% at the end of March 2014 to 5.5% as of March
2017.
3000
4000
5000
6000
7000
8000
9000
10000
11000
12000
13000
-1000
-500
0
500
1000
1500
FY08 FY09 FY10 FY11 FY12 FY13 FY14 FY15 FY16 FY17
Nif
ty 5
0 m
ov
em
en
t
Rs
bil
lio
n
FII Mutual funds Nifty 50
Mutual funds, the new stabilizing
agent in the equity market

58
Mutual funds’ share in equity market cap has nearly doubled in three years
Includes equity and balanced funds
Source: AMFI, BSE, CRISIL Research
3.7% 3.7% 3.9%3.5%
3.2% 3.2%3.0% 2.9%
3.7%
4.7%
5.5%
0.0%
1.0%
2.0%
3.0%
4.0%
5.0%
6.0%
Ma
r-0
7
Ma
r-0
8
Ma
r-0
9
Ma
r-1
0
Ma
r-1
1
Ma
r-1
2
Ma
r-1
3
Ma
r-1
4
Ma
r-1
5
Ma
r-1
6
Ma
r-1
7
Eq
uit
y o
rie
nte
d f
un
ds
' A
UM
/ M
ark
et
ca
p r
ati
o

59
-10
0
10
20
30
40
50
60
70
Ap
r-1
4M
ay
-14
Ju
n-1
4J
ul-
14
Au
g-1
4S
ep
-14
Oc
t-1
4N
ov
-14
De
c-1
4J
an
-15
Fe
b-1
5M
ar-
15
Ap
r-1
5M
ay
-15
Ju
n-1
5J
ul-
15
Au
g-1
5S
ep
-15
Oc
t-1
5N
ov
-15
De
c-1
5J
an
-16
Fe
b-1
6M
ar-
16
Ap
r-1
6M
ay
-16
Ju
n-1
6J
ul-
16
Au
g-1
6S
ep
-16
Oc
t-1
6N
ov
-16
De
c-1
6J
an
-17
Fe
b-1
7M
ar-
17
Rs
bil
lio
n
Balanced funds see high interest
Balanced funds have seen a sharp spurt in investor interest in recent years,
with net inflows on a sustained basis in the 34 months through March 2017.
Indeed, flows increased more than 76 times last fiscal from a meagre Rs 0.78
billion in March 2016 to almost Rs 60 billion in March 2017. This has increased
further to Rs 77 billion in May 2017.
Increase in net flows to balanced funds in the last one year
Source: AMFI
Balanced funds see high interest
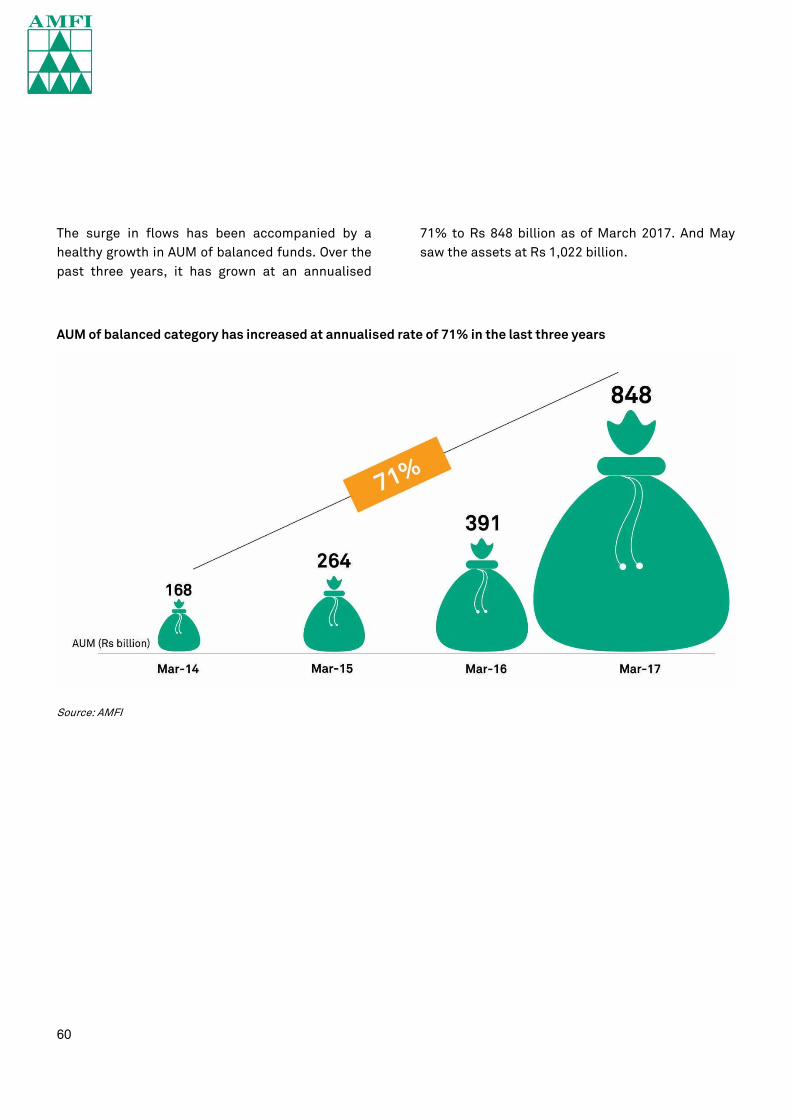
60
The surge in flows has been accompanied by a
healthy growth in AUM of balanced funds. Over the
past three years, it has grown at an annualised
71% to Rs 848 billion as of March 2017. And May
saw the assets at Rs 1,022 billion.
AUM of balanced category has increased at annualised rate of 71% in the last three years
Source: AMFI

61
Asset allocation funds could pave the future
The increasing interest in balanced funds, the
largest asset allocation category in the industry
(these funds typically invest 65% to 80% in equity
and 20% to 35% in fixed income securities),
indicates growing interest in asset allocation
funds.
The asset allocation, or portfolio diversification,
approach underscores the age-old adage – “do not
put all your eggs in the same basket”.
Diversification is one of the most important tasks
in portfolio construction since it has the potential
to improvise the risk-return characteristics of any
portfolio. Diversification must not only be across
securities or sectors, but also across asset
classes, because not all asset classes are winners
or losers at the same time during any market cycle.
Thus, asset allocation simply means distributing
the investments across asset classes such as
equity, debt and gold. The allocation to any asset
class for an efficient portfolio varies according to
the risk appetite of the investor.
No asset class wins all the time
Equity, debt and gold represented by Nifty 50 total returns index, CRISIL Composite Bond Fund Index and CRISIL Gold Index, respectively
Source: CRISIL Research
25%
-35%
75%
12%
-8%
9%
19%
28%
-8%
20%
8% 7% 5% 5% 8% 9%4%
15%8%
11%
29%25%
8%
27%
36%
5%
-6% -6%
11%
-2%
-60%
-40%
-20%
0%
20%
40%
60%
80%
100%
Mar-08 Mar-09 Mar-10 Mar-11 Mar-12 Mar-13 Mar-14 Mar-15 Mar-16 Mar-17
Ab
so
lute
re
turn
s (
%)
Equity Debt Gold

62
Mutual funds the missing piece in asset allocation jigsaw
Choosing the right asset class to invest in can be a
complex task for the average investor. Mutual
funds have simplified this complexity with the
varied products they offer under the umbrella of
hybrid funds, providing a way out of the maze.
In addition to balanced funds, which invest the
bulk of their assets in equity, hybrid funds include
MIPs, which put up to 30% in equity and the
balance in debt securities. Given the mix, these two
categories offer the investor a complete package
for simplifying asset allocation between equity and
debt.
The industry also offers some other types of asset
allocation funds, which in turn invest in other
equity and debt funds – this category is called fund
of funds. Then there are multi-asset funds that
invest not only in equity and debt, but also in gold.
Thus, the variety within hybrid funds helps the
investor to choose the investment vehicle
according to his/her risk appetite. The increased
importance of financial planning and effective
portfolio building in recent times can act as a major
driver for increased interest in such funds in
future, just like in balanced funds.
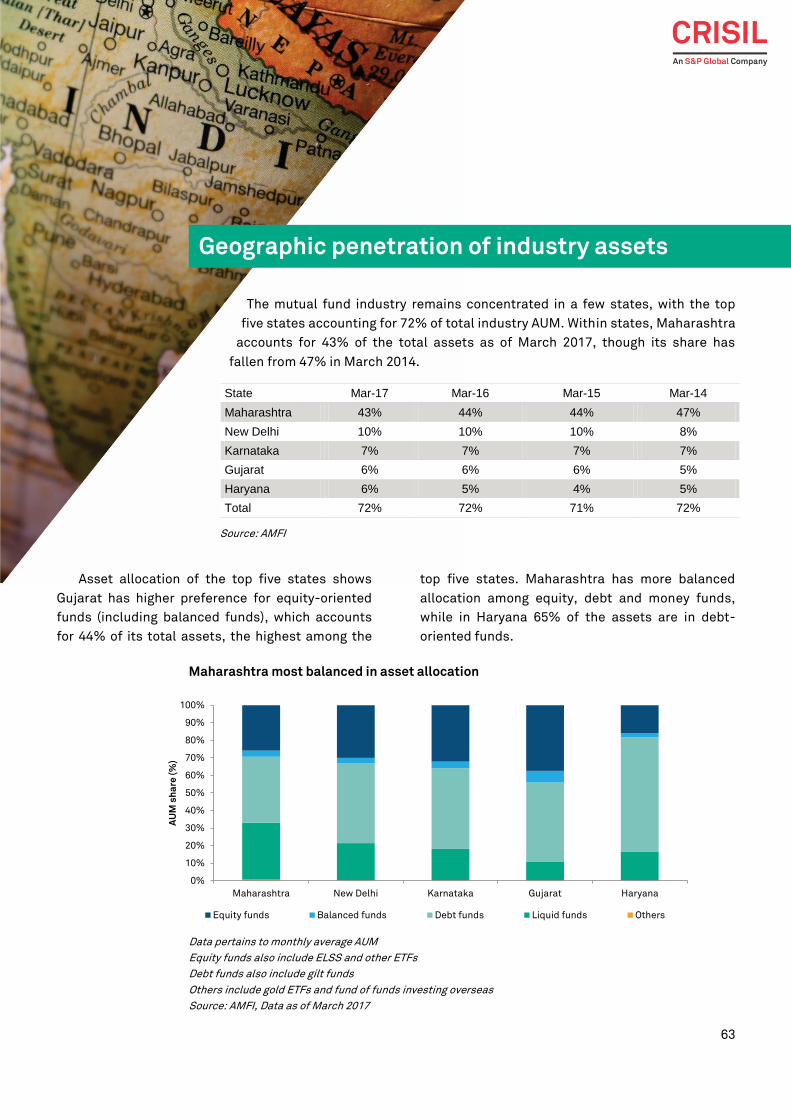
63
Geographic penetration of industry assets
The mutual fund industry remains concentrated in a few states, with the top
five states accounting for 72% of total industry AUM. Within states, Maharashtra
accounts for 43% of the total assets as of March 2017, though its share has
fallen from 47% in March 2014.
Source: AMFI
Asset allocation of the top five states shows
Gujarat has higher preference for equity-oriented
funds (including balanced funds), which accounts
for 44% of its total assets, the highest among the
top five states. Maharashtra has more balanced
allocation among equity, debt and money funds,
while in Haryana 65% of the assets are in debt-
oriented funds.
Maharashtra most balanced in asset allocation
Data pertains to monthly average AUM
Equity funds also include ELSS and other ETFs
Debt funds also include gilt funds
Others include gold ETFs and fund of funds investing overseas
Source: AMFI, Data as of March 2017
0%
10%
20%
30%
40%
50%
60%
70%
80%
90%
100%
Maharashtra New Delhi Karnataka Gujarat Haryana
AU
M s
ha
re (
%)
Equity funds Balanced funds Debt funds Liquid funds Others
State Mar-17 Mar-16 Mar-15 Mar-14
Maharashtra 43% 44% 44% 47%
New Delhi 10% 10% 10% 8%
Karnataka 7% 7% 7% 7%
Gujarat 6% 6% 6% 5%
Haryana 6% 5% 4% 5%
Total 72% 72% 71% 72%
Geographic penetration of industry assets

64
State-wise/ union territory-wise asset distribution
Blue colour denotes top five states by assets
Numbers below 0.05% have not been shown on the map
Source: AMFI

65
Mutual funds’ share of household savings increasing
Despite India being one of the fastest growing economies and enjoying its
demographic dividend, the bulk of the household savings in the country goes
into traditional investment avenues such as real estate and valuables,
accounting for 59%. Within financial savings, fixed deposits form the major
chunk (44%) of gross financial savings. The share of savings going into market-
linked products such as mutual funds is at deplorable levels.
However, Indian investors’ preference has seen a sea shift of late with the share of
mutual funds in financial savings rising from 0.77% in FY13 to 2.10% in FY16, thanks to the
fall in interest rates, which prompted investors to look for higher inflation-adjusted returns.
Mutual funds’ share of household savings
increasing

66
Data pertains to FY16
Source: MOSPI
Falling interest rates in the economy prompted investors looking for higher inflation-adjusted returns
resulting in transformational change in financial saving pattern
Net
financial
savings
41%
Savings in
physical
assets
57%
Savings in
valuables
2%
Composition of household financial
savings
0.93%0.77%
1.26%1.10%
2.10%
0.00%
0.50%
1.00%
1.50%
2.00%
2.50%
FY12 FY13 FY14 FY15 FY16
Sh
are
of
mu
tua
l fu
nd
s (
%)
Share of mutual funds in gross financial savings
Currency
13%
Deposits
44%
Shares and
debentures
1%
Mutual
funds
2%
Others
4%
Insurance,
provident
and pension
funds
36%
Composition of gross financial savings

67
Opportunity to invest in alternate investment avenues
For a long time, mutual fund offerings were limited to traditional asset
avenues such as equity, debt and cash equivalents. However, in recent years,
the bouquet has widened significantly, giving investors an opportunity to tap
newer products and asset classes, which would not be accessible to them given the
high level of knowhow and complexity involved.
Indeed, since mutual funds are a collective investment product, a unit holder can even
deploy small sums in alternate investment avenues such as real estate investment trusts
(REITs) and infrastructure investment trusts (InvITs), where the investing ticket size is high.
The secret path to REITs and InvITs
The development of infrastructure and
real estate sectors and their sub-segments
is the key to boosting economic growth. In a
bid to give these sectors access to new sources
of funds, SEBI, in August 2014, approved the
introduction of REITs and InvITs – investment
vehicles that pool money from investors and invest
in real estate and infrastructure assets,
respectively, whether directly or through a special-
purpose vehicle.
REITs and InvITs are similar to mutual funds, and
investors can aim for dividends and capital
appreciation. These instruments distribute income
from rentals, tolls and property/ infrastructure
assets as dividend, and the net asset value of the
units goes up when the property appreciates in
value.
As per the indicative structure seen below, a
sponsor sets up the REIT/InvIT, and money is
pooled from the investors. Then the sponsor
appoints a trustee, whose role is to oversee the
functions of the REIT/InvIT. The trustee appoints an
investment manager, whose function is to identify
and recommend investment opportunities and to
manage investments, besides ensuring reporting
and disclosures to stakeholders involved. Once
these steps are taken care of, a REIT or InvIT can
invest directly by acquiring real estate/
infrastructure assets, or through an SPV.
Opportunity to invest in alternate investment
avenues

68
Source: CRISIL Research
However, these products may be beyond the reach
of retail investors for two reasons: a) the high
investment ticket size and b) their complex
structure. The minimum investment ticket size for
an investor is Rs 2 lakh in REIT and Rs 5 lakh in
InvIT.
However, SEBI has permitted mutual funds to
invest up to 5% of their net asset values in
alternative securities, while capping it at 10% for a
single fund. Thus, a retail investor can take the
mutual funds route into these products as well.
Structured debt products
Given the fall in interest rates, globally and in India,
investors everywhere are in search of higher yields.
That is the reason for the growing popularity of
credit opportunity funds in recent years. These
funds provide investors an opportunity to invest in
structured debt products such as pass-through
certificates and market-linked debentures, which
are complex products and are; therefore;
inaccessible for the average person.
At a time when interest rates on traditional
avenues such as fixed deposits and other small-
savings schemes are on the decline, these new
innovative instruments offer a good opportunity for
retail investors to diversify investments to new
asset classes. In a symbiotic turn, the capital
inflows from mutual funds are expected to deepen
the market for these products in years to come.

69
AMFI’s Investor Awareness Campaign : ‘Mutual Funds Sahi
Hai’ – Making Mutual Funds a part of everyday conversations
A strong financial market with broad participation is essential for a developed
economy. Domestic savings play a very important role to fund investments for
building our economy, which otherwise must be financed with foreign capital.
In 1964, the Government of India established the country’s first mutual fund, namely,
Unit Trust of India with a view to encouraging saving and investment and participation in
the securities market and launched the country’s first mutual fund product, namely, Unit
Scheme-1964 – a highly popular product in those days. Mutual Fund investments gained
momentum after the Government opened up the sector to other players and also established the
securities market regulator, namely, Securities & Exchange Board of India (SEBI) in 1992.
Over the years mutual funds have created both income and wealth for investors. One can see a shift
with the changing demographic profile of the Indian population, with new products being launched to suit
different investor needs, coupled with financial awareness and literacy initiatives for investors both by the
MF industry and the regulator.
Despite the steady growth in the size of the assets managed by the Mutual Funds, the household investment in
mutual funds is still miniscule, with hardly 3-4% of the GDP being invested in the category. There is thus a
clear case of under-penetration of mutual funds among household sector in India. Traditionally, Indian
households have preference for physical assets like gold and real assets, despite a large pool of investment
opportunity in financial products. Even amongst financial products, fixed deposits and insurance products are
still seen as safe and reliable, (although their income potential is often insufficient for wealth creation or even
to beat the inflation). This mindset is one of the biggest stumbling blocks that makes people hesitate from
investing in mutual funds.
AMFI’s Financial Literacy committee, consisting of marketing and communications professionals from various
mutual fund AMCs, recognised that there was an urgent need to encourage households to shift from
traditional & physical savings to mutual funds and create a positive inclination towards mutual funds among
people and that we needed to carry simple but effective messages that could effectively convey that mutual
funds are ideal to help generate both income and long-term wealth creation and thereby transform ‘saving-
oriented behaviour’ of the people into ‘investing-oriented behaviour’.
While trying to analyse why people were shying away from mutual funds despite the same being one of the
ideal investment vehicles, AMFI’s communications team discovered a simple insight – that Mutual Funds do
not figure in everyday social conversations amongst people – mostly because of lack of awareness and certain
mindset.
AMFI’s Investor Awareness Campaign:
‘Mutual Funds Sahi Hai’ – Making Mutual Funds
a part of everyday conversations

70
With an objective to change this, AMFI under SEBI’s guidance, embarked on a nationwide investor awareness
and outreach program through a mass media campaign titled ‘Mutual Funds Sahi Hai’ with simple, but very
clear messaging through interesting advertisements in different languages through TV, digital, radio, print,
cinema etc.
With everyday situations as the backdrop, the ‘Mutual Funds Sahi Hai’ campaign impresses on the mind of the
prospective investors that mutual funds are the right option for them – ‘Mutual Funds Sahi Hai’ - as the tag
line of the campaign says. The campaign stems from the simple, honest and everyday conversations of people
- that could typically happen anywhere and between diverse kinds of people. The campaign talks about the
simplicity, believability and ubiquity of mutual funds and aims to demystify mutual funds and make them a
part of everyday conversation.
In the first phase, AMFI has released eight TV commercials, in eight languages, which bust various myths that
common investors have about Mutual Funds. Each TV commercial has a related print and radio advertisement.
The campaign is also being promoted across various leading websites and social media channels using digital
display banners and content integration.
With proliferation of smart phones, the digital media has become an important part of any 360-degree media
campaign. To leverage the digital media, AMFI has launched a microsite,
http://www.mutualfundssahihai.com/en where investors can find detailed information about mutual funds by
way of info graphics, videos and FAQs in English as well as Hindi. The microsite has a provision for investors to
post their queries relating to mutual funds. In just a short span of less than 3 months since launch, we have
received and replied to over 1000 queries.
In addition AMFI has also disseminated useful information for the investors on its website,
https://www.amfiindia.com/ under the section “Investors’ Corner” whereby one can locate the nearest mutual
fund office and mutual fund distributors or even invest online in different mutual funds.

71
Annexure Annexure
Sr No
Index Inception
date Definition
1 CRISIL-AMFI Equity Fund Performance Index
1-Apr-97 CRISIL-AMFI Equity Fund Performance Index seeks to track the performance of the equity funds. The index consist of mutual fund schemes from diversified equity, large cap equity and small and mid-cap equity categories
2 CRISIL-AMFI Large Cap Fund Performance Index
1-Apr-00 CRISIL-AMFI Large Cap Fund Performance Index seeks to track the performance of the large cap equity schemes
3 CRISIL-AMFI Small & Midcap Fund Performance Index
1-Oct-04 CRISIL-AMFI Small & Midcap Fund Performance Index seeks to track the performance of the small & midcap equity schemes
4 CRISIL-AMFI Diversified Equity Fund Performance Index
1-Apr-00 CRISIL-AMFI Diversified Equity Fund Performance Index seeks to track the performance of the diversified equity schemes
5 CRISIL-AMFI ELSS Fund Performance Index
1-Jun-01 CRISIL-AMFI ELSS Fund Performance Index seeks to track the performance of the Equity Linked Saving Scheme (ELSS)
6 CRISIL-AMFI Balance Fund Performance Index
1-Apr-00 CRISIL-AMFI Balanced Fund Performance Index seeks to track the performance of the balanced funds
7 CRISIL-AMFI MIP Fund Performance Index
1-Jan-02 CRISIL-AMFI MIP Fund Performance Index seeks to track the performance of the Monthly Income Plan (MIP) funds
8 CRISIL-AMFI Income Fund Performance Index
1-Apr-00 CRISIL-AMFI Income Fund Performance Index seeks to track the performance of the income funds
9 CRISIL-AMFI Gilt Fund Performance Index
1-Apr-00 CRISIL-AMFI Gilt Fund Performance Index seeks to track the performance of the gilt funds
10 CRISIL-AMFI Short Term Debt Fund Performance Index
1-Apr-02 CRISIL-AMFI Short Term Debt Fund Performance Index seeks to track the performance of the short term debt funds
11 CRISIL-AMFI Liquid Fund Performance Index
1-Apr-00 CRISIL-AMFI Liquid Fund Performance Index seeks to track the performance of the liquid funds
12 CRISIL-AMFI Ultra Short Fund Performance Index
1-Apr-07 CRISIL-AMFI Ultra Short Fund Performance Index seeks to track the performance of the ultra-short funds
13 Fixed Deposit (FD) Index (1 & 3 Years)
1-Apr-00
Fixed Deposit Indices have been constructed in the following manner:
Simple average of FD rates of SBI and ICICI bank for respective maturity till December 31, 2011. Starting January 1, 2012 we have used FD rates of top 3 (by total deposits) public and private sector banks
14 Savings Bank Rate Index 1-Apr-00
Savings Bank Rate Index has been constructed using the following savings rate for the given periods:
April 2000 to February 2003: 4.00% March 2003 to April 2011: 3.5% May 2011 to November 2011: 4.00% December 01, 2011 to till date : average savings rate of top 3 (by total deposits) public and private sector banks

72
Notes

73
Notes

74
Notes


Argentina | China | Hong Kong | India | Poland | Singapore | UK | USA
CRISIL Limited: CRISIL House, Central Avenue, Hiranandani Business Park, Powai, Mumbai – 400076. India
Phone: + 91 22 3342 3000 | Fax: + 91 22 3342 3001 | www.crisil.com
About CRISIL Limited
CRISIL is a global, agile and innovative analytics company driven by its mission of making markets function
better. We are India’s foremost provider of ratings, data, research, analytics and solutions. A strong track
record of growth, culture of innovation and global footprint sets us apart. We have delivered independent
opinions, actionable insights, and efficient solutions to over 100,000 customers.
We are majority owned by S&P Global Inc., a leading provider of transparent and independent ratings,
benchmarks, analytics and data to the capital and commodity markets worldwide.
About CRISIL Research
CRISIL Research is India's largest independent integrated research house. We provide insights, opinion and
analysis on the Indian economy, industry, capital markets and companies. We also conduct training programs to
financial sector professionals on a wide array of technical issues. We are India's most credible provider of
economy and industry research. Our industry research covers 86 sectors and is known for its rich insights and
perspectives. Our analysis is supported by inputs from our network of more than 5,000 primary sources,
including industry experts, industry associations and trade channels. We play a key role in India's fixed income
markets. We are the largest provider of valuation of fixed income securities to the mutual fund, insurance and
banking industries in the country. We are also the sole provider of debt and hybrid indices to India's mutual fund
and life insurance industries. We pioneered independent equity research in India, and are today the country's
largest independent equity research house. Our defining trait is the ability to convert information and data into
expert judgments and forecasts with complete objectivity. We leverage our deep understanding of the macro-
economy and our extensive sector coverage to provide unique insights on micro-macro and cross-sectoral
linkages. Our talent pool comprises economists, sector experts, company analysts and information
management specialists.
CRISIL Privacy Notice
CRISIL respects your privacy. We use your contact information, such as your name, address, and email id, to fulfil your
request and service your account and to provide you with additional information from CRISIL and other parts of S&P Global
Inc. and its subsidiaries (collectively, the “Company”) you may find of interest.
For further information, or to let us know your preferences with respect to receiving marketing materials, please visit
www.crisil.com/privacy. You can view the Company’s Customer Privacy at https://www.spglobal.com/privacy
Last updated: April 2016