quantitative view of the structure of institutional
TRANSCRIPT
Quantitative View of the Structure of Institutional ScientificCollaborations Using the Examples of Halle, Jena and Leipzig
Aliakbar Akbaritabar∗
AbstractExamining effectiveness of institutional scientific coalitions can inform future policies. This is a study
on the structure of scientific collaborations in three cities in central Germany. Since 1995, the threeuniversities of this region have formed and maintained a coalition which led to the establishment of aninterdisciplinary center in 2012, i.e., German Center for Integrative Biodiversity Research (iDiv). Weinvestigate whether the impact of the former coalition is evident in the region’s structure of scientificcollaborations and the scientific output of the new center. Using publications data from 1996-2018, webuild co-authorship networks and identify the most cohesive communities in terms of collaboration, andcompare them with communities identified based on publications presented as the scientific outcome ofthe coalition and new center on their website. Our results show that despite the highly cohesive structureof collaborations presented on the coalition website, there is still much potential to be realized. The newlyestablished center has bridged the member institutions but not to a particularly strong level. We see thatgeographical proximity, collaboration policies, funding, and organizational structure alone do not ensureprosperous scientific collaboration structures. When new center’s scientific output is compared with itsregional context, observed trends become less conspicuous. Nevertheless, the level of success the coalitionachieved could inform policy makers regarding other regions’ scientific development plans.
keywords: Internationalization, Co-authorship Network Analysis, Bipartite Community Detection,Universitätsbund Halle Jena Leipzig, German Center for Integrative Biodiversity Research (iDiv)
1 IntroductionIt is argued that scientific and complex economic activities are concentrated in urban and metropolitan areas(Balland et al., 2020). This concentration might be the result of a selective process of spatial proximitybetween knowledge-producing and -demanding institutions (Rammer, Kinne, & Blind, 2020). In specific casesand within a densely populated metropolitan region, there might be remnants of a historical divide puttingdistance between institutions (Abbasiharofteh & Broekel, 2020).
This concentration of scientific activities in metropolitan and urban areas could inspire strategiccoalitions between scientific institutions (e.g., academic and non-academic organizations). Akbaritabar (2020)showed that geographical proximity and being located in a densely populated metropolitan area, i.e., Berlin,was not enough for institutional collaboration ties to form. A history of division and competition on theone hand and coalitions and policies to foster regional cooperation on the other hand can lead to a complexscientific landscape and structure of scientific collaborations.
Specific disciplines might present a tendency toward higher or lower internationalization of scientificcollaborations. They might have a quality of being more or less interdisciplinary which can change over time(Craven et al., 2019). These disciplines might have a global division of labor in that some researchers locatedin specific geographical areas might focus on specific themes or carry out only parts of the research work (e.g.,data gathering and field work (Boshoff, 2009) and hence the reason some researchers call for a more equalfooting and benefit from scientific collaborations (Habel et al., 2014)). Biodiversity is one of these disciplines
∗German Centre for Higher Education Research and Science Studies (DZHW), Berlin, Germany; [email protected];[email protected]; ORCID = 0000-0003-3828-1533 (Corresponding Author)
1
arX
iv:2
101.
0578
4v1
[cs
.DL
] 1
4 Ja
n 20
21
and previous research has shown a high degree of geographical specialization in this discipline. However,there might be an imbalance between the human resources and funding sources on the one hand versus wherethe biodiversity of natural environment exists on the other hand, leading to researchers from Europe andNorth America being the main producers of the knowledge about other geographical areas (mainly located inthe global south) (Tydecks, Jeschke, Wolf, Singer, & Tockner, 2018).
Studying structure of scientific collaborations in different contexts can reveal potential reasons behindobserved strategic coalitions. There might be disciplinary, national, regional or continental specificitiesplaying a role in determining which institutions collaborate. Shrum, Genuth, Carlson, Chompalov, & Bijker(2007) studied structures of scientific collaborations in multi-organizational research projects. They analyzedtranscripts of interviews done in 1990s with scientists and administrative staff of different seniority levelsfrom 53 projects in physical sciences. Although their sample included mainly large scale research projectsand mostly from North America, however, they provided a useful typology of these collaborations. They usedbureaucracy1 and technology2 as two main concepts to study how these collaborations form, raise funding,gather the data, own, share and analyze it and how they publish the results of the analysis. They investigatedthe division of labor, leadership structure, formalization and hierarchy in these collaborations. They found thatformation process is mainly shaped by the level of complexity required by the collaboration. They proposeda fourfold typology based on organization of collaborations: bureaucratic (with a formalized structure andclear regulation of the decision making process which is mostly the case for larger collaborations), leaderless(similar to bureaucratic but with multiple leaders), non-specialized (semi-bureaucratic with lower levelsof formalization) and participatory (a communitarian and democratic structure of decision making andcollaboration). Even bureaucratic and semi-bureaucratic collaborations limited the scope of formal proceduresto give members independence and autonomy in matters concerning production of scientific results. Theypresented an impersonal type of trust among scientific collaboration partners that is proved effective in theselarge scale projects where collaboration could happen between partners from diverse sectors who did not knoweach other beforehand (e.g., brokered collaboration) or partners with previous history of competition thatmight join forces to build a new technology. In these contexts, it is hard for individual researchers to interactand form interpersonal trust. Instead, bureaucracy plays an intermediating role to make these collaborationspossible. Thus, researchers and governing bodies of these collaborations establish more (or in some cases less)formalized regulations on how to use the technology, share the ownership of the new instruments and obtainedresults and how to resolve conflicts. They presented a main exception, i.e., particle physics, where researcherswere being socialized from when they were postgraduate students to have a collaborative spirit. The mainreason was the scope and complexity of the projects in this subfield that would be impossible without externalcollaborations among multiple organizations. They suspected whether studies on this exceptional subfieldmight have shaped the narrative around the prevalence of the team science.
Subsequent to Akbaritabar (2020)’s study on structure of scientific collaborations in Berlin metropolitanregion, here, we focus on a geographical area in central Germany consisting of the three cities of Halle(Saale), Jena, and Leipzig (i.e., HJL cities). These cities have a total population of 843,790 (about 25% ofBerlin)3. We selected these three cities as, since 1995, the three universities located there have maintained anagreement to foster interdisciplinary collaborations and formed a coalition named Unibund4. In addition,from 2012 this coalition in collaboration with eight other non-university research institutions has establishedan interdisciplinary center, i.e., German Center for Integrative Biodiversity Research (iDiv)5 (see Table 1 forthe list of members). iDiv received two funding phases from the German Science Foundation (DFG)6 for2012 till 2016 and 2016 till 2020.
We analyze this strategic coalition as a natural experiment that has lasted 25 years and created anew organizational form. We aimed to investigate the coalition’s effect in shaping the structure of scientific
1A formalized hierarchical structure with defined division of labor, goals and means to achieve them.2Scientific endeavor in the studied fields is highly dependent on complex technology to gather information and produce
scientific results.3Population counts from: https://worldpopulationreview.com/countries/cities/germany accessed on October 8th 2020.4Universitätsbund Halle Jena Leipzig, https://mitteldeutscher-unibund.de/ueber-uns/ accessed on October 8th 2020.5Deutsches Zentrum für integrative Biodiversitätsforschung (iDiv) Halle-Jena-Leipzig, https://www.idiv.de/en/about-idiv.html
accessed on October 8th 2020.6Deutsche Forschungsgemeinschaft, DFG.
2
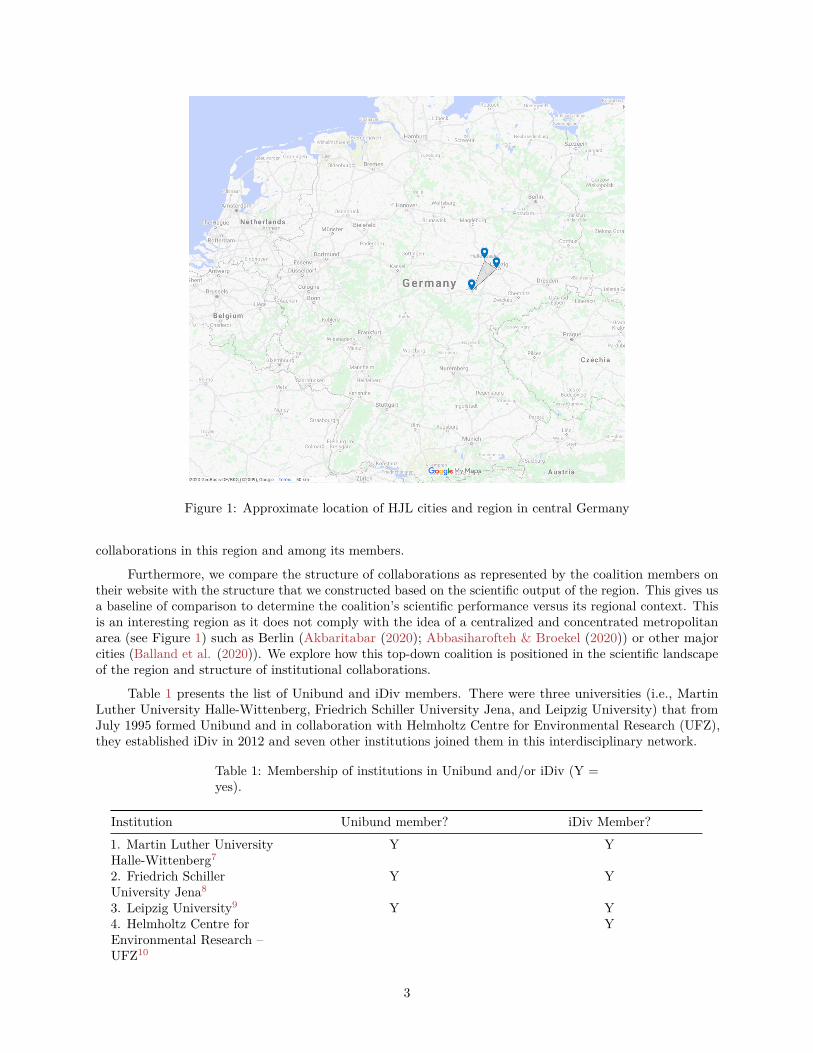
Figure 1: Approximate location of HJL cities and region in central Germany
collaborations in this region and among its members.
Furthermore, we compare the structure of collaborations as represented by the coalition members ontheir website with the structure that we constructed based on the scientific output of the region. This gives usa baseline of comparison to determine the coalition’s scientific performance versus its regional context. Thisis an interesting region as it does not comply with the idea of a centralized and concentrated metropolitanarea (see Figure 1) such as Berlin (Akbaritabar (2020); Abbasiharofteh & Broekel (2020)) or other majorcities (Balland et al. (2020)). We explore how this top-down coalition is positioned in the scientific landscapeof the region and structure of institutional collaborations.
Table 1 presents the list of Unibund and iDiv members. There were three universities (i.e., MartinLuther University Halle-Wittenberg, Friedrich Schiller University Jena, and Leipzig University) that fromJuly 1995 formed Unibund and in collaboration with Helmholtz Centre for Environmental Research (UFZ),they established iDiv in 2012 and seven other institutions joined them in this interdisciplinary network.
Table 1: Membership of institutions in Unibund and/or iDiv (Y =yes).
Institution Unibund member? iDiv Member?1. Martin Luther UniversityHalle-Wittenberg7
Y Y
2. Friedrich SchillerUniversity Jena8
Y Y
3. Leipzig University9 Y Y4. Helmholtz Centre forEnvironmental Research –UFZ10
Y
3
Institution Unibund member? iDiv Member?5. Max Planck Institute forBiogeochemistry (MPIBGC)11
Y
6. Max Planck Institute forChemical Ecology (MPICE)12
Y
7. Max Planck Institute forEvolutionaryAnthropology13
Y
8. Leibniz Institute GermanCollection ofMicroorganisms and CellCultures (DSMZ)14
Y
9. Leibniz Institute of PlantBiochemistry (IPB)15
Y
10. Leibniz Institute ofPlant Genetics and CropPlant Research (IPK)16
Y
11. Leibniz InstituteSenckenberg Museum ofNatural History (SMNG)17
Y
iDiv is the youngest among seven research centers currently funded by the DFG. The goal of the DFG’sfirst funding phase (2012-2016) was to establish the center to facilitate cooperation in later stages e.g., in thesecond funding phase (2016-2020). This is the first time the DFG has funded a research center developed by aconsortium of three universities and eight non-university research institutions, particularly as the institutionsare located in three different federal states. iDiv is a disciplinary integration of biology, chemistry, physics,geosciences, economics, social sciences and computer sciences. The biodiversity field is known to be highlyinterdisciplinary (Tydecks, Jeschke, Wolf, Singer, & Tockner, 2018; Craven et al., 2019), nevertheless, themain focus of iDiv is in natural sciences. iDiv has four main research areas: 1) biodiversity patterns, 2)biodiversity processes, 3) biodiversity functions, and 4) biodiversity and society. iDiv has successfully obtainedsupport from the local government bodies. From 2012 Saxony (Freistaat Sachsen) provided 2,600 m2 space forthe buildings and offices in Leipziger BioCity. Thuringia and Saxony-Anhalt (Thüringen und Sachsen-Anhalt)have four professorship chairs for this cooperation. iDiv’s website states having 350 employees from 30different nations.
Based on this introduction and background, we explore the interplay between different contextualvariables and geographical proximity to investigate the structure of scientific collaborations in the HJL region.We specifically focus on the Unibund and iDiv to identify how these strategic coalitions are positioned in thestructure of the region’s scientific collaborations. Therefore, after presenting the effect of disambiguationof scientific organizations’ names on the structure of scientific collaborations as our main methodologicalcontribution, we formulate and investigate the following macro, quantitative, and exploratory researchquestions:
7https://ror.org/05gqaka338https://ror.org/05qpz1x629https://ror.org/03s7gtk40
10https://ror.org/000h6jb2911https://ror.org/051yxp64312https://ror.org/02ks5321413https://ror.org/02a33b39314https://ror.org/02tyer37615https://ror.org/01mzk557616https://ror.org/02skbsp2717https://ror.org/05jv9s411
4
• RQ1: How collaborative and internationalized is the scientific landscape of the HJL region?
• RQ2: Are there disciplinary differences in the rate of collaborative and internationalized scientificwork?
• RQ3: How regionally- or continentally-oriented is scientific collaboration in the HJL region?
• RQ4: How sector-oriented is scientific collaboration in the HJL region?
• RQ5: Are there specific disciplinary, sectoral, national or continental cohesive subgroups driving thescientific collaborations in the HJL region?
• RQ6: Can we find evidence of Unibund’s effect as a strategic coalition on the structure of scientificcollaborations network in the HJL region?
• RQ7: Can we find evidence of iDiv’s effect as a new organizational form on the structure of scientificcollaborations network in the HJL region?
• RQ8: How cohesively do Unibund and iDiv member institutions collaborate among themselves?
The contributions of this paper are threefold: 1) We focus on the scientific output of the HJL region,present the share of collaborative works, and identify the share of international collaborations. We differentiateHJL region, Berlin, Germany, Europe and continental regions worldwide to investigate possible groupings.We examine the effectiveness of the institutional scientific coalition in HJL region. To do so, we compareUnibund and iDiv’s self-represented scientific output and institutional collaboration structure with thestructure constructed from the larger context of HJL region. 2) We compare all OECD scientific fields on thestructure of collaborations and we include a sectoral view based on the type of organization involved in thecollaborations. 3) We present the effect of the organization name disambiguation on results and employ abipartite network modeling and bipartite community detection approach and present how it can be useful inthe identification of denser collaborative structures.
We present our data source and modeling strategy in the Data and Methods section, and summarizeour main findings in the Results section, followed by the Discussion and Conclusions section.
2 Data and MethodsWe used two publication datasets. First, to delineate all scientific output of the iDiv, we used all publicationslisted on their website18. We found a total of 2,583 records (including 18 code, 66 data, 2,393 DOI, and106 PDF). We excluded those without or with problematic DOIs and searched the remaining records (2,371unique DOIs) in Scopus 2019 from the German Bibliometrics Competence Center (KB)19. The KB databasewas updated until April 2019, thus it did not include all publications from 2019 and 2020. Therefore, weextracted matching records up to the end of 2018 (1,749 unique records, 74%).
In parallel, to use as a baseline for comparison, we extracted all article, review and conference proceedingsdocuments published from the beginning of the database in 1996 until the end of 2018 with at least oneauthoring organization from Halle, Saale, Jena or Leipzig. Our purpose here was to find both publications fromiDiv and its predecessor, Unibund, and compare how the former coalition and its established interdisciplinarycenter are positioned in the larger structure of scientific collaborations in the region. Please note that Unibudhad a larger scope than iDiv’s disciplinary focus in biodiversity, nevertheless, we investigate whether priorcoalition fostered closer collaboration ties in case of the iDiv.
In both cases (i.e., iDiv web and HJL cities), we included organizations worldwide who have collaboratedwith at least one Unibund or iDiv member. Our level of analysis was scientific organizations (i.e., eachacademic or non-academic affiliation mentioned in a publication) and we do not investigate lower levels e.g.,authors, since our goal is to identify the structure of scientific collaborations among organizations.
18https://www.idiv.de/en/research/publications.html (accessed on July 30th 2020)19Kompetenzzentrum Bibliometrie (KB), http://bibliometrie.info
5

The data included meta-data for each publication such as publication year, title, affiliation addresses,scientific field, journal name and document type. We used a mapping of publications to OECD scientificfields based on Scopus ASJC20 that reduces the number of subject categories from 33 to 6. We compared theaggregate data of iDiv web and HJL cities with trends of different OECD scientific fields i.e., AgriculturalSciences (AS), Engineering Technology (ET), Natural Sciences (NS), Medical and Health Sciences (MHS),Humanities (H) and Social Sciences (SS). As some publications are assigned to multiple fields, in the aggregateanalysis, we used the first assignment of each publication, but in a single field view, we take all publicationswith any class assignment in the given field, thus, interdisciplinary publications are covered separately in alltheir assigned fields.
We used the complete string of affiliation addresses to disambiguate institutions names and obtainfurther information (i.e., country, geographical coordinates (longitude and latitude) of the main address andtype of organization as education, non-profit21, company, government, health-care, facility22, archive23 andother, see Global Research Identifier Database (GRID) policies24) from the Research Organization Registry(ROR) API25. ROR aggregates data from GRID, ISNI26, Crossref and Wikidata27. We used the ROR snapshotfrom November 7th 2019. This disambiguation method takes into account different name spellings, includingmisspellings, acronyms, and multiple languages. It is important to note that in disambiguated versions of thedata presented in the results section, we include only publications for which all contributing organizations aredisambiguated and exclude those publications with one or more non-disambiguated co-authoring organizations.This reduces our coverage of publications, but gives more reliable results as non-disambiguated data can leadto multiple representation of similar organizations in the structure and produce misleading results.
To evaluate the quality of ROR disambiguation results, we chose a random sample of 100 organizations.A research assistant searched online for the organization names from Scopus and the disambiguated namefrom ROR to find the original address and confronted the two names to determine whether the match wasreliable. The results indicated that in only 4% of the cases a false match was assigned and 96% of cases werereliable matches.
We constructed bipartite co-authorship networks (Breiger, 1974) using ties between publications andorganizations (Katz & Martin, 1997). We treated each single publication as an event where organizations,through collaboration between their members, interacted to produce an academic text (Biancani & McFarland,2013). Studies on co-authorship networks usually use a one-mode projection of these bipartite networks(Newman, 2001b, 2001a). The problem with this projection is twofold. First, different structures in two-modenetworks are projected to the same one-mode structure which causes information about the underlyingstructure to be lost. Second, the one-mode projection can present an artificially higher density and connectivitydue to publications with high number of authors that project to maximally connected cliques. By adoptingmethods and modeling strategies specifically developed for bipartite networks we are able to resolve theshortcomings.
To identify possible geographical, disciplinary and/or sector-based coalitions between scientific organiza-tions, we extracted the largest connected component of the co-authorship network, i.e., the giant component,and investigated it further. Our aim was to see if there are cohesive subgroups of organizations preferentiallycollaborating among themselves. We investigated the potential underlying factors behind these groupings.
To identify communities of co-authorship, we used bipartite community detection by Constant Pottsmodel (CPM). CPM is a specific version of Potts model (Reichardt & Bornholdt, 2004) proposed by Traag,
20All Science Journal Classification21Organization that uses its surplus revenue to achieve its goals. Includes charities and other non-government research funding
bodies. Example, the Max Planck Society itself (grid.4372.2)22A building or facility dedicated to research of a specific area, usually contains specialized equipment. Includes telescopes,
observatories and particle accelerators. Example: child institutes of the Max Planck Society (e.g., Max Planck Institute forDemographic Research, grid.419511.9)
23Repository of documents, artifacts, or specimens. Includes libraries and museums that are not part of a university. Example,New York Public Library (grid.429888.7)
24https://www.grid.ac/pages/policies25https://ror.org/about26International Standard Name Identifier, https://isni.org/27https://www.wikidata.org
6

Table 2: HJL organizations co-authorship networks using non-disambiguated and disambiguated data (G =giant component, Scopus 1996-2018)
Metrics Non disambiguated web Disambiguated web Non disambiguated cities Disambiguated citiesN. of connected components 228 1 61,906 22N. of biparitite nodes 14,577 1,604 617,248 86,233N. of biparitite edges 16,485 4,312 631,291 168,078% of biparitite nodes in G 87 100 55 100% of biparitite edges in G 90 100 65 100N. of organizations 12,828 686 462,426 6,289N. of organizations in G 11,243 686 264,938 6,268N. of publications 1,749 918 154,822 79,944N. of publications in G 1,462 918 75,055 79,894
Table 3: HJL organizations co-authorship networks in different OECD scientific fields (w = web, c = cities,G = giant component)
Metrics AS_w AS_c ET_w ET_c H_w H_c MHS_w MHS_c NS_w NS_c SS_w SS_cN. of connected components 4 8 1 18 1 18 4 17 1 17 1 19N. of biparitite nodes 505 7,881 68 19,511 6 2,993 316 31,317 1,511 60,682 144 9,842N. of biparitite edges 1,026 14,279 87 34,578 5 4,080 578 55,259 3,966 122,102 216 15,880% of biparitite nodes in G 98 100 100 100 100 98 98 100 100 100 100 99% of biparitite edges in G 99 100 100 100 100 99 99 100 100 100 100 100N. of organizations 279 1,816 51 2,469 5 687 167 3,357 655 5,316 95 1,646N. of organizations in G 270 1,809 51 2,449 5 669 163 3,341 655 5,300 95 1,623N. of publications 226 6,065 17 17,042 1 2,306 149 27,960 856 55,366 49 8,196N. of publications in G 223 6,055 17 17,008 1 2,279 146 27,935 856 55,337 49 8,158
Van Dooren, & Nesterov (2011) as a resolution-limit-free method. It resolves the resolution limit problem inmodularity (Newman, 2004) which can obstruct detection of small communities in large networks (Traag,Waltman, & van Eck, 2019). We use the implementation in the Leidenalg28 library in Python. Communitydetection emphasizes the importance of links within communities rather than those between them. CPM usesa resolution parameter γ (i.e., “constant” in the name), leading to communities such that the link densitybetween the communities (external density) is lower than γ and the link density within communities (internaldensity) is more than γ. We set 6×10⁻³ as the resolution parameter in the case of all networks, i.e., aggregatedata and scientific fields. We chose this parameter after exploration of the number of communities detectedin contrast to the number of organizations and publications included in each bipartite community to preventhaving too many or too few organizations in communities or an extremely high number of communities whichwill not be interpretable.
3 ResultsTable 2 presents descriptive information about the co-authorship networks constructed using non-disambiguated and disambiguated data from iDiv website and HJL cities. The lower number of connectedcomponents and decrease in the number of organizations in the disambiguated version of the networks showthat in the non-disambiguated data there were multiple representations of the same institution that neededto be resolved before further analysis. Note that the disambiguation results differ slightly between the twocases and the overlap from the web sample to cities is 828 publications (90%), which is due to non-matchingDOIs. Note also that we excluded publications for which one or some of coauthoring organizations were notsuccessfully disambiguated, which increases the quality and reliability of our data but decreases our coverage.Table 3 shows the networks constructed for each scientific field with web and cities data after disambiguation,which shows the highest share of publications were in Natural Sciences (NS). Ninety-three percent of iDiv’spublications were categorized as NS, which aligns with the center’s primary focus in this field.
Figure 2 presents a temporal comparison between scientific fields on the one hand and publicationspresented on iDiv website (top) and three cities (bottom) on the other hand. Humanities and Social Sciences(which are green and red lines at the bottom) have sharply increased, which is the case for all Germany
28https://github.com/vtraag/leidenalg
7
previously presented in Stahlschmidt, Stephen, & Hinze (2019) and has to do with both an actual increase inpublications, and increase in Scopus’s coverage. For most fields, the gap between the two lines with the samecolor (i.e., raw and fractional counts) are stable which shows the maturity of the collaboration trajectory inthe HJL region (RQ1-2).
Figure 3 presents the level of internationalization of collaborations (RQ1-2). iDiv (shown in theuppermost part on the right) is a highly exceptional case in that from 2013 it starts with about 50%international publications and arrives at about 75% in 2018. The trends of the HJL cities show theprevalence of intra-Germany collaborations has decreased in the most recent years. Conversely, internationalcollaboration has increased in all fields, with AS, NS, and to a lesser extent ET, holding the highest rates ofinternationalization, although these are still below 50% in most years.
Figure 4 presents a macro picture of the sectoral diversity (RQ3-4) of the institutions collaboratingwith HJL region (i.e., cities) or iDiv (i.e., web). In some countries (e.g., the more industrially developed andwestern ones indicated with warmer colors) there are representatives from all sectors active in research andpublishing. Education and facility (e.g., Max Planck society institutes or Leibniz society institutes) were themost prolific sectors. There was an interesting difference between iDiv’s collaborators worldwide and thepicture from all institutions in the HJL region (including iDiv members). For example, while in educationand facility, the trend of iDiv’s collaborations was similar to HJL region, regarding companies (e.g., businesssector) and health-care, it is highly different from the HJL region and shows the specific sectoral focus ofthis new organizational form. Table 4 presents the top five countries in each sector, further highlighting thedifferences between the web and cities datasets and the dominance of education and facility organisations inresearch activity. The USA and China are the only collaborators among these five located outside Europe.
8

1
10
100
2013 2014 2015 2016 2017 2018
Num
ber
of P
ublic
atio
ns (
log
scal
e)iDiv Web
10
100
1,000
1996
1997
1998
1999
2000
2001
2002
2003
2004
2005
2006
2007
2008
2009
2010
2011
2012
2013
2014
2015
2016
2017
2018
Year
Num
ber
of P
ublic
atio
ns (
log
scal
e)
HJL cities
Field
AS ET
H MHS
NS SS
Count Type Fractional Raw
Figure 2: Raw and fractional count of HJL publications by OECD fields (top, web, bottom, cities, 1996-2018,Scopus, fractional count based on organizations) 9

0
25
50
75
100
199619
9719
9819
9920
0020
0120
0220
0320
0420
0520
0620
0720
0820
0920
1020
1120
1220
1320
1420
1520
1620
1720
18
Aggregate (cities)
0
25
50
75
100
2013
2014
2015
2016
2017
2018
Aggregate (web)
0
25
50
75
100
199619
9719
9819
9920
0020
0120
0220
0320
0420
0520
0620
0720
0820
0920
1020
1120
1220
1320
1420
1520
1620
1720
18
Per
cent
AS (cities)
0
25
50
75
100
199619
9719
9819
9920
0020
0120
0220
0320
0420
0520
0620
0720
0820
0920
1020
1120
1220
1320
1420
1520
1620
1720
18
ET (cities)
0
25
50
75
100
199619
9719
9819
9920
0020
0120
0220
0320
0420
0520
0620
0720
0820
0920
1020
1120
1220
1320
1420
1520
1620
1720
18
NS (cities)
0
25
50
75
100
199619
9719
9819
9920
0020
0120
0220
0320
0420
0520
0620
0720
0820
0920
1020
1120
1220
1320
1420
1520
1620
1720
18
MHS (cities)
0
25
50
75
100
199619
9719
9819
9920
0020
0120
0220
0320
0420
0520
0620
0720
0820
0920
1020
1120
1220
1320
1420
1520
1620
1720
18
Year
H (cities)
0
25
50
75
100
199619
9719
9819
9920
0020
0120
0220
0320
0420
0520
0620
0720
0820
0920
1020
1120
1220
1320
1420
1520
1620
1720
18
Year
SS (cities)
Country Status Multiple Countries pubs Single Country (DEU)
Figure 3: Share of intra-Germany versus multiple country co-authorship, top row, aggregate in cities andweb, bottom rows, different fields for cities data (1996-2018, Scopus)10
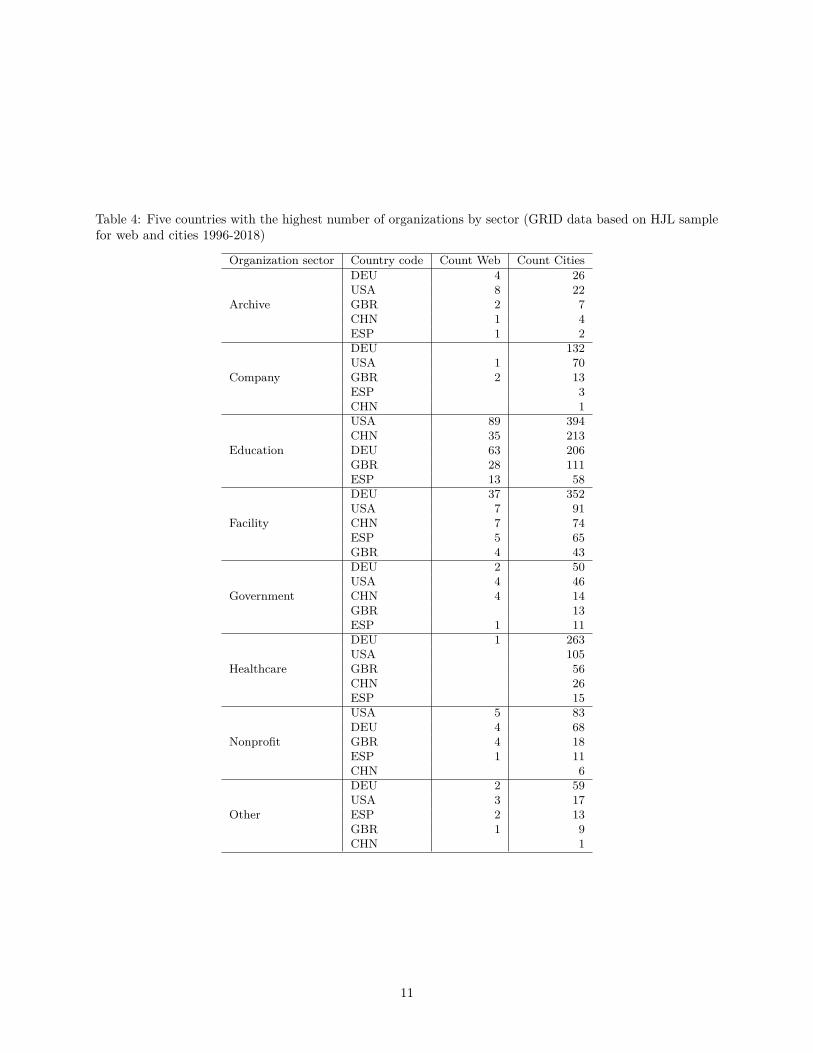
Table 4: Five countries with the highest number of organizations by sector (GRID data based on HJL samplefor web and cities 1996-2018)
Organization sector Country code Count Web Count CitiesDEU 4 26USA 8 22GBR 2 7CHN 1 4
Archive
ESP 1 2DEU 132USA 1 70GBR 2 13ESP 3
Company
CHN 1USA 89 394CHN 35 213DEU 63 206GBR 28 111
Education
ESP 13 58DEU 37 352USA 7 91CHN 7 74ESP 5 65
Facility
GBR 4 43DEU 2 50USA 4 46CHN 4 14GBR 13
Government
ESP 1 11DEU 1 263USA 105GBR 56CHN 26
Healthcare
ESP 15USA 5 83DEU 4 68GBR 4 18ESP 1 11
Nonprofit
CHN 6DEU 2 59USA 3 17ESP 2 13GBR 1 9
Other
CHN 1
11

Other
Cities
Other
Web
Healthcare
Cities
Healthcare
Web
No Collaborator
No Collaborator
Nonprofit
Cities
Nonprofit
Web
Education
Web
Facility
Cities
Facility
Web
Government
Cities
Government
Web
Archive
Cities
Archive
Web
Company
Cities
Company
Web
Education
Cities
0
100
200
300
n
Figure 4: Countries worldwide collaborating with HJL (cities) or iDiv (web) by sector (color: N. of organizations. If a country does not have presencein a sector, it is shown in "No Collaborator")
12
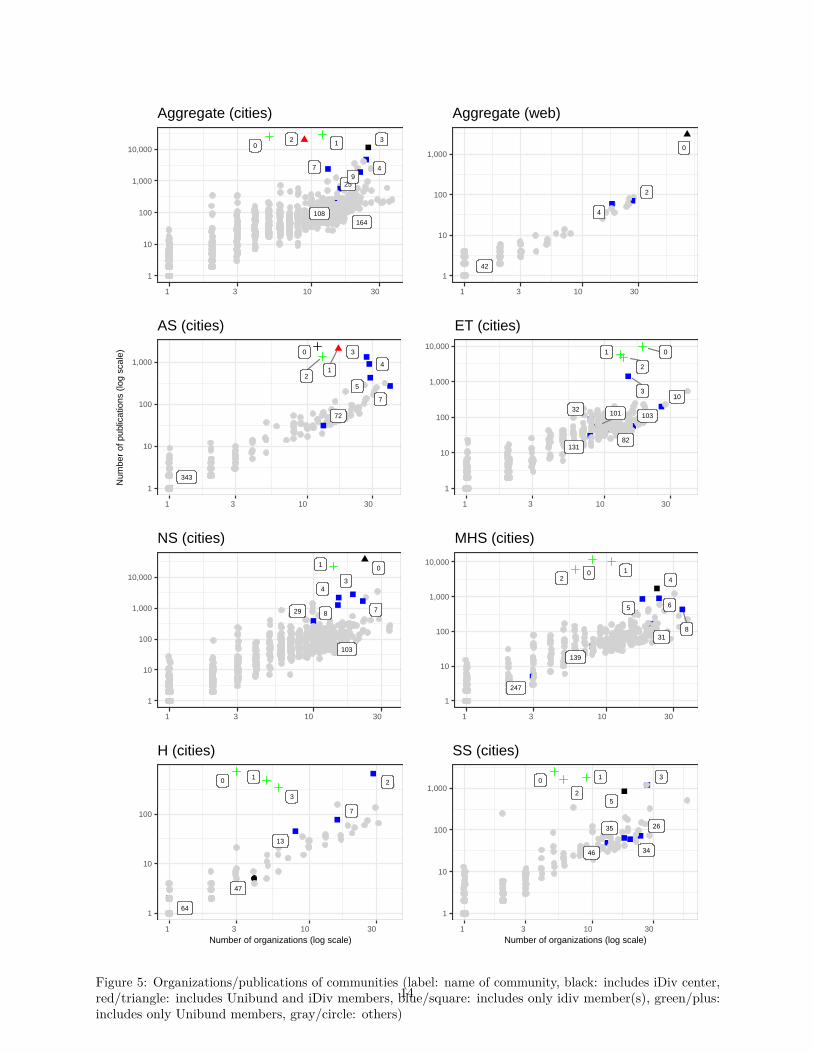
Figure 5 presents the communities identified from the giant component of iDiv web and HJL cities(RQ5-8). In the case of cities, it presents scientific fields separately. Note that in both cases, all Unibundand iDiv members are part of the giant component which is connected in itself. But, some institutions formedadditional collaboration ties with one another, leading to denser areas in the giant component. Our first aimwas to identify these denser areas and the underlying factors behind these higher densities and groupings.The labels printed beside some of the dots show the names of the communities. Each dot or shape shows onecommunity including multiple institutions. The count of institutions in each community is indicated on theX axis which has a log scale. The Y axis shows the aggregate number of publications by those institutions ina community on a log scale. The gray circles show communities which did not contain an Unibund or iDivmember. If a community includes only Unibund members, it is indicated with a green plus, and if it includesonly iDiv members, a blue square is used. When the iDiv center itself is in a given community, the color isset to black. When a community includes a combination of iDiv and Unibund members, color is set to redand shape is set to triangle. Therefore, if high cohesiveness exists, we expect to see a black triangle.
In the case of iDiv publications (i.e., web), shown in the uppermost right-hand panel, except for threecommunities with iDiv members (i.e., blue squares), all other institutions (i.e., iDiv center itself, Unibundand iDiv members) are located in the most prolific community, i.e., 0, which indicates a high cohesion incollaborations. When the larger context of the HJL cities is considered, which still includes iDiv and Unibundmembers but they are placed in the regional context along with other institutions and their collaboratorsworldwide, then the identified denser areas of the giant component are further apart from each other. This ispresented in the aggregate of cities in the uppermost left-hand panel where there are two green pluses withUnibund members, a triangle with an Unibund member and one iDiv member, versus multiple communitieswith iDiv members. We present the variation among scientific fields only in the case of the cities, since foriDiv web, only a small number of publications (7%) were assigned to fields other than NS. The structureof collaborations is closest between cities and iDiv web, only in the case of NS which is the main fieldof publication for iDiv and to a lesser extent in AS. But, even in NS there are six separate communitieswith iDiv members and iDiv center is located in community 0 with two Unibund members. In all otherfields, Unibund and iDiv members are located in separate communities, which indicates a lower cohesivecollaboration structure in contrast to iDiv web sample. As we discuss next, it can also point to the disciplinarystrength and scientific focus of these institutions which leads to the formation of a distinct group of regional,national or global collaborators that goes beyond the coalition agreements in the framework of Unibund oriDiv.
Table 5 presents more detail on the communities (RQ5-8) that include Unibund and/or iDiv members(i.e., the communities indicated with labels on figure 5). It highlights the diversity of community membersbased on the percentage share of geographical regions and sectors. In geographical regions we differentiatebetween HJL cities, Berlin, Germany and Europe to differentiate local, national, continent or global basedcollaborations. In case of iDiv publications (i.e., Aggregate web), community 0 has 77 member institutions,includes all Unibund and five of iDiv members, plus the iDiv center itself. It also shows a high rate ofgeographical diversity with members coming from all regions. But, in the larger context (e.g., cities), iDivis located in community 3 with only one other iDiv member institute. The geographical composition ofthis community is mainly focused on Germany, Europe and HJL cities with only 4% of members fromOceania which is a highly different composition in contrast to community 0 in the iDiv web. Other iDiv andUnibund members are located in separate communities. While communities with Unibund members are lessgeographically diverse and mainly focused in Germany and Europe, communities with iDiv members havemore international members. In terms of sectors, the majority of the community members are composedof education and facility. Government institutions are present only in communities with iDiv members.Health-care and non-profits are present in only a few of the communities. In the scientific fields, on theone hand, in most cases communities including Unibund members are composed of local and Europeaninstitutions. Exceptions include four out of 17 communities i.e., community 1 in AS, community 0 in ET,community 1 in NS and community 3 in H where Unibund members have collaborated with institutions fromother geographical regions. On the other hand, all of the communities with iDiv members are composed ofinternational and global institutions. Communities where iDiv center is located (see rows with bold font andgray background) follow the latter rule, but to a lesser extent.
13
0 1
108164
2
25
3
479
1
10
100
1,000
10,000
1 3 10 30
Aggregate (cities)
0
2
4
42
1
10
100
1,000
1 3 10 30
Aggregate (web)
0
12
3
343
4
5
7
72
1
10
100
1,000
1 3 10 30
Num
ber
of p
ublic
atio
ns (
log
scal
e)
AS (cities)
01
10
101 103
131
2
3
32
82
1
10
100
1,000
10,000
1 3 10 30
ET (cities)
01
103
29
34
78
1
10
100
1,000
10,000
1 3 10 30
NS (cities)
0 1
139
2
247
31
4
5 6
8
1
10
100
1,000
10,000
1 3 10 30
MHS (cities)
0 1
13
2
3
47
64
7
1
10
100
1 3 10 30Number of organizations (log scale)
H (cities)
0 1
2
26
3
34
35
46
5
1
10
100
1,000
1 3 10 30Number of organizations (log scale)
SS (cities)
Figure 5: Organizations/publications of communities (label: name of community, black: includes iDiv center,red/triangle: includes Unibund and iDiv members, blue/square: includes only idiv member(s), green/plus:includes only Unibund members, gray/circle: others)
14

Table 5: Composition of the communities including Unibund and/or iDiv members by region and sector in aggregate and by fields (N = communitysize, P = aggregate publications, iDiv = Y; includes iDiv center, I = number of iDiv members, U = number of Unibund members)
Region (%) Sector (%)Data cluster N P iDiv I U Africa Americas Asia Berlin DEU Europe HJL cities Oceania No region Archive Company Education Facility Government Healthcare Nonprofit Other
0 5 24,616 1 20 20 60 60 20 201 12 29,608 1 25 17 50 8 42 42 172 9 20,127 1 1 67 33 67 333 25 11,481 Y 1 48 36 12 4 72 20 4 44 24 4,741 1 42 8 46 4 79 17 47 13 2,398 1 31 15 46 8 62 31 89 22 1,912 1 5 14 27 50 5 27 45 14 9 5
25 16 569 1 6 6 12 44 31 6 56 19 6 12108 15 208 1 7 27 27 40 47 33 7 7 7
Aggregate cities
164 17 109 1 6 6 12 76 18 6 29 35 6 60 77 3,061 Y 5 3 3 5 9 4 38 29 10 3 1 70 22 3 3 12 27 71 1 4 15 22 59 7 63 7 224 18 60 1 33 17 11 33 6 6 6 50 11 6 11 11Aggregate web
42 2 3 1 100 1000 12 2,298 Y 1 8 17 33 25 17 67 8 8 8 81 17 2,086 2 1 18 71 12 59 35 62 13 1,363 1 8 54 38 62 15 15 83 27 1,325 1 11 4 4 48 19 11 4 67 30 44 28 903 1 39 4 7 7 39 4 71 18 7 45 29 426 1 3 31 17 17 28 3 3 62 28 3 37 40 271 1 25 10 12 5 40 8 2 52 28 2 2 10 2
72 13 31 1 38 8 15 38 8 38 31 15 8
AS cities
343 1 1 1 100 1000 19 9,540 1 5 5 42 11 32 5 11 42 37 111 13 5,773 1 8 54 23 15 54 38 82 14 4,664 1 50 29 21 64 21 7 73 15 1,420 1 7 47 20 20 7 53 33 7 7
10 26 200 1 4 27 4 4 58 4 4 69 15 4 4 432 8 89 1 25 62 12 62 3882 11 46 1 9 18 36 9 18 9 9 73 18
101 9 58 Y 44 11 33 11 67 22 11103 16 57 1 38 25 25 6 6 56 38 6
ET cities
131 8 30 1 50 25 25 12 50 12 12 120 23 37,765 Y 1 2 9 57 9 26 78 221 14 21,880 1 7 7 29 14 36 7 14 43 36 73 19 2,785 1 37 11 47 5 79 214 15 2,191 1 7 13 20 13 33 7 7 60 407 22 1,694 1 5 23 14 45 5 9 5 32 36 18 5 58 15 1,253 2 13 33 33 13 7 40 53 7
29 10 384 1 10 70 20 10 20 40 10 10 10
NS cities
103 13 105 1 8 38 15 38 62 23 8 80 8 11,901 1 62 12 25 75 251 11 10,104 1 55 45 55 18 272 6 6,038 1 67 33 67 334 23 1,724 Y 1 4 39 43 13 4 61 22 4 95 18 862 1 6 22 28 33 6 6 67 17 11 66 24 894 1 58 8 4 25 4 75 21 48 35 429 2 6 34 20 3 11 23 3 3 57 34 6
31 21 167 1 57 14 10 14 5 62 24 14139 8 37 1 12 12 12 62 12 50 25 12
MHS cities
247 3 5 1 67 33 33 670 3 707 1 33 33 33 67 331 5 468 1 20 60 20 80 202 29 657 1 3 34 7 41 3 7 3 3 90 73 6 337 1 17 50 17 17 1007 16 77 1 6 6 44 25 12 6 19 56 19 6
13 8 45 1 12 12 50 25 62 3847 4 5 Y 75 25 25 50 25
H cities
64 1 2 1 100 1000 5 2,465 1 40 20 40 60 401 9 1,787 1 78 11 11 1002 6 1,580 1 67 33 17 833 27 1,197 1 4 37 4 7 41 4 4 7 85 75 18 843 Y 1 6 11 44 17 17 6 61 22 11 626 24 72 1 58 4 33 4 62 21 4 1234 20 60 1 10 30 5 45 5 5 80 10 5 535 18 64 1 11 22 11 6 22 6 22 6 39 22 11 17 6
SS cities
46 13 49 1 8 54 8 8 23 8 85 8
15
4 Discussion and ConclusionsThis paper quantitatively explored the structure of institutional scientific collaborations in a geographicalregion in the central Germany comprised of three cities, Halle (Saale), Jena, and Leipzig. The threeuniversities of these cities joined forces to form a strategic coalition, i.e., Unibund, that has lasted 25 years. Inaddition, this is an interesting region since it does not comply with the idea of a centralized and concentratedmetropolitan area. From 2012, this coalition, in collaboration with Helmholtz Centre for EnvironmentalResearch (UFZ) and seven other non-university institutions has established a new organizational entity, theGerman Center for Integrative Biodiversity Research (iDiv). Our main intent was to explore how Unibundmembers have collaborated with each other and to what extent iDiv as the new organizational form hasintegrated its diverse group of members into the collaboration network. In addition, we compared thestructure of scientific collaborations based on the self-represented scientific output of iDiv on their websitewith the larger context of scientific output of the HJL region.
First, in methodological terms, we presented the effects of disambiguation of organization names onresults. We showed that disambiguation can not be overlooked if we intend to construct networks andinvestigate collaboration trajectories. Any attempt at doing so without proper disambiguation would bereductionist and erroneous (see Akbaritabar (2020) for further discussion).
Moreover, the German science system in general (e.g., Stahlschmidt, Stephen, & Hinze (2019); Stephen,Stahlschmidt, & Hinze (2020)) and HJL region specifically, present a stable trend of fractional counts ofpublications versus raw counts indicating a mature trend of institutional co-authorship and team science.But, in the case of the disambiguated publications studied here, we observe that most co-authorship occurswithin Germany and only a few fields (e.g., NS and AS and to a lesser extent ET) show higher rates ofmultiple country co-authorship which is similar to Akbaritabar (2020)’s findings of the Berlin metropolitanregion. Note that this is in line with the focus of natural versus social sciences, where natural sciences shareresources over large, global teams to manage costs and work on globally relevant research questions, whereasmore social sciences and humanities work focuses on regional/local questions and is conducted by smallerteams. However, exceptional cases might exist to these disciplinary traditions.
Research activity in many countries is still dominated by the education sector (or in rare cases such asGermany, facility and education dominate the picture) and other sectors have a long way to go to catch up.There is still much to be done for university-industry relations and companies (as representative of businesssector) have only marginal positions in a few small and less prolific clusters and their collaboration is limitedto specific fields (e.g., AS, ET and NS).
Regarding the main aims of our paper, we found that Unibund has mainly persisted as a top-down policyinspiring further scientific collaboration. But in practice, while its members collaborate in the framework ofthe coalition, they maintain a more cohesive and distinctive group of collaborators distributed nationally or inEurope. iDiv as an interdisciplinary network has been successfully established. Based on the self-representedscientific output and in only six years covered in our study, it has attracted and integrated a diverse group ofinstitutions as members. Furthermore, it has established international and global collaboration ties. But,once we compared structure of collaborations within and between Unibund and iDiv members and scientificoutput of the larger context of HJL region, we observed that the highly cohesive structure based on iDiv’spublications was more the exception than the rule. Even though all three of Unibund and five of iDivmembers were cohesively collaborating with each other in the community 0 based on publications extractedfrom iDiv web, based on the HJL cities’ publications, only one iDiv member is located in the community 3with iDiv center and other members are located in separate cohesive communities with a more (in case ofiDiv members) or less (in case of Unibund members) international composition. iDiv members’ collaborationwith each other (i.e., the network constructed based on iDiv web data) is only a small part of their biggercollaboration trajectory. A larger share of their collaboration is still composed of working with a global groupof other collaborators.
To conclude, although an Integrated European Research Area (Hoekman, Frenken, & Tijssen, 2010)has formed, nevertheless, geographical proximity (Balland et al., 2020; Rammer, Kinne, & Blind, 2020) isnot enough to ensure regional cooperation (Abbasiharofteh & Broekel, 2020) similar to top-down policies(Akbaritabar, 2020). Furthermore, even use of bureaucracy and establishment of new organizational entities
16

(Shrum, Genuth, Carlson, Chompalov, & Bijker, 2007 p 192, 200-201) do not ensure a cohesive collaborationstructure. Unibund and iDiv have been relatively successful (e.g., in terms of number of publications) mainlyin the natural sciences to shape the structure of scientific collaborations in the HJL region. But, in otherscientific fields, where these institutions are actively publishing, a less cohesive collaboration structure isformed and there is room for these strategic coalitions to explore unrealized potentials.
The main limitation of our paper is the coverage of organization name disambiguation and beinglimited to only Scopus indexed content for scientific output. This does not include other modes of scientificcollaboration that institutions might carry out such as sharing infrastructure and resources, to name a few.Our analysis is limited to the level of scientific organization and more detailed investigation in individualscientists level, which requires fine-grained author name disambiguation techniques, would reveal more reliableinsight into the structure of scientific collaborations.
We modeled the networks as a bipartite one which is an improvement to the one-mode projecttionof it. But, the number of available algorithms to identify communities in this type of networks is stilllimited.Nevertheless, there are recent developments in the area of bipartite community detection and in ourfuture work, we would like to evaluate robustness of our community detection results, using new algorithmssuch as BiMLPA (Taguchi, Murata, & Liu, 2020) with the standard implementaion of it in CDlib library(Rossetti, Milli, & Cazabet, 2019) that allows for comparative analysis of community detection results. Thiswill ensure that the structure we are observing is robust to multiple community detection methods and is anartefact of the scientific collaborations in the region and not a byproduct of the specific algorithm we used inour analysis.
5 AcknowledgementsWe would like to thank Stephan Stahlschmidt, Dimity Stephen and Melike Janßen for comments andsuggestions on earlier versions of this paper.
6 Funding InformationThis research was done in DEKiF project supported by Federal Ministry for Education and Research (BMBF),Germany, with grant number: M527600. Data is obtained from Kompetenzzentrum Bibliometrie (CompetenceCenter for Bibliometrics), Germany, which is funded by BMBF with grant number 01PQ17001.
7 Data AvailabilityData cannot be made publicly available due to the licensing and contract terms of the original data.
ReferencesAbbasiharofteh, M., & Broekel, T. (2020). Still in the shadow of the wall? The case of the Berlin biotechnology
cluster: Environment and Planning A: Economy and Space. https://doi.org/10.1177/0308518X20933904
Akbaritabar, A. (2020). Berlin: A Quantitative View of the Structure of Institutional Scientific Collaborations.arXiv:2008.08355 [cs]. Retrieved from http://arxiv.org/abs/2008.08355
Balland, P.-A., Jara-Figueroa, C., Petralia, S. G., Steijn, M. P. A., Rigby, D. L., & Hidalgo, C. A. (2020).Complex economic activities concentrate in large cities. Nature Human Behaviour, 4 (3), 248–254.https://doi.org/10.1038/s41562-019-0803-3
Biancani, S., & McFarland, D. A. (2013). Social networks research in higher education. In Higher education:Handbook of theory and research (pp. 151–215). Springer.
Boshoff, N. (2009). Neo-colonialism and research collaboration in Central Africa. Scientometrics, 81 (2), 413.https://doi.org/10.1007/s11192-008-2211-8
17

Breiger, R. L. (1974). The Duality of Persons and Groups. Social Forces, 53 (2), 181–190. https://doi.org/10.1093/sf/53.2.181
Craven, D., Winter, M., Hotzel, K., Gaikwad, J., Eisenhauer, N., Hohmuth, M., . . . Wirth, C. (2019).Evolution of interdisciplinarity in biodiversity science. Ecology and Evolution, 9 (12), 6744–6755. https://doi.org/10.1002/ece3.5244
Habel, J. C., Eggermont, H., Günter, S., Mulwa, R. K., Rieckmann, M., Koh, L. P., . . . Lens, L. (2014).Towards more equal footing in northsouth biodiversity research: European and sub-Saharan viewpoints.Biodiversity and Conservation, 23 (12), 3143–3148. https://doi.org/10.1007/s10531-014-0761-z
Hoekman, J., Frenken, K., & Tijssen, R. J. W. (2010). Research collaboration at a distance: Changingspatial patterns of scientific collaboration within Europe. Research Policy, 39 (5), 662–673. https://doi.org/10.1016/j.respol.2010.01.012
Katz, J. S., & Martin, B. R. (1997). What is research collaboration? Research Policy, 26 (1), 1–18.https://doi.org/10.1016/S0048-7333(96)00917-1
Newman, M. E. J. (2001a). Scientific collaboration networks. I. Network construction and fundamentalresults. Physical Review E, 64 (1), 016131. https://doi.org/10.1103/PhysRevE.64.016131
Newman, M. E. J. (2001b). Scientific collaboration networks. II. Shortest paths, weighted networks, andcentrality. Physical Review E, 64 (1), 016132. https://doi.org/10.1103/PhysRevE.64.016132
Newman, M. E. J. (2004). Detecting community structure in networks. The European Physical Journal B -Condensed Matter, 38 (2), 321–330. https://doi.org/10.1140/epjb/e2004-00124-y
Rammer, C., Kinne, J., & Blind, K. (2020). Knowledge proximity and firm innovation: A microgeographicanalysis for Berlin. Urban Studies, 57 (5), 996–1014. https://doi.org/10.1177/0042098018820241
Reichardt, J., & Bornholdt, S. (2004). Detecting fuzzy community structures in complex networks with aPotts model. Physical Review Letters, 93 (21), 218701. https://doi.org/10.1103/PhysRevLett.93.218701
Rossetti, G., Milli, L., & Cazabet, R. (2019). CDLIB: A python library to extract, compare and evaluatecommunities from complex networks. Applied Network Science, 4 (1), 52. https://doi.org/10.1007/s41109-019-0165-9
Shrum, W., Genuth, J., Carlson, W. B., Chompalov, I., & Bijker, W. E. (2007). Structures of ScientificCollaboration. MIT Press.
Stahlschmidt, S., Stephen, D., & Hinze, S. (2019). Performance and Structures of the German Science System(p. 91). Studien zum deutschen Innovationssystem.
Stephen, D., Stahlschmidt, S., & Hinze, S. (2020). Performance and Structures of the German Science System2020. Studien zum deutschen Innovationssystem.
Taguchi, H., Murata, T., & Liu, X. (2020). BiMLPA: Community Detection in Bipartite Networks byMulti-Label Propagation. In N. Masuda, K.-I. Goh, T. Jia, J. Yamanoi, & H. Sayama (Eds.), Proceedingsof NetSci-X 2020: Sixth International Winter School and Conference on Network Science (pp. 17–31).Cham: Springer International Publishing. https://doi.org/10.1007/978-3-030-38965-9_2
Traag, V. A., Van Dooren, P., & Nesterov, Y. (2011). Narrow scope for resolution-limit-free communitydetection. Physical Review E, 84 (1), 016114. https://doi.org/10.1103/PhysRevE.84.016114
Traag, V. A., Waltman, L., & van Eck, N. J. (2019). From Louvain to Leiden: Guaranteeing well-connectedcommunities. Scientific Reports, 9 (1), 5233. https://doi.org/10.1038/s41598-019-41695-z
Tydecks, L., Jeschke, J. M., Wolf, M., Singer, G., & Tockner, K. (2018). Spatial and topical imbalances inbiodiversity research. PLOS ONE, 13 (7), e0199327. https://doi.org/10.1371/journal.pone.0199327
18