quantitative translational analysis of brain kynurenic...
TRANSCRIPT
MOL #111625
1
Quantitative Translational Analysis of Brain Kynurenic Acid Modulation via Irreversible
Kynurenine Aminotransferase II Inhibition
Cheng Chang, Kari R. Fonseca, Cheryl Li, Weldon Horner, Laura E. Zawadzke, Michelle A. Salafia,
Kathryn A. Welch, Christine A. Strick, Brian M. Campbell, Steve S. Gernhardt, Haojing Rong, Aarti
Sawant-Basak, Jennifer Liras, Amy Dounay, Jamison B. Tuttle, Patrick Verhoest, Tristan S. Maurer
Systems Modeling and Simulation Group, Pharmacokinetics, Dynamics & Metabolism, Medicine Design,
Worldwide Research and Development, Pfizer Inc., Cambridge, MA 02139 (CC, TSM, CL)
Neuroscience & Pain Research Unit, Worldwide Research & Development, Pfizer Inc., Cambridge, MA
02139 (WH, LEZ, MAS, KAW, CAS, BMC, AD, JT, PV)
Pharmacokinetics, Dynamics & Metabolism, Medicine Design, Worldwide Research and Development,
Pfizer Inc., Cambridge, MA 02139 (SSG, HR, ASB, JL, KRF)
This article has not been copyedited and formatted. The final version may differ from this version.Molecular Pharmacology Fast Forward. Published on May 31, 2018 as DOI: 10.1124/mol.118.111625
at ASPE
T Journals on M
arch 7, 2020m
olpharm.aspetjournals.org
Dow
nloaded from

MOL #111625
2
Running title
Translational analysis of irreversible KAT II inhibition
To whom correspondence should be addressed:
Cheng Chang, Ph.D.
Clinical Pharmacology
Pfizer Global Product Development
MS 8220-4514, Pfizer Inc. Eastern Point Road, Groton, CT 06340
Telephone: (860) 441-1926; Fax: (860) 715-9738; Email: [email protected]
Number of text pages: 26
Number of tables: 3
Number of figures: 7
Number of references: 47
Number of words in Abstract: 255
Number of words in Introduction: 746
Number of words in Discussion: 1237
Abbreviations: kynurenine aminotransferase, KAT; pharmacokinetics pharmacodynamics, PKPD; N-
methyl-Daspartate, NMDA; lower limit of quantification, LLOQ
This article has not been copyedited and formatted. The final version may differ from this version.Molecular Pharmacology Fast Forward. Published on May 31, 2018 as DOI: 10.1124/mol.118.111625
at ASPE
T Journals on M
arch 7, 2020m
olpharm.aspetjournals.org
Dow
nloaded from

MOL #111625
3
Abstract
Kynurenic acid (KYNA) plays a significant role in maintaining normal brain function and abnormalities
in KYNA levels have been associated with various central nervous system disorders. Confirmation of its
causality in human diseases requires safe and effective modulation of central KYNA levels in the clinic.
The kynurenine aminotransferases (KAT) II enzyme represents an attractive target for pharmacological
modulation of central KYNA levels. However, KAT II and KYNA turnover kinetics, which could
contribute to the duration of pharmacological effect, have not been reported. In this study, the kinetics of
central KYNA lowering effect in rat and non-human primate (NHP, cynomolgus macaques) were
investigated using multiple KAT II irreversible inhibitors as pharmacological probes. Mechanistic
pharmacokinetic pharmacodynamic analysis of in vivo responses to irreversible inhibition quantitatively
revealed 1) KAT II turnover is relatively slow (16 - 76 hours half life (T1/2)) while KYNA is more
rapidly cleared from brain (<1 hour T1/2) in both rat and NHP; 2) KAT II turnover is slower in NHP than
in rat (76 vs. 16 hours T1/2, respectively); 3) Percent contribution of KAT II to KYNA formation is
constant (~80%) across rat and NHP. Additionally, modeling results enabled establishment of in vitro-in
vivo correlation for both enzyme turnover rates and drug potencies. In summary, quantitative translational
analysis confirmed feasibility of central KYNA modulation in human. Model-based analysis, where
system-specific properties and drug-specific properties are mechanistically separated from in vivo
responses, enabled quantitative understanding of KAT II – KYNA pathway as well as assisted
development of promising candidates to test KYNA hypothesis in humans.
This article has not been copyedited and formatted. The final version may differ from this version.Molecular Pharmacology Fast Forward. Published on May 31, 2018 as DOI: 10.1124/mol.118.111625
at ASPE
T Journals on M
arch 7, 2020m
olpharm.aspetjournals.org
Dow
nloaded from
MOL #111625
4
Introduction
More than a century after kynurenic acid (KYNA) was first synthesized (Homer, 1914), extensive
knowledge has accumulated about its biosynthesis and physiological functions. KYNA was identified to
be a competitive blocker of the glycine coagonist site of the NMDA (N-methyl-Daspartate) subtype of
glutamate receptors (Kessler et al., 1989) as well as a noncompetitive antagonist of the α7-nicotinic
acetylcholine receptor (Hilmas et al., 2001). Both receptors have been shown to affect cognitive functions
(Robbins and Murphy, 2006; Thomsen et al., 2010). In fact, abnormally high levels of KYNA in both
brain and cerebrospinal fluid have been associated with pathological conditions such as schizophrenia,
bipolar disease and cognitive impairment (Erhardt et al., 2001; Olsson et al., 2010; Schwarcz et al., 2001).
While KYNA has been reported to be a weak antagonist at the glycine site of NMDA and α7, it has been
shown to be a potent agonist at the aryl hydrocarbon receptor. The role of the aryl hydrocarbon receptor
in the CNS and disease is somewhat unknown; however, activation of this receptor has proinflammatory
effects with increases in IL-6 which have been linked to psychiatric disease (DiNatale et al., 2010). All
evidence points to the significant role of KYNA in maintaining normal brain function. Ability to fine tune
brain KYNA levels is critical to test hypothesis of KYNA roles in different disease populations.
KYNA is one of the terminal metabolites of tryptophan and its synthesis in brain from L-kynurenine (L-
KYN) is primarily by astrocytic kynurenine aminotransferases (KAT) II, with minor contributions from
KAT I, KAT III and KAT IV (Han et al., 2010; Kiss et al., 2003). KAT II has been considered to be the
prime target for maintaining and regulating physiological concentrations of brain KYNA (Amori et al.,
2009; Guidetti et al., 2007; Guidetti et al., 1997). Irreversible KAT II inhibitors have been shown to be
effective modulators of brain KYNA levels (Dounay et al., 2012; Henderson et al., 2013; Tuttle et al.,
2013). One such irreversible KAT II inhibitor (PF-04859989) has demonstrated pro-cognitive effects in
various preclinical models (Koshy Cherian et al., 2014; Kozak et al., 2014; Linderholm et al., 2016),
suggesting its promising role in treating the cognitive symptoms associated with elevated KYNA levels.
This article has not been copyedited and formatted. The final version may differ from this version.Molecular Pharmacology Fast Forward. Published on May 31, 2018 as DOI: 10.1124/mol.118.111625
at ASPE
T Journals on M
arch 7, 2020m
olpharm.aspetjournals.org
Dow
nloaded from

MOL #111625
5
Typically, irreversible inhibitors have been utilized as probes in order to understand enzyme mechanisms
(Deigner et al., 1999; Rempel and Withers, 2008). In the current study, their utility was expanded to
quantify enzyme in vivo kinetic properties through mechanistic modeling. More specifically, in the
process of characterizing KAT II irreversible inhibitors, new insight could emerge from quantitative
analysis of the pharmacologically perturbed biological system, which reveals the biology surrounding
KATII as well as enables efficient drug design and development (Abelo et al., 2000). Quantitative
evaluation of the in vivo responses has unique challenges such as time-dependent target site drug
concentration which requires a pharmacokinetic (PK) model to characterize or the temporal disconnect
between the inhibitor concentration and the subsequent pharmacodynamic (PD) effect which requires a
model that accounts for both the concentration and time-dependent nature of the pharmacodynamics
response (Abelo et al., 2000; Ferron et al., 2001) before in vivo potency can be reliably estimated.
Mechanism-based PKPD analysis represents a powerful tool in this regard, where PK and PD are
mathematically integrated in order to resolve drug-specific properties (drug distribution, binding potency,
etc) and biological system-specific properties (target turnover rate, signal transduction time, etc) from in
vivo responses (Danhof et al., 2007). Similar approaches have been successfully applied in understanding
irreversible inhibition of gastric acid secretion by omeprazole (Abelo et al., 2000) and pantoprazole
(Ferron et al., 2001). In the current study, four specific irreversible KAT II inhibitors (Figure 1) were used
as pharmacological probes to study KAT II biological pathway in both rat and non-human primate (NHP).
A mechanism-based PKPD model was applied to estimate in vivo potencies of multiple irreversible
inhibitors as well as turn over half lives of KAT II and KYNA in rodent and NHP, which has not
previously been reported. Additionally, in vitro investigations of corresponding properties were carried
out. The correlation between in vitro and in vivo estimations for both drug-specific and biological system-
specific properties is subsequently evaluated. Lastly, contribution of KAT II to KYNA formation relative
to other enzymes in the brain was also estimated in both species. Ultimately, a quantitative understanding
of the underlying biology and molecular mechanism of action was exploited in order to identify
compounds with the requisite properties to test the therapeutic potential of KATII inhibition in the clinic.
This article has not been copyedited and formatted. The final version may differ from this version.Molecular Pharmacology Fast Forward. Published on May 31, 2018 as DOI: 10.1124/mol.118.111625
at ASPE
T Journals on M
arch 7, 2020m
olpharm.aspetjournals.org
Dow
nloaded from

MOL #111625
6
Materials and Methods
Chemicals
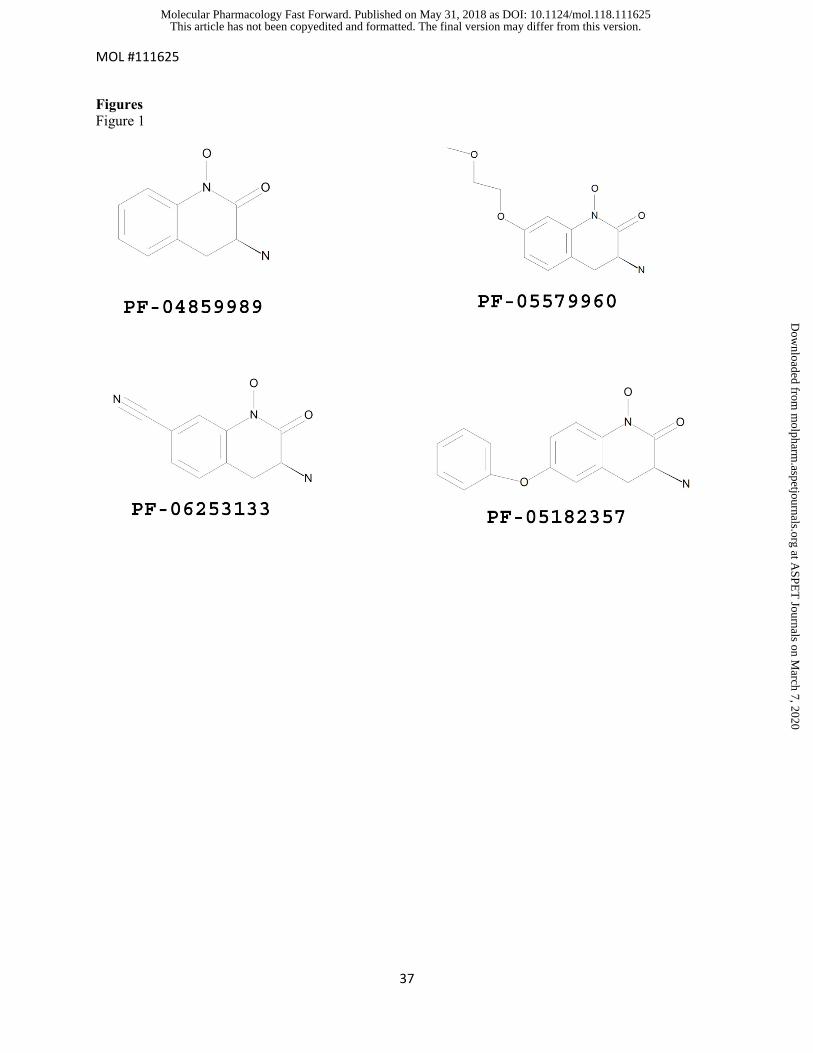
PF-04859989 ((3S)-3-amino-1-hydroxy-3,4-dihydroquinolin-2(1H)-one), PF-05579960 ((3S)-3-amino-1-
hydroxy-7-(2-methoxyethoxy)-3,4-dihydroquinolin-2(1H)-one), PF-06253133 ((3S)-3-amino-1-hydroxy-
2-oxo-1,2,3,4-tetrahydroquinoline-7-carbonitrile) and PF-05182357 ((3S)-3-amino-1-hydroxy-6-phenoxy-
3,4-dihydroquinolin-2(1H)-one) were synthesized by the Pfizer Medicinal Chemistry Department
(method of synthesis from patent WO 12073146 A1 and WO 10146488). All test compounds were >95%
pure, as determined by HPLC. Test compounds were prepared in sterile water to a dose volume of 2
mL/kg for subcutaneous injection. PF-04859989 is also commercially available via Sigma Aldrich.
Bioanalytical
KYNA from in vivo studies
Microdialysate samples from rat prefrontal cortex and CSF samples from NHP were analyzed by on-line
HPLC/Fluorimetric detection. KYNA was analyzed on a 150 x 3 mm, 3µ BDS Hypersil C18 column,
(Thermo Electron Corporation) set at 30°C. The analytes were separated with mobile phase containing 50
mM sodium acetate (pH to 6.3 with glacial acetic acid), 250 mM zinc acetate, 2-6% acetonitrile, delivered
at 0.3-0.350 ml/min by a LC-10ADvp pump (Shimadzu, Columbia MD) and detected fluorometrically at
Ex 344 /Em 398 nM (Shimadzu RFXL-10 detector). Extracellular levels of KYNA were measured and
reported as nM concentrations and percent of baseline level, respectively. Data were collected by
EZChrom Elite Client/Server software version 3.2.1 (Agilent Technologies, Wilmington, DE).
KYNA from in vitro studies
KYNA levels of samples from in vitro KAT II turnover studies were quantified by LC-MS/MS. The high
performance liquid chromatography (HPLC) system consisted of a CTC PAL autosampler and Shimadzu
LC20-AD pumps and degasser. Chromatography was achieved using a Phenomenex Synergi Polar-RP
This article has not been copyedited and formatted. The final version may differ from this version.Molecular Pharmacology Fast Forward. Published on May 31, 2018 as DOI: 10.1124/mol.118.111625
at ASPE
T Journals on M
arch 7, 2020m
olpharm.aspetjournals.org
Dow
nloaded from

MOL #111625
7
(2.0 x 50 mm, 4 um, 80Å) column. Mobile phase A consisted of 0.1% formic acid in HPLC water. Mobile
phase B consisted of 0.1 % formic acid in acetonitrile. The injection volume was 30 uL and the flow rate
was 0.350 mL/min. The HPLC system was coupled to an Applied Biosystems API 4000 mass
spectrometer operated in positive Multiple Reaction Monitoring (MRM) mode. The transition monitored
for kynurenic acid is 190.07 > 162.10. The retention time for KYNA was 1.4 minutes with a total run
time of 3 minutes. The dynamic range of the assay was 0.010 to 5.0 ng/mL. KYNA data acquisition
including peak integration and quantitation were performed using Analyst 1.4.2.
Irreversible inhibitors
Concentrations of test compounds in rat brain and NHP CSF were measured using LC-MS/MS triple
quadrupole mass spectrometer. Assay details for PF-04859989 and PF-05182357 have been reported
before (Tuttle et al., 2013). For PF-05579960 and PF-06253133, LC-MS/MS analysis was carried out
using a high-performance liquid chromatography system consisting of a Shimadzu LC-20 binary pump
(Shimadzu Scientific Instruments, Columbia, MD) with CTC PAL autosampler (Leap Technologies,
Carrboro, NC) interfaced to an API 4000 LC-MS/MS quadrupole tandem mass spectrometer (Applied
Biosystems/ MDS Sciex Inc., Ontario, Canada). PF-06253133 and PF-05579960 were separated on a
Analytical Sales and Service Advantage Echelon C18 column (50 x 2.1 mm, 4 µm) by gradient elution.
Mobile phase A consisted of 5 mM Ammonium Formate with 0.1% Formic acid. Mobile phase B
consisted of acetonitrile. The gradient began at a hold of 0% B for 0.3 min and was then ramped up to 40%
B over 2.2 minutes, immediately ramped to 90% B, held there for 0.4 minutes, and then returned back to
0% B for the remaining 0.6 minutes of the method for re-equilibration. A flow rate of 0.45 ml/min was
used. The mass spectrometer was operated in positive ion ESI mode for the detection of PF-06253133
and PF-05579960. Multiple reaction monitoring was performed with the transitions m/z 204 142.1 for
PF-06253133 and m/z 253.1 236.2 for PF-05579960. All raw data was processed using Analyst
Software ver. 1.4.2 (Applied Biosystems/ MDS Sciex Inc., Ontario, Canada). The lower limit of
This article has not been copyedited and formatted. The final version may differ from this version.Molecular Pharmacology Fast Forward. Published on May 31, 2018 as DOI: 10.1124/mol.118.111625
at ASPE
T Journals on M
arch 7, 2020m
olpharm.aspetjournals.org
Dow
nloaded from
MOL #111625
8
quantification (LLOQ) for PF-06253133 was 1.22 ng/ml. The LLOQ for PF-05579960 was 0.61 ng/ml.
The upper limit of quantification was 2500 ng/mL for both compounds.
In vitro
KAT II turnover assay
A whole cell assay was developed to measure recovery of enzyme activity after irreversible inhibition in
relevant cells as a measure of turnover rate of KAT II enzyme. Test compounds were dissolved in 100%
dimethyl sulfoxide (DMSO) and diluted to a working dilution in Hanks Balanced Salt Solution (HBSS).
Four types of cells from three species (as detailed below) were cultured into 6 well plates for each time
point (3 wells for maximal activity, 3 wells for activity with inhibitor) for 8 time points between 0 and 72
hours.
1. Primary normal human astrocytes (provided frozen in a cryovial, Lonza Inc. Allendale, NJ) were
thawed and seeded at 0.045 x 10⁶ cells per well in a 6 well plate on Day 1 in AGM growth media.
AGM growth media was replaced every other day. Cells were assay ready when close to 90%
confluent, usually at Day 8-9.
2. Primary rat mixed glia cultures were obtained from rat cortices of P-2 Sprague-Dawley (Charles
River) rat pups per established protocols and under Institutional Animal Care and Use Committee
(IACUC) protocol # 3389. Glia media consisted of DMEM high glucose, 10% Fetal Bovine
Serum (FBS), 1% Penicillin Streptomycin solution. The final cell suspension (~1 brain per 50 ml
in a T150 flask) was placed into culture on Day 1. On Day 2 and approximately every 4 days
after that media was removed and replaced with fresh culture media. Flasks were confluent by
Day 11-14. At this point, there was typically a confluent feeder layer of astrocytes with colonies
of microglia tethered to the astrocyte layer. Cells were harvested with trypsin and replated at 5 x
This article has not been copyedited and formatted. The final version may differ from this version.Molecular Pharmacology Fast Forward. Published on May 31, 2018 as DOI: 10.1124/mol.118.111625
at ASPE
T Journals on M
arch 7, 2020m
olpharm.aspetjournals.org
Dow
nloaded from
MOL #111625
9
104 cells per well in 6 well plates. Cells were fed with fresh media every other day and were
assay ready by Day 8 when confluent.
3. Primary rat astrocytes (provided frozen in a cryovial, Lonza Inc. Allendale, NJ) were thawed and
seeded 0.045 x 10⁶ cells per well in a 6 well plate on Day 1. AGM growth media was replaced
every other day. Cells were assay ready when close to 90% confluent, usually by week three.
4. Primary cynomologous monkey hepatocytes (provided in a frozen cryovial, Bioreclmation IVT
Westbury NJ) were plated into 96 well plates at a concentration of 0.05 x 10⁶ cells per well in a
total volume of 200µl on day 1 (InvitroGro HI media –Bioreclamation IVT). On day 2 media is
removed and replaced with HBSS, assay follows below.
Media was removed and wells were washed once with HBSS (1 ml per well of a 6 well plate). The HBSS
was removed and replaced with irreversible inhibitors diluted in HBSS or HBSS alone (1 ml per well of a
6 well plate). Plates were incubated for 1 h at 37 °C, 5% CO2. The media along with the inhibitors was
removed from all wells and the wells were washed once with HBSS. For time points later than T = 0,
HBSS was replaced by complete media and plates were returned to the incubator. For T = 0, wells were
washed once with ice cold HBSS (1 ml per well of a 6 well plate). The substrate L-KYN was added to all
wells (15 µM for astrocytes or rat mixed glia; 1 ml per well of a 6 well plate). The plates were incubated
for 2 hours at 37 °C, 5% CO2. The supernatants (850 µl per well of a 6 well plate) were removed and
placed in a sample block. The samples were acidified with 100 µl 1M HCl. Remaining time points were
washed once with HBSS and the same procedure was followed as described above for T = 0 time point.
Samples were frozen at -20 °C until KYNA analysis by LC-MS/MS.
Percent inhibition was calculated based on maximal KYNA in wells not treated with irreversible
inhibitors at each time point. Time course of KAT II enzyme activity recovery from different cell types
after irreversible inhibition were characterized by a turnover equation with zero order KAT II synthesis
This article has not been copyedited and formatted. The final version may differ from this version.Molecular Pharmacology Fast Forward. Published on May 31, 2018 as DOI: 10.1124/mol.118.111625
at ASPE
T Journals on M
arch 7, 2020m
olpharm.aspetjournals.org
Dow
nloaded from

MOL #111625
10
rate (𝐾𝐾𝑠𝑠𝑠𝑠𝑠𝑠𝐾𝐾𝐾𝐾𝐾𝐾𝐾𝐾𝐾𝐾) and first order KAT II degradation rate (𝑘𝑘𝑑𝑑𝑑𝑑𝑑𝑑𝐾𝐾𝐾𝐾𝐾𝐾𝐾𝐾𝐾𝐾) (Dayneka et al., 1993). KAT II turnover
half life was subsequently calculated for different cell types.
𝑑𝑑𝐾𝐾𝐾𝐾𝐾𝐾𝐾𝐾𝐾𝐾𝑑𝑑𝑑𝑑
= 𝐾𝐾𝑠𝑠𝑠𝑠𝑠𝑠𝐾𝐾𝐾𝐾𝐾𝐾𝐾𝐾𝐾𝐾 − 𝑘𝑘𝑑𝑑𝑑𝑑𝑑𝑑𝐾𝐾𝐾𝐾𝐾𝐾𝐾𝐾𝐾𝐾 ∗ 𝐾𝐾𝐾𝐾𝐾𝐾𝐾𝐾𝐾𝐾 Eq 1
𝐾𝐾𝐾𝐾𝐾𝐾𝐾𝐾𝐾𝐾 𝐻𝐻𝐻𝐻𝐻𝐻𝐻𝐻 𝐿𝐿𝐿𝐿𝐻𝐻𝐿𝐿 = 𝐿𝐿𝐿𝐿(2)/𝑘𝑘𝑑𝑑𝑑𝑑𝑑𝑑𝐾𝐾𝐾𝐾𝐾𝐾𝐾𝐾𝐾𝐾 Eq 2
Determination of apparent Km for L-KYN for recombinant KAT II
In order to characterize the kinetics of the recombinant KAT II enzymes in our lab and define assay
conditions for subsequent kinact/KI assay, apparent Km (the concentration of substrate that results in half
maximal reaction velocity under specified conditions) for L-KYN was determined. Initial conditions
were based on those previously indicated (Schmidt et al., 1993). The assay was performed in 96 well or
384 well plates in a total volume of 150 µL (96 well plate) or 30 µL (384 well plate) per well. The assay
mixture contained 70 µM PLP, 1 mM α-ketoglutaric acid, and a fixed concentration (200 or 300 nM) of
either human, rat, or NHP KAT II in 150 mM Tris Acetate buffer, pH 7.0, with 0.1% bovine gamma
globulin (BGG). Substrate (L-KYN) was added to various final concentrations, from 0.05 to 3 mM.
Enzyme concentration was chosen to allow the measurement of an initial linear rate across a large range
of substrate values. Assay plates were sealed around the edges with tape and immediately read on a
SpectraMax plate reader set at 37°C at an absorbance wavelength of 370 nm. A 370 nm was recorded at
3 min intervals for 4 h.
Enzyme kinetic constants were determined by nonlinear regression analysis of a first-order Michaelis-
Menten equation using GraphPad Prism 5.01 (GraphPad Software Inc., San Diego, CA). The apparent
Km values were expressed as mM. Arithmetic means and standard deviations of the Km values were
calculated from three experiments.
This article has not been copyedited and formatted. The final version may differ from this version.Molecular Pharmacology Fast Forward. Published on May 31, 2018 as DOI: 10.1124/mol.118.111625
at ASPE
T Journals on M
arch 7, 2020m
olpharm.aspetjournals.org
Dow
nloaded from

MOL #111625
11
Estimation of kinact/KI using recombinant KAT II
A stock solution of test compound was made in 100% DMSO and diluted to the required concentrations
with the addition of 100% DMSO. An additional aqueous dilution was made so that the compound at 3x
final concentration was 1.0% DMSO in the assay specific buffer. Compounds were tested at 11 different
concentrations. Final DMSO concentrations in the assay plate were equal to 0.33%.
KAT II enzyme activity after addition of each test compound was followed by measuring the loss of
absorbance of the L-KYN substrate at an absorbance wavelength of 370 nm. The KAT II assays were run
in a 384 well format at a final volume of 30 µL using 150 mM Tris Acetate buffer (pH 7.0), 1 mM L-
KYN, 1 mM α-ketoglutaric acid, 70 µM PLP, 0.1% BGG and either 30 nM human KAT II enzyme, 5 nM
rat KAT II enzyme or 20 nM NHP KAT II enzyme. Compound was diluted in 100% DMSO and spotted
prior to the addition of the other reagents. Enzyme was always added last. Assay plates were sealed
around the edges with tape and immediately read on a SpectraMax plate reader at an absorbance
wavelength of 370 nm. The SpectraMax plate reader was set up to read every 5 min for 16 hours.
The following steps are taken to ensure generation of consistent kinetic data. 1) A 10 µL aliquot of the
compound dilutions (described above in compound preparation) was added to the assay plate by hand
followed by a quick spin to ensure compound was collected at bottom of well. 2) A 10 µL aliquot of
substrate mix containing the L-KYN ketoglutaric acid and PLP was then added to the assay plate via a
Multidrop instrument. 3) Finally, a 10 µL aliquot of a 3 fold concentration of enzyme stock solution was
added last via a Multidrop instrument to initiate the reaction. 4) The microplate lid was placed onto the
assay plate and taped to seal in humidity, and the assay plate was put into the SpectraMax reader. A
quick vibration on the plate platform was done to ensure mixing, and the absorbance was read
(wavelength of 370 nm) every 5 min over 16 hours at room temperature.
Dynafit, a computational tool for mechanistic enzyme kinetics analysis (Kuzmic, 1996; Kuzmic, 2009),
was employed to provide the global fit of the complete reaction progress curves. A previously established
This article has not been copyedited and formatted. The final version may differ from this version.Molecular Pharmacology Fast Forward. Published on May 31, 2018 as DOI: 10.1124/mol.118.111625
at ASPE
T Journals on M
arch 7, 2020m
olpharm.aspetjournals.org
Dow
nloaded from

MOL #111625
12
two-step model (Schwartz et al., 2014) assuming rapid equilibrium binding was implemented in
estimating kinact/KI for each compound. KAT II Km for L-KYN was fixed to the appropriate value for rat,
human and NHP determined from above step. The underlying system of first-order ordinary differential
equations was integrated using the LSODE algorithm (Kuzmic, 1996; Kuzmic, 2009).
Brain tissue binding
Unbound fraction of the KAT II inhibitors was determined in rat brain tissue by standard equilibrium
dialysis methods (Kalvass et al., 2007).
In vivo
Rat
All procedures were carried out in compliance with the National Institutes of Health Guide for the Care
and use of Laboratory Animals (1985), under approval of IACUC.
In vivo microdialysis was performed in conscious, individually housed, freely moving male Sprague-
Dawley rats ( 320-400g), (Charles River, Raleigh, NC) which had free access to food and water and
maintained on a 12:12 h light/dark cycle. Microdialysis probe guide cannula (Bioanalytical Systems, Inc.,
West Lafayette, ID) were implanted in the PFC (bregma: AP +3.7 mm, ML -0.7 mm, DV -2.0 mm)
Paxinos and Watson (1982) under isoflurane anesthesia and fixed to the skull using bone screws and
dental acrylic. Animals were allowed to recover for a minimum of 24 h. Approximately 18 h before
testing, guide stylets were removed, and probes (BR-4; Bioanalytical Systems, Inc.) with a
polyacrylonitrile membrane (outside diameter 320 µm, MW cut-off 30,000 daltons) and a 4 mm dialysis
tip were inserted. The inlet and outlet of the probe were connected with flexible PEEK tubing (inside
This article has not been copyedited and formatted. The final version may differ from this version.Molecular Pharmacology Fast Forward. Published on May 31, 2018 as DOI: 10.1124/mol.118.111625
at ASPE
T Journals on M
arch 7, 2020m
olpharm.aspetjournals.org
Dow
nloaded from
MOL #111625
13
diameter 0.005 inch, Upchurch Scientific) and the probes were perfused at (1.5 µL/min) with artificial
CSF (147 mM NaCl, 2.7 mM KCl, 1.0 mM MgCl2 hexahydrate, 1.3 mM CaCl2 dihydrate) with a
CMA/100 (CMA/Microdialysis, North Chelmsford, MA) microperfusion pump. On the day of testing,
microdialysate samples (30 µL) were continuously collected and automatically injected every 20 min for
KYNA analysis by on-line HPLC/Fluorimetric detection.
For systemic administration, rats were dosed subcutaneously (SC) with vehicle (2 mL/kg) or compound
dissolved in vehicle. Vehicle consisted of 1% acetic acid in distilled water volume to volume. Compound
or vehicle was administered subcutaneously (SC) approximately 2 hours after basal KYNA levels had
stabilized and the effects on KYNA levels were monitored for at least 18 hours. PF-04859989 was dosed
SC at 3.2, 5.6, 10, 32 and 100 mg/kg (n= 3-14). Both PF-05579960 and PF-06253133 were dosed SC at 1,
3.2, 10 and 32 mg/kg (n= 3). Compound exposures in rat brain were determined from satellite animals
(n= 2 – 3). PF-04859989 brain samples were collected at 0.25, 0.5, 1 hrs post 3.2 mg/kg SC; 0.25, 0.5, 1,
3 hrs post 10 mg/kg SC; 0.25, 0.5, 1, 2, 4 hrs post 32 mg/kg SC. PF-05579960 and PF-06253133 brain
samples were collected at 0.5, 1, 2, 4, 7 hrs post 5 mg/kg SC. All brain samples were homogenized in
60/40 isopropanol/water with a magnetic bead beater, centrifuged. 50 mL of supernatant was precipitated
with 300 µL of acetonitrile containing internal standard, vortexed and centrifuged. The supernatant was
subsequently dried down under nitrogen and reconstituted in 80 µL of 95/5 water/acetonitrile. 5 µL was
then injected on the LC-MS/MS for analysis.
NHP (cynomolgus macaques (Macaca fascicularis))
This study was approved by the IACUC of Maccine under protocol number 46-2007 prior to start of
experimental phase. Ten NHP (Pusat Studi Satwa Primate (Primate Research Center), Institut Pertanian
Bogor, Indonesia) at the age of 3-5 years old were used in this study (2 males and 8 females). Animals
were singly-housed under 12:12 h light/dark cycle. During the study, the cages were cleaned at regular
intervals to maintain hygiene. NHPs were surgically prepared with indwelling cannulae inserted into the
This article has not been copyedited and formatted. The final version may differ from this version.Molecular Pharmacology Fast Forward. Published on May 31, 2018 as DOI: 10.1124/mol.118.111625
at ASPE
T Journals on M
arch 7, 2020m
olpharm.aspetjournals.org
Dow
nloaded from

MOL #111625
14
cisterna magna and connected to a subcutaneous access port to permit cerebrospinal fluid (CSF) sampling.
Animals were allowed a minimum 7 day recovery period from surgery prior to the commencement of
dosing and sampling. The animals were restrained in primate chairs on each day of dosing. On the day of
dosing, PF-05182357 was administered subcutaneously with a dose volume of 1.0 mL/kg at 1 mg/kg and
3 mg/kg (n=5). Both blood and CSF samples were collected at the following time points in relation to
dosing: Day -2 (-48), Day -1 (-24), 0, 0.25, 0.5, 1, 2, 4, 7, 12, 24, 48, 72, 120 hrs. Whole blood samples of
approximately 1.0 mL were collected from the femoral vein and into EDTA containing tubes. Plasma was
separated by spinning the samples at 4000 rpm for 10 minutes at 4°C. For collection of the CSF samples
via the cisterna magna catheter, the area around the port was swabbed with a suitable disinfectant prior to
insertion of the Huber needle. After needle insertion, a 150 µL sample was taken, discarded and then a
300 µL sample was obtained. Each 300 µL sample was in 3 x 100 µL aliquots in cryovials and snapped
frozen on liquid nitrogen. Both plasma and CSF samples were stored at -80°C prior to analysis. Both PF-
05182357 and KYNA concentrations were subsequently measured from CSF samples while only PF-
05182357 concentration was measured in plasma samples.
Data analysis
Rat PKPD modeling
A sequential PKPD analysis (Zhang et al., 2003) was performed: (1) the PK profiles of PF-04859989, PF-
05579960 and PF-06253133 from satellite groups were characterized independently; (2) the PD responses
of PF-04859989, PF-05579960 and PF-06253133 were simultaneously modeled while fixing
pharmacokinetic parameters estimated from step 1. The pharmacokinetics of PF-04859989 (step 1) were
characterized using a standard two compartment model with zero order absorption and first order
elimination. For PF-05579960 and PF-06253133, a time lag two compartment model (Singh et al., 1988)
was applied to capture the second absorption peak.
This article has not been copyedited and formatted. The final version may differ from this version.Molecular Pharmacology Fast Forward. Published on May 31, 2018 as DOI: 10.1124/mol.118.111625
at ASPE
T Journals on M
arch 7, 2020m
olpharm.aspetjournals.org
Dow
nloaded from
MOL #111625
15
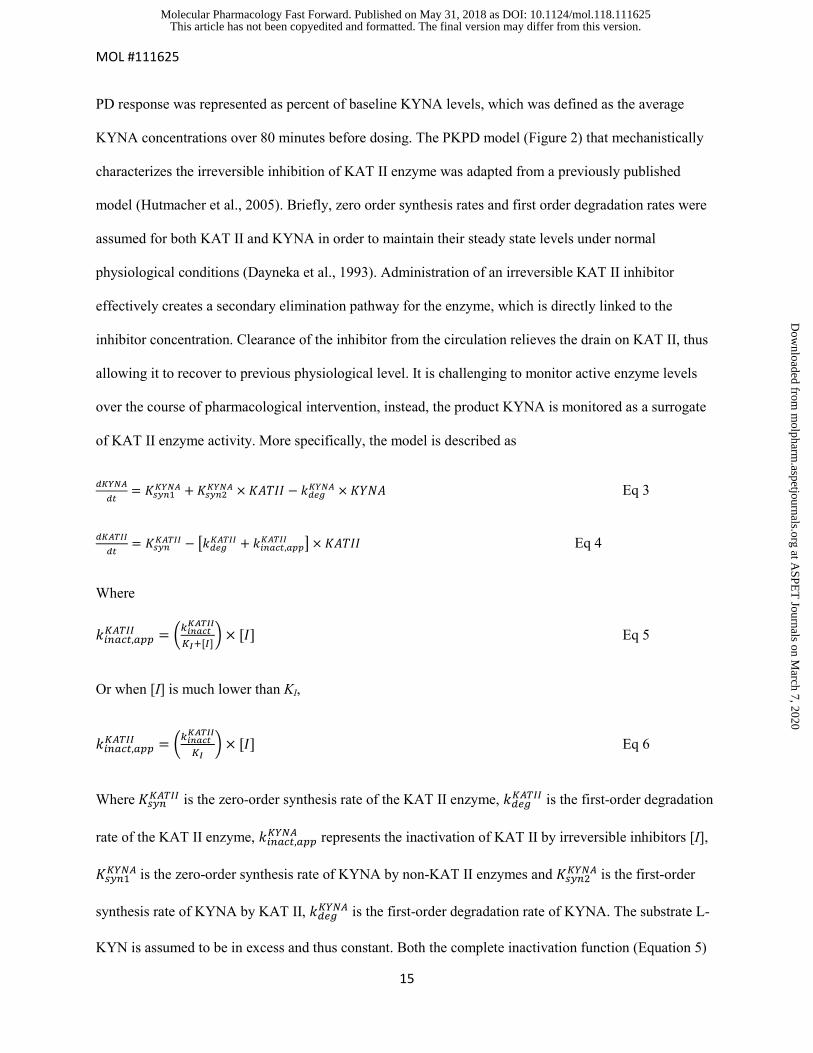
PD response was represented as percent of baseline KYNA levels, which was defined as the average
KYNA concentrations over 80 minutes before dosing. The PKPD model (Figure 2) that mechanistically
characterizes the irreversible inhibition of KAT II enzyme was adapted from a previously published
model (Hutmacher et al., 2005). Briefly, zero order synthesis rates and first order degradation rates were
assumed for both KAT II and KYNA in order to maintain their steady state levels under normal
physiological conditions (Dayneka et al., 1993). Administration of an irreversible KAT II inhibitor
effectively creates a secondary elimination pathway for the enzyme, which is directly linked to the
inhibitor concentration. Clearance of the inhibitor from the circulation relieves the drain on KAT II, thus
allowing it to recover to previous physiological level. It is challenging to monitor active enzyme levels
over the course of pharmacological intervention, instead, the product KYNA is monitored as a surrogate
of KAT II enzyme activity. More specifically, the model is described as
𝑑𝑑𝐾𝐾𝑑𝑑𝑑𝑑𝐾𝐾𝑑𝑑𝑑𝑑
= 𝐾𝐾𝑠𝑠𝑠𝑠𝑠𝑠1𝐾𝐾𝑑𝑑𝑑𝑑𝐾𝐾 + 𝐾𝐾𝑠𝑠𝑠𝑠𝑠𝑠2𝐾𝐾𝑑𝑑𝑑𝑑𝐾𝐾 × 𝐾𝐾𝐾𝐾𝐾𝐾𝐾𝐾𝐾𝐾 − 𝑘𝑘𝑑𝑑𝑑𝑑𝑑𝑑𝐾𝐾𝑑𝑑𝑑𝑑𝐾𝐾 × 𝐾𝐾𝐾𝐾𝐾𝐾𝐾𝐾 Eq 3
𝑑𝑑𝐾𝐾𝐾𝐾𝐾𝐾𝐾𝐾𝐾𝐾𝑑𝑑𝑑𝑑
= 𝐾𝐾𝑠𝑠𝑠𝑠𝑠𝑠𝐾𝐾𝐾𝐾𝐾𝐾𝐾𝐾𝐾𝐾 − �𝑘𝑘𝑑𝑑𝑑𝑑𝑑𝑑𝐾𝐾𝐾𝐾𝐾𝐾𝐾𝐾𝐾𝐾 + 𝑘𝑘𝑖𝑖𝑠𝑠𝑖𝑖𝑖𝑖𝑑𝑑,𝑖𝑖𝑎𝑎𝑎𝑎𝐾𝐾𝐾𝐾𝐾𝐾𝐾𝐾𝐾𝐾 � × 𝐾𝐾𝐾𝐾𝐾𝐾𝐾𝐾𝐾𝐾 Eq 4
Where
𝑘𝑘𝑖𝑖𝑠𝑠𝑖𝑖𝑖𝑖𝑑𝑑,𝑖𝑖𝑎𝑎𝑎𝑎𝐾𝐾𝐾𝐾𝐾𝐾𝐾𝐾𝐾𝐾 = �𝑘𝑘𝑖𝑖𝑖𝑖𝑖𝑖𝑖𝑖𝑖𝑖
𝐾𝐾𝐾𝐾𝐾𝐾𝐾𝐾𝐾𝐾
𝐾𝐾𝐾𝐾+[𝐾𝐾]� × [𝐾𝐾] Eq 5
Or when [I] is much lower than KI,
𝑘𝑘𝑖𝑖𝑠𝑠𝑖𝑖𝑖𝑖𝑑𝑑,𝑖𝑖𝑎𝑎𝑎𝑎𝐾𝐾𝐾𝐾𝐾𝐾𝐾𝐾𝐾𝐾 = �𝑘𝑘𝑖𝑖𝑖𝑖𝑖𝑖𝑖𝑖𝑖𝑖
𝐾𝐾𝐾𝐾𝐾𝐾𝐾𝐾𝐾𝐾
𝐾𝐾𝐾𝐾� × [𝐾𝐾] Eq 6
Where 𝐾𝐾𝑠𝑠𝑠𝑠𝑠𝑠𝐾𝐾𝐾𝐾𝐾𝐾𝐾𝐾𝐾𝐾 is the zero-order synthesis rate of the KAT II enzyme, 𝑘𝑘𝑑𝑑𝑑𝑑𝑑𝑑𝐾𝐾𝐾𝐾𝐾𝐾𝐾𝐾𝐾𝐾 is the first-order degradation
rate of the KAT II enzyme, 𝑘𝑘𝑖𝑖𝑠𝑠𝑖𝑖𝑖𝑖𝑑𝑑,𝑖𝑖𝑎𝑎𝑎𝑎𝐾𝐾𝑑𝑑𝑑𝑑𝐾𝐾 represents the inactivation of KAT II by irreversible inhibitors [I],
𝐾𝐾𝑠𝑠𝑠𝑠𝑠𝑠1𝐾𝐾𝑑𝑑𝑑𝑑𝐾𝐾 is the zero-order synthesis rate of KYNA by non-KAT II enzymes and 𝐾𝐾𝑠𝑠𝑠𝑠𝑠𝑠2𝐾𝐾𝑑𝑑𝑑𝑑𝐾𝐾 is the first-order
synthesis rate of KYNA by KAT II, 𝑘𝑘𝑑𝑑𝑑𝑑𝑑𝑑𝐾𝐾𝑑𝑑𝑑𝑑𝐾𝐾 is the first-order degradation rate of KYNA. The substrate L-
KYN is assumed to be in excess and thus constant. Both the complete inactivation function (Equation 5)
This article has not been copyedited and formatted. The final version may differ from this version.Molecular Pharmacology Fast Forward. Published on May 31, 2018 as DOI: 10.1124/mol.118.111625
at ASPE
T Journals on M
arch 7, 2020m
olpharm.aspetjournals.org
Dow
nloaded from

MOL #111625
16
and the simplified linear function (Equation 6) were used to fit experimental data. Steady state KAT II
enzyme level was not measured and hence set at the nominal value of 1. KYNA steady state level was
fixed at 100% since all observations are normalized by pre-dose baseline. Vehicle effect on KYNA was
observed from vehicle treated rats possibly due to stress and was modeled as a stimulatory effect on
KYNA with bolus input function followed by first order elimination. Time courses of KYNA levels after
administering three different irreversible inhibitors at different doses were simultaneously fitted according
to the PKPD model in estimating one set of system parameters (i.e. 𝐾𝐾𝑠𝑠𝑠𝑠𝑠𝑠1𝐾𝐾𝑑𝑑𝑑𝑑𝐾𝐾,𝐾𝐾𝑠𝑠𝑠𝑠𝑠𝑠2𝐾𝐾𝑑𝑑𝑑𝑑𝐾𝐾,𝑘𝑘𝑑𝑑𝑑𝑑𝑑𝑑𝐾𝐾𝑑𝑑𝑑𝑑𝐾𝐾, 𝐾𝐾𝑠𝑠𝑠𝑠𝑠𝑠𝐾𝐾𝐾𝐾𝐾𝐾𝐾𝐾𝐾𝐾 ,𝑘𝑘𝑑𝑑𝑑𝑑𝑑𝑑𝐾𝐾𝐾𝐾𝐾𝐾𝐾𝐾𝐾𝐾)
and compound-dependent in vivo potency parameters (i.e. 𝑘𝑘𝑖𝑖𝑠𝑠𝑖𝑖𝑖𝑖𝑑𝑑𝐾𝐾𝐾𝐾𝐾𝐾𝐾𝐾𝐾𝐾 ,𝐾𝐾𝐾𝐾).
Non-human primate PKPD modeling
Since both drug concentrations and KYNA responses were collected from the same animals, a population
PKPD model was developed to characterize the relationship between PF-05182357 concentration and
KYNA response within each individual. A sequential PKPD modeling approach similar to the rat model
was adopted. PF-05182357 plasma concentrations were first characterized using a standard three
compartment model with zero order absorption and first order elimination. Inter-individual variability on
different PK parameters was evaluated for best individual fit. Subsequently, individual PK parameters
were fixed in estimating population PD parameters based on the same model structure as used in the rat
analysis. PD response was represented as percent of baseline KYNA levels, which was defined as the
average KYNA concentrations between -24 hr and 0 hr.
Model fitting and evaluation
The PKPD data were modeled using nonlinear mixed-effects modeling as implemented in the NONMEM
(NONMEM software system, version 7.2, GloboMax LLC, Hanover, MD). Log transformation was
applied to exposure measurements before analysis. Proportional residual error model was used for all
models. The analyses were conducted using the first order conditional estimation with interaction (FOCE
This article has not been copyedited and formatted. The final version may differ from this version.Molecular Pharmacology Fast Forward. Published on May 31, 2018 as DOI: 10.1124/mol.118.111625
at ASPE
T Journals on M
arch 7, 2020m
olpharm.aspetjournals.org
Dow
nloaded from
MOL #111625
17
INTERACTION) method. 90% confidence intervals for the parameter estimates in the final model were
estimated using the parametric bootstrap approach. Graphical data display was done using R.2.15.3.
Assessment of the model goodness-of-fit was conducted based on the following standard methods.
Models were evaluated using the following goodness-of-fit criteria: successful minimization of the
objective function, visual inspection of several diagnostic scatter plots (population and individual
observed versus predicted concentrations, residual plots, plots of random effects and weighted residuals
versus time, histograms of individual random effects), change in the objective function value relative to
the change in number of parameters as well as the magnitude and precision of the parameter estimates.
This article has not been copyedited and formatted. The final version may differ from this version.Molecular Pharmacology Fast Forward. Published on May 31, 2018 as DOI: 10.1124/mol.118.111625
at ASPE
T Journals on M
arch 7, 2020m
olpharm.aspetjournals.org
Dow
nloaded from

MOL #111625
18
Results
KAT II turnover assay
Addition of various KAT II inhibitors (i.e. PF-04859989 or PF-05182357) in the four different whole cell
assays resulted in an initial inhibition of approximately 50% - 80% of KAT II activity. Over time, there
was a gradual return to full enzyme activity as the processes of KAT II enzyme synthesize and its
subsequent degradation reached the steady state under non-inhibited conditions. The time courses of
enzyme activity recovery in cells from different tissues were adequately described by the zero order
production first order degradation model (Figure 3). The estimated KAT II turnover half life is similar
between human astrocytes and NHP hepatocyte (43.4 and 34.7 hrs, respectively). In primary rat mixed
glia and primary astrocytes, the average KAT II half life is much shorter at 14.9 hours. Model fitted
parameters are listed in Table 1.
Brain tissue binding
Similar rat brain tissue unbound fraction of PF-04859989, PF-05579960 and PF-06253133 were
estimated (0.39, 0.29 and 0.47, respectively) from the equilibrium dialysis method.
Determination of apparent Km for L-KYN for recombinant KAT II
A simple absorbance method to measure KAT II activity was developed. It was used to determine
apparent Km for L-KYN for human, rat, and rhesus monkey KAT II enzymes. Km values derived for all
three species are comparable (Table 2). They are consistent with the Km values reported in the literature
for rat KAT II (0.88 mM;(Guidetti et al., 1997)) and human KAT II (2.5 mM;(Schmidt et al., 1993)).
This article has not been copyedited and formatted. The final version may differ from this version.Molecular Pharmacology Fast Forward. Published on May 31, 2018 as DOI: 10.1124/mol.118.111625
at ASPE
T Journals on M
arch 7, 2020m
olpharm.aspetjournals.org
Dow
nloaded from
MOL #111625
19
Similar Km values were also reported from a more extensive cross-species investigation of KAT II (Lu et
al., 2016).
Estimation of kinact/KI using recombinant KAT II
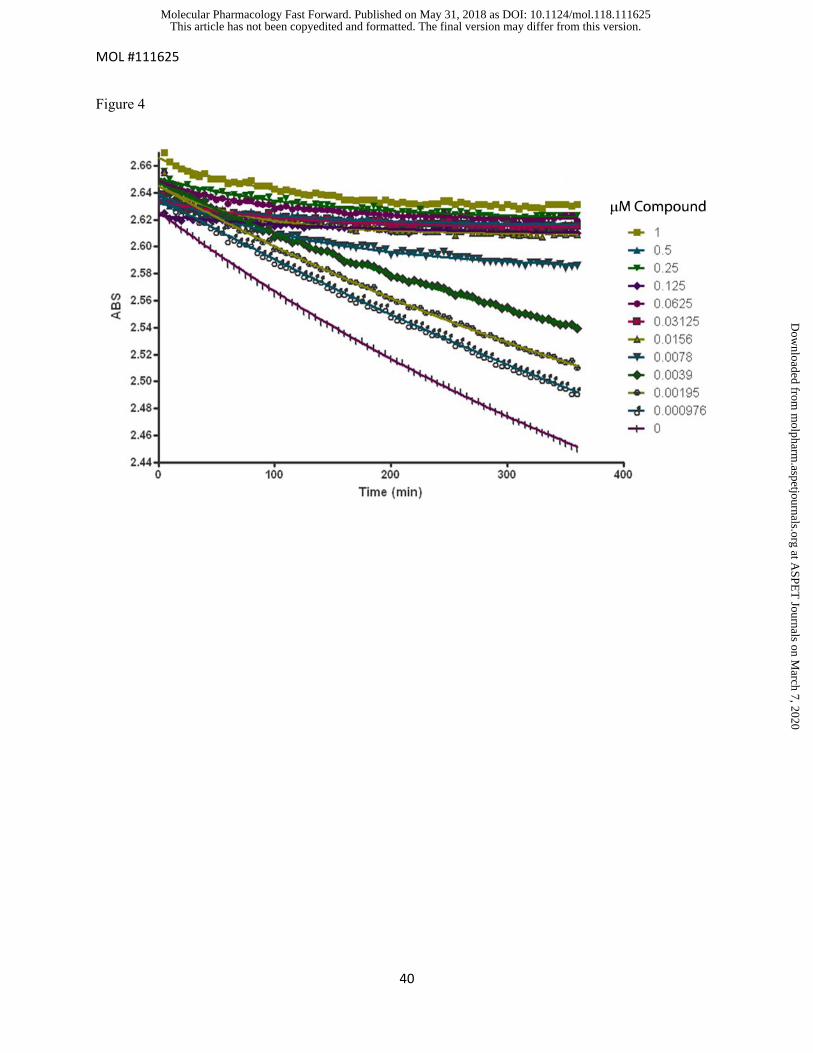
The kinetic rate data were obtained by measuring loss of absorbance for the substrate L-KYN. A
representative set of A 370 nm vs. time curves at different dilutions of PF-06253133 in the human KAT II
assay is shown in Figure 4. A reasonably linear loss of absorbance was observed over 16 hours in absence
of PF-06253133. In the presence of PF-06253133, the progress curves for the KAT II reaction exhibited
curvature (Figure 4), which is consistent with the mechanism of irreversible inhibition. Both kinact and KI
were successfully estimated for all four irreversible inhibitors in recombant rat/NHP and human KAT II
assays. In order to compare with the corresponding in vivo potency estimation, the apparent second order
rate constant potency estimates (kinact/KI) were subsequently calculated and listed in Table 1.
Rat PKPD modeling
After SC administration in rat, all three tested compounds demonstrated rapid absorption with brain
exposure peaks at the first time point (0.25 - 0.5 hr) and were quickly eliminated with half lives of less
than one hour. Their pharmacokinetic profiles were sufficiently characterized using the proposed PK
models, which were subsequently used to drive PD interactions with KAT II enzymes (Figure 5).
Significant vehicle effect was observed in KYNA responses potentially due to the stress effect of SC
dosing, where a transient increase of KYNA level was followed by slow dissipation over the course of
observation. Brain KYNA levels (PD response) decreased dose responsively post administration of
irreversible inhibitors. A maximum of 80% KYNA decrease was observed at approximately 2 – 4 hrs post
dosing for all three inhibitors. KYNA levels slowly recovered over the course of 24 hours. Apparent
temporal disconnect between PK and PD profiles was observed where the onset of PD response is delayed
and the duration of PD response is prolonged compares to those of the PK profile. . This observation is
This article has not been copyedited and formatted. The final version may differ from this version.Molecular Pharmacology Fast Forward. Published on May 31, 2018 as DOI: 10.1124/mol.118.111625
at ASPE
T Journals on M
arch 7, 2020m
olpharm.aspetjournals.org
Dow
nloaded from

MOL #111625
20
consistent with irreversible inhibition of a target that has slow turn over kinetics. The initial complete
model (Equation 5) failed to independently identify kinact and KI due to high correlation between the two
parameters suggesting current exposure response relationship could at linear range. The simplified linear
model (Equation 6) successfully converged and sufficiently characterized the pharmacodynamic profiles
of the three inhibitors at all dose levels (Figure 5). All model parameters were estimated with sufficient
certainty except KYNA turnover rate (𝑘𝑘𝑑𝑑𝑑𝑑𝑑𝑑𝐾𝐾𝑑𝑑𝑑𝑑𝐾𝐾), which was estimated to be a large number with high
uncertainty on the initial run. This suggests KYNA is very rapidly turned over and the current dataset is
not sufficient to pinpoint the exact rate. Consequently, 𝑘𝑘𝑑𝑑𝑑𝑑𝑑𝑑𝐾𝐾𝑑𝑑𝑑𝑑𝐾𝐾 was fixed to 1000 hr-1(corresponds to a half
life of 2.5 seconds). The model estimated that KAT II enzyme contributes to 75% of KYNA formation
while non-KAT II enzymes are responsible for the remaining production. Rat brain KAT II turnover half
life was estimated to be 15.5 hrs (Table 3).
After correcting for brain tissue binding, PF-06253133 and PF-05579960 were estimated to be more
potent than PF-04859989 with free concentration-based kinact/KI of 848.6 M-1s-1, 535.4 M-1s-1 and 80.6 M-
1s -1, respectively (Table 3).
Non-human primate PKPD modeling
Although PF-05182357 CSF concentrations were undetectable for all time points except the first two
(0.25 and 0.5 hr) due to its impaired brain penetration and rapid clearance, significant and dose responsive
CSF KYNA reduction was observed suggesting its potent inhibitory effect at KAT II. This is consistent
with its potent in vitro activity (kinact/KI = 16668 M-1s-1). KYNA levels slowly recovered over the entire
observation period (5 days). In order to fully characterize the PK profile and better understand KATII
enzyme turnover, plasma concentrations were used to support PKPD analysis. Individual PF-05182357
plasma concentration-time profiles were sufficiently captured by a three-compartment model with inter-
individual variability on relative availability and inter-compartmental clearance (Figure 6). The proposed
This article has not been copyedited and formatted. The final version may differ from this version.Molecular Pharmacology Fast Forward. Published on May 31, 2018 as DOI: 10.1124/mol.118.111625
at ASPE
T Journals on M
arch 7, 2020m
olpharm.aspetjournals.org
Dow
nloaded from

MOL #111625
21
PKPD model adequately characterized the time course of PF-05182357-induced KYNA reduction
response (Figure 6). PF-05182357 kinact/KI was estimated to be 548.3 M-1s-1 based on total plasma
concentration. The difference between in vivo kinact/KI and in vitro kinact/KI for PF-05182357 is most likely
due to impaired brain penetration where total plasma concentration is much higher than unbound brain
concentration. KAT II turnover half life was estimated to be 76 hrs. Because of limited observations from
the NHP study and high variability, confidence intervals for both parameters were large. Also in contrast
to the rat model, where KYNA half life was too short to be determined, KYNA turnover half life was
successfully estimated to be 1 hr for NHP, suggesting that the KYNA turnover rate is slower in this
species. In NHP, KAT II was estimated to contribute to 86% of KYNA formation (Table 3).
This article has not been copyedited and formatted. The final version may differ from this version.Molecular Pharmacology Fast Forward. Published on May 31, 2018 as DOI: 10.1124/mol.118.111625
at ASPE
T Journals on M
arch 7, 2020m
olpharm.aspetjournals.org
Dow
nloaded from
MOL #111625
22
Discussion
KYNA has important physiological roles in human brain function and its elevation has been hypothesized
to be causal to cognitive impairment in multiple central disorders including schizophrenia. Development
of a safe and efficacious pharmaceutical agent to test this hypothesis in human will provide the ultimate
answer. KAT II is considered the most plausible target for pharmacological modulation of brain KYNA
levels and has been extensively characterized (Passera et al., 2011; Rossi et al., 2008). Our modeling
results quantitatively support this finding. As all irreversible inhibitors tested in this report are at least 50
fold selective against KAT I or KAT III and no KAT IV inhibition was observed at up to 50 µM PF-
04859989 (internal data), achievement of ~80% maximal KYNA inhibition in both rat and NHP with
these inhibitors suggests a dominant role for KAT II in brain KYNA formation. More quantitatively, the
model estimated KAT II contribution to brain KYNA formation in rat and NHP to be 75% and 86%,
respectively. This confirms previous finding that KAT II catalyzes approximately 75% of KYNA
synthesis in most brain areas (Guidetti et al., 1997). More recently, the specific contribution of KAT IV to
KYNA synthesis was studied and reported to be very limited (Guidetti et al., 2007). These findings
further validate KAT II as a viable target for effective lowering of brain KYNA.
Despite the significance of KAT II as an attractive target, no estimation of KAT II turnover properties has
been reported to date. This is an important target property that could affect the duration of therapeutic
effect elicited by pharmacological agents, especially irreversible inhibitors. In the current study, this
property was thoroughly investigated in rat and NHP in vivo as well as in rat, NHP and human in vitro
systems. There is general agreement between estimations from in vitro and in vivo systems. Both systems
suggest that KAT II turnover half life is longer in NHP or human than in rodent. Specifically, KAT II half
lives in rat and NHP in vivo system were estimated to be 15.5 and 76.3 hrs, respectively. Similarly, KAT
II half lives in rat, NHP and human primary cells were estimated to be 14.9, 34.7 and 43.4 hrs,
respectively. In vitro estimated KAT II half life is highly predictive of in vivo estimation for rat (14.9 vs.
15.5 hr) and to a lesser extent for NHP (34.7 vs. 76.3 hrs). This discrepancy could be the result of NHP in
This article has not been copyedited and formatted. The final version may differ from this version.Molecular Pharmacology Fast Forward. Published on May 31, 2018 as DOI: 10.1124/mol.118.111625
at ASPE
T Journals on M
arch 7, 2020m
olpharm.aspetjournals.org
Dow
nloaded from
MOL #111625
23
vivo KAT II half life being poorly estimated (90% CI ranges from 6.4 to 118.9) from sparse and variable
NHP observations. This is in contrast to high confidence estimation in rat (90% CI ranges from 14.8 to
16.2) where extensive observations from multiple compounds were modeled simultaneously. Based on
overall consistent IVIVC, human in vivo KAT II half life is projected to be approximately 43 hrs. Slow
KAT II turnover rate, especially in NHP and human, greatly enhanced the duration of KYNA lowering
effect from irreversible inhibition (i.e. KYNA level remains low even after circulating irreversible
inhibitor has been cleared from the system). To illustrate this effect, the human KYNA lowering response
after administering PF-06253133 was simulated (Figure 7a). For this simulation, in addition to human
KAT II half life, PF-06253133 in vivo potency was also scaled to human based on established potency
IVIVC (vide infra). Additionally, projected PF-06253133 human PK parameters (not reported) were also
used to best represent clinical response. As illustrated in Figure 7a, although PF-06253133 was projected
to have PK half life that is too short to sustain once a day dosing, where most drug is cleared from the
system within10 hours, the PD effect is much prolonged. It takes ~ 5 days for the PD effect to fully
develop. This finding significantly accelerated drug discovery process by opening up the chemical space
to compounds with a short half life, which is typically excluded from clinical candidate selection. A short
half life clinical candidate also has added safety advantage because of lower overall body burden, hence
less undesirable side effects. Another hypothetical simulation assuming a much shorter KAT II half life of
1 hour is performed (Figure 7b). Under this condition, steady state KYNA lowering effect is significantly
reduced from the same dose of PF-06253133. More importantly, PD response now tracks the PK profile,
resulting in increased KYNA variation (i.e. peak to trough ratio) within each dosing period especially
when KAT II inhibitor is given at higher doses. This type of KYNA lowering profile could be detrimental
to mental health because of the significant role of KYNA in brain function. Target turnover kinetics has
been routinely evaluated for biotherapeutic drugs (Luu et al., 2012; Zhao et al., 2012), however such
investigation for small molecule drug targets is less frequent. Our results illustrate that this is an important
factor to consider for development of small molecule irreversible inhibitors. Clearly, knowledge of KAT
II turnover kinetics significantly accelerated the discovery of safe clinical candidates.
This article has not been copyedited and formatted. The final version may differ from this version.Molecular Pharmacology Fast Forward. Published on May 31, 2018 as DOI: 10.1124/mol.118.111625
at ASPE
T Journals on M
arch 7, 2020m
olpharm.aspetjournals.org
Dow
nloaded from
MOL #111625
24
As illustrated in above simulation, proper translational analysis is key to successful development of a
clinical candidate based on preclinical information. One of the important factors in translational analysis
is to understand compound potency differences between human and preclinical species (Chang et al.,
2011). This could be particularly important for KAT II as potency shifts between human and rodent KAT
II has been previously reported for a reversible inhibitor (S)-(4)-(ethylsulfonyl) benzoylalanine
(Pellicciari et al., 2008). Since target potency of different species is routinely evaluated in vitro, verifying
the predictivity of in vitro assays in preclinical in vivo models becomes important. Model estimated rat in
vivo kinact/KI values sufficiently correlated with kinact/KI estimates from primary rat mixed glia/astrocytes
for PF-04859989, PF-05579960 and PF-06253133 (80.6 vs. 134 M-1s-1, 535.4 vs. 564 M-1s-1 and 848.6 vs.
477 M-1s-1, respectively). When such potencies were compared across species for each compound, a
significant shift was observed, where they appear to be 10-50 fold more potent for human KAT II than for
rat KAT II. Similar magnitude of potency shift (~20 fold) between human and rat for another irreversible
KAT II inhibitor was reported recently (Lu et al., 2016). Failure to consider this important factor in
clinical study design could compromise the ability to fine-tune KYNA levels, potentially exposing brain
to significant KYNA deprivation which could be deleterious to normal brain function in case of over
dosing in human. Not surprisingly, our translational analyses suggest that NHP model is more predictive
of human brain KYNA lowering profile via KAT II inhibition based on both similar compound potency
(16668 vs. 13895 M-1s-1 for PF-05182357 in NHP and human, respectively) and comparable KAT II
turnover kinetics (KAT II half life of 34.7 vs. 43.4 hrs in NHP and human, respectively). This finding is
further supported by KAT II enzyme sequence similarity across species where human shared more
similarity with NHP than rat (97% between human and NPH while 72% between human and rat).
Additionally, establishment of compound potency IVIVC suggests prioritization of subsequent candidates
can rely on the results from in vitro assays as they are predictive of the outcome from more resource-
intensive in vivo studies. In addition to reducing animal usage, this approach also expedited the drug
discovery process (Gabrielsson et al., 2009).
This article has not been copyedited and formatted. The final version may differ from this version.Molecular Pharmacology Fast Forward. Published on May 31, 2018 as DOI: 10.1124/mol.118.111625
at ASPE
T Journals on M
arch 7, 2020m
olpharm.aspetjournals.org
Dow
nloaded from

MOL #111625
25
In summary, mechanism-based PKPD modeling in translational research not only advanced
understanding of KAT II - KYNA biological system, but also facilitated efficient development of clinical
candidates with high confidence of modulating brain KYNA levels via KAT II inhibition.
This article has not been copyedited and formatted. The final version may differ from this version.Molecular Pharmacology Fast Forward. Published on May 31, 2018 as DOI: 10.1124/mol.118.111625
at ASPE
T Journals on M
arch 7, 2020m
olpharm.aspetjournals.org
Dow
nloaded from

MOL #111625
26
Author contributions:
Participated in research design: Chang, Fonseca, Zawadzke, Strick, Campbell, Dounay, Tuttle, Verhoest,
Maurer
Conducted experiments: Horner, Salafia, Welch, Gernhardt
Contributed new reagents or analytic tools: Gernhardt, Dounay, Tuttle, Verhoest
Performed data analysis: Chang, Fonseca, Li, Zawadzke, Rong, Sawant-Basak, Liras
Wrote or contributed to the writing of the manuscript: Chang, Zawadzke, Verhoest, Maurer
Conflict of interest: All authors are Pfizer employees at the time of this work.
This article has not been copyedited and formatted. The final version may differ from this version.Molecular Pharmacology Fast Forward. Published on May 31, 2018 as DOI: 10.1124/mol.118.111625
at ASPE
T Journals on M
arch 7, 2020m
olpharm.aspetjournals.org
Dow
nloaded from
MOL #111625
27
References
FDA's Guidance for Industry: Population Pharmacokinetics. February 1999. Abelo A, Eriksson UG, Karlsson MO, Larsson H and Gabrielsson J (2000) A turnover model of irreversible
inhibition of gastric acid secretion by omeprazole in the dog. The Journal of pharmacology and experimental therapeutics 295(2): 662-669.
Amori L, Guidetti P, Pellicciari R, Kajii Y and Schwarcz R (2009) On the relationship between the two branches of the kynurenine pathway in the rat brain in vivo. Journal of neurochemistry 109(2): 316-325.
Chang C, Byon W, Lu Y, Jacobsen LK, Badura LL, Sawant-Basak A, Miller E, Liu J, Grimwood S, Wang EQ and Maurer TS (2011) Quantitative PK-PD model-based translational pharmacology of a novel kappa opioid receptor antagonist between rats and humans. The AAPS journal 13(4): 565-575.
Danhof M, de Jongh J, De Lange EC, Della Pasqua O, Ploeger BA and Voskuyl RA (2007) Mechanism-based pharmacokinetic-pharmacodynamic modeling: biophase distribution, receptor theory, and dynamical systems analysis. Annual review of pharmacology and toxicology 47: 357-400.
Dayneka NL, Garg V and Jusko WJ (1993) Comparison of four basic models of indirect pharmacodynamic responses. J Pharmacokinet Biopharm 21(4): 457-478.
Deigner HP, Kinscherf R, Claus R, Fyrnys B, Blencowe C and Hermetter A (1999) Novel reversible, irreversible and fluorescent inhibitors of platelet-activating factor acetylhydrolase as mechanistic probes. Atherosclerosis 144(1): 79-90.
DiNatale BC, Murray IA, Schroeder JC, Flaveny CA, Lahoti TS, Laurenzana EM, Omiecinski CJ and Perdew GH (2010) Kynurenic acid is a potent endogenous aryl hydrocarbon receptor ligand that synergistically induces interleukin-6 in the presence of inflammatory signaling. Toxicological sciences : an official journal of the Society of Toxicology 115(1): 89-97.
Dounay AB, Anderson M, Bechle BM, Campbell BM, Claffey MM, Evdokimov A, Evrard E, Fonseca KR, Gan X, Ghosh S, Hayward MM, Horner W, Kim JY, McAllister LA, Pandit J, Paradis V, Parikh VD, Reese MR, Rong S, Salafia MA, Schuyten K, Strick CA, Tuttle JB, Valentine J, Wang H, Zawadzke LE and Verhoest PR (2012) Discovery of Brain-Penetrant, Irreversible Kynurenine Aminotransferase II Inhibitors for Schizophrenia. ACS Med Chem Lett 3(3): 187-192.
Erhardt S, Blennow K, Nordin C, Skogh E, Lindstrom LH and Engberg G (2001) Kynurenic acid levels are elevated in the cerebrospinal fluid of patients with schizophrenia. Neuroscience letters 313(1-2): 96-98.
Ferron GM, McKeand W and Mayer PR (2001) Pharmacodynamic modeling of pantoprazole's irreversible effect on gastric acid secretion in humans and rats. Journal of clinical pharmacology 41(2): 149-156.
Gabrielsson J, Dolgos H, Gillberg PG, Bredberg U, Benthem B and Duker G (2009) Early integration of pharmacokinetic and dynamic reasoning is essential for optimal development of lead compounds: strategic considerations. Drug discovery today 14(7-8): 358-372.
Guidetti P, Amori L, Sapko MT, Okuno E and Schwarcz R (2007) Mitochondrial aspartate aminotransferase: a third kynurenate-producing enzyme in the mammalian brain. Journal of neurochemistry 102(1): 103-111.
Guidetti P, Okuno E and Schwarcz R (1997) Characterization of rat brain kynurenine aminotransferases I and II. Journal of neuroscience research 50(3): 457-465.
Han Q, Cai T, Tagle DA and Li J (2010) Structure, expression, and function of kynurenine aminotransferases in human and rodent brains. Cellular and molecular life sciences : CMLS 67(3): 353-368.
This article has not been copyedited and formatted. The final version may differ from this version.Molecular Pharmacology Fast Forward. Published on May 31, 2018 as DOI: 10.1124/mol.118.111625
at ASPE
T Journals on M
arch 7, 2020m
olpharm.aspetjournals.org
Dow
nloaded from
MOL #111625
28
Henderson JL, Sawant-Basak A, Tuttle JB, Dounay AB, McAllister LA, Pandit J, Rong S, Hou X, Bechle BM, Kim J-Y, Parikh V, Ghosh S, Evrard E, Zawadzke LE, Salafia MA, Rago B, Obach RS, Clark A, Fonseca KR, Chang C and Verhoest PR (2013) Discovery of hydroxamate bioisosteres as KAT II inhibitors with improved oral bioavailability and pharmacokinetics. Med Chem Commun 4: 125-129.
Hilmas C, Pereira EF, Alkondon M, Rassoulpour A, Schwarcz R and Albuquerque EX (2001) The brain metabolite kynurenic acid inhibits alpha7 nicotinic receptor activity and increases non-alpha7 nicotinic receptor expression: physiopathological implications. The Journal of neuroscience : the official journal of the Society for Neuroscience 21(19): 7463-7473.
Homer A (1914) The constitution of kynurenic acid. The Journal of biological chemistry 17: 509-518. Hutmacher MM, Mukherjee D, Kowalski KG and Jordan DC (2005) Collapsing mechanistic models: an
application to dose selection for proof of concept of a selective irreversible antagonist. Journal of pharmacokinetics and pharmacodynamics 32(3-4): 501-520.
Kalvass JC, Maurer TS and Pollack GM (2007) Use of plasma and brain unbound fractions to assess the extent of brain distribution of 34 drugs: comparison of unbound concentration ratios to in vivo p-glycoprotein efflux ratios. Drug Metab Dispos 35(4): 660-666.
Kessler M, Terramani T, Lynch G and Baudry M (1989) A glycine site associated with N-methyl-D-aspartic acid receptors: characterization and identification of a new class of antagonists. Journal of neurochemistry 52(4): 1319-1328.
Kiss C, Ceresoli-Borroni G, Guidetti P, Zielke CL, Zielke HR and Schwarcz R (2003) Kynurenate production by cultured human astrocytes. Journal of neural transmission (Vienna, Austria : 1996) 110(1): 1-14.
Koshy Cherian A, Gritton H, Johnson DE, Young D, Kozak R and Sarter M (2014) A systemically-available kynurenine aminotransferase II (KAT II) inhibitor restores nicotine-evoked glutamatergic activity in the cortex of rats. Neuropharmacology 82c: 41-48.
Kozak R, Campbell BM, Strick CA, Horner W, Hoffmann WE, Kiss T, Chapin DS, McGinnis D, Abbott AL, Roberts BM, Fonseca K, Guanowsky V, Young DA, Seymour PA, Dounay A, Hajos M, Williams GV and Castner SA (2014) Reduction of brain kynurenic acid improves cognitive function. The Journal of neuroscience : the official journal of the Society for Neuroscience 34(32): 10592-10602.
Kuzmic P (1996) Program DYNAFIT for the analysis of enzyme kinetic data: application to HIV proteinase. Analytical biochemistry 237(2): 260-273.
Kuzmic P (2009) DynaFit--a software package for enzymology. Methods in enzymology 467: 247-280. Linderholm KR, Alm MT, Larsson MK, Olsson SK, Goiny M, Hajos M, Erhardt S and Engberg G (2016)
Inhibition of kynurenine aminotransferase II reduces activity of midbrain dopamine neurons. Neuropharmacology 102: 42-47.
Lu H, Kopcho L, Ghosh K, Witmer M, Parker M, Gupta S, Paul M, Krishnamurthy P, Laksmaiah B, Xie D, Tredup J, Zhang L and Abell LM (2016) Development of a RapidFire mass spectrometry assay and a fluorescence assay for the discovery of kynurenine aminotransferase II inhibitors to treat central nervous system disorders. Analytical biochemistry 501: 56-65.
Luu KT, Bergqvist S, Chen E, Hu-Lowe D and Kraynov E (2012) A model-based approach to predicting the human pharmacokinetics of a monoclonal antibody exhibiting target-mediated drug disposition. The Journal of pharmacology and experimental therapeutics 341(3): 702-708.
Olsson SK, Samuelsson M, Saetre P, Lindstrom L, Jonsson EG, Nordin C, Engberg G, Erhardt S and Landen M (2010) Elevated levels of kynurenic acid in the cerebrospinal fluid of patients with bipolar disorder. Journal of psychiatry & neuroscience : JPN 35(3): 195-199.
This article has not been copyedited and formatted. The final version may differ from this version.Molecular Pharmacology Fast Forward. Published on May 31, 2018 as DOI: 10.1124/mol.118.111625
at ASPE
T Journals on M
arch 7, 2020m
olpharm.aspetjournals.org
Dow
nloaded from
MOL #111625
29
Passera E, Campanini B, Rossi F, Casazza V, Rizzi M, Pellicciari R and Mozzarelli A (2011) Human kynurenine aminotransferase II--reactivity with substrates and inhibitors. The FEBS journal 278(11): 1882-1900.
Pellicciari R, Venturoni F, Bellocchi D, Carotti A, Marinozzi M, Macchiarulo A, Amori L and Schwarcz R (2008) Sequence variants in kynurenine aminotransferase II (KAT II) orthologs determine different potencies of the inhibitor S-ESBA. ChemMedChem 3(8): 1199-1202.
Rempel BP and Withers SG (2008) Covalent inhibitors of glycosidases and their applications in biochemistry and biology. Glycobiology 18(8): 570-586.
Robbins TW and Murphy ER (2006) Behavioural pharmacology: 40+ years of progress, with a focus on glutamate receptors and cognition. Trends Pharmacol Sci 27(3): 141-148.
Rossi F, Garavaglia S, Montalbano V, Walsh MA and Rizzi M (2008) Crystal structure of human kynurenine aminotransferase II, a drug target for the treatment of schizophrenia. The Journal of biological chemistry 283(6): 3559-3566.
Schmidt W, Guidetti P, Okuno E and Schwarcz R (1993) Characterization of human brain kynurenine aminotransferases using [3H]kynurenine as a substrate. Neuroscience 55(1): 177-184.
Schwarcz R, Rassoulpour A, Wu HQ, Medoff D, Tamminga CA and Roberts RC (2001) Increased cortical kynurenate content in schizophrenia. Biological psychiatry 50(7): 521-530.
Schwartz PA, Kuzmic P, Solowiej J, Bergqvist S, Bolanos B, Almaden C, Nagata A, Ryan K, Feng J, Dalvie D, Kath JC, Xu M, Wani R and Murray BW (2014) Covalent EGFR inhibitor analysis reveals importance of reversible interactions to potency and mechanisms of drug resistance. Proceedings of the National Academy of Sciences of the United States of America 111(1): 173-178.
Singh K, Orr JM and Abbott FS (1988) Pharmacokinetics and enterohepatic circulation of 2-n-propyl-4-pentenoic acid in the rat. Drug Metab Dispos 16(6): 848-852.
Thomsen MS, Hansen HH, Timmerman DB and Mikkelsen JD (2010) Cognitive improvement by activation of alpha7 nicotinic acetylcholine receptors: from animal models to human pathophysiology. Curr Pharm Des 16(3): 323-343.
Tuttle JB, Anderson M, Bechle BM, Campbell BM, Chang C, Dounay AB, Evrard E, Fonseca KR, Gan X, Ghosh S, Horner W, James LC, Kim J-Y, McAllister LA, Pandit J, Parikh VD, Rago BJ, Salafia MA, Strick CA, Zawadzke LE and Verhoest PR (2013) Structure-Based Design of Irreversible Human KAT II Inhibitors: Discovery of New Potency-Enhancing Interactions. ACS Medicinal Chemistry Letters 4(1): 37-40.
Zhang L, Beal SL and Sheiner LB (2003) Simultaneous vs. sequential analysis for population PK/PD data I: best-case performance. Journal of pharmacokinetics and pharmacodynamics 30(6): 387-404.
Zhao L, Shang EY and Sahajwalla CG (2012) Application of pharmacokinetics-pharmacodynamics/clinical response modeling and simulation for biologics drug development. J Pharm Sci 101(12): 4367-4382.
This article has not been copyedited and formatted. The final version may differ from this version.Molecular Pharmacology Fast Forward. Published on May 31, 2018 as DOI: 10.1124/mol.118.111625
at ASPE
T Journals on M
arch 7, 2020m
olpharm.aspetjournals.org
Dow
nloaded from
MOL #111625
30
Footnotes: This work was supported by Pfizer Inc
The first and second author have contributed equally to the manuscript.
The abbreviations used are: KAT II, kynurenine aminotransferases II; KYNA: Kynurenic acid; NHP:
non-human primate; PLP: pyridoxal phosphate; L-KYN: L- kynurenine; IVIVC: in vitro-in vivo
correlation; PKPD, pharmacokinetic pharmacodynamic;
This article has not been copyedited and formatted. The final version may differ from this version.Molecular Pharmacology Fast Forward. Published on May 31, 2018 as DOI: 10.1124/mol.118.111625
at ASPE
T Journals on M
arch 7, 2020m
olpharm.aspetjournals.org
Dow
nloaded from
MOL #111625
31
Figure Legends
Figure 1. The chemical structures of PF-04859989, PF-05579960, PF-06253133 and PF-05182357
Figure 2. Mechanism-based PK-PD model structure. 𝐾𝐾𝑠𝑠𝑠𝑠𝑠𝑠𝐾𝐾𝐾𝐾𝐾𝐾𝐾𝐾𝐾𝐾, 𝐾𝐾𝑠𝑠𝑠𝑠𝑠𝑠1𝐾𝐾𝑑𝑑𝑑𝑑𝐾𝐾 𝐻𝐻𝐿𝐿𝑎𝑎 𝐾𝐾𝑠𝑠𝑠𝑠𝑠𝑠2𝐾𝐾𝑑𝑑𝑑𝑑𝐾𝐾 represent the synthesis
rates for KAT II, KYNA (via non-KAT II) and KYNA (via KAT II), respectively. 𝑘𝑘𝑑𝑑𝑑𝑑𝑑𝑑𝐾𝐾𝐾𝐾𝐾𝐾𝐾𝐾𝐾𝐾 𝐻𝐻𝐿𝐿𝑎𝑎 𝑘𝑘𝑑𝑑𝑑𝑑𝑑𝑑𝐾𝐾𝑑𝑑𝑑𝑑𝐾𝐾
represent the degradation rates for KAT II and KYNA, respectively. 𝑘𝑘𝑖𝑖𝑠𝑠𝑖𝑖𝑖𝑖𝑑𝑑,𝑖𝑖𝑎𝑎𝑎𝑎𝐾𝐾𝑑𝑑𝑑𝑑𝐾𝐾 represents the inactivation
rate of KAT II by irreversible inhibitors.
Figure 3. Comparison of model-simulated time courses of KAT II activity recovery after irreversible
inhibition in rat mixed glia (A) and primary human astrocytes (B) to corresponding observations. Solid
circles represent the observed data, solid lines represent the simulated median, shaded area represents the
5th and 95th percentiles from model prediction.
Figure 4. Representative reaction progress curves for human KAT II in order to estimate the in vitro
kinact/KI. The depletion of L-KYNA (represented by the loss of absorbance at 370 nm, ABS) in the
presence of different levels of PF-06253133 is plotted.
Figure 5. Comparison of model-simulated time courses of irreversible inhibitor brain concentrations (A,
PF-04859989; B, PF-05579960; C: PF-06253133) and brain KYNA lowering effects (D, PF-04859989;
E, PF-05579960; F: PF-06253133) to corresponding observations in rats. Solid circles represent observed
data, solid lines represent the simulated median, shaded area represents the 5th and 95th percentiles from
model prediction.
Figure 6. Comparison of model-simulated time courses of PF-05182357 plasma concentrations (A) and
CSF KYNA lowering response (B) to corresponding observations for each individual NHP. Individuals
(ID1 – ID5) are from 1 mg/kg group; individuals (ID6 – ID10) are from 3 mg/kg group; individuals (ID11
This article has not been copyedited and formatted. The final version may differ from this version.Molecular Pharmacology Fast Forward. Published on May 31, 2018 as DOI: 10.1124/mol.118.111625
at ASPE
T Journals on M
arch 7, 2020m
olpharm.aspetjournals.org
Dow
nloaded from

MOL #111625
32
and ID 12) are from vehicle group. Solid circles represent observed data, solid lines represent the
simulated median, shaded area represents the 5th and 95th percentiles from model prediction.
Figure 7. Simulated clinical central KYNA lowering effect after oral dosing of PF-06253133 based on the
projected human KAT II turnover half life of 43.4 hours (A) or the hypothetical KAT II turnover half life
of 1 hour (B). Solid line represents PD response (i.e. KYNA lowering) and dashed line represents PK
profile (i.e. PF-06253133 plasma concentration).
This article has not been copyedited and formatted. The final version may differ from this version.Molecular Pharmacology Fast Forward. Published on May 31, 2018 as DOI: 10.1124/mol.118.111625
at ASPE
T Journals on M
arch 7, 2020m
olpharm.aspetjournals.org
Dow
nloaded from
MOL #111625
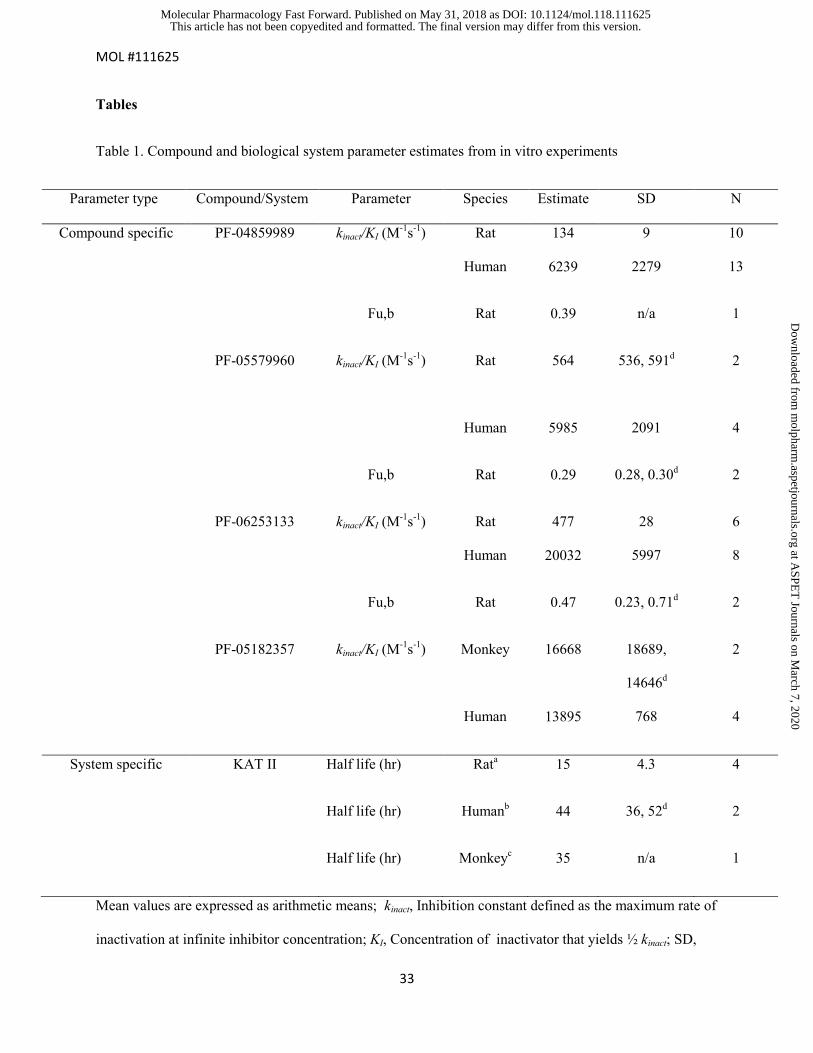
33
Tables
Table 1. Compound and biological system parameter estimates from in vitro experiments
Parameter type Compound/System Parameter Species Estimate SD N
Compound specific PF-04859989 kinact/KI (M-1s-1) Rat 134 9 10
Human 6239 2279 13
Fu,b Rat 0.39 n/a 1
PF-05579960 kinact/KI (M-1s-1) Rat 564 536, 591d
2
Human 5985 2091 4
Fu,b Rat 0.29 0.28, 0.30d 2
PF-06253133 kinact/KI (M-1s-1) Rat 477 28 6
Human 20032 5997 8
Fu,b Rat 0.47 0.23, 0.71d 2
PF-05182357 kinact/KI (M-1s-1) Monkey 16668 18689,
14646d
2
Human 13895 768 4
System specific KAT II Half life (hr) Rata 15 4.3 4
Half life (hr) Humanb 44 36, 52d 2
Half life (hr) Monkeyc 35 n/a 1
Mean values are expressed as arithmetic means; kinact, Inhibition constant defined as the maximum rate of
inactivation at infinite inhibitor concentration; KI, Concentration of inactivator that yields ½ kinact; SD,
This article has not been copyedited and formatted. The final version may differ from this version.Molecular Pharmacology Fast Forward. Published on May 31, 2018 as DOI: 10.1124/mol.118.111625
at ASPE
T Journals on M
arch 7, 2020m
olpharm.aspetjournals.org
Dow
nloaded from

MOL #111625
34
Standard deviation; KAT II, kynurenine aminotransferase II; Fu,b, Fraction unbound in brain tissue; n/a,
not applicable; a From primary rat mixed glia and astrocytes; b From primary human astrocytes; cFrom
primary monkey hepatocytes; dIndividual parameter estimates were listed when N is less than 3
This article has not been copyedited and formatted. The final version may differ from this version.Molecular Pharmacology Fast Forward. Published on May 31, 2018 as DOI: 10.1124/mol.118.111625
at ASPE
T Journals on M
arch 7, 2020m
olpharm.aspetjournals.org
Dow
nloaded from

MOL #111625
35
Table 2. KM values for L-KYN of different KAT II Enzymes
Assay KM, mM ± SD N
Human KAT II 1.11 ± 0.07 3
Rat KAT II 1.50 ± 0.28 3
Rhesus monkey KAT II 1.44 ± 0.09 3
Values are expressed as arithmetic means
Km, the concentration of substrate that results in half maximal reaction velocity; SD, standard deviation
of the mean; KAT II, kynurenine aminotransferase II.
This article has not been copyedited and formatted. The final version may differ from this version.Molecular Pharmacology Fast Forward. Published on May 31, 2018 as DOI: 10.1124/mol.118.111625
at ASPE
T Journals on M
arch 7, 2020m
olpharm.aspetjournals.org
Dow
nloaded from

MOL #111625
36
Table 3. Compound and biological system parameter estimates from in vivo experiments
Parameter type Compound/System Parameter Species Estimate 90% CI
Compound specific PF-04859989 kinact/KI (M-1s-1) Rat 80.6 (17.1, 89.8)
PF-05579960 kinact/KI (M-1s-1) Rat 535.4 (123.6, 603.4)
PF-06253133 kinact/KI (M-1s-1) Rat 848.6 (170.4, 991)
PF-05182357 kinact/KI (M-1s-1) Monkey 548.3 (421.5, 14850)
system specific KAT II Half life (hr) Rat 15.5 (14.8, 16.2)
KYNA Half life (hr) Rat 0.001a n/a
KAT II contribution
(%)
Rat 74.9 (73.4, 100)
KAT II Half life (hr) Monkey 76.3 (6.36, 118.9)
KYNA Half life (hr) Monkey 0.97 (0.70, 1.5)
KAT II contribution
(%)
Monkey 85.9 (82.7, 90.7)
CI, Confidence interval; kinact, Inhibition constant defined as the maximum rate of inactivation at infinite
inhibitor concentration; KI, Concentration of inactivator that yields ½ kinact; KAT II, kynurenine
aminotransferase II; KYNA, Kynurenic acid; n/a, not applicable; a parameter is fixed
This article has not been copyedited and formatted. The final version may differ from this version.Molecular Pharmacology Fast Forward. Published on May 31, 2018 as DOI: 10.1124/mol.118.111625
at ASPE
T Journals on M
arch 7, 2020m
olpharm.aspetjournals.org
Dow
nloaded from
MOL #111625
37
Figures Figure 1
This article has not been copyedited and formatted. The final version may differ from this version.Molecular Pharmacology Fast Forward. Published on May 31, 2018 as DOI: 10.1124/mol.118.111625
at ASPE
T Journals on M
arch 7, 2020m
olpharm.aspetjournals.org
Dow
nloaded from

MOL #111625
38
Figure 2
This article has not been copyedited and formatted. The final version may differ from this version.Molecular Pharmacology Fast Forward. Published on May 31, 2018 as DOI: 10.1124/mol.118.111625
at ASPE
T Journals on M
arch 7, 2020m
olpharm.aspetjournals.org
Dow
nloaded from

MOL #111625
39
Figure 3
This article has not been copyedited and formatted. The final version may differ from this version.Molecular Pharmacology Fast Forward. Published on May 31, 2018 as DOI: 10.1124/mol.118.111625
at ASPE
T Journals on M
arch 7, 2020m
olpharm.aspetjournals.org
Dow
nloaded from
MOL #111625
40
Figure 4
This article has not been copyedited and formatted. The final version may differ from this version.Molecular Pharmacology Fast Forward. Published on May 31, 2018 as DOI: 10.1124/mol.118.111625
at ASPE
T Journals on M
arch 7, 2020m
olpharm.aspetjournals.org
Dow
nloaded from

MOL #111625
41
Figure 5
This article has not been copyedited and formatted. The final version may differ from this version.Molecular Pharmacology Fast Forward. Published on May 31, 2018 as DOI: 10.1124/mol.118.111625
at ASPE
T Journals on M
arch 7, 2020m
olpharm.aspetjournals.org
Dow
nloaded from
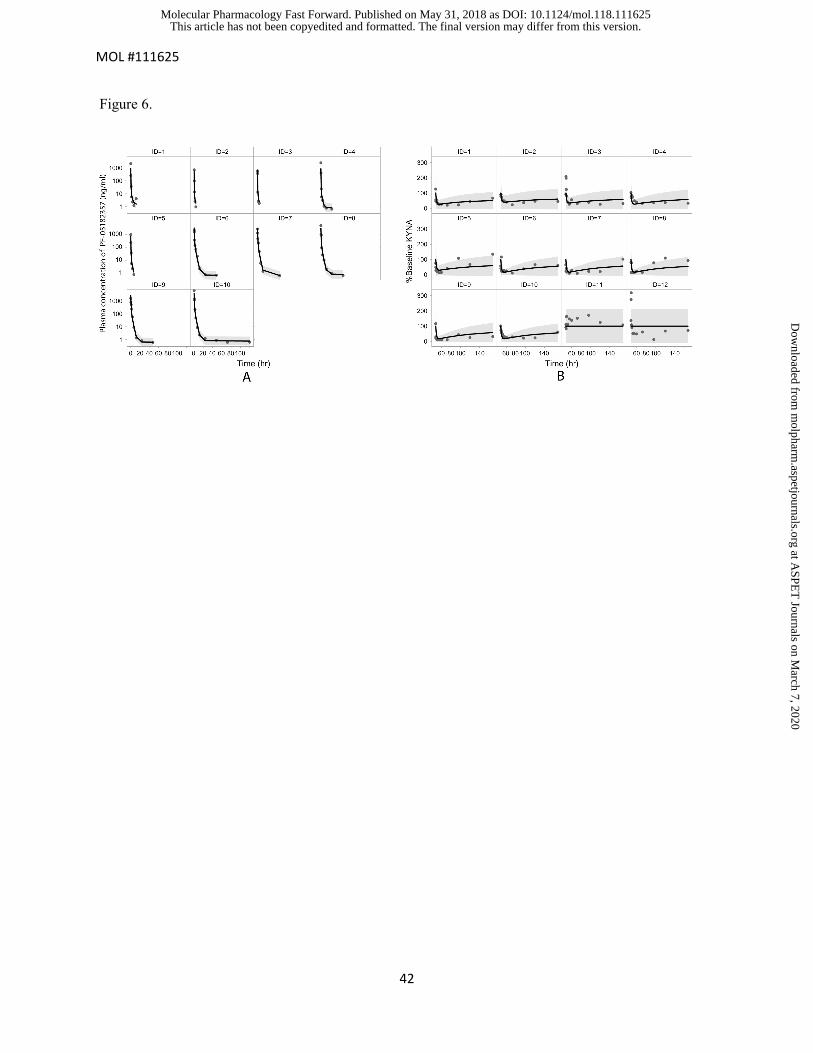
MOL #111625
42
Figure 6.
This article has not been copyedited and formatted. The final version may differ from this version.Molecular Pharmacology Fast Forward. Published on May 31, 2018 as DOI: 10.1124/mol.118.111625
at ASPE
T Journals on M
arch 7, 2020m
olpharm.aspetjournals.org
Dow
nloaded from

MOL #111625
43
Figure 7
A
B
0
0.1
0.2
0.3
0.4
0.5
0.6
0.7
0.8
0.9
1
0
0.2
0.4
0.6
0.8
1
1.2
0 50 100 150 200 250
PF-0
6253
133
plas
ma
conc
entr
atio
n (n
g/m
l)
Frac
tion
of b
asel
ine
KYN
A
Time after dose (hr)
PD
PK
0
0.1
0.2
0.3
0.4
0.5
0.6
0.7
0.8
0.9
1
0
0.2
0.4
0.6
0.8
1
1.2
0 50 100 150 200 250
PF-0
6253
133
plas
ma
conc
entr
atio
n (n
g/m
l)
Frac
tion
of b
asel
ine
KYN
A
Time after dose (hr)
PD
PK
This article has not been copyedited and formatted. The final version may differ from this version.Molecular Pharmacology Fast Forward. Published on May 31, 2018 as DOI: 10.1124/mol.118.111625
at ASPE
T Journals on M
arch 7, 2020m
olpharm.aspetjournals.org
Dow
nloaded from