quantitative structure-mutagenic activity relationships of triazino indole derivatives
TRANSCRIPT
Mutation Research, 268 (1992) 1-9 i © 1992 Elsevier Science Publishers B.V. All rights reserved 0027-5107/92/$05.00
MUT05091
Quantitative structure-mutagenic activity relationships of triazino indole derivatives
Est re l l a Ga rc i a a, A d e l a L o p e z - d e - C e r a i n a, Vic to r M a r t i n e z - M e r i n o b a n d A n t o n i o M o n g e c
a C.I.F.A., Uniuersidad de Navarra, b Departamento de Qu[mica, Universidad Pdblica de Navarra and c Departamento de Qubnica, Orgdnica y Farmacet~tica, Um'versidad de Navarra, Pamplona (Spain)
(Received 18 June 1991) (Revision received 29 October 1991)
(Accepted 26 November 1991)
Keywords: Mutagenesis; Triazino indole derivatives; Ames test; Quantitative structure-activity relationship
Summary
The mutagenicity of 3-(4'-benzylidenamino)-SH-1,2,3-triazin[5,4-b]-indol-4-one derivatives, new com- pounds with considerable platelet antiaggregating activity, was assayed with the Ames test using the Salmonella typhimurium strains TA97, TA98, TA100 and TA102. The adaptive least-squares method (ALS method) was used to carry out a quantitative structure-activity relationship (QSAR) analysis. Three equations, based on 10 congeners, were found for strains TA97, TA98 and TA100. The results suggest that lipophilicity of the substituent decreases the mutagenicity of the series.
The structure of the triazinoindole skeleton is of particular interest in connection with its possi- ble relationship as an inhibitor of induced platelet aggregation (Arraras, 1990). In a previous paper, we have reported the mutagenic activities of some 3-(4'-benzylidenamino)-5H-1,2,3-triazin[5,4-b]in- dol-4-one derivatives using the Ames test (Garcia et al., 1991). When a structure-activity relation- ship of the derivatives was considered, mutagenic- ity seemed to be modulated by a radical occupy- ing the 4' position of the benzylidenamino group. Compounds with substituents C6H 5 and OC6H5
Correspondence: Dr. Estrella Garc[a, Toxicologla Gen~tica, C.I.F.A., Universidad de Navarra, Apartado 273, 31080 Pam- plona (Spain).
were not mutagenic, compounds with substituents NO 2, COOH, C O O C H 3 and C! were S9-depen- dent mutagens and compounds with H, OH, OCH 3 and NHCOCH 3 were sg-independent mu- tagens. These results prompted us to attempt a quantitative structure-activity relationship (OSAR) analysis. If any quantitative relationship were detected, this would permit us to develop compounds with the same activity as platelet anti- aggregating agents, but without mutagenic activ- ity detected in the Ames test.
Although the Ames test cannot give a defini- tive answer concerning the mutagenicity of a given compound in humans, we have chosen it because it is, most likely, the best validated and most accepted short-term test for predicting carcino- genicity (Brusick and Auletta, 1985).
Analysis of structure-activity relationships (SAR) and the potential for predicting muta- genicity from structure have evolved gradually (Tute, 1990). In the last 30 years, a number of methods for the study of SAR have been devel- oped (Fujita, 1990; Craig, 1990). Although the majority of them arc aimed at producing pharma- ceutical drugs, they can also bc applied to muta- genicity (Benigni et al., 1989).
This paper describes the analysis of the QSARs of these derivatives for mutagenic activity using the adaptive least-squares (ALS) method (Mori- guchi and Komatsu, 1977; Kawashima et al., 1986). In the parametrization of structural fea- tures for the ALS study, we examined physico- chemical parameters of 4' substituents in the 3-(4'-benzylidenamino)-SH-1,2,3-triazin[5,4-b]in- dol-4-one derivatives.
The ALS method does not assume any particu- lar distribution of the data and can be considered to be a technique of pattern recognition. This system has been devised (a) to formulate a QSAR in a single mathematical equation, irrespective of the number of activity classes and (b) to catego- rize multidimensional structural patterns into multiple ordered classes by means of the equa- tion. It has been demonstrated that the ALS method is superior and more stable in recogni- tion and prediction of ordered categorical data
than linear discriminant analysis (LDA), the K- nearest-neighbor method (KNN) and nonelemen- tary discriminant analysis (NDA) (Moriguchi et al., 1980).
Material and methods
Chemistry Ten compounds were prepared in the Organic
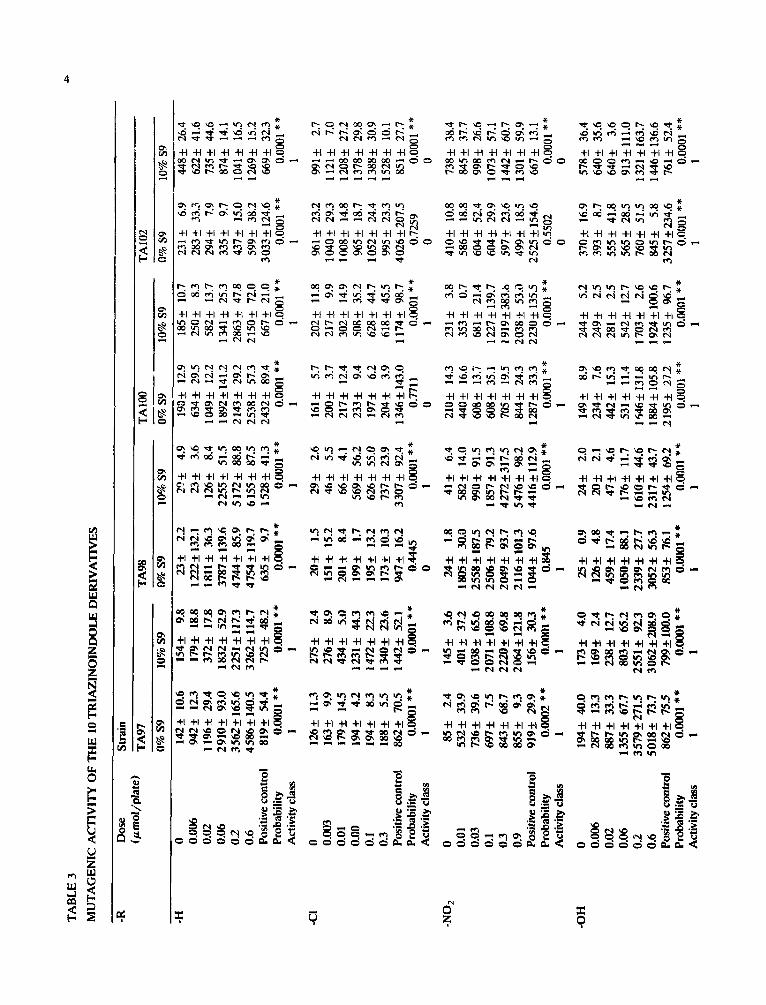
Chemistry Department of the University of Navarra (Arrarfis, 1990). The purity of the syn-
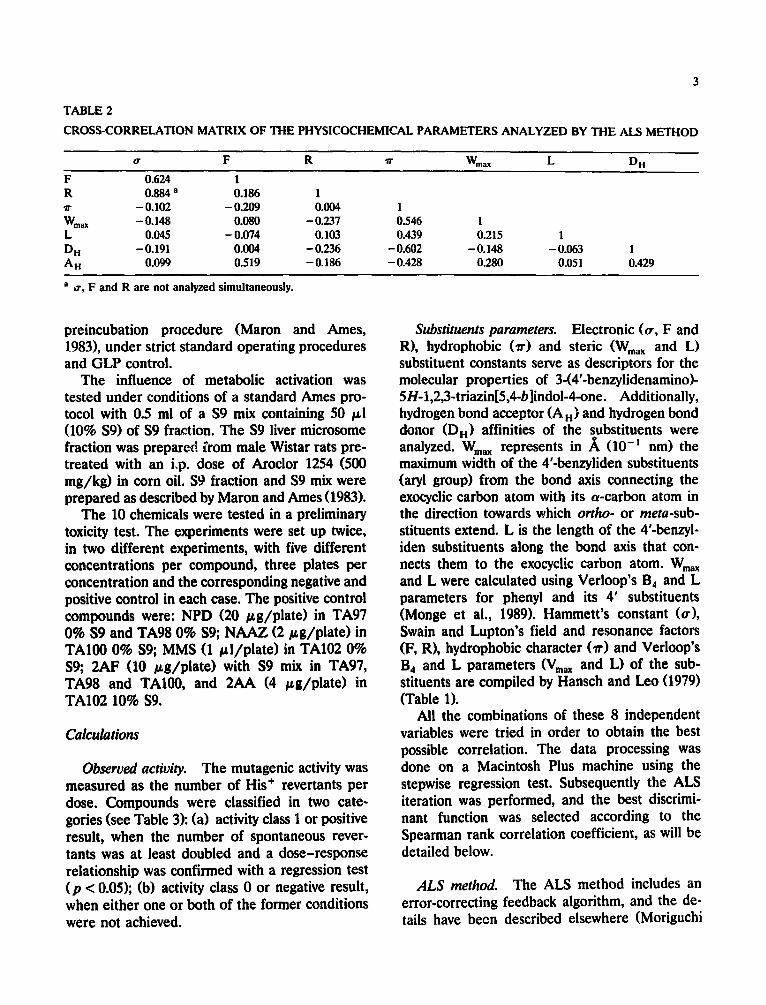
thesized compounds was tested by elemental
analysis (CHN). IR was recorded on a Perkin Elmer 681 instrument, and IH-NMR and 13C-
NMR spectra wcrc recorded on a Bruker AC 200E at 200 and 50 MHz respectively. Mass spec-
tra wcrc obtained on a Hcwlett-Packard spec-
trometer model 5988A by direct insertion probe (DIP). Ionization was performed by electron im-
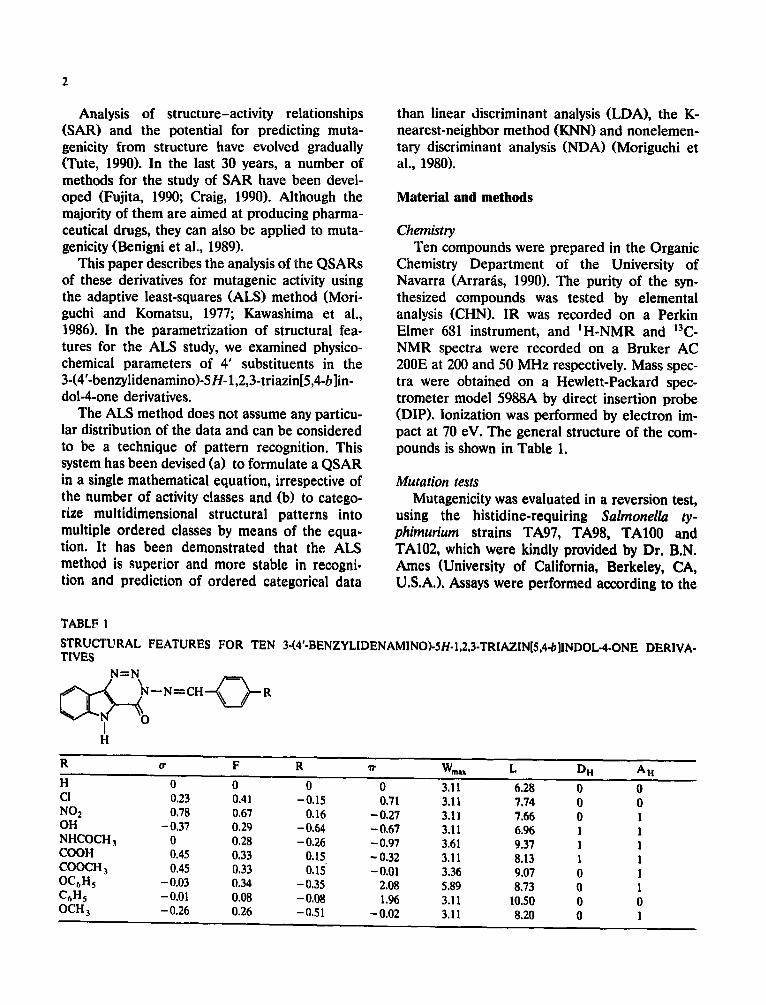
pact at 70 cV. The general structure of the com- pounds is shown in Table 1.
Mutation tests Mutagenicity was evaluated in a reversion test,
using the histidine-requiring Salmonella ty- phimurium strains TA97, TA98, TA100 and TA102, which were kindly provided by Dr. B.N. Ames (University of California, Berkeley, CA, U.S.A.). Assays were performed according to the
TABLF I
STRUCTURAL FEATURES FOR TEN 3-(4'-BENZYLIDENAMINO).5H.I,2.3.TRIAZIN[5,4.b]INDOL.4.ONE DERIVA- TIVES
N=N
~N--CH R
v -~ O I
H
R tr F R ~- Wmax L DH AH
H 0 0 0 0 3,11 6.28 0 0 CI 0,23 0.41 -0.15 0.71 3.11 7.74 0 0 NO2 0,78 0.67 0.16 - 0,27 3.11 7.66 0 I OH - 0,37 0.29 - 0.64 - 0.67 3.11 6.96 1 1 NHCOCH 3 0 0.28 - 0.26 - 0.97 3,61 9.37 1 1 COOH 0.45 0.33 0.15 - 0.32 3.11 8.13 1 1 COOCH 3 0.45 0.33 0.15' - 0.01 3.36 9.07 0 I OC6H 5 - 0.03 0.34 - 0.35 2.08 5.89 8.73 0 1 C6H5 - 0.01 0.08 - 0.08 1.96 3.11 10.50 0 0 OCH 3 - 0.26 0.26 - 0.51 - 0.02 3.11 8.20 0 1
3
T A B L E 2
C R O S S - C O R R E L A T I O N M A T R I X O F T H E P H Y S I C O C H E M I C A L P A R A M E T E R S A N A L Y Z E D BY T H E ALS M E T H O D
o" F R ¢r Wm~ L D H
F 0.624 1
R 0.884 a 0.186 1 ~r - 0.102 - 0.209 0.004 1
Wma x - 0.148 0.080 - 0.237 0.546 L 0.045 - 0.074 0.103 0.439
D H -- 0.191 0.004 -- 0.236 -- 0.602 A H 0.099 0.519 -- 0.186 -- 0.428
1 0.215 1
- 0 . 1 4 8 -0 .063 1
0.280 0.051 0.429
a ~ , F and R are not analyzed simultaneously.
preincubation procedure (Maron and Ames, 1983), under strict standard operating procedures and GLP control.
The influence of metabolic activation was tested under conditions of a standard Ames pro- tocol with 0.5 ml of a $9 mix containing 50 t~i (10% $9) of $9 fraction. The $9 liver microsome fraction was prepare~! [rom male Wistar rats pre- treated with an Lp. dose of Aroclor 1254 (500 mg/kg) in corn oil. $9 fraction and $9 mix were prepared as described by Maron and Ames (1983).
The 10 chemicals were tested in a preliminary toxicity test. The experiments were set up twice, in two different experiments, with five different concentrations per compound, three plates per concentration and the corresponding negative and positive control in each case. The positive control compounds were: NPD (20 /zg/plate) in TA97 0% $9 and TA98 0% $9; NAAZ (2/~g/plate) in TA100 0% $9; MMS (1 ~l /plate) in TA102 0% $9; 2AF (10 /~g/plate) with $9 mix in TA97, TA98 and TA100, and 2AA (4 ~g/plate) in TA102 10% $9.
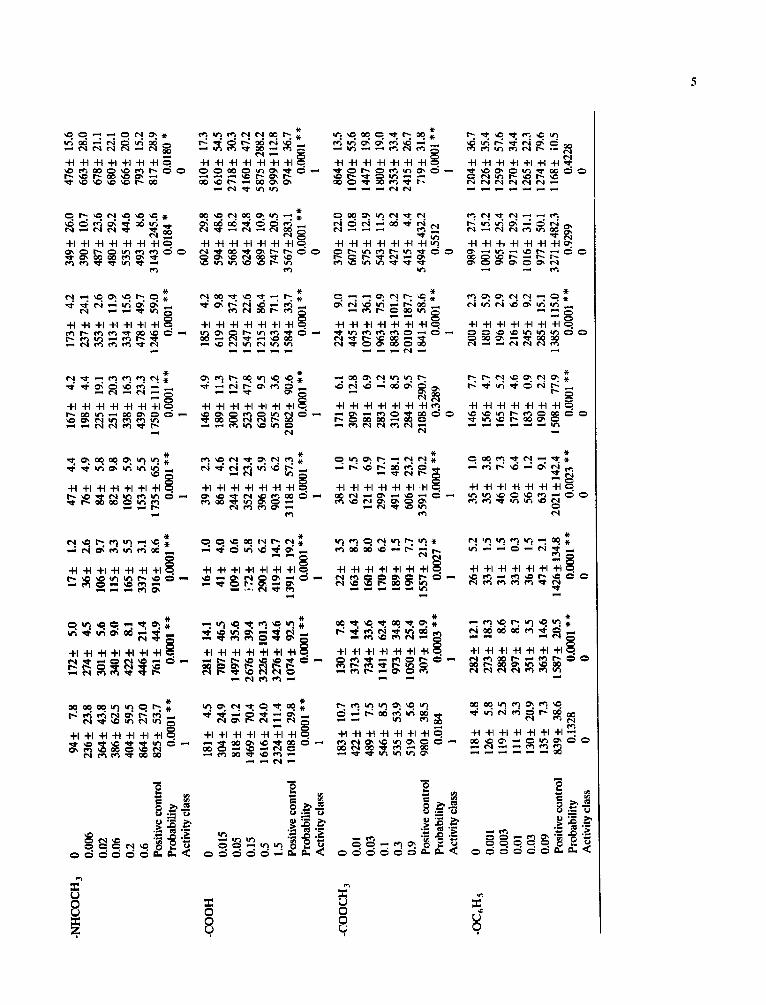
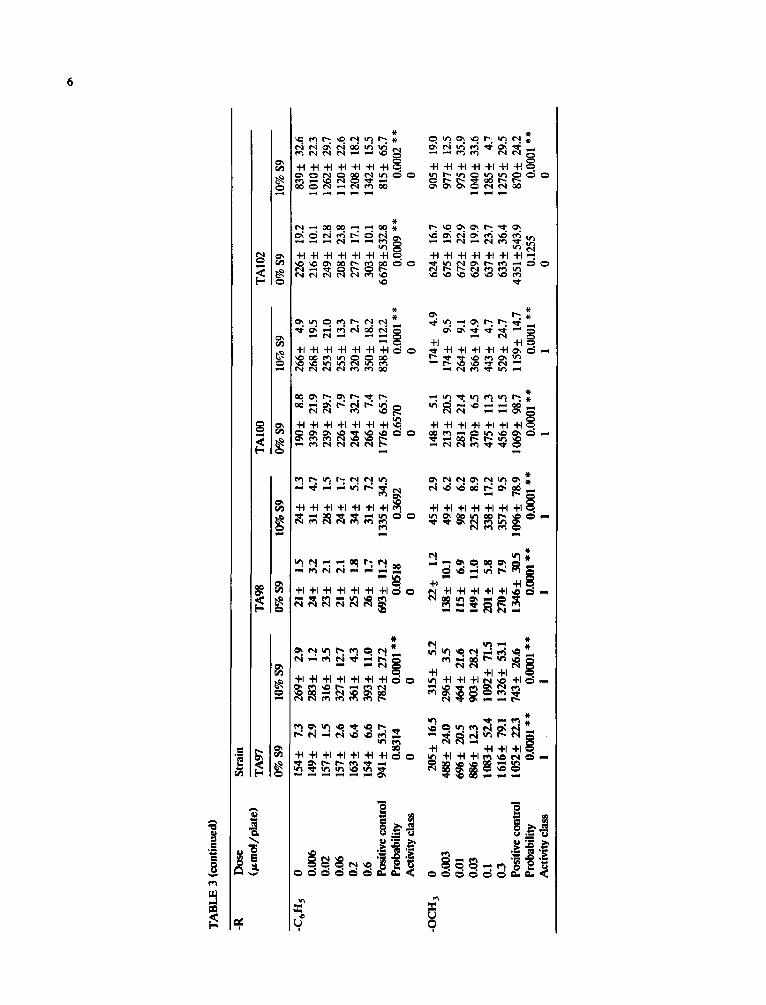
Calculations
Observed activity. The mutagenic activity was measured as the number of His + revertants per dose. Compounds were classified in two cate- gories (see Table 3): (a) activity class 1 or positive result, when the number of spontaneous rever- tants was at least doubled and a dose-response relationship was confirmed with a regression test (p < 0.05); (b) activity class 0 or negative result, when either one or both of the former conditions were not achieved.
Substituents parameters. Electronic (~r, F and R), hydrophobic (It) and steric (Wma x and L) substituent constants serve as descriptors for the molecular properties of 3-(4'-benzylidenamino)- 5H- 1,2,3-triazin[5,4-b]indol-4-one. Additionally, hydrogen bond acceptor (A H) and hydrogen bond donor (D H) affinities of the substituents were analyzed. Wma x represents in ,~ (10 -I nm) the maximum width of the 4'-benzyliden substituents (aryl group) from the bond axis connecting the exocyclic carbon atom with its a-carbon atom in the direction towards which ortho- or meta-sub- stituents extend. L is the length of the 4'-benzyl- iden substituents along the bond axis that con- nects them to the exocyclic carbon atom. Wma x and L were calculated using Verloop's B4 and L parameters for phenyi and its 4' substituents (Monge et ai., 1989). HammeR's constant (tr), Swain and Lupton's field and resonance factors (F, R), hydrophobic character (~r) and Verloop's B4 and L parameters (Vm~ and L) of the sub- stituents are compiled by Hansch and Leo (1979) (Table 1).
All the combinations of these 8 independent variables were tried in order to obtain the best possible correlation. The data processing was done on a Macintosh Plus machine using the stepwise regression test. Subsequently the ALS iteration was performed, and the best discrimi- nant function was selected according to the Spearman rank correlation coefficient, as will be detailed below.
ALS method. The ALS method includes an error-correcting feedback algorithm, and the de- tails have been described elsewhere (Moriguchi
TA
BL
E 3
MU
TA
GE
NIC
AC
TIV
ITY
OF
TH
E 1
0 T
RIA
Zlb
lOIN
DO
LE
DE
RIV
AT
IVE
S
-R
Dos
e S
trai
n
Qzm
ol/
pla
te)
TA
97
TA
98
TA
I00
T
A10
2
0% $
9 10
% $
9 0%
$9
10%
$9
0% $
9 10
% $
9 0%
$9
10%
$9
-H
0 14
2+
10.6
15
4_+
9.
8 23
_+
2.2
29_+
4.
9 19
D+_
12.
9 18
5_+
10.7
23
1_+
6.9
448+
26
,4
0.00
6 94
2+_
12.3
17
9_+
18
.8
1222
_+!3
2.1
23_+
3.
6 63
4-+
29
.5
250-
+ 8.
3 28
3-+
33
.3
622-
+ 4
1.6
0.02
11
96+
29
.4
372.
+
17
.8
18
11
_+
36.
3 12
6.+
8.
4 1
04
9_
+ 1
2.2
582-
+
13.7
29
4_+
7.9
735_
+ 44
.6
0,06
29
10_+
93
.0
18
32
_+
5Z
9 3
78
7_
+1
39
.6
2255
-+
51
.5
1892
-+14
1.2
1341
+_
25.3
33
5_+
9.7
874_
+ 14
.1
0.2
3562
_+!6
5.6
2251
_+11
7.3
47
44
+
85.9
5
17
2_
+ 8
8.8
21
43
+
29.2
28
63+
47
.8
437+
1
5.0
10
41+
16
,5
0.6
4586
_+14
0.5
3262
+_1
14.7
47
54_+
119.
7 6
15
5_
+ 8
7.5
25
38+
5
7.3
21
50-+
72
.0
599-
+
38
.2
1269
+
15.2
P
osit
ive
cont
rol
81
9_
+ 5
4.4
725+
48
.2
635_
+
9.7
1528
-+
41.3
24
32+
89
.4
667_
+ 2
1.0
30
33-+
124.
6 66
9+
32.3
P
roba
bili
ty
0.00
01 *
*
0.00
01 *
*
0.00
01 *
*
0.00
01 *
*
0.00
01 *
* 0.
0001
**
0.
0001
**
0.00
01 *
* A
ctiv
ity
clas
s !
! 1
1 1
1 1
1
-CI
0 12
6_+
11.3
27
5-+
2A
20
_+
1.5
29-+
2.
6 16
1-+
5.7
202+
11
.8
961-
+
23.2
99
1+
2.7
0.00
3 16
3+
9.9
276_
+
8.9
151-
+
15.2
46
_+
5.5
200+
3.
7 21
7_+
9.9
1040
+
29
.3
1121
_+
7.0
0.01
17
9_+
14.5
43
4_+
5.
0 20
1_+
8.
4 66
_+
4.1
217+
12
.4
302+
1
4.9
10
08+
1
4.8
1
20
8-+
27.
2 0.
00
194+
4.
2 12
31+
44
.3
199.
+ 1.
7 56
9+
56.2
23
3-+
9.
4 50
8-+
35
.2
965-
+
18
.7
1378
_+ 2
9.8
0.1
194+
8.
3 1
47
2_
+ 2
2.3
195_
+ 13
.2
626_
+ 55
.0
197_
+ 6.
2 62
8_+
44.7
10
52+
24
.4
13
88
-+ 3
0.9
0.3
188_
+
5.5
1340
-+
23.6
17
3-+
10
.3
737_
+ 23
.9
204+
3.
9 61
8+
45.5
99
5+
23
.3
15
28
-+ 1
0.1
Pos
itiv
e co
ntro
l 8
62
_+
70.
5 1
44
2_
+ 5
2.1
947.
+
16
.2
33
07
+
92.4
1
34
6_
+1
43
.0
11
74
-+ 9
8.7
4026
_+20
7.5
851-
+
27.7
P
roba
bili
ty
0.00
01 *
*
0.00
01 *
*
0.44
45
0.00
01 *
*
0.77
11
0.00
01 *
*
0.72
59
0.00
01 *
* A
ctiv
ity
clas
s 1
1 0
1 0
1 0
0
-NO
2 0
85_+
2.
4 14
5+
3.6
24_+
1.
8 41
-+
6.4
210_
+ 14
.3
231-
+ 3.
8 41
0+
10.8
73
8-+
38
.4
0.01
53
2_+
33.9
40
1_+
37.2
18
05+
30
.0
582.
+
14.0
44
0_+
16.6
35
3+
0.7
586+
18
.8
845+
37
.7
0.03
73
6+
39.6
10
38+
65
.6
2558
.+18
7.5
990+
91
.5
608-
+
13.7
68
1-+
21
.4
604-
+
52.4
99
8_+
26.6
0.
1 69
7-+
7.
5 20
71_+
108.
8 25
06.+
79
.2
18
57
_+
91.
3 60
8+
35
.1
1227
_+13
9.7
604+
2
9.9
10
73_+
57.
1 0.
3 84
3_+
68.7
2
22
0+
69
.8
20
49
_+
93.
7 42
72-+
317.
5 70
5-+
1
9.5
19
19-+
383.
6 59
7_+
23
.6
1442
_+ 6
0.7
0.9
855_
+
9.3
20
64
-1-1
21
.8
2116
_+i0
1.3
54
76
_+
98.
2 84
4_+
24
.3
20
38
_+
53.
0 49
9+
18
.5
1301
_+ 5
9.9
Pos
itiv
e co
ntro
l 9
19
_+
29.
9 15
6-+
30.
3 10
44+
97
.6
4416
_+11
2.9
12
87
_+
33
.3
2230
+13
5.5
2525
-+15
4.6
667+
13
.1
Pro
babi
lity
0.
0002
**
0.
0001
**
0.
845
0.00
01 *
* 0.
0001
**
0.
0001
**
0.
5502
0.
0001
**
Act
ivit
y cl
ass
1 1
1 1
1 1
0 0
-OH
0
194-
+ 4
0.0
173_
+
4.0
25_+
0.
9 24
_+
2.0
149_
+ 8.
9 24
4_+
5.2
370_
+ 16
.9
578-
+
36.4
0.
006
287_
+
13.3
16
9_+
2.
4 12
6_+
4.
8 20
_+
2.1
234_
+ 7.
6 24
9_+
2.5
393_
+ 8.
7 64
0_+
35.6
0.
02
887+
33
.3
238_
+ 12
.7
459_
+
17.4
47
_+
4.6
442_
+ 15
.3
281_
+ 2.
5 55
5+
41.8
64
0_+
3.6
0.06
13
55+
67
.7
803_
+ 6
5.2
10
50
_+
88.
1 17
6_+
11.7
53
1_+
11.4
54
2+
12.7
56
5+
28
.5
913_
+11
1.0
0.2
3579
_+27
1.5
25
51
_+
92.
3 2
33
9_
+ 2
7.7
16
10
_+
44.
6 1
64
6_
+1
31
.8
17
03
-+ 2
.6
760+
5
1.5
13
21+
163.
7 0.
6 50
18_+
73
.7
3062
_+20
8.9
30
52
-+ 5
6.3
23
17
_+
43.
7 18
84+
105.
8 19
24_+
100.
6 84
5+
5.8
1446
+13
6.6
Pos
itiv
e co
ntro
l 8
62
_+
75
.5
799-
+10
0.0
853_
+ 7
6.1
12
54-+
69
.2
21
95
+
27,2
12
35_+
96.
7 32
57+
234.
6 76
1_+
52.4
P
roba
bili
ty
0.00
01 *
*
0.00
01 *
*
0.00
01 *
*
0.00
01 *
*
0.00
01 *
* 0.
0001
**
0.00
01 *
* 0,
0001
**
Act
ivit
y cl
ass
1 1
i 1
1 1
1 1
-NH
CO
CH
3
0 9
4+
7.
8 17
2+
5.0
17
±
1.2
47
+
4A
167+
4.
2 17
3±
4.2
0.00
6 23
6+
23.8
27
4+
4.5
36
±
2.6
76
±
4.9
198+
4.
4 23
7±
24.1
0.
02
36
4±
43
.8
30
1±
5.
6 10
6+_
9.7
84
±
5.8
225±
19
.1
353+
2.
6 0.
06
38
6+
62
.5
340+
- 9.
0 11
5+-
3.3
82
±
9.8
251±
20
.3
313±
11
.9
0.2
40
4+
59
.5
42
2+
8.
1 16
5+_
5.5
105+
_ 5.
9 33
8±
16.3
33
4±
15.6
0.
6 86
4+_
27.0
44
6+_
21A
33
7+
3.1
153+
5.
5 43
9±
23.3
47
8±
49.7
P
osit
ive
cont
rol
82
5+
_ 5
3.7
761_
+ 44
.9
916+
8.
6 17
35+
6
5.5
17
50±
111.
2 12
46±
59
.0
Pro
babi
lity
0.
0001
**
0.
0001
**
0.
0001
**
0.
0001
**
0.
0001
**
0.00
01 *
* A
ctiv
ity
clas
s 1
1 i
1 1
1
-CO
OH
0
181±
4.
5 28
1+
14.1
16
±
1.0
39 4
. 2.
3 14
64-
4.9
185±
4.
2 0.
015
304±
24
.9
707+
- 46
.5
41-1
- 4.
0 8
6+
4.
6 18
9±
11.3
61
9±
9.8
0.05
81
8±
91.2
14
97±
35
.6
109_
+ 0.
6 24
4±
12.2
30
0±
12
.7
1220
±
37.4
0.
15
1469
±
70.4
2
67
6_
+ 3
9.4
:'72±
5.
8 35
2___
23.
4 52
3+
47.8
15
474-
22
.6
0.5
1616
+
24.0
3
22
6±
!01
.3
290_
+
6.2
396±
5.
9 62
0___
9.
5 12
15±
86
.4
1.5
2324
+-1
11.4
3
27
6±
44
.6
419+
- 14
.7
903±
6.
2 57
5±
3.6
1563
±
71.1
P
osit
ive
cont
rol
1108
+_
29.8
1
07
4_
+ 9
2.5
13
91
+-
19
.2
3118
4-
57.3
2
08
2±
90
.6
15
84
_+
33.
7 P
roba
bili
ty
0.00
01 *
*
0.00
01 *
*
0.00
01 *
*
0.0O
01 *
* 0.
0001
**
0.
0001
**
A
ctiv
ity
clas
s 1
I !
1 1
1
-CO
OC
H 3
0
183+
_ 10
.7
130+
_ 7.
8 22
+_
3.5
38
±
1.0
171±
6.
1 22
4±
9.0
0.01
42
2±
11.3
37
3±
14.4
16
3+_
8.3
62+_
7.
5 30
9+_
12.8
44
5±
12.1
0.
03
4894
- 7.
5 73
4+_
33.6
16
0±
8.0
121+
_ 6.
9 28
1±
6.9
1073
_+ 3
6.1
0.1
54
6±
8.
5 !1
41_+
62
.4
170±
6.
2 29
9±
17.7
28
3+_
1.2
19
63
+_
75.
9 0.
3 53
5+_
53.9
9
73
±
34.8
18
9±
1.5
491+
48
.1
310±
8.
5 18
83+
-101
.2
0.9
519+
_ 5.
6 10
50-+
25
.4
190±
7.
7 60
6+_
23.2
28
4±
9.5
2010
±18
7.7
Pos
itiv
e co
ntro
l 98
0±
38.5
30
7_+
1
8.9
1
55
7+
_ 2
1.5
3
59
1_
+ 7
0.2
2108
±29
0.7
1841
±
58.6
P
roba
bili
ty
0.01
84
0.00
03 *
*
0.00
27 *
0.
0004
* *
0.
3289
0.
0001
* *
A
ctiv
ity
clas
s 1
! !
1 0
1
-OC
6H 5
0
118±
4.
8 28
2+_
12.1
26
+_
5.2
35
±
1.0
146-
1-
7.7
200+
_ 2.
3 0.
001
126±
5.
8 27
3±
18.3
33
+-
1.5
35
±
3.8
1564
- 4.
7 18
0±
5.9
0.00
3 11
9+_
2.5
288+
- 8.
6 31
_+
1.5
46
+
7.3
165±
5.
2 19
6±
2.9
0.01
11
1_+
3.3
297±
8.
7 33
_+
0.3
50
±
6.4
177±
4.
6 21
6±
6.2
0.03
13
0±
20.9
35
1+_
3.5
36
±
1.5
56
±
!.2
183±
0.
9 24
5±
9.2
0.09
13
5±
7.3
363_
+
14.6
4
7±
2.
1 6
3±
9.
1 19
0±
2.2
285±
15
.1
Pos
itiv
e co
ntro
l 83
9±
38.6
1
58
7+
_ 2
0.5
14
26±
134.
8 20
21±
142.
4 15
08±
7
7.9
13
85+
115.
0 P
roba
bili
ty
0.13
28
0.00
01 *
*
0.00
01 *
*
0.00
23 *
* 0.
0001
**
0.00
01 *
* A
ctiv
ity
clas
s 0
0 0
0 0
0
349±
26
.0
390±
10
.7
487±
23
.6
480±
29
.2
535
±
44.6
49
3 ±
8.
6 31
43 ±
245
.6
0.01
84 *
0
6024
- 29
.8
5944
- 48
.6
568-
1- 1
8,2
624+
24
.8
6894
. 10
,9
747-
1- 2
0.5
3 56
7 ±
283
.1
0.00
01 *
* 0
3704
. 22
.0
607+
10
.8
575
±
12.9
54
3 ±
11
,5
427±
8.
2 41
5 ±
4.
4 5
494
4. 4
32.2
0.
5512
0
980±
27
.3
1001
±
15.2
96
5 4.
25
.4
971
±
29.2
10
16+
31
.1
977±
50
.1
3 27
1 ±
482
.3
0.92
99
0
476+
15
.6
663+
28
.0
678+
21
.1
680+
22
.1
666+
20
.0
793+
15
.2
817+
28
.9
0.01
80 *
0
810+
17
.3
1610
±
54.5
27
18±
30
.3
4160
4"
47.2
5
875
+ 2
88.2
5
99
9±
112
.8
974±
36
.7
0.00
01 *
*
1
864±
13
.5
1070
±
55.6
14
47±
19
.8
1800
±
19.0
23
53±
33
.4
2415
±
26.7
71
9±
31.8
0.
0001
* *
1
1204
±
36.7
12
26 ±
35
.4
1259
±
57,6
12
70 4
- 34
,4
1265
±
22.3
12
74±
79
,6
1 16
8±
i0.5
0,
4228
0
TA
BL
E 3
(co
ntin
ued)
-R
Dos
e S
trai
n
(/zm
ol/
pla
te)
TA
97
TA
98
TA
I00
T
A10
2
0% $
9 10
% $
9 0%
$9
10%
$9
0% $
9 10
% $
9 0%
$9
10%
$9
-C6H
5
-OC
H 3
0 15
4_+
7.3
26
9_
+ 2
.9
21 _
+ 1_
5 24
_+
1.3
190+
8.
8 26
6+
4.9
226-
+
19.2
0.
006
149_
+ 2.
9 28
3_+
1.
2 24
-+
3.2
31_+
4.
7 33
9_+
21.9
26
8±
19.5
21
6+
10.1
0.
02
157-
+ 1.
5 3
16
-+ 3
.5
23_+
2.
1 28
-+
1.5
239_
+ 29
.7
253±
21
.0
249_
+ 12
.8
0,06
15
7_+
2.6
32
7-+
12.
7 21
-+
2.1
24-+
1.
7 22
6_+
7.9
255_
+ 1
3.3
208_
+ 23
.8
0.2
163_
+ 6.
4 3
61
-+ 4
,3
25-+
1.
8 34
-+
5.2
264_
+ 32
.7
32
04
- 2.
7 27
7_+
17.1
0.
6 15
4+
6.6
39
3_
+ ll
,O
26_+
1.
7 31
_+
7.2
266_
+ 7.
4 35
0±
18.2
30
3_+
10.1
P
osit
ive
cont
rol
94
1_
+ 5
3.7
78
2_
+ 2
7.2
693-
+
11
.2
1335
-+
34.5
1
77
6_
+ 6
5.7
838+
112.
2 66
78±
532.
8 P
roba
bili
ty
0.83
14
0.00
01 *
*
0.05
18
0.36
92
0.65
70
0.00
01 *
*
0.00
09 *
*
Act
ivit
y cl
ass
0 0
0 0
0 0
0
0 2
05
±
16
.5
31
5+
_ 5
.2
22_+
1.
2 45
_+
2.9
148_
+ 5.
1 17
4+
4.9
624+
16
.7
0.00
3 48
8-+
24
.0
29
6-+
3_5
13
8_+
10.1
49
_+
6.2
213+
_ 2
0.5
17
4+
9.5
675±
19
.6
0.01
6
96
±
20.5
4
64
+_
21.
6 11
5_+
6.
9 98
_+
6.2
281_
+ 21
.4
264_
+
9.1
672_
+ 22
.9
0.03
88
6-+
1
2.3
9
03
_+
28.
2 14
9+
11.0
22
5-+
8.
9 37
0-+
6.5
366+
14
.9
629-
+
19.9
0.
1 10
83-+
52
A
1092
_+ 7
1.5
201-
+
5.8
338_
+ 17
.2
475+
1
1.3
4
43
_+
4.7
63
7_+
23.7
0.
3 16
16+
7
9.1
13
26+
53
.1
270_
+
7.9
357_
+
9.5
456_
+ 1
1.5
52
9+
24.7
63
3_+
36.4
P
osit
ive
cont
rol
10
52
_+
22.
3 74
3_+
26.
6 13
46_+
30_
5 10
96+
78
.9
10
69
_+
98.
7 11
59±
1
4.7
43
51±
543.
9 P
roba
bili
ty
0.00
81 *
*
0.00
81 *
*
0.08
01 *
*
0.00
01 *
*
0.00
01 *
* 0.
0001
**
0.12
55
Act
ivit
y cl
ass
I 1
1 !
1 1
0
839:
t: 32
.6
1010
+
22.3
12
62 +
29
.7
1 12
0+
22.6
12
08 +
18
.2
1342
+
15.5
81
5+
65.7
0.
0002
* *
0
905
+
19.0
97
7+
12.5
97
5+
35.9
10
40 +
33
.6
1285
+
4.7
1275
+
29.5
87
0±
24.2
0.
0001
**
0
7
and Komatsu, 1977; Moriguchi et al., 1980; Kawashima et al., 1986).
The equation (discriminant function) is formu- lated by a feedback adaptat ion procedure in a linear form as Eq. 1,
L = w o + w~xl + w2x 2 + . . . - I -WpXp (1)
where L is the discriminant score for the classifi- cation, Xk (k ffi 1, 2 . . . p ) is the k th descriptor for the structure, and w k (k = 0, 1 . . . p) is the weight coefficient. The value of w~ is determined by the least-squares adaptation using the starting score aj ( j - -1 , 2 . . . m in the m group case) and the correction term Ci(t). In this study the algorithm derived from ALS 81 was carried out using the computer program Data Desk ® (1988).
Moriguchi (1980) proposed a modified 'ridit ' as a standard numerical score for ordered cate- gories. It is defined in Eq. 2, where a i is the ridit for group 'j', and n i and n i are the size of groups T and 'j', respectively. From Eq. 2, the mean value of a s over 'n ' compounds becomes zero, and a~ --- - 1 and a2 = + 1 for two groups of the same size.
)] ajffi 2 2 i ~ l n ~ + n j / n - 2 (2)
The choice of ridit as the numerical score is based on the assumption that only the potency order of groups is reliable, i.e., quantitative dif- ferences in potency between the different groups and between the different compounds within a group are uncertain in the data to be analyzed.
In this study, for Eq. 4 (see Table 4), a I (as- signed to class 0 ) = - 1 . 5 , a 2 (assigned to class 1) = 0.6 and the cutting point between classes bt2 ffi (a s + a2 ) /2 ffi -0 .45 ; for Eq. 5, al ffi -1 .6 , a , ffi 0.4 and bl2 ffi -0 .6 ; and for Eq. 6, a~ ffi - 1.2, a 2 ffi 0.8 and bx2 = -0 .2 .
The procedure begins with the setting of forc- ing factors S i, which are taken to be S i ffi aj. By use of Si in place of L in Eq. 1 the ordinary least-squares estimate w k (k ffi 0, 1, 2 . . . p) to be used as the initial weight vector. Then L i for each substance is calculated from Eq. 1. All sub- stances are classified on the basis of the values of
L i and the cutting point as follows: if L i _< b,2, then assign the i th substance to class 0 and if L i > b~2 then assign the i th substance to class 1.
At iteration 2 and thereafter, the forcing fac- tor ~i is adapted as S i = L i (when the i th sub- stance is correctly classified) or Si = L i _ C~ (when misclassified), where sign ' _ ' is chosen to corre- spond with S i - L i. The correction term C i for the misclassified compound T at each iteration is given as Eq. 3 (Kawashima et ai., 1986).
Ci = 0 .1 / [0 .1 + (0.45 + I L i - b12 I) 2] (3)
From the new adapted Si, the least-squares esti- mate of w k is computed and the new Li is calcu- lated from Eq. 1.
The adaptation is repeated untill all sub- stances are correctly classified or repeated a max- imum of 40 times, and the best discriminant function is selected.
The results of the ALS calculation were vali- dated by the leave-one-out prediction (Stuper et al., 1978). The measure of the predictive ability is obtained by leaving out one compound and using the remaining compounds as the training set. The discriminant function developed from the train- ing set is used to predict the potency class of the compound left out. This procedure is continued until each compound of the data set has been left out of the training set once. The predictive re- sults were given as the misclassified number and the Spearman rank correlation coefficient for the overall leave-one-out classification.
Results and discussion
The activities found for each one of the com- pounds tested with every strain, 0% $9 and 10% $9, the associate probability and the activity class assigned are shown in Table 3 (see Observed activity).
The compounds and descriptors analyzed are listed in Table 1. The cross-correlation matrix of the descriptors analyzed by the ALS method is shown in Table 2. o-, F and R were not analyzed simultaneously, because they are related among themselves.
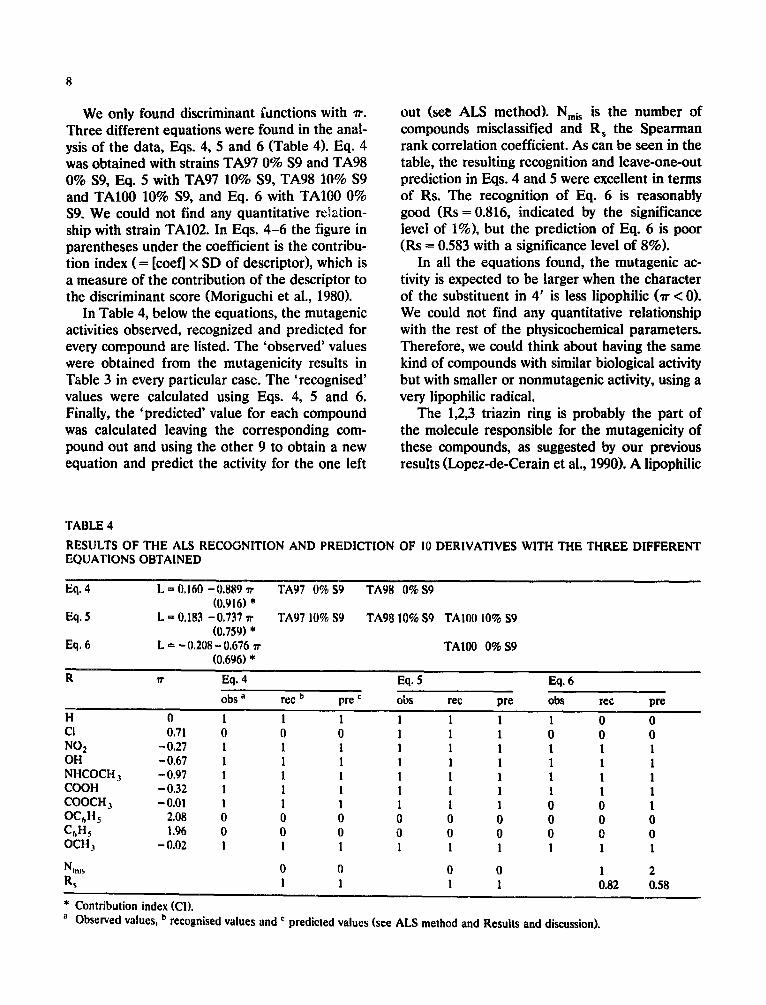
We only found discriminant fanctions with or. Three different equations were found in the anal- ysis of the data, Eqs. 4, 5 and 6 (Table 4). Eq. 4 was obtained with strains TA97 0% $9 and TA98 0% $9, Eq. 5 with TA97 10% $9, TA98 10% $9 and TA100 10% $9, and Eq. 6 with TA100 0% $9. We could not find any quanti tat ive relation- ship with strain TA102. In Eqs. 4 -6 the figure in parentheses under the coefficient is the contribu- tion index ( = [coef] x SD of descriptor), which is a measure of the contribution of the descriptor to the discriminant score (Moriguchi et al., 1980).
In Table 4, below the equations, the mutagenic activities observed, recognized and predicted for every compound are listed. The 'observed' values were obtained from the mutagenici ty results in Table 3 in every particular case. The ' recognised' values were calculated using Eqs. 4, 5 and 6. Finally, the 'predicted ' value for each compound was calculated leaving the corresponding com- pound out and using the o ther 9 to obtain a new equation and predict the activity for the one left
out (see ALS method). Nmi s is the number of compounds misclassified and R s the Spearman rank correlation coefficient. As can be seen in the table, the resulting recognition and leave-one-out prediction in Eqs. 4 and 5 were excellent in terms of Rs. The recognit ion of Eq. 6 is reasonably good (Rs = 0.816, indicated by the significance level of 1%), but the prediction of Eq. 6 is poor (Rs = 0.583 with a significance level o f 8%).
In all the equat ions found, the mutagenic ac- tivity is expected to be larger when the character of the substituent in 4' is less lipophilic ( ,r < 0). We could not find any quantitative relationship with the rest of the physicochemical parameters . Therefore, we could think about having the same kind of compounds with similar biological activity but with smaller or nonmutagenic activity, using a very lipophilic radical.
The 1,2,3 triazin ring is probably the part of the molecule responsible for the mutagenici ty of these compounds, as suggested by our previous results (Lopez-de-Cerain et al., 1990). A lipophilic
TABLE 4
RESULTS OF THE ALS RECOGNITION AND PREDICTION OF 10 DERIVATIVES WITH THE THREE DIFFERENT EQUATIONS OBTAINED
Eq. 4 L m 0.160 -0.889 ~" TA97 0% $9 TA98 0% $9 (0.916) *
Eq. 5 L - 0.183 -0.737 ~" TA97 10% $9 TA98 10% S9 TAIO0 10% $9 (0.759) *
Eq, 6 L = -0.208-0.676 ~" TAI00 0% 59 (0.696) *
R ¢r Eq. 4 Eq. 5 Eq. 6
obs a rec b pre c obs rec pre obs rec pr¢
H 0 1 I 1 1 1 1 1 0 0 CI 0.71 0 0 0 1 1 1 0 0 0 NOa - 0.27 1 1 1 1 1 1 1 l 1 OH -0,67 1 1 1 1 1 1 1 1 1 NHCOCH 3 - 0.97 1 1 1 1 1 1 1 1 1 COOH - 0.32 1 1 ! 1 1 1 1 1 1 COOCH ~ - 0.01 1 1 1 1 1 1 0 0 l OC~H 5 2.08 0 0 0 0 0 0 0 0 0 Coil5 1.96 0 0 0 0 0 0 0 0 0 OCH ~ - 0.02 I 1 1 1 1 1 1 1 1
Nmjs 0 0 0 0 l 2 Rs I 1 1 1 0.82 0.58
* Contribution index (CI). a Observed values, b recognised values and c predicted values (see ALS method and Results and discussion).
substituent in 4' could make the wrapping of the 1,2,3-triazin ring feasible, preventing its muta- genic action.
When a QSAR is applied, it is very important to be sure of the purity of the compounds be- cause mutagenic contaminants can give false- positive results. Also, tests must be performed using adequate procedures with appropriate con- trols and safety measures for quality control in the laboratory (Shahin, 1987). Both factors have been kept in mind when carrying out this study.
QSARs are of great value in the design of less mutagenic compounds. In our case, the muta- genicity of the series tested, 3-(4-R-benzyl- idenamino)-SH-1,2,3-triazin[5,4-b ]indol-4-one, can be varied by manipulation of the lipophilic properties of the substituent in the 4' position. However, we should not forget that we are only considering how to modify the mutagenicity of the whole molecule with the character of the radical in the position 4', without taking into consideration the general environment of the compounds.
References
Arrar~s, J.A. (1990) Dissertation, Oniversidad de Nava,,a. Benigni. R.. C. Andreoli and A. Giuliani (1989) Quantitative
structure-activity relationships: principles, and applica- tions to mutagenicity and carcinogenicity, Mutation Res., 221, 197-216.
Brosick, D., and A, Auletta (1985) Developmental status of bioassays in genetic toxicology. A report of Phase I! of the U.S. Environmental Protection Agency Gene-Tox Pro. gram, Mutation Res., 153, 1-10.
Craig, P,N. (1990) Substructural analysis and compound selec- tion, in: C. Hansch (Ed.), Comprehensive Medicinal Chemistry, Vol. 4, Pergamon, Oxford.
Data Desk ~ Professional 2.0 (1988) Odesta Corporation, Northbrook, IL.
Fujita, T. (1990) the extrathermodynamic approach to drug design, in: C. Hansch (Ed.), Comprehensive Medicinal Chemistry, Vol. 4, Pergamon, Oxford.
Garc~a, E., A. Lopez de Cerain, A. Gull6n, J.A. Arrarfis and A. Monge (1991) Submitted for publication.
Hansch, C., and T. Fujita (1964) ro-cr-,rr Analysis. A method for the correlation of biological activity and chemical structure, J. Am. Chem. Soc., 86, 1616-1626.
Hansch, C., and A. Leo (1979) Substituents Cons: .nts for Correlation Analysis in Chemistry and Biology, Wiley, New York.
Kawashima, Y., F. Amaruma, M. Sato, S. Okuyama, Y. Nakashima, K. Sota and i. Muriguchi (1986) Structure-ac- tivity studies of 4,6-disubstituted 2-(morpholinocarbonyl) furo[3,2-b]indole derivatives with analgesic and antiinflam- matory activities, J. Med. Chem., 29, 2284-2290.
Lopez-de-Cerain, A., E. Garc[a, A. Gull6n, .Li. Recalde and A. Monge (1990) Mutagenic evaluation of some triazino indoles using the Salmonella/mammalian microsome as- say, Mutagenesis, 5, 307-311.
Maron, D.M., and B.N. Ames (1983) Revised methods for the Salmonella mutagenicity test, Mutation Res., 113, 173-215.
Monge, A., V. Martinez-Merino, C. Sanmartin, F.J. Fern:~ndez, M.C. Ochoa, C. Bellver, P. Artigas and E. Feruandez-Alvarez (1989) 2-Arylamino-4-oxo-3,4-dihydro- pyrido[2,3-d]pyrymidines: synthesis and diuretic activity, Eur. J. Med. Chem., 24, 209-216.
Moriguchi, !., and K. Komatsu (1977) Adaptive least-squares classification applied to structure-activity correlation of antitumor mitomycin derivatives, Chem. Pharm. Bull., 25, 2800-2802.
Moriguchi, I., K. Komatsu and Y. Matsushita (1980) Adapta- tire least-squares method applied to struc',ure activity cor- relation of hypotensive N-alkyI-N'-cyano-N '-pyridyl guani- dines, J. Med. Chem., 23, 20-26.
Shahin, M.M. (1987) Relationships between structure and mutagenic activity of environmental chemicals, Mutation Res., 181,243-256.
Stuper, AJ., and P.C. Jurs (1978) Stru~ ture-activity studies of barbiturates using pattern recognition techniques, J, Pharm. Sci., 67, 745.
Tute, M.S. (1990) History and objectives of quantitative drug design, in: C. Hansch, Comprehensive Medicinal Chem- istry, Vol. 4, Pergamon, Oxford.