quantitative screening of the pharmaceutical ingredient
TRANSCRIPT

RESEARCH ARTICLE
Quantitative screening of the pharmaceutical
ingredient for the rapid identification of
substandard and falsified medicines using
reflectance infrared spectroscopy
Graham Lawson☯, John Ogwu☯, Sangeeta Tanna*☯
Leicester School of Pharmacy, Faculty of Health and Life Sciences, De Montfort University, Leicester, United
Kingdom
☯ These authors contributed equally to this work.
Abstract
The World Health Organization suggests that approximately 10% of medicines worldwide
are either falsified or substandard with higher figures in low and middle income countries.
Such poor quality medicines can seriously harm patients and pose a threat to the economy
worldwide. This study investigates attenuated total reflectance-fourier transform infrared
(ATR-FTIR) spectroscopy as a simple and rapid method for determination of drug content in
tablet dosage forms. Paracetamol was used as the model pharmaceutical ingredient. Spec-
tra of standard mixtures of paracetamol with different excipients formed the basis for multi-
variate PLS based quantitative analysis of simulated tablet content using different selected
infrared absorbance bands. Calibration methods using ATR-FTIR were compared with the
ATR-FTIR and conventional ultraviolet spectroscopic analyses of real tablet samples and
showed that the paracetamol/microcrystalline cellulose mixtures gave optimum results for
all spectral bands tested. The quantitative data for band 1524–1493cm-1 was linear (R2 >0.98; LOQ� 10%w/w tablet). Global examples of paracetamol tablets were tested using
this protocol and 12% of the tablet samples examined was identified as substandard. Each
sample analysis was completed in just a few minutes. ATR-FTIR can therefore be used in
the rapid screening of tablet formulations. The simplicity of the proposed method makes it
appropriate for use in low and middle income countries where analytical facilities are not
available.
Introduction
The growing problem of substandard and falsified pharmaceuticals presents a serious and
increasing threat to international public health and patient safety [1–3]. Substandard medi-
cines result from poor manufacturing and quality assurance processes and reach the public
due to lax control measures whereas falsified (counterfeit) medicines are deliberately and
fraudulently labelled [4]. In reality, both falsified and substandard medicines claim to be
PLOS ONE | https://doi.org/10.1371/journal.pone.0202059 August 10, 2018 1 / 17
a1111111111
a1111111111
a1111111111
a1111111111
a1111111111
OPENACCESS
Citation: Lawson G, Ogwu J, Tanna S (2018)
Quantitative screening of the pharmaceutical
ingredient for the rapid identification of
substandard and falsified medicines using
reflectance infrared spectroscopy. PLoS ONE 13
(8): e0202059. https://doi.org/10.1371/journal.
pone.0202059
Editor: Mohammad Shahid, Aligarh Muslim
University, INDIA
Received: April 23, 2018
Accepted: July 26, 2018
Published: August 10, 2018
Copyright: © 2018 Lawson et al. This is an open
access article distributed under the terms of the
Creative Commons Attribution License, which
permits unrestricted use, distribution, and
reproduction in any medium, provided the original
author and source are credited.
Data Availability Statement: All relevant data are
within the paper and its Supporting Information
files.
Funding: The authors received no specific funding
for this work.
Competing interests: The authors have declared
that no competing interests exist.

something that they are not. The World Health Organization (WHO) has recently introduced
the terms ‘substandard and falsified (SF) medical products’ [5] in an attempt to change the sit-
uation where there is no globally accepted definition for such medicines and poorly coordi-
nated legal controls that seem to encourage the production of poor quality medicines [6]. The
WHO estimated that about 10% of the global supply of medicines were falsified or substandard
[7, 8]. In countries where there is good control of the supply of medicines the incidence of sub-
standard or falsified medicines is reported to be around 1% whilst in low and middle income
countries (LMIC) the level of substandard or falsified medicines rises to 50% of all medicines
[9]. Up to 50% of medicines purchased from the internet may be of a poor quality [10],
although a recent review has highlighted that it is difficult or impossible to make reliable esti-
mations about the prevalence of falsified and substandard medicines [11]. These medicines
can pose a significant threat to public health and produce economic problems worldwide and
there is a need for improvements in methods for both screening and monitoring medicines for
such poor quality medicines.
Examples of falsification of medicines include lifesaving anticancer, HIV and cardiovascu-
lar therapy medicines as well as lifestyle drugs such as weight loss/slimming pills and dietary
supplements [7, 12, 13]. High demand over-the-counter (OTC) medicines for mild pain relief
and antipyretics to reduce fever have also been the target for falsification. Paracetamol, also
known as acetaminophen (4-acetamidophenol, N-acetyl-p-phenacetin), [14] has been identi-
fied as the second most commonly used active pharmaceutical ingredient (API) after acetylsal-
icylic acid and paracetamol containing OTC medicines have therefore been targeted by
counterfeiters [15]. Paracetamol has also been used, in place of the specified API, in falsified
medicines [16]. Reports of a situation in the USA where 500mg paracetamol tablets were actu-
ally labelled as 325mg suggest that people in both industrialised and LMICs are exposed to
miss-labelled medication [17].
Historically, analytical techniques for determining the authenticity of medications have
been based on the determination of the API content [13, 18, 19]. These pharmacopoeia
approved methods [20–22] require sample preparation which includes solvent extraction of
the APIs followed by filtration and/or dilution prior to analysis [2, 23]. Techniques such as
high-performance liquid chromatography (HPLC) with ultraviolet (UV) detection [24], liquid
chromatography coupled with mass spectrometry (LC-MS) [25] and nuclear magnetic reso-
nance (NMR) spectroscopy [26] and have been used in the authentication of various tablet for-
mulations. The chromatography-based techniques require large volumes of expensive solvents
and have long analysis times due to complex sample preparation steps which make them
unsuitable for rapid, simple and cheap analysis. These procedures also require well trained
staff and well equipped laboratories [6, 27] which are not readily available in LMICs. With the
growing prevalence of falsified and substandard medicines globally, the provision of simple,
fast and affordable methods of analysis for screening these medications would be beneficial
especially in LMIC [27–29].
Vibrational spectroscopic techniques are widely documented as being suitable analytical
methods for the authentication of pharmaceutical products [30–34]. There has also been
increased interest in the use of handheld devices that use spectroscopic analyses for screening
medicines in the field [6, 18, 35]. Raman spectroscopy, in particular, has been applied exten-
sively in the characterization and identification of suspected medicines [34, 36, 37] and also in
the quantification of paracetamol [38]. Furthermore, near infrared spectroscopy (NIR) has
been applied in this regard and in combination with Raman spectroscopy for authentication of
falsified medicines [31, 39]. There is also the issue of chemical peaks not being well defined or
separated (poor chemical peak specificity) in NIR spectroscopy making spectra difficult to
interpret [35, 40].
Rapid identification of counterfeit medicines
PLOS ONE | https://doi.org/10.1371/journal.pone.0202059 August 10, 2018 2 / 17

Most applications of fourier-transform infrared (FTIR) spectroscopy for pharmaceutical
analysis, like other spectroscopic techniques, include characterisation and identification of the
presence or absence of active pharmaceutical ingredients (APIs) and excipients [31, 32]. Con-
ventional FTIR with multivariate analysis has also been used for the quantification of APIs in
antidiabetic drugs [41] and paracetamol [42] in solid pharmaceutical dosage forms. This
approach requires skilled personnel since samples must be prepared as crushed powders, then
finely dispersed in a KBr matrix which is then compressed into discs before analysis. This
approach is time consuming, requires a source of continually dried KBr and a hydraulic press
to produce uniform KBr discs.
Attenuated total reflectance fourier transform infrared spectroscopy (ATR-FTIR) has revo-
lutionized conventional FTIR by eliminating the main challenges in the analysis of pharma-
ceutical solid dosage forms notably the time spent in sample preparation which involves
sample extraction or KBr disc preparation and also the lack of spectral reproducibility. ATR-F-
TIR is quicker than some of the pharmacopoeia approved methods and conventional FTIR
since the samples can be analysed directly to provide qualitative data or powdered before anal-
ysis [23, 42] if reproducible quantitative data is required.
The aim of this study was to develop and improve the simple, fast and cost effective method
using ATR-FTIR to distinguish between genuine and falsified or substandard paracetamol tab-
lets reported previously [23]. In the previous work the effect of different integration modes to
manually determine areas of single characteristic peaks (univariate data) was combined with
simple Beer Lambert Law calibration plots for quantitative measurements. The current work
includes an assessment of the potential of the ATR-FTIR analysis of whole paracetamol tablets
to confirm the presence of the API. A quantitative determination of the API level requiring the
preparation of paracetamol-excipient powder calibration mixtures for ATR-FTIR analysis and
a study of the effects of the use of different model excipients on the calibration results obtained
using different spectral ranges will be conducted. Data will be processed by the in board auto-
mated multivariate calibration algorithm. This work will also include validation of the API
levels determined by ATR-FTIR spectroscopy against a conventional UV spectroscopy quanti-
tative analysis. The validated quantitative ATR-FTIR method will be applied to paracetamol
tablet samples collected opportunistically from various countries globally.
These results aim to demonstrate the possible usefulness of the technique in low and middle
income countries due to ease of sample preparation, the use of a green and low cost analytical
method, rapid analysis and easy interpretation of the results.
Materials and methods
Reference chemicals and reagents
Analytical grade paracetamol was obtained from Sigma Aldrich, Dorset, UK. Excipients: maize
starch, microcrystalline cellulose (MCC), magnesium stearate, and UV grade methanol were
obtained from Fisher Scientific Ltd, Loughborough, UK.
Test tablet samples
Tablet formulations containing paracetamol, for analysis, were obtained opportunistically,
from outlets readily available to tourists or visitors in Europe, Asia, Africa and the Caribbean
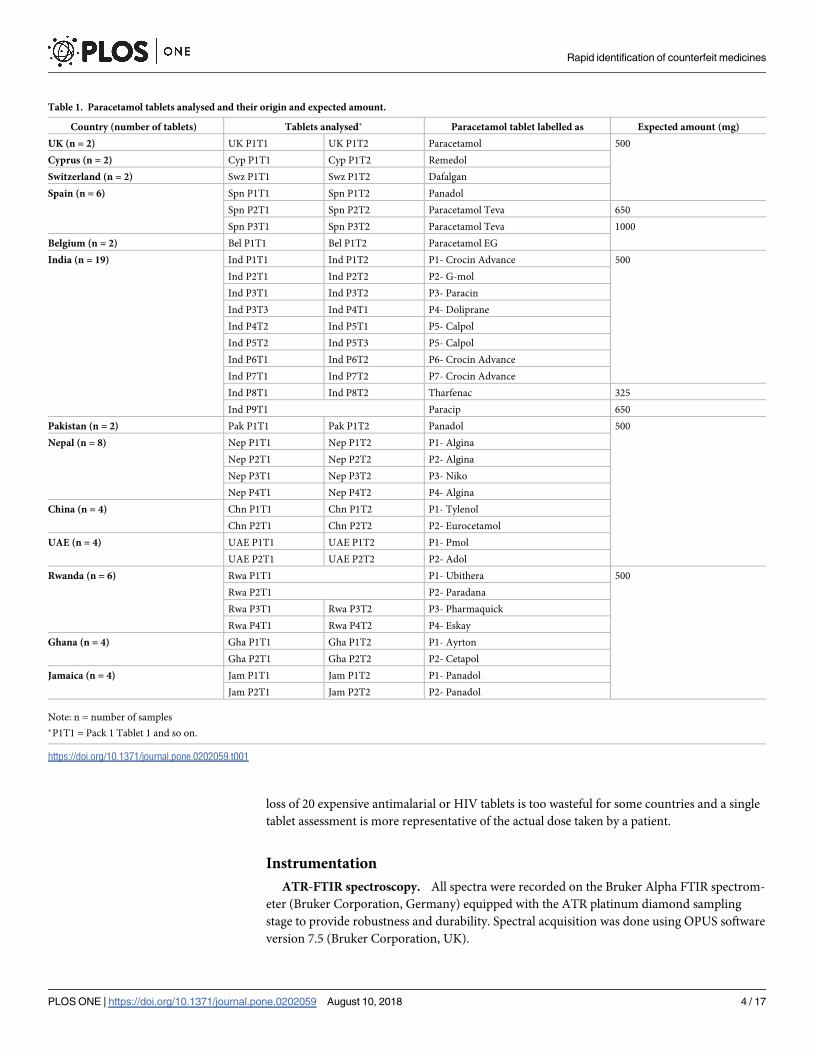
Islands. Table 1 summarizes the country of origin and expected dose of each of the tablets
analysed.
Tablet assays for content uniformity are usually based on the analysis of 20 tablets or 10
selected at random. In forensic scenarios there may not be this number of tablets available, the
Rapid identification of counterfeit medicines
PLOS ONE | https://doi.org/10.1371/journal.pone.0202059 August 10, 2018 3 / 17
loss of 20 expensive antimalarial or HIV tablets is too wasteful for some countries and a single
tablet assessment is more representative of the actual dose taken by a patient.
Instrumentation
ATR-FTIR spectroscopy. All spectra were recorded on the Bruker Alpha FTIR spectrom-
eter (Bruker Corporation, Germany) equipped with the ATR platinum diamond sampling
stage to provide robustness and durability. Spectral acquisition was done using OPUS software
version 7.5 (Bruker Corporation, UK).
Table 1. Paracetamol tablets analysed and their origin and expected amount.
Country (number of tablets) Tablets analysed� Paracetamol tablet labelled as Expected amount (mg)
UK (n = 2) UK P1T1 UK P1T2 Paracetamol 500
Cyprus (n = 2) Cyp P1T1 Cyp P1T2 Remedol
Switzerland (n = 2) Swz P1T1 Swz P1T2 Dafalgan
Spain (n = 6) Spn P1T1 Spn P1T2 Panadol
Spn P2T1 Spn P2T2 Paracetamol Teva 650
Spn P3T1 Spn P3T2 Paracetamol Teva 1000
Belgium (n = 2) Bel P1T1 Bel P1T2 Paracetamol EG
India (n = 19) Ind P1T1 Ind P1T2 P1- Crocin Advance 500
Ind P2T1 Ind P2T2 P2- G-mol
Ind P3T1 Ind P3T2 P3- Paracin
Ind P3T3 Ind P4T1 P4- Doliprane
Ind P4T2 Ind P5T1 P5- Calpol
Ind P5T2 Ind P5T3 P5- Calpol
Ind P6T1 Ind P6T2 P6- Crocin Advance
Ind P7T1 Ind P7T2 P7- Crocin Advance
Ind P8T1 Ind P8T2 Tharfenac 325
Ind P9T1 Paracip 650
Pakistan (n = 2) Pak P1T1 Pak P1T2 Panadol 500
Nepal (n = 8) Nep P1T1 Nep P1T2 P1- Algina
Nep P2T1 Nep P2T2 P2- Algina
Nep P3T1 Nep P3T2 P3- Niko
Nep P4T1 Nep P4T2 P4- Algina
China (n = 4) Chn P1T1 Chn P1T2 P1- Tylenol
Chn P2T1 Chn P2T2 P2- Eurocetamol
UAE (n = 4) UAE P1T1 UAE P1T2 P1- Pmol
UAE P2T1 UAE P2T2 P2- Adol
Rwanda (n = 6) Rwa P1T1 P1- Ubithera 500
Rwa P2T1 P2- Paradana
Rwa P3T1 Rwa P3T2 P3- Pharmaquick
Rwa P4T1 Rwa P4T2 P4- Eskay
Ghana (n = 4) Gha P1T1 Gha P1T2 P1- Ayrton
Gha P2T1 Gha P2T2 P2- Cetapol
Jamaica (n = 4) Jam P1T1 Jam P1T2 P1- Panadol
Jam P2T1 Jam P2T2 P2- Panadol
Note: n = number of samples
�P1T1 = Pack 1 Tablet 1 and so on.
https://doi.org/10.1371/journal.pone.0202059.t001
Rapid identification of counterfeit medicines
PLOS ONE | https://doi.org/10.1371/journal.pone.0202059 August 10, 2018 4 / 17

For qualitative analyses the Spectrum Search facility was used. Quantitative measurements
were carried out automatically using the QUANT2 facility within OPUS 7.5 to provide calibra-
tion spectra from different levels of paracetamol prepared in selected excipients.
UV-Vis spectrophotometry. UV spectra were collected using UV-Visible spectropho-
tometer, Helios Gamma (Thermo Electron Corporation, England). The spectral range consid-
ered was 190–400 nm with a scan interval of 0.5 nm. Quantitative readings were taken at a
wavelength of 243.5nm. The UV-Visible spectrophotometer was controlled using the Vision
Lite software 2.2 (Ueberlingen, Germany).
Methods
Reference spectra. All spectra were measured in absorbance mode. A fresh background
spectrum was measured against air before starting measurements and subsequently after every
5 runs. Small amounts of finely ground samples of the individual reference materials, paraceta-
mol and excipients commonly used in pharmaceutical formulations, were placed on the dia-
mond sampling crystal and pressed using a clamp to ensure proper contact. Each spectrum
was measured by averaging 20 scans over the range 4000-400cm-1 with spectral resolution
2cm-1. Estimated scan time for spectral acquisition was 25 seconds. This process was repeated
5 times to ensure replicate data was produced. The platinum diamond sampling surface was
cleaned after each sample using paper tissue with isopropanol and allowed to dry. Recorded
fingerprint spectra for the reference materials were assessed for spectral reproducibility by
comparing replicate spectra. Reproducible spectral data were used to create a local reference
library. Members of the same excipient groups, starches, celluloses and stearates all had very
similar spectra. Characteristic regions of the paracetamol spectrum were identified where
there was little or no absorbance from excipient materials.
Reference paracetamol-excipient calibration mixtures. Candidate pharmaceutical
excipients were chosen as examples of particular functions within a tablet formulation: Micro-
crystalline cellulose (binder, disintegrant), maize starch (diluent, binder) and magnesium stea-
rate (lubricant). These were also selected as examples of excipients commonly used in
paracetamol formulations [43, 44]. A series of different concentrations of paracetamol at
10.0%, 20.0%, 30.0%, 50.0%, 70.0% and 90.0% w/w in maize starch, MCC and magnesium stea-
rate respectively were prepared mixing paracetamol and the excipient for 2 minutes. For the
API/excipient calibration standard mixtures, a uniform total weight of 200mg was measured
each time. These concentrations covered the different dosages in common OTC medicines.
Spectral data, based on absorbance, was obtained using the OPUS software version 7.5 (Bruker
Corporation, Germany). From these spectra, calibration data from the six different API con-
centrations, in the three separate excipients, were generated using the multivariate PLS Cali-
bration Algorithm in the QUANT2 application on the OPUS software version 7.5. The
regression equations obtained from the different analyses were used to determine the paraceta-
mol content in the tablet samples. The final result was the mean of 5 separate runs per sample.
Processing of test tablet samples—Qualitative analyses. Individual tablet samples were
removed from the blister pack and placed onto the sampling head of the ATR unit. Spectra
were recorded where each spectrum was measured by averaging 20 scans over the range 4000-
400cm-1 with spectral resolution 2cm-1. The estimated scan time for spectral acquisition was
25 seconds. This process was repeated 5 times to ensure replicate data was produced. These
were recorded at several points on each side of the tablet in order to investigate data reproduc-
ibility and to assess if the presence of paracetamol, in OTC tablets, could be confirmed on the
basis of this information.
Rapid identification of counterfeit medicines
PLOS ONE | https://doi.org/10.1371/journal.pone.0202059 August 10, 2018 5 / 17

Processing of test tablet samples—Quantitative analyses. Each tablet was weighed and
then ground into fine powder using a mortar and pestle until a homogeneous mixture was
obtained. Spectra of five individual powder samples per tablet were recorded. The data was
processed using the multivariate analysis capability (PLS) of OPUS 7.5 QUANT2 software as
detailed in the Reference paracetamol-excipient calibration mixtures section above. In any
spectroscopic technique the measured signal is a function of the concentration of the analyte
in the test matrix and in order to calculate the dose contained in a tablet it is necessary to accu-
rately know the mass of the individual tablet analysed.
Measured levels of API were indicative of the percentage amount of API in tablet. The rela-
tionship between the results in % w/w and the actual dosage can be expressed as:
Actual Dosage of API in tablet (mg) = R x W
Where R = Concentration of API in % w/w and W = Total weight of the tablet (mg)
The levels of paracetamol in tablet medication obtained from the UK and several countries
around the globe were then determined based on data obtained from the calibration mixtures.
UV–Vis analysis. Conventional solvent extraction method with UV analysis similar to
the method cited by the British Pharmacopoeia was used to validate results already obtained
for paracetamol tablets via ATR-FTIR. The protocol used by Behera et al [45] was adopted for
this part of the study.
Results and discussion
Whole tablet qualitative analysis
Data sufficiently reproducible to confirm the presence of paracetamol could be obtained from
different analyses of a whole tablet placed on the sampling port of the ATR-FTIR instrument.
This data in Fig 1 shows that peaks at the characteristic wavelengths of paracetamol are all
present [23].
The different overall absorbance levels evident from the different sides of the same tablet
(blue and red traces in Fig 1) result from different degrees of contact between the tablet sur-
faces and the ATR diamond surface. The degree of contact will depend on the surface charac-
teristics of the tablet. A more intense and reproducible signal was obtained from the crushed
powder samples shown in black in Fig 1.
Fig 1. Paracetamol tablet crushed (Black), Whole tablet top (Blue), Whole tablet bottom (Red).
https://doi.org/10.1371/journal.pone.0202059.g001
Rapid identification of counterfeit medicines
PLOS ONE | https://doi.org/10.1371/journal.pone.0202059 August 10, 2018 6 / 17

Spectral reproducibility
Good homogenisation was essential in order to obtain well defined, reproducible and quantifi-
able spectra. This was particularly important for the quantification of the API in tablet samples.
Optimised grinding/mixing time was set at a minimum of 2 minutes per test tablet sample.
Overlays of replicate spectra of each reference material indicated that there were no detect-
able differences in either peak position or absorbance between replicate spectra of different
samples of the same analyte. Initial studies showed some variation in peak intensities between
replicate spectra but this was resolved with improved homogenisation of samples and proper
reproducible covering of the sampling surface. Optimised sample preparation methods there-
fore gave reproducible spectral data across the range (4000–400 cm-1).
Identification of API
In order to identify the API (paracetamol) in the presence of different excipients, a reference
library containing spectra of reference material was created. Replicate spectra of the reference
samples (paracetamol and excipients) were recorded and there was no detectable difference in
absorbance bands and peak data between individual replicates of the same material provided
instrumental conditions remained constant. Reproducible spectral data based on both absor-
bance bands and peak intensities were achieved after method optimisation.
Fingerprint and characteristic peaks for API identification. The reproducible reference
library formed the basis for identification of OTC paracetamol tablet medications. Examples
of reference spectra for paracetamol and an excipient mix are shown in Fig 2A and 2B respec-
tively. Tablets are mixtures of the API and excipients. The spectrum of a model mixture of
materials, for a paracetamol tablet containing 80% paracetamol, 10% maize starch, 5% micro-
crystalline cellulose and 5% magnesium stearate is shown in Fig 2C. The most noticeable
change in Fig 2C is the reduction of the absorbance of the excipients bands between 2500 and
3000cm-1 as a result of the low concentration in the model tablet sample. This effect would
Fig 2. Comparison of three spectra: (a) pure paracetamol, (b) a mixture of three excipients (maize starch, magnesium
stearate and microcrystalline cellulose), (c) a simulated paracetamol tablet mixture (80:20 paracetamol:excipients).
https://doi.org/10.1371/journal.pone.0202059.g002
Rapid identification of counterfeit medicines
PLOS ONE | https://doi.org/10.1371/journal.pone.0202059 August 10, 2018 7 / 17

also result in the reduction of all the bands below 1700cm-1 in the spectra from the excipients
but this effect is masked by the API in Fig 2C.
Tablet spectra were then recorded and compared with those in the reference library and if
the peaks in the fingerprint region (2000–400cm-1) matched, the presence of the API was con-
firmed. Aside from comparing the whole spectra, individual characteristic peaks were used to
indicate the presence of a specified API in more complex tablet samples containing several
excipients. This was achieved by selecting regions of the IR spectrum where there was little or
no interference from the excipients. For example comparison of Fig 2A and 2C shows little dif-
ference in absorbance over the ranges 2000–1750cm-1, 1600 –1450cm-1 and 1300–1100cm-1.
This characteristic peak approach was compared with the mixture analysis application in
the OPUS 7.5 software. This software application matches spectra by automatically combining
up to four reference spectra available in the libraries. However, constituents of a mixture
below 10% w/w could not be identified using this software. Fig 3 shows identification of para-
cetamol based on a comparison of spectra from pure paracetamol and a tablet formulation
over the fingerprint region 2000–400cm-1. Identification of the presence of paracetamol was
possible down to about 5% w/w of API in excipient using the two characteristic peaks cited in
Fig 3.
Fig 3. Overlay of ATR-FTIR spectra for identification: Pure paracetamol (red) and paracetamol tablet (blue).
https://doi.org/10.1371/journal.pone.0202059.g003
Fig 4. Molecular structure of paracetamol.
https://doi.org/10.1371/journal.pone.0202059.g004
Rapid identification of counterfeit medicines
PLOS ONE | https://doi.org/10.1371/journal.pone.0202059 August 10, 2018 8 / 17

The structure of the paracetamol molecule is shown in Fig 4 and the peak at 1225cm-1 cor-
responds to the–OH in plane vibration and the peak at 1505cm-1 corresponds to the–CH3
vibration.
Quantification of API using a multivariate PLS calibration model
During the preparation of the powder calibration mixtures magnesium stearate formed
clumps and was difficult to mix uniformly. Both maize starch and MCC were easy to mix with
paracetamol but the lower density of MCC may be an issue [46] when trying to ensure good
contact on the sampling head.
Different approaches to the quantitative analysis of paracetamol were carried out by apply-
ing the OPUS 7.5 QUANT2 software application to the spectral data obtained from the calibra-
tion samples. The OPUS 7.5 QUANT2 application automatically employs a partial least square
(PLS) regression approach to find the best correlation function between spectral and concen-
tration data matrix.
The approaches trialed included the use of 3 individual excipients: MCC, maize starch and
magnesium stearate with absorbance area measurements collected for:
• the ranges 1524–1493cm-1 and 1236–1210cm-1 corresponding to the 1505cm-1 and 1225cm-
1 peaks,
• the range 1524 – 1210cm-1
• the complete spectral range 4000 – 400cm-1
Individual calibration curves for paracetamol in the different excipients, were plotted using
the selected spectral ranges. Calibration graphs containing 10–90% paracetamol in the selected
excipients were produced with R2 values between 0.96 and 0.99 for the different combinations.
A representative example of the data produced is shown in Fig 5A and 5B for the range 1524-
1493cm-1 (corresponding to the 1505cm-1 peak). Fig 5B is the comparison of the reference
paracetamol concentrations (True) with measured concentrations (Fit) which showed close
correlation using the PLS calibration model.
Methods validation. The ability of the calibration approach based on the use of different
excipients to correctly quantify the level of paracetamol in a tablet was assessed against a set of
known typical OTC paracetamol tablets in which the paracetamol level had been measured by
UV analysis. The tablets were assessed as containing 84% w/w paracetamol and the perfor-
mance of the different ATR-FTIR approaches in assessing this value are shown in Fig 6. The
results show that the measurements based on the maize starch calibration samples gave the
most accurate and reproducible data set for all the spectral ranges covered. Data from the
MCC based calibrants consistently under estimated the paracetamol levels whereas the magne-
sium stearate based data ranged from under estimation to significant over estimation of the
API levels depending on the wavelength range chosen.
With the exception of the full spectrum mode the data obtained from the paracetamol in
maize starch calibration samples accurately reflected the results obtained from the UV analysis
of the test tablets. As a result of these experiments, the regression equation obtained from the
calibration data of paracetamol in maize starch using the range of 1524 -1493cm-1 was used to
determine the paracetamol content in tablet samples obtained from around the world.
Tablet sample analysis. Individual tablets from each of the separate samples were crushed
and subjected to both the ATR-FTIR and UV analyses and the results for each sample set are
recorded in Table 2. As can be seen most of UV and ATR-FTIR data agreed within ±10% of
the expected dosage of the paracetamol tablets but some significant differences were identified.
Rapid identification of counterfeit medicines
PLOS ONE | https://doi.org/10.1371/journal.pone.0202059 August 10, 2018 9 / 17

Whilst there was close agreement for many of the samples the ATR-FTIR approach gave high
values versus UV for some samples from India and Cyprus. Low levels of API for samples
from Pakistan were obtained from both UV and ATR measurements.
The ATR-FTIR data can be more meaningfully displayed as a plot of the ratio of expected
to measured paracetamol levels versus sample origin as shown in Fig 7A–7C. These diagrams
clearly show that whilst the majority of tablet samples were within the acceptable limits, four
tablet samples merited further investigation.
The first of these, the Belgian tablet samples, gave similarly high results for both the UV and
the ATR-FTIR tests and would be allowed to pass a qualitative screening test (Fig 7A). The tab-
let samples from Cyprus would also fail a screening test with too little paracetamol, based on
the UV data and too much apparent paracetamol based on the ATR-FTIR (Fig 7A). Both
results do, however, have the same overall affect, this set of tablets would require further analy-
sis. It was noted that the Cyprus paracetamol tablets contained glycerol as an excipient and in
this respect were different to the other tablets investigated. Glycerol is not a common
Fig 5. PLS calibration data for paracetamol: (a) PLS calibration plot for paracetamol over the range 1524-1493cm-1
(peak centred at 1505cm-1) from the Bruker QUANT2 software. Data is the mean of 5 replicates with maize starch as
the excipient, (b) Comparison of measured (Fit) versus expected (True) amounts of paracetamol in calibration
mixtures based on the range 1524 -1493cm-1.
https://doi.org/10.1371/journal.pone.0202059.g005
Rapid identification of counterfeit medicines
PLOS ONE | https://doi.org/10.1371/journal.pone.0202059 August 10, 2018 10 / 17

pharmaceutical excipient and its FTIR spectrum shows that it has significant absorbance in the
range 1524 -1493cm-1 [47] where the measurements were taken in this study and could there-
fore be the reason for the high ATR-FTIR responses. One advantage of the ATR-FTIR
approach taken here, recording reference and sample spectra over the range 4000-400cm-1
means that the Spectrum Search capabilities of the OPUS 7.5 software can be used. This
approach should allow identification of the compound/s contributing to the anomalously high
peak area centred on 1505cm-1. This will be the subject of a future publication.
Two of the Indian tablet samples (ratio 1.44) tested high on both UV and ATR-FTIR but
the ATR-FTIR signal suggested the presence of other material in the fingerprint region and
Fig 6. Chart showing measured amounts of paracetamol in tablets based on ATR-FTIR quantification methods
using different absorbance bands and excipients.
https://doi.org/10.1371/journal.pone.0202059.g006
Table 2. Summary of the quantitative results for paracetamol tablet analysis from around the world (results are the mean of (n) number of samples).
Region Country (Number of Tablets) Tablets Analysed UV Measured Content (mg) ATR-FTIR Measured Content (mg) Expected Amount (mg)
UK (n = 2) UK P1T1 532±4 514±15 500
UK P1T2 479±3 505±15
Cyprus (n = 2) Cyp P1T1 438±6 594±14
Cyp P1T2 442±6 591±5
Switzerland (n = 2) Swz P1T1 523±6 510±10
Swz P1T2 508±5 505±9
Spn P1T1 529±7 514±15
Spn P1T2 515±6 497±18
Europe (n = 14) Spain (n = 6) Spn P2T1 678±8 663±19 650
Spn P2T2 648±5 683±10
Spn P3T1 1005±13 921±41 1000
Spn P3T2 1008±10 980±20
Belgium (n = 2) Bel P1T1 1031±11 1196±55
Bel P1T2 1090±11 1178±24
(Continued)
Rapid identification of counterfeit medicines
PLOS ONE | https://doi.org/10.1371/journal.pone.0202059 August 10, 2018 11 / 17
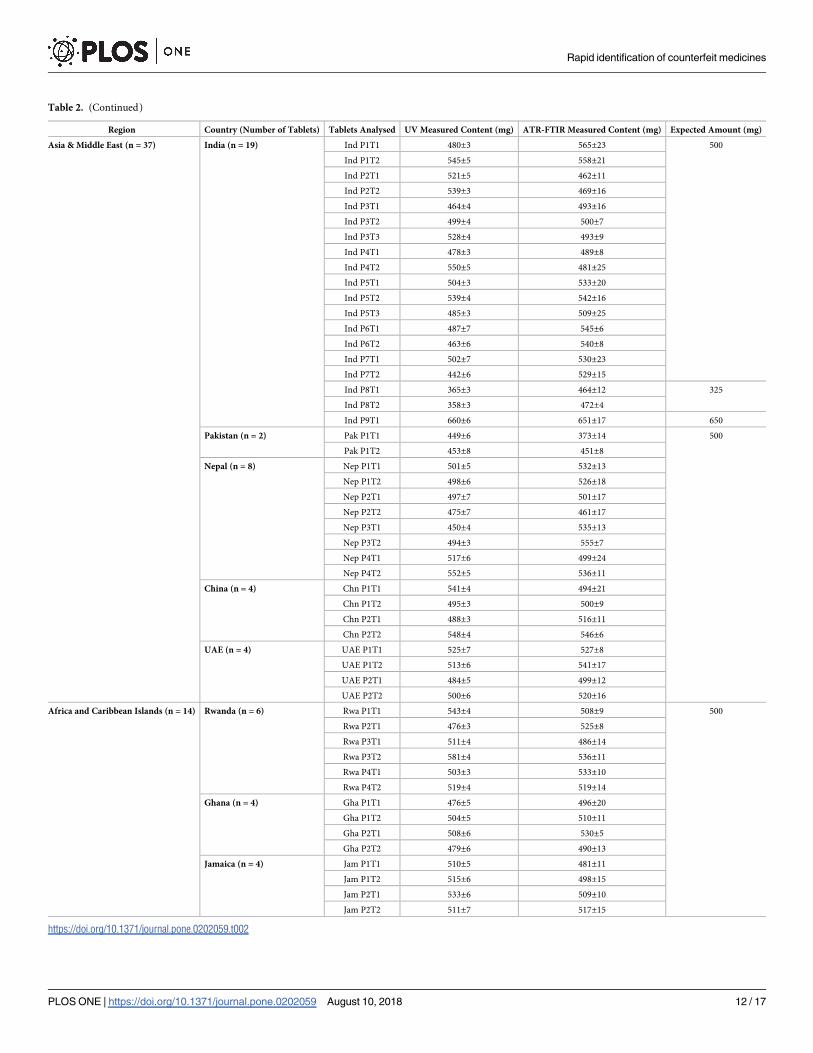
Table 2. (Continued)
Region Country (Number of Tablets) Tablets Analysed UV Measured Content (mg) ATR-FTIR Measured Content (mg) Expected Amount (mg)
Asia & Middle East (n = 37) India (n = 19) Ind P1T1 480±3 565±23 500
Ind P1T2 545±5 558±21
Ind P2T1 521±5 462±11
Ind P2T2 539±3 469±16
Ind P3T1 464±4 493±16
Ind P3T2 499±4 500±7
Ind P3T3 528±4 493±9
Ind P4T1 478±3 489±8
Ind P4T2 550±5 481±25
Ind P5T1 504±3 533±20
Ind P5T2 539±4 542±16
Ind P5T3 485±3 509±25
Ind P6T1 487±7 545±6
Ind P6T2 463±6 540±8
Ind P7T1 502±7 530±23
Ind P7T2 442±6 529±15
Ind P8T1 365±3 464±12 325
Ind P8T2 358±3 472±4
Ind P9T1 660±6 651±17 650
Pakistan (n = 2) Pak P1T1 449±6 373±14 500
Pak P1T2 453±8 451±8
Nepal (n = 8) Nep P1T1 501±5 532±13
Nep P1T2 498±6 526±18
Nep P2T1 497±7 501±17
Nep P2T2 475±7 461±17
Nep P3T1 450±4 535±13
Nep P3T2 494±3 555±7
Nep P4T1 517±6 499±24
Nep P4T2 552±5 536±11
China (n = 4) Chn P1T1 541±4 494±21
Chn P1T2 495±3 500±9
Chn P2T1 488±3 516±11
Chn P2T2 548±4 546±6
UAE (n = 4) UAE P1T1 525±7 527±8
UAE P1T2 513±6 541±17
UAE P2T1 484±5 499±12
UAE P2T2 500±6 520±16
Africa and Caribbean Islands (n = 14) Rwanda (n = 6) Rwa P1T1 543±4 508±9 500
Rwa P2T1 476±3 525±8
Rwa P3T1 511±4 486±14
Rwa P3T2 581±4 536±11
Rwa P4T1 503±3 533±10
Rwa P4T2 519±4 519±14
Ghana (n = 4) Gha P1T1 476±5 496±20
Gha P1T2 504±5 510±11
Gha P2T1 508±6 530±5
Gha P2T2 479±6 490±13
Jamaica (n = 4) Jam P1T1 510±5 481±11
Jam P1T2 515±6 498±15
Jam P2T1 533±6 509±10
Jam P2T2 511±7 517±15
https://doi.org/10.1371/journal.pone.0202059.t002
Rapid identification of counterfeit medicines
PLOS ONE | https://doi.org/10.1371/journal.pone.0202059 August 10, 2018 12 / 17

would therefore fail a screening test (Fig 7B). Further investigation of the reason for failure
would be required. For the Pakistan samples (ratio 0.75) both the UV and ATR-FTIR analyses
showed clear evidence of insufficient levels of paracetamol (Fig 7B).
Fig 7. Ratio of measured to expected amounts of Paracetamol in tablet samples from around the world based on
calibration for peak over the range 1524-1493cm-1 (centred at 1505cm-1): (a) Ratio of measured to expected amounts
of Paracetamol in 14 samples of tablets from around Europe, (b) Ratio of measured to expected amounts of
Paracetamol in 37 samples of tablets from Asia and Middle East, (c) Ratio of measured to expected amounts of
Paracetamol in 14 samples of tablets from around Africa and the Caribbean Islands.
https://doi.org/10.1371/journal.pone.0202059.g007
Rapid identification of counterfeit medicines
PLOS ONE | https://doi.org/10.1371/journal.pone.0202059 August 10, 2018 13 / 17
The developed qualitative and quantitative ATR-FTIR methods have a number of advan-
tages as they not only identify the presence or absence of the API (paracetamol) but also indi-
cate how much of the API could be in the tablet in a short time. They also reduce exposure to
toxic chemicals used in solvent extraction of the API(s) for analysis using conventional phar-
macopoeia approved methods. The ATR-FTIR instrument used in this study is small and com-
pact and therefore its portability makes it valuable for in-field analysis such as quality control
by pharmaceutical companies and post marketing surveillance by regulatory bodies. Further-
more, for applications to medicines other than paracetamol the potential for the identification
of falsified and substandard medicines with incorrect amounts of API will also reduce the pub-
lic health risk posed by these medications such as antimicrobial resistance and ultimately ther-
apeutic failure. The dangers of under dosing or exceeding the allowed limits for API(s) in
medication especially those with a narrow therapeutic range will also be reduced. Economi-
cally, funds spent on these medications which are toxic or have no therapeutic effect will be
reduced.
Conclusion
The overall result of this study, the identification of 7 suspect paracetamol tablet samples or
12%, is broadly in line with the WHO estimates for the general level of falsified or substandard
medicines worldwide. This level of suspect tablet formulations reflects the eclectic source of
the samples collected in this work.
This study demonstrates that the simple ATR-FTIR approach employed has the capacity to
rapidly identify and also quantify paracetamol in the presence of excipients. The whole process
of crushing, identifying and quantifying a tablet would take about 5 minutes per tablet sample
after the method has been optimised. The multivariate PLS calibration model used in this
study is an automated process further speeding up the time for data processing. This auto-
mated method further reduces variation in data due to errors in manual integration of charac-
teristic peaks for paracetamol identified. However, this is not meant to replace the more
established and highly sensitive conventional solvent extraction methods but to serve as an
alternative to the more expensive Raman systems as an in-field technique for quick screening
of medicines. It is also a green technique as the elimination of solvent extraction of APIs
reduces the amounts of toxic chemicals used thus, reducing chemical waste. Furthermore, the
technique will enable quick withdrawal of substandard and falsified medicines from the mar-
ket thereby reducing the threat to public health. The ATR-FTIR approach reduces testing of
tablets to three simple steps; crush tablet, measure powder and read results whereas the con-
ventional UV spectrophotometric analysis requires solvent extraction, dilution and filtration
prior to analysis and generation of results. It is also relatively inexpensive and easy to use com-
pared to the pharmacopoeia approved techniques so can possibly be used in LMICs where
facilities are not readily available. This approach employed in the identification and quantifica-
tion of paracetamol could potentially be applied in the analysis of other APIs in tablet dosage
forms.
Author Contributions
Conceptualization: Graham Lawson, Sangeeta Tanna.
Data curation: John Ogwu.
Formal analysis: Graham Lawson, Sangeeta Tanna.
Investigation: Graham Lawson, John Ogwu, Sangeeta Tanna.
Rapid identification of counterfeit medicines
PLOS ONE | https://doi.org/10.1371/journal.pone.0202059 August 10, 2018 14 / 17

Project administration: Sangeeta Tanna.
Supervision: Graham Lawson, Sangeeta Tanna.
Validation: Graham Lawson, John Ogwu, Sangeeta Tanna.
Visualization: Graham Lawson, Sangeeta Tanna.
Writing – original draft: Graham Lawson, John Ogwu, Sangeeta Tanna.
Writing – review & editing: Graham Lawson, John Ogwu, Sangeeta Tanna.
References1. Degardin K, Roggo Y, Margot P. Forensic intelligence for medicine anti-counterfeiting. Forensic Sci. Int.
2015; 248: 15–32. https://doi.org/10.1016/j.forsciint.2014.11.015 PMID: 25576676
2. Degardin K, Roggo Y, Margot P. Understanding and fighting the medicine counterfeit market. J. Pharm.
Biomed. Anal. 2014; 87: 167–175. https://doi.org/10.1016/j.jpba.2013.01.009 PMID: 23384475
3. Anzanello MJ, Ortiz R S, Limberger R, Mariotti K. A framework for selecting analytical techniques in pro-
filing authentic and counterfeit Viagra and Cialis. Forensic Sci. Int. 2014; 235:1–7. https://doi.org/10.
1016/j.forsciint.2013.12.005 PMID: 24447444
4. Sammons HM, Choonara I. Substandard medicines: a greater problem than counterfeit medicines.
BMJ Paediatrics 2017. 1:e000007. https://doi.org/10.1136/bmjpo-2017-000007 PMID: 29637090
5. World Health Organisation (WHO), Substandard, spurious, falsely labelled, falsified and counterfeit
(SSFFC) medical products. 2016. Available from: https://www.ip-watch.org/2016/11/28/group-
suggests-new-name-falsified-medicines-dropping-counterfeit/
6. Sukkar E. Taking stock of counterfeit medicines. Pharm. J. 2014; 292: 570.
7. Fernandez FM, Green MD, Newton PN. Prevalence and detection of counterfeit pharmaceuticals: a
mini review. Ind. Eng. Chem. Res. 2008; 47: 585–590.
8. Jackson G, Patel S, Khan S. Assessing the problem of counterfeit medications in the United Kingdom. Int.
J. Clin. Pract. 2012; 66: 241–250. https://doi.org/10.1111/j.1742-1241.2011.02826.x PMID: 22070229
9. Alghannam AFA, Aslanpour Z, Evans S, Schifano F. A systematic review of counterfeit and substan-
dard medicines in field quality surveys. Integrated Pharmacy Research and Practice. 2014; 4(3): 71–88.
10. Clark F. Rise in online pharmacies sees counterfeit drugs go global. The Lancet 2015; 386: 1327–1328.
11. Koczwara A, Dressman J. Poor-quality and counterfeit drugs: A systematic assessment of prevalence
and risks based on data published from 2007 to 2016. J. Pharm Sci. 2017; 106: 2921–2929. https://doi.
org/10.1016/j.xphs.2017.05.018 PMID: 28549909
12. Ranieri N, Tabernero P, Green MD, Verbois L, Herrington J, Sampson E, et al. Evaluation of a New
Handheld Instrument for the Detection of Counterfeit Artesunate by Visual Fluorescence Comparison.
Am. J. Trop. Med Hygiene. 2014; 91: 920–924.
13. Wilczyński S. The use of dynamic thermal analysis to distinguish between genuine and counterfeit
drugs. Int. J. Pharm. 2015; 490: 16–21. https://doi.org/10.1016/j.ijpharm.2015.04.077 PMID: 25975231
14. Bosch ME, Sanchez AR, Rojas FS, Ojeda CB. Determination of paracetamol: Historical evolution. J.
Pharm. Biomed. Anal. 2006; 42:.291–321. https://doi.org/10.1016/j.jpba.2006.04.007 PMID: 16716555
15. Davison M. Pharmaceutical anti-counterfeiting: combating the real danger from fake drugs. 1st ed.
New Jersey: John Wiley & Sons; 2011.
16. de Veij M, Vandenabeele P, Hall KA, Fernandez FM, Green MD, White NJ et al. Fast detection and
identification of counterfeit antimalarial tablets by Raman spectroscopy. J. Raman Spectrosc. 2007; 38:
181–187.
17. Barry F. Medline recalls mislabeled paracetamol. Available from: http://www.in-pharmatechnologist.
com/Regulatory-Safety/Medline-recalls-mislabelled-paracetamol
18. Kwok K, Taylor LS. Analysis of the packaging enclosing a counterfeit pharmaceutical tablet using
Raman microscopy and two-dimensional correlation spectroscopy. Vib. Spectrosc. 2012; 61: 176–182.
19. Gorog S. Identification in drug quality control and drug research. TrAC Trends Anal. Chem. 2015; 69:
114–122.
20. Lebel P, Gagnon J, Furtos A, Waldron KC. A rapid, quantitative liquid chromatography-mass spectrom-
etry screening method for 71 active and 11 natural erectile dysfunction ingredients present in potentially
adulterated or counterfeit products. J. Chromatogr. A. 2014; 1343:143–151. https://doi.org/10.1016/j.
chroma.2014.03.078 PMID: 24767800
Rapid identification of counterfeit medicines
PLOS ONE | https://doi.org/10.1371/journal.pone.0202059 August 10, 2018 15 / 17

21. Russo G, Barbato F, Grumetto L. A validated LC/UV method for the determination of four adulterating
drugs in herbal slimming capsules. J. Pharm. Biomed. Anal. 2016; 117: 436–445. https://doi.org/10.
1016/j.jpba.2015.09.027 PMID: 26454104
22. Custers D, Canfyn M, Courselle P, De Beer JO, Apers S, Deconinck E. Headspace–gas chro-
matographic fingerprints to discriminate and classify counterfeit medicine. Talanta. 2014; 123: 78–88.
https://doi.org/10.1016/j.talanta.2014.01.020 PMID: 24725867
23. Lawson G, Ogwu J, Tanna S. Counterfeit Tablet Investigations: Can ATR FT/IR Provide Rapid Tar-
geted Quantitative Analyses? J. Anal. Bioanal. Tech. 2014; 5: 214. http://dx.doi.org/10.4172/2155-
9872.1000214.
24. Dumarey M, van Nederkassel AM, Stanimirova I, Daszykowski M, Bensaid F, Lees M, et al. Recogniz-
ing paracetamol formulations with the same synthesis pathway based on their trace-enriched chro-
matographic impurity profiles. Anal. Chim. Acta. 2009; 655:43–51. https://doi.org/10.1016/j.aca.2009.
09.050 PMID: 19925914
25. Panusa A, Multari G, Incarnato G, Gagliardi L. High-performance liquid chromatography analysis of
anti-inflammatory pharmaceuticals with ultraviolet and electrospray-mass spectrometry detection in
suspected counterfeit homeopathic medicinal products. J. Pharm. Biomed. Anal. 2007; 43:1221–1227.
https://doi.org/10.1016/j.jpba.2006.10.012 PMID: 17127029
26. Silvestre V, Mboula VM, Jouitteau C, Akoka S, Robins RJ, Remaud G.S. Isotopic 13C NMR spectrome-
try to assess counterfeiting of active pharmaceutical ingredients: site-specific 13C content of aspirin
and paracetamol. J. Pharm. Biomed. Anal. 2009; 50: 336–341. https://doi.org/10.1016/j.jpba.2009.04.
030 PMID: 19481896
27. Glass BD. Counterfeit drugs and medical devices in developing countries. Res. and Rep.Trop. Med.
2014; 2014: 11–22.
28. Koesdjojo MT, Wu Y, Boonloed A, Dunfield EM, Remcho VT. Low-cost, high-speed identification of
counterfeit antimalarial drugs on paper. Talanta. 2014; 130: 122–127. https://doi.org/10.1016/j.talanta.
2014.05.050 PMID: 25159388
29. Hoellein L, Holzgrabe U. Development of simplified HPLC methods for the detection of counterfeit anti-
malarials in resource-restraint environments. J. Pharm. Biomed. Anal. 2014; 98: 434–445. https://doi.
org/10.1016/j.jpba.2014.06.013 PMID: 25016193
30. Hoellein L., Kaale E., Mwalwisi Y. H., Schulze M.H., Holzgrabe U., Routine quality control of medicines
in developing countries: Analytical challenges, regulatory infrastructures and the prevalence of counter-
feit medicines in Tanzania. TrAC Trends Anal Chem. 2016; 76: 60–70.
31. Sacre PY, Deconinck E, De Beer T, Courselle P, Vancauwenberghe R, Chiap P, et al. Comparison and
combination of spectroscopic techniques for the detection of counterfeit medicines. J. Pharm. Biomed.
Anal. 2010; 53: 445–453. https://doi.org/10.1016/j.jpba.2010.05.012 PMID: 20542652
32. Custers D, Cauwenbergh T, Bothy JL, Courselle P, De Beer JO, Apers E et al. ATR-FTIR spectroscopy
and chemometrics: An interesting tool to discriminate and characterize counterfeit medicines. J. Pharm.
Biomed. Anal. 2015; 112: 181–189. https://doi.org/10.1016/j.jpba.2014.11.007 PMID: 25476739
33. Ortiz RS, de Cassia Mariotti K, Fank B, Limberger RP, Anzanello MJ, Mayorga P. Counterfeit Cialis and
Viagra fingerprinting by ATR-FTIR spectroscopy with chemometry: Can the same pharmaceutical pow-
der mixture be used to falsify two medicines? Forensic Sci. Int. 2013; 226: 282–289. https://doi.org/10.
1016/j.forsciint.2013.01.043 PMID: 23422165
34. Neuberger S, Neusuß C. Determination of counterfeit medicines by Raman spectroscopy: Systematic
study based on a large set of model tablets. J. Pharm. Biomed. Anal. 2015; 112: 70–78. https://doi.org/
10.1016/j.jpba.2015.04.001 PMID: 25956227
35. Kovacs S, Hawes SE, Maley SN, Mosites E, Wong L, Stergachis A. Technologies for detecting falsified
and substandard drugs in low and middle-income countries. PloS one. 2014; 9:e90601. https://doi.org/
10.1371/journal.pone.0090601 PMID: 24671033
36. Degardin K, Roggo Y, Been F, Margot P. Detection and chemical profiling of medicine counterfeits by
Raman spectroscopy and chemometrics. Anal. Chim Acta. 2011; 705: 334–341. https://doi.org/10.
1016/j.aca.2011.07.043 PMID: 21962376
37. de Veij M, Deneckere A, Vandenabeele P, de Kaste D, Moens L. Detection of counterfeit Viagra®with
Raman spectroscopy. J. Pharm. Biomed. Anal. 2008; 46: 303–309. https://doi.org/10.1016/j.jpba.2007.
10.021 PMID: 18054194
38. Lyndgaard LB, van den Berg F, de Juan A. Quantification of paracetamol through tablet blister pack-
ages by Raman spectroscopy and multivariate curve resolution-alternating least squares. Chemometr.
Intell. Lab. 2013; 125: 58–66.
39. Vredenbregt MJ, Blok-Tip L, Hoogerbrugge R, Barends DM, De Kaste D. Screening suspected counter-
feit Viagra® and imitations of Viagra®with near-infrared spectroscopy. J. Pharma. Biomed Anal. 2006;
40: 840–849.
Rapid identification of counterfeit medicines
PLOS ONE | https://doi.org/10.1371/journal.pone.0202059 August 10, 2018 16 / 17

40. Roggo Y, Chalus P, Maurer L, Lema-Martinez C, Edmond A, Jent N. A review of near infrared spectros-
copy and chemometrics in pharmaceutical technologies. J. Pharm. Biomed. Anal. 2007; 44(30): 683–
700.
41. Farouk F, Moussa BA, Azzazy HME. Fourier transform infrared spectroscopy for in-process inspection,
counterfeit detection and quality control of anti-diabetic drugs. Spectroscopy. 2011; 26: 297–30.
42. Mallah MA, Sherazi STH, Bhanger MI, Mahesar SA, Bajeer MA. A rapid Fourier-transform infrared
(FTIR) spectroscopic method for direct quantification of paracetamol content in solid pharmaceutical
formulations. Spectrochim. Acta A Mol. Biomol. Spectrosc. 2015; 141: 64–70. https://doi.org/10.1016/j.
saa.2015.01.036 PMID: 25659814
43. Haywood A, Glass BD. Pharmaceutical excipients- where do we begin. Austr. Prescr. 2011; 34: 112–
114.
44. Rowe RC, Sheskey PJ, Cook WG, Fenton ME. Handbook of pharmaceutical excipients. 7th ed. Lon-
don: Pharmaceutical Press; 2012.
45. Behera S, Ghanty S, Ahmad F, Santra S, Banerjee S. UV-visible spectrophotometric method develop-
ment and validation of assay of paracetamol tablet formulation. J. Anal. Bioanal. Tech. 2012; 3: 151.
46. Amado AM, Azevedo C, Ribeiro-Claro PJA. Conformational and vibrational reassessment of solid para-
cetamol. Spectrochimica Acta Part A: Molecular and Biomolecular Spectroscopy. 2017; 183: 431–438.
47. Nanda MR, Yuan Z, Qin W, Poirier MA, Chunbao X. Purification of crude glycerol using acidification:
Effects of acid types and product characterization. Austin J. Chem. Eng. 2014; 1(1): 1004.
Rapid identification of counterfeit medicines
PLOS ONE | https://doi.org/10.1371/journal.pone.0202059 August 10, 2018 17 / 17