quantitative research on the women-owned small business
TRANSCRIPT

FINAL REPORT
Quantitative Research on the Women-Owned Small Business Federal Contract Program
Prepared by
Innovation & Information Consultants, Inc.
Orlando, FL
Prepared for
Emily Bruno
National Women’s Business Council
SBAHQ-12-M-0208
July 2, 2013

i
Table of Contents
List of Acronyms ........................................................................................................................... ii
List of Tables ................................................................................................................................ iii
List of Figures ............................................................................................................................... iv
Chapter 1. Executive Summary .................................................................................................. 1
Chapter 2. Introduction .............................................................................................................. 3
Chapter 3. Research Design and Methodology ......................................................................... 7
Chapter 4. WOSB General Procurement Trends ................................................................... 13
Chapter 5. Industry and Agency Analysis ............................................................................... 20
Industry (NAICS) Analysis..................................................................................................... 20
Agency Analysis ..................................................................................................................... 25
Chapter 6. Vendor-level WOSB Procurement Analysis ........................................................ 32
Chapter 7. Set-Aside Analysis ................................................................................................... 39
Chapter 8. Additional Procurement Analyses ........................................................................ 52
Contract Action Type .............................................................................................................. 52
Type of Contract Pricing ......................................................................................................... 53
Solicitation Procedures ........................................................................................................... 53
Extent Competed ..................................................................................................................... 54
Reason Not Competed ............................................................................................................ 54
Product-Service Code ............................................................................................................. 55
Chapter 9. Key Conclusions and Future Research ................................................................. 57

ii
List of Acronyms
Acronym Definition
CCR Central Contractor Registry
CSV Comma Separated Value
DHS Department of Homeland Security
DOD Department of Defense
DUNS Data Universal Numbering System
ED Economically Disadvantaged
EDWOSB Economically Disadvantaged Women-Owned Small Business
FCP Federal Contract Program
FPDS-NG (FPDS) Federal Procurement Data System - Next Generation
FY Fiscal Year
GAO General Accounting Office
GSA General Services Administration
HubZone Historically Underutilized Business Zone
HUD Department of Housing and Urban Development
IDV PIID Indefinite Delivery Vehicle Procurement Instrument Identifier
NAICS North American Industry Classification System
NASA National Aeronautics and Space Administration
NAWBO National Association of Women Business Owners
OtherLB Large business that is not majority-owned by women
OtherSB Small business that is not majority-owned by women
PIID Procurement Instrument Identifier
PSC Product Service Code
RSB Reserved for Small Business
SAM System for Award Management
SAP Simplified Acquisition Procedures
SBA Small Business Administration
SBO Survey of Business Owners
SDVOSBC Service Disabled Veteran Owned Small Business
SU Substantially Underrepresented
VA Veterans Affairs
WIPP Women in Public Policy
WOB Women-Owned Business
WOLB Women-Owned Large Business
WOSB Women-Owned Small Business
iii
List of Tables
Table 4-1. General Procurement Trends (Contracts and Dollars) FY2000-FY2013 .................... 14
Table 4-2. Small Business Procurement Metrics .......................................................................... 15
Table 4-3. Average Procurement Award (per Contract) Analysis ................................................ 16
Table 5-1. WOSB Contract Share for the Top Five Agencies ...................................................... 26
Table 5-2. WOSB Award Share for the Top Five Agencies......................................................... 28
Table 5-3. Agencies Failing the WOSB FCP Goals, FY2012 ...................................................... 30
Table 6-1. Vendor (DUNS) Analysis by Business Type .............................................................. 33
Table 6-2. Small Business Vendors Receiving a Contract Award Each Fiscal Year ................... 34
Table 6-3. WOSB Vendor Participation by Number of Years Awarded a Contract .................... 35
Table 7-1. Summary of Set-Aside Programs and Federal Procurement Awards ......................... 40
Table 7-2. Set-Aside Analysis by Major Agency ......................................................................... 41
Table 7-3. Set-Aside Analysis by Major Industry NAICS Codes ................................................ 43
Table 7-4. Analysis of EDWOSB and WOSB Set-Aside Contracts ............................................ 43
Table 7-5. Analysis of EDWOSB and WOSB Set-Asides by Major NAICS Code ..................... 45
Table 7-6. Summary of Designated NAICS without a an EDWOSB or WOSB Set-Aside
Award ............................................................................................................................................ 46
Table 7-7. Department of Defense WOSB FCP Contract Awards by Industry............................ 47
Table 7-8. Vendor Participation in EDWOSB and WOSB Set-Aside Procurement
Opportunities................................................................................................................................. 48
Table 7-9. Contract Analysis of Vendors Receiving an EDWOSB or WOSB Set-Aside
Contract ......................................................................................................................................... 50
Table 8-1. Analysis of Top 10 PSCs for WOSBs ......................................................................... 56

iv
List of Figures
Figure 1-1. Percent of Total Federal Prime Contract Dollars Awarded to WOSBs ....................... 4
Figure 3-1. IIC, Inc. Contract Roll Up .......................................................................................... 10
Figure 4-1. Summary of Contracts and Awards by Business Type .............................................. 15
Figure 4-2. Ratio of WOSB Contract Statistics to OtherSB Contract Statistics ........................... 18
Figure 5-1. Analysis of Procurement Statistics for 83 Designated NAICS versus Non-Designated
NAICS........................................................................................................................................... 21
Figure 5-2. NAICS 3322 Procurement Scorecard ........................................................................ 23
Figure 5-3. WOSB Share of Contracts and Dollars NAICS 3391 ................................................ 24
Figure 5-4. WOSB Share of Contracts and Dollars for NAICS 5413 and NAICS 5415 ............. 25
Figure 5-5. Agency 9700: Department of Defense Procurement Scorecard ............................... 27
Figure 5-6. Number of Agencies Successful in Meeting the 5 Percent WOSB Share Goal ......... 30
Figure 6-1. Concentration of Awards ($) for WOSBs by Vendor Count ..................................... 37
Figure 7-1. WOSB Share for the Top Four Set-Asides ................................................................ 41
Figure 7-2. Percentage of Total Dollars Funded Through Set-Asides, DoD and GSA ................ 42
Figure 7-3. Agencies Funding WOSB and EDWOSB Set-Aside Contacts.................................. 44
Figure 8-1. Analysis of Contracts and Dollar Awards by Contract Action Type – FY2007
through FY2012 ............................................................................................................................ 52

1
Chapter 1. Executive Summary
The Women-Owned Small Business Federal Contract Program (WOSB FCP) aims to
reduce the inequity in award and distribution of prime Federal contracts to Women-Owned Small
Businesses (WOSBs). The WOSB FCP includes policies designed to promote WOSB Federal
procurement activity, such that WOSBs procure at least 5 percent of total prime Federal
contracts in a given year. The principal mechanisms available to increase WOSB participation in
Federal procurement are “set-asides,” in which contracting agencies set aside certain Federal
contracts specifically for WOSBs in an effort to reach the 5 percent contracting objective.
The primary focus of our analysis was to evaluate the impact of the WOSB FCP on the
participation of and awards granted to women-owned small businesses. Of principal interest was
whether WOSBs are meeting procurement thresholds of 5 percent (in both contract number and
dollar amount) of total Federal prime contracting awards since the implementation of the WOSB
FCP rules in 2011. In order to address this, and other procurement research questions, we
performed a comprehensive analysis of WOSB procurement beginning in fiscal year (FY) 2000.
We relied on procurement data from the Federal Procurement Data System – Next Generation
(FPDS-NG) database and tabulated procurement records on a contract basis. We subsequently
analyzed contract procurement data on a fiscal-year basis, with a special focus on WOSB
procurement trends by industry, agency, and the use of set-asides. When warranted, we analyzed
vendor-specific trends to support data observations. Our principal conclusions, as discussed in
more detail in our report, include:
WOSBs have typically increased their proportionate share of contracts awarded and
dollars awarded year over year from FY2000 through FY2012. (Chapter 4)
Despite WOSB progress, average WOSB awards remain lower than those of other small
businesses. (Chapter 4)
The contract award gender gap appears to be closing in select industries, most notably in
NAICS1 3359 (Other Electrical Equipment and Component Manufacturing), NAICS
5416 (Management, Scientific and Technical Consulting Services), and NAICS 6214
(Outpatient Care Centers). Each of these NAICS codes represent an industry in which
WOSBs are substantially underrepresented. (Chapter 5)
The number of industries in which the WOSB share of awards is greater than the WOSB
share of contracts remains low, indicating that on average, WOSBs are earning less
money per contract than non-WOSBs in the majority of industries. (Chapter 5)
Within the 83 underrepresented NAICS industries, WOSBs are meeting the contract
threshold on average, but remain underrepresented in terms of awards share. (Chapter 5)
1 The North American Industry Classification System (NAICS) is the standard used by Federal agencies in
classifying business establishments for the purposes of collecting, analyzing, and publishing statistical data related
to the U.S. business economy. (http://www.census.gov/eos/www/naics/)

2
Almost half of all WOSB vendors received contracts only in a single fiscal year,
indicating a high rate of turnover – however, it is likely some of these vendors have
remained active in procurement but contracted as a different business type (e.g., change
in gender ownership), as a WOSB bidding on, but not receiving contracts, through
subcontracting, or as a relatively new vendor with anticipated participation and awards
post-FY2012. (Chapter 6)
WOSB vendors who demonstrate long periods of activity across different fiscal years
tend to receive a greater share of contract dollars. (Chapter 6)
WOSB contract dollars are highly concentrated among select vendors in each fiscal year,
although there is often a shift in the specific vendors between fiscal years (i.e., it is not
necessarily the same vendors receiving disproportionately large shares of awards year
after year). (Chapter 6)
WOSBs have increased their procurement share through set-aside programs over time.
(Chapter 7)
The introduction of the WOSB FCP and the EDWOSB and WOSB set-asides has
generated more than $100 million in contract awards restricted to WOSBs. (Chapter 7)
The WOSB FCP has facilitated entry of new participants through the use of the WOSB
and EDWOSB set-asides. (Chapter 7)
Consistent with general procurement trends for WOSBs, vendors with more longevity
and stability (i.e., receiving contracts in multiple fiscal years) were able to secure a larger
portion of contracts through the use of the WOSB and EDWOSB set-asides. (Chapter 7)
Between FY2007 and FY2012, the most common type of contract award for WOSBs was
a purchase order, followed closely by delivery orders. (Chapter 8)
One reason for potential disparities in award levels between WOSBs and non-WOSBs is
that the average purchase order contract award was only 12 percent the level of a delivery
order award. Given that WOSBs favored purchase orders more so than non-WOSBs, this
facilitated a lower level of award compared to non-WOSBs. (Chapter 8)
Analysis of the “extent competed” variable indicates that a higher percentage of WOSB
contract awards occur under some level of competition than the rest of the general
population. (Chapter 8)
The WOSB FCP has been in effect for a little over two years, providing a limited
timeline to fully assess the efficacy of the program. While we could not conclude definitively
the program was working as intended, many of our data analyses and observations indicate that
the WOSB FCP has led to an increased share of contracts and dollar awards won by WOSBs,
including contracts and awards won by WOSBs who had not previously won a Federal prime
contract. Given the limited procurement history associated with the WOSB FCP, we believe a
longer procurement time series history will allow a more robust assessment of the efficacy of the
WOSB FCP.

3
Chapter 2. Introduction
Demographic, economic and business data highlight the growing importance of Women-
Owned Businesses (WOBs), including Women-Owned Small Businesses (WOSBs), in the U.S.
economy:
Since 1970, the number of women in the workforce has more than doubled, with women
comprising 49.3 percent of the workforce in 2012.2
The number of women-owned businesses increased 59 percent between 1997 and 2013,
well above the national average of 41 percent for overall new business growth for the
same time period.3
U.S. Census Bureau data from the 2007 Survey of Business Owners (SBO) indicate that
28.7 percent of all U.S. businesses were women-owned, 7.8 million of which were
WOSBs.4
Between 1997 and 2007, women-owned businesses created 500,000 jobs while other
privately-held firms lost jobs.5
Despite the growing presence of WOSBs in the U.S. economy, parity issues exist when
comparing WOSB business performance trends and non-WOSB business performance trends.
One such area is WOSB involvement in Federal procurement, in which there has been a
historical disparity between the number and dollar value of Federal prime contracts awarded to
WOSBs compared to non-WOSBs. Inequity in contracts and awards for WOSBs is not a new
phenomenon, as the legislative history illustrates multiple efforts to increase the participation and
award of Federal procurement contracts and dollars to WOSBs. While the focus of this research
involves the WOSB Federal Contract Program (WOSB FCP), legislative history involving
WOSB procurement issues dates back almost two decades. Two major legislative efforts leading
up to the WOSB FCP include:
Women-Owned Business Contracting Program (1994) required the Federal government
to award 5 percent of its prime contracts to businesses certified as women-owned in an
effort to reduce the contract award disparity.6
2 “What American Women Do For Work,” NPR, May 3, 2012.
http://www.npr.org/blogs/money/2012/05/03/151282913/what-america-s-women-do-for-work 3 American Express OPEN, “The American Express OPEN State of Women-Owned Businesses Report: a summary
of important trends, 1997-2013,” at p. 2. 4 See http://www.nwbc.gov/facts/women-owned-businesses for additional details regarding WOSB statistics derived
from the 2007 SBO. 5 U.S. Department of Commerce, “Women-owned Businesses in the 21
st Century,” Economics and Statistics
Administration, October 2010. http://www.esa.doc.gov/Reports/women-owned-businesses-21st-century 6 U.S. Department of Health and Human Services, “Chapter 10: Women Owned Small Business Program.”
http://www.hhs.gov/about/smallbusiness/Small%20Business%20Program%20Manual/chapter10.html. However,
the principal mechanism for encouraging WOSB participation largely resided with the judgment of contracting
officers to pursue restricted competition, as opposed to specifically setting aside contracts for WOSBs. As a result,
the legislation did not necessarily enforce the 5 percent standard by increasing the competitiveness of WOSBs in
Federal procurement.
4
The Equity for Contracting for Women Act of 2000 provided the genesis of criteria
included in the current WOSB FCP, including reiterating the 5 percent goal, the authority
to set-aside contracts, the reasonable expectation of two or more bids, isolation of
specific industries where WOSBs are underrepresented with respect to Federal
procurement contracting, and caps associated with potential awards.7
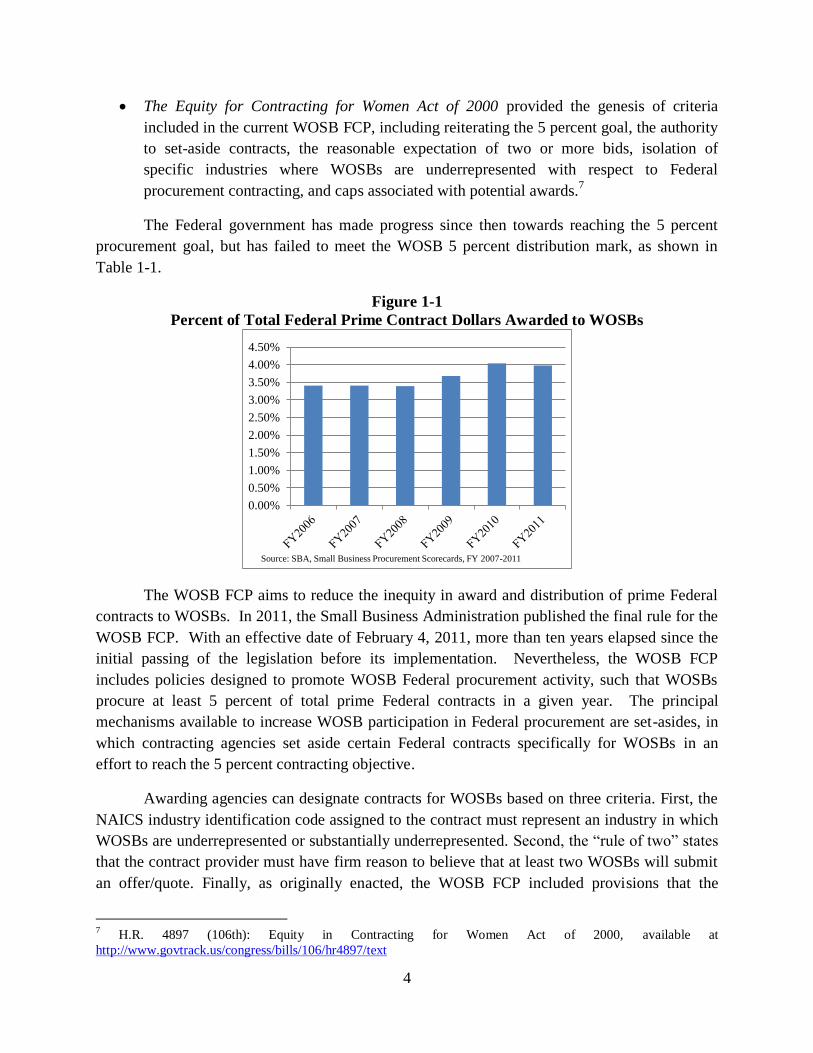
The Federal government has made progress since then towards reaching the 5 percent
procurement goal, but has failed to meet the WOSB 5 percent distribution mark, as shown in
Table 1-1.
Figure 1-1
Percent of Total Federal Prime Contract Dollars Awarded to WOSBs
The WOSB FCP aims to reduce the inequity in award and distribution of prime Federal
contracts to WOSBs. In 2011, the Small Business Administration published the final rule for the
WOSB FCP. With an effective date of February 4, 2011, more than ten years elapsed since the
initial passing of the legislation before its implementation. Nevertheless, the WOSB FCP
includes policies designed to promote WOSB Federal procurement activity, such that WOSBs
procure at least 5 percent of total prime Federal contracts in a given year. The principal
mechanisms available to increase WOSB participation in Federal procurement are set-asides, in
which contracting agencies set aside certain Federal contracts specifically for WOSBs in an
effort to reach the 5 percent contracting objective.
Awarding agencies can designate contracts for WOSBs based on three criteria. First, the
NAICS industry identification code assigned to the contract must represent an industry in which
WOSBs are underrepresented or substantially underrepresented. Second, the “rule of two” states
that the contract provider must have firm reason to believe that at least two WOSBs will submit
an offer/quote. Finally, as originally enacted, the WOSB FCP included provisions that the
7 H.R. 4897 (106th): Equity in Contracting for Women Act of 2000, available at
http://www.govtrack.us/congress/bills/106/hr4897/text
0.00%
0.50%
1.00%
1.50%
2.00%
2.50%
3.00%
3.50%
4.00%
4.50%
Source: SBA, Small Business Procurement Scorecards, FY 2007-2011

5
anticipated award price including options could not exceed statutory thresholds of $6.5M for
manufacturing or $4M for other contracts. However, the FY13 National Defense Authorization
Act, effective January 2, 2013, lifted these thresholds on WOSB designated contracts.
In light of the continued disparity in Federal procurement award levels between WOSBs
and their non-WOSB counterparts, Congress enacted a two-pronged system to determine
underrepresentation, which considers both the number of contracts awarded to WOSBs as a
portion of the total, and the award amount of those contracts. The two-pronged system prevents
contracts with large awards from satisfying the 5 percent Federal mark. However, industries and
agencies have little incentive to award 5 percent of all contracts to WOSBs. There are no
repercussions for missing the goal, and no rewards for success in the program. Congress set the 5
percent goal almost 20 years ago, and the Federal government has struggled to meet the objective
on a consistent basis. Interestingly, despite underrepresentation in prime Federal contracting, the
WOSB share of Federal subcontracting met the 5 percent threshold and was 6.10 percent in
2011, according to the SBA Scorecards.8
The legislative history has generated a number of studies designed to test the
effectiveness of the legislation and to help refine subsequent legislative efforts. Key areas of
research include understanding the level of underrepresentation of WOSBs in Federal
procurement, as well as highlighting some of the reasons why WOSBs might be
underrepresented. In 2007 Kauffman-RAND investigated the role of WOSBs in the prime
Federal contract market. 9
This study indicated that WOSBs were underrepresented in terms of
both contract number and award amount, despite previous efforts to increase WOSB
participation in Federal procurement. Despite parity issues, Federal procurement remains an
important focus for many WOSBs. The National Association of Women Business Owners’
January 2010 survey measured the importance of selected issues to women business owners.
Women business owners cited “gaining access to Federal contract opportunities” as either very
important or extremely important 44 percent of the time, compared with 29 percent in 2008.10
Recognition of the disparity in Federal procurement between WOSBs and non-WOSBs
has led to several joint efforts designed to encourage WOSB participation in Federal
procurement. In 2008, Women Impacting Public Policy (WIPP) and American Express OPEN
partnered to educate women business owners about Federal procurement and facilitate women-
owned business participation in Federal contracting. The “Give Me 5” program provides
resources to women business owners as a means to reach the 5 percent legislative mandate for
8 SBA Scorecards, 2007, 2008, 2009, 2010, 2011. While our research focus remains prime contracting, we note
that subcontracting is another potential research area for assessing WOSB participation in Federal procurement. 9 N. Moore, , N. Nicosia, , E. Reardon, Kauffman-RAND Institute for Entrepreneurship Public Policy, “The
Utilization of Women-owned Small Businesses in Federal Contracting,” 2007.
http://www.rand.org/pubs/technical_reports/2007/RAND_TR442.pdf. 10
National Association of Women Business Owners, “NAWBO 2010 Issues Survey, January 2010 Question
Results.” http://nawbo.org/imageuploads/NAWBO2010IssuesSurveyResults.pdf

6
WOSB participation in prime Federal contracting.11
In 2013, a collaborative partnership between
the SBA, WIPP, and American Express OPEN launched the “ChallengeHER” program, which
represented an evolution of the successful “Give Me 5” program.12
This program offers women
small business owners mentoring programs, online training curriculum, and access to live events
featuring government buyers across the United States. ChallengeHER also calls for women
entrepreneurs to promote their innovative ideas and products to the government in an effort to
earn more than $1 million in annual revenues.13
Unfortunately, in terms of revenues, the percentage of women-owned businesses in the
top echelon has remained stagnant for over fourteen years, despite the fact that women-owned
small businesses have grown as a share of the American economy in terms of both revenue and
number of employees. In 1997, 1.8 percent of women-owned businesses had revenues in excess
of $1 million. Today, although the total number of WOBs has increased, the percentage of $1
million businesses remains unchanged.14
Additionally, average receipts of women-owned firms
are significantly lower than those of their male-owned counterparts.15
An NWBC analysis
indicates that this inequity is partially due to the industries in which MOBs and WOBs most
often participate.16
That is, the industries in which WOBs typically engage have lower overall
receipts, regardless of firm ownership,17
which corroborates findings from the 2007 Kauffman-
Rand Study, which specifically reviewed WOSB procurement trends across industries.18
Our research builds upon the prior economic studies and statistics to develop an increased
understanding of the impact of legislation on WOSB procurement trends. In the remainder of
this report, we discuss our research methodology and findings.
11
“WIPP’s Give Me 5 and American Express OPEN aid small woman-owned businesses,” Examiner.com, October
17, 2010. http://www.examiner.com/article/wipp-s-give-me-5-and-american-express-open-aid-small-woman-
owned-businesses 12
Lourdes Martin-Rosa, “ChallengeHER gives women-owned small businesses an extra boost in 2013.”.
http://govwin.com/lourdes_blog/challengeher-gives-womenowned-small-businesses/850668 13
American Express OPEN, “SBA, WIPP and American Express OPEN launch new program to close the gap in
women contracting,” April 23, 2013. http://about.americanexpress.com/news/pr/2013/challengeher-open-women-
contracting.aspx 14
Ibid. 15
Results from the 2007 U.S. Census Bureau SBO indicate that for employer-firms, average receipts for WOBs
were approximately $1.2 million compared to $2.5 million for MOBs. With respect to non-employer firms, average
receipts for WOBs were approximately $26.5 thousand, compared with $53.4 thousand for MOBs. Data available at
http://factfinder2.census.gov/faces/tableservices/jsf/pages/productview.xhtml?pid=SBO_2007_00CSA05&prodType
=table 16
National Women’s Business Council, “New Data Analysis Shows Women-Owned Business Thriving, But Still
Facing Obstacles,” June 2013. http://www.nwbc.gov/sites/default/files/Women%20in%20Business%202007-
2010.pdf 17
National Women’s Business Council (NWBC), “Women-Owned Firms in the U.S.,” January 2012.
http://www.nwbc.gov/sites/default/files/NWBC%20Final%20Narrative%20Report.pdf 18
Kauffman-RAND, op. cit.
7
Chapter 3. Research Design and Methodology
Our analysis focused on evaluating whether the WOSB FCP affected the participation of
and awards granted to women-owned small businesses. As an initial matter, we evaluated
overall WOSB Federal procurement trends on an annual basis from 2000 through the present.19
This analysis allowed us to compare WOSB procurement trends prior, and subsequent, to the
enactment of the WOSB FCP in February 2011. Primary research questions included:
Are WOSBs meeting procurement thresholds of 5 percent (in both contract number and
dollar amount) of total Federal prime contracting awards since the implementation of the
WOSB FCP rules in 2011?
How do the more recent procurement data compare with periods prior to the
implementation of the WOSB FCP?
Do the data indicate any potential gender gaps within overall procurement activity?
Do we observe any vendor-specific trends within WOSB Federal procurement activity
between 2000 and the present, including any explained by the implementation of the
WOSB FCP or use of set-asides? Do we observe more recent trends with respect to the
use of WOSB and EDWOSB set-asides?
Given that the WOSB FCP and prior legislation focused on 83 NAICS20
industries where
WOSBs were either underrepresented or substantially underrepresented, do we observe
changes in WOSB procurement activity within these NAICS industries as a result of the
WOSB FCP?
Similarly, which government agencies are and are not meeting legislative goals for
WOSB procurement activity? Do we observe trends in WOSB and general procurement
among the agencies that are most successful versus those that fail to meet the 5 percent
threshold?
With respect to both NAICS and agency procurement trends, what role do set-asides,
including those specific to the WOSB FCP, play in WOSB procurement activity?
How does WOSB use of set-asides compare to non-WOSBs use of set-asides and what
role, if any, do the use of WOSB and economically disadvantaged WOSB (“EDWOSB”)
set-asides play in influencing WOSB use of other set-asides?
For our research design, we first obtained contract level Federal procurement data for
each individual contract executed between 2000 and the present. We tabulated the data and,
19
We performed our analysis using an October 1 through September 30 fiscal year convention, consistent with the
U.S. Government’s fiscal year. Any yearly or annual references in our quantitative analyses and results refer to the
fiscal year. 20
As mentioned previously, the NAICS is a standard classification system used by Federal agencies to collect and
analyze business establishment data. NAICS codes are six-digit numbers, where the first two digits represent the
major industrial sector, while the remaining digits signify with more specificity the nature of the business sector
within the major industrial sector. In this report, we focus on the first four digits of the NAICS codes which provide
a mid-level disaggregation by industry (but not the most detailed industrial information captured by the full six digit
NAICS code).

8
when appropriate, performed statistical and graphical analysis to compare results for different
subsets of data. We expected to use the Federal Procurement Data System – Next Generation
(“FPDS-NG” or “FPDS”) for Federal procurement data from 2000 to the present.21
FPDS-NG
contains hundreds of variables and descriptive characteristics for each contract action22
associated with a given procurement activity. A subsequent communication with the FPDS-NG
support desk23
personnel led us to obtain prime Federal procurement raw data files from
USASpending.gov, a government web site which contains the FPDS-NG data but allows greater
flexibility in downloading raw data files in various formats.24
We subsequently downloaded all
available prime Federal procurement contract action data from Fiscal Year 2000 through the
present.25
Each raw data file contained individual records, where each record represented a
Federal procurement contract action. In addition, each record contained 213 distinct variables
related to the particular contract action. For our analyses, we selected 30 variables for each
contract action to accomplish our research objectives.
One of the key principles underlying our research was evaluating WOSB procurement in
terms of contracts, as opposed to actions. This represented an important distinction, given that
raw FPDS-NG data are recorded at the action level, and numerous government organizations rely
on actions when reporting small business data, trends and analyses.26
However, multiple actions
can, and do, occur on the same contract for a particular vendor during the lifetime of a specific
procurement contract. Over time, additional actions might be recorded to represent no-cost
modifications (e.g., extending the due date or changing a vendor name), or alternatively to
increase (e.g., additional funding on same contract) or decrease (e.g., close-out and “de-
obligation” of remaining funds) the total contract value for a particular contract.27
In our
analyses, we focused on the total contract value for a specific contract, as opposed to assessing
each contract action individually. To do so, we employed a contract “roll-up” process that
21
FPDS-NG is publicly available at https://www.fpds.gov/fpdsng_cms/, and includes a number of customized
reports summarizing Federal procurement activity. Data are updated on a daily basis and FPDS-NG maintains a
data history dating back to legacy transactions from as early as 1979. 22
“Contract action” means any oral or written action that results in the purchase, rent, or lease of supplies or
equipment, services, or construction using appropriated dollars over the micro-purchase threshold, or modifications
to these actions regardless of dollar value. Contract action does not include grants, cooperative agreements, other
transactions, real property leases, requisitions from Federal stock, training authorizations, or other non-FAR based
transactions. (http://www.acquisition.gov/far/html/Subpart%204_6.html) 23
Email communication with FPDS-NG Support Desk, October 11, 2012. 24
We were able to download complete raw Federal procurement data on prime contract actions in comma-separate-
value (“csv”) file formats for each fiscal year from 2000 through the present. 25
For the purposes of our analyses, we downloaded fiscal year 2013 data as of March 6, 2013. As a result, our
analyses do not include any data additions after March 6, 2013. In addition, Department of Defense procurement
activity is subject to a 90 day delay in public reporting due to national security concerns. Finally, USAspending.gov
allows downloading procurement data on a state by state basis to maintain more manageable data files. However,
data for Oregon were not available at the time we downloaded procurement data. We alerted FPDS-NG and the
USASpending.gov data desk of this bug in October 2012. However, USASpending did not correct this bug until the
release of a March 29, 2013 service pack. As a result, we do not include Oregon data in our analyses. 26
For example, the Small Business Goaling Reports provide scorecards on Federal procurement activity across
different agencies based on select business characteristics. 27
In addition, these multiple contract actions might occur in different fiscal years.

9
consolidated multiple contract actions occurring on a single contract into a single contract
database record.
The contract roll-up was a multi-step process designed to isolate individual contracts and
subsequently aggregate the total contract value by summing obligated amounts on each action
associated with a contract. In order to isolate specific contracts, we examined a combination of
three variables included in each contract action.28
The first variable was the DUNS number,
which is a unique nine-digit number that identifies a particular vendor registered in the System
for Award Management (“SAM”). Over time, the Federal government has combined and
streamlined its vendor information system. The current system, SAM, requires each vendor to
register in order to contract with the government. Further, each vendor’s business size,
ownership type (e.g., women-owned), and other variables are stored. SAM (and its immediate
predecessor registry, the Central Contractor Registry (CCR)) marks an improvement over
previous registry systems as it stores all vendor information in a central repository, which
decreases the risk of incorrect or mismatched data between databases. To that end, SAM has
streamlined the procurement process, as vendors and contracting officers are only required to
enter contract information in a single database, decreasing the risk for errors. However, SAM
was not operational until recently.29
The second variable was the Procurement Instrument Identifier (“PIID”), which is a
unique identifier for each procurement contract, agreement or order. Lastly, we included the
Indefinite Delivery Vehicle PIID (“IDV PIID”), given that certain contract actions used the PIID
as a contract-controlling identifier, while other contract actions used the IDV PIID as the
contract-controlling identifier. We subsequently created a unique contract identifier (“IIC ID”)
which represented a combination of DUNS, PIID and IDV PIID variables. Each procurement
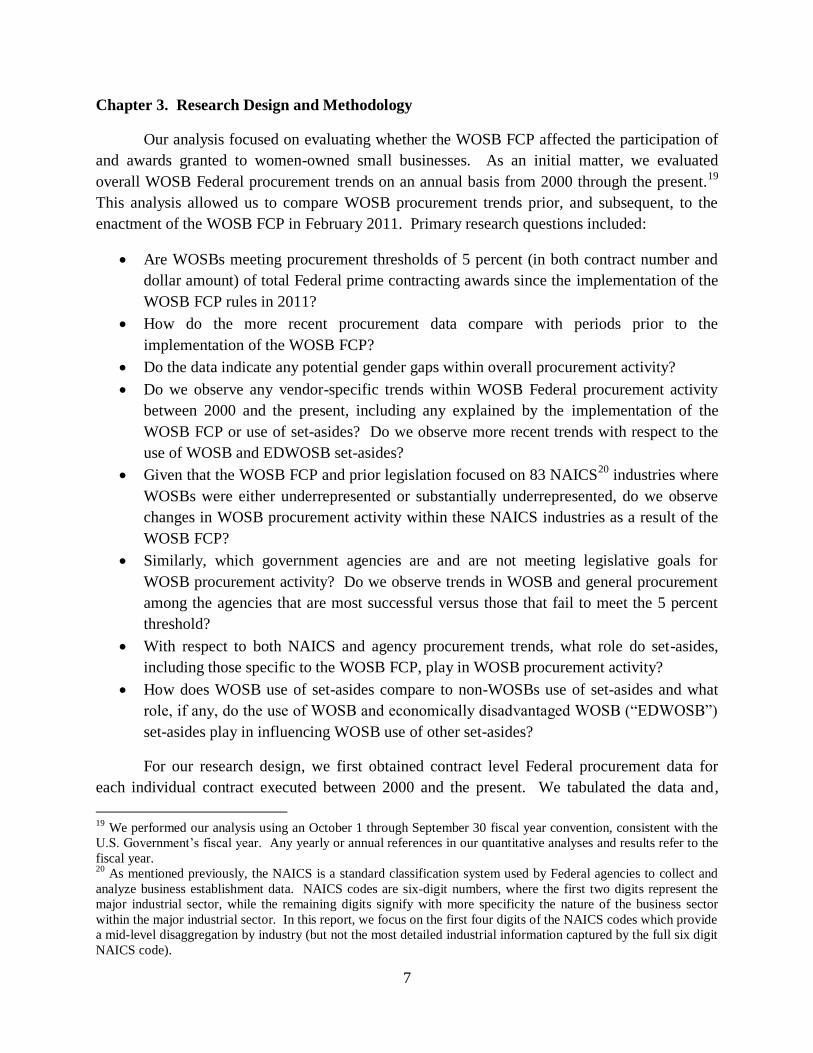
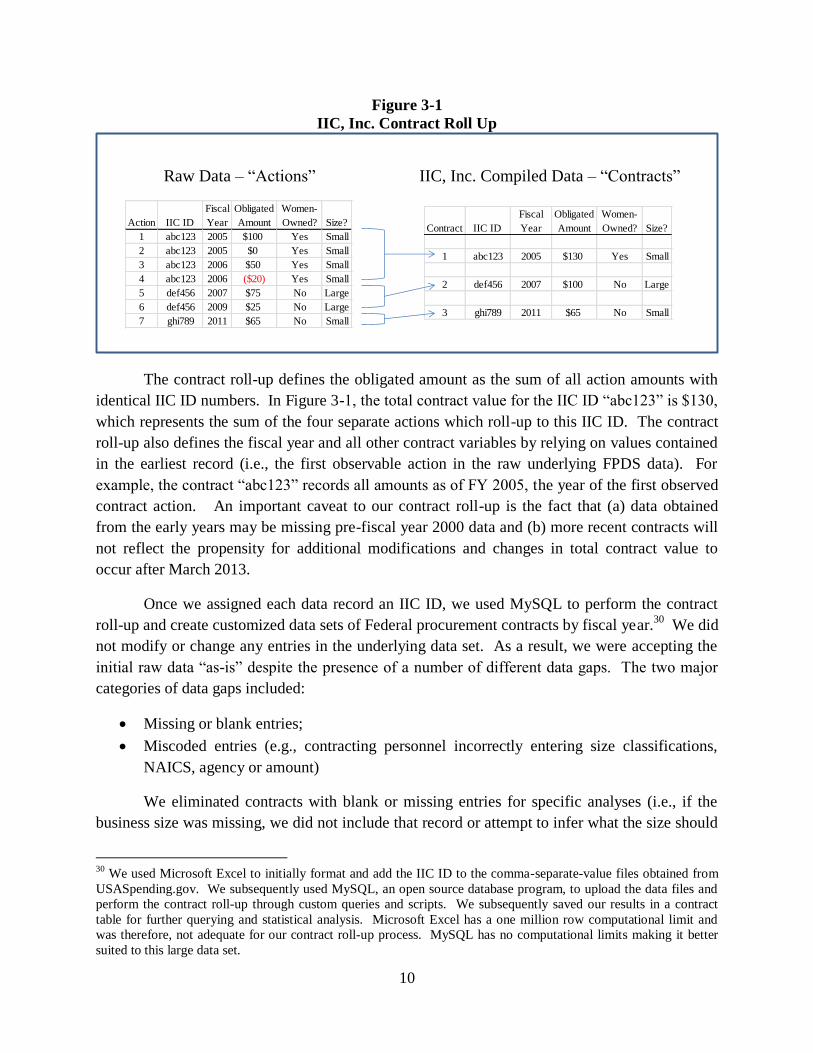
action in our raw data files had an IIC ID, which facilitated our contract roll-up. Figure 3-1
illustrates our contract roll-up process. In this hypothetical example, IIC ID “abc123” represents
one contract for a specific WOSB with DUNS number “123.” There are four actions associated
with this contract, each with a different obligated amount. Likewise, IIC ID “def456” represents
a separate and distinct contract for a different vendor, but with only two actions.
28
See http://www.usaspending.gov/sites/all/themes/usaspendingv2/Archives_Data_Feeds_Data_Dictionary.pdf for a
detailed description of specific FPDS variables. 29
For more information about SAM, please visit https://www.sam.gov/portal/public/SAM/.
10
Figure 3-1
IIC, Inc. Contract Roll Up
The contract roll-up defines the obligated amount as the sum of all action amounts with
identical IIC ID numbers. In Figure 3-1, the total contract value for the IIC ID “abc123” is $130,
which represents the sum of the four separate actions which roll-up to this IIC ID. The contract
roll-up also defines the fiscal year and all other contract variables by relying on values contained
in the earliest record (i.e., the first observable action in the raw underlying FPDS data). For
example, the contract “abc123” records all amounts as of FY 2005, the year of the first observed
contract action. An important caveat to our contract roll-up is the fact that (a) data obtained
from the early years may be missing pre-fiscal year 2000 data and (b) more recent contracts will
not reflect the propensity for additional modifications and changes in total contract value to
occur after March 2013.
Once we assigned each data record an IIC ID, we used MySQL to perform the contract
roll-up and create customized data sets of Federal procurement contracts by fiscal year.30
We did
not modify or change any entries in the underlying data set. As a result, we were accepting the
initial raw data “as-is” despite the presence of a number of different data gaps. The two major
categories of data gaps included:
Missing or blank entries;
Miscoded entries (e.g., contracting personnel incorrectly entering size classifications,
NAICS, agency or amount)
We eliminated contracts with blank or missing entries for specific analyses (i.e., if the
business size was missing, we did not include that record or attempt to infer what the size should
30
We used Microsoft Excel to initially format and add the IIC ID to the comma-separate-value files obtained from
USASpending.gov. We subsequently used MySQL, an open source database program, to upload the data files and
perform the contract roll-up through custom queries and scripts. We subsequently saved our results in a contract
table for further querying and statistical analysis. Microsoft Excel has a one million row computational limit and
was therefore, not adequate for our contract roll-up process. MySQL has no computational limits making it better
suited to this large data set.
Action IIC ID
Fiscal
Year
Obligated
Amount
Women-
Owned? Size?
1 abc123 2005 $100 Yes Small
2 abc123 2005 $0 Yes Small
3 abc123 2006 $50 Yes Small
4 abc123 2006 ($20) Yes Small
5 def456 2007 $75 No Large
6 def456 2009 $25 No Large
7 ghi789 2011 $65 No Small
Contract IIC ID
Fiscal
Year
Obligated
Amount
Women-
Owned? Size?
1 abc123 2005 $130 Yes Small
2 def456 2007 $100 No Large
3 ghi789 2011 $65 No Small
Raw Data – “Actions” IIC, Inc. Compiled Data – “Contracts”

11
have been). We could not control for miscoded entries that were not readily identifiable and
accepted these data and records as entered into FPDS-NG. Lastly, to increase comparability of
this study with the manner in which certain governmental agencies, including the Small Business
Administration (SBA), analyze small business procurement performance, we applied SBA’s
Exclusion process to our contract data. The SBA excludes certain procurement categories from
the overall population of procurement data when measuring small business procurement
performance; for example, SBA excludes procurement funded by a foreign entity.31
Once we
had compiled our contract-level dataset, we performed our analyses using MySQL queries and
statistical analyses and Microsoft Excel computation analysis on subsets of data exported from
MySQL.
The bulk of our research design and methodology focused on isolating WOSB Federal
procurement activity and comparing the results and trends to those of non-WOSB entities. As a
result, it was important for us to use a uniform and consistent definition of WOSBs in our data
analysis. In the FPDS-NG data,32
there are separate women-owned and business size flags for
every action. In performing our analyses, we used the combination of these two variables to
classify the different business types: women-owned small business (“WOSB”), non-women-
owned33
small businesses (“OtherSB”), women-owned large business (“WOLB”), and non-
women-owned large business (“OtherLB”). Collectively, we refer to any entities that are not
specifically WOSBs as “non-WOSBs.” Per our contract roll-up, we determined business type
for a particular vendor on a contract by the earliest observed action on a particular contract. In
the event that a particular contract was missing an entry for either the “women-owned” flag or
size determination variable, we excluded that contract from our analysis.
Once we controlled for observable data gaps, we were able to refine and implement our
research design and methodology. We tested the initial hypothesis that the implementation of
the WOSB FCP led to an increase in Federal procurement activity for WOSBs at the contract-
level, when comparing procurement levels prior, and subsequent, to the implementation of the
program. We performed a quantitative time-series analysis of WOSB procurement activity (in
terms of number of contracts and dollar values) specific to NAICS designations and agencies,
and compared these results to analogous analyses for non-WOSBs. Our research included
graphical and tabular analysis of the number of women-owned small businesses securing prime
Federal contracts in the 83 designated underrepresented NAICS industries, the number of
31
https://www.fpds.gov/Reports/manage/html/preview_Small_Business_Goaling_Report.html 32
An important point is that until 2004, there was no distinction between women-owned businesses and WOSBs.
By defining WOSBs as businesses that are both small and woman-owned, we attempt to circumvent potential
differences in business type classification over time. However, we recognize that the size determination is made at a
contracting officer-level. We observed instances where a particular vendor might have been classified as small
under a contract for one agency, but classified as large by a separate contracting officer with respect to a contract for
a different agency. We accepted the data “as-is” and did not adjust any size classification differences that might
arise across different agencies or industrial sectors. 33
For clarification, we are including firms with equal men/women ownership and women-minority-ownership in the
“Other” small business category.

12
women-owned small businesses securing contracts per agency, and investigation into the
distribution and utility of set-asides, particularly the WOSB and EDWOSB set-asides that arose
from the WOSB FCP.
The remainder of this research report focuses on addressing the primary research
objectives. We include relevant summary tables supporting our principal observations and
conclusions. These summary tables do not represent the full scope of the analytical detail we
investigated throughout our research. We refer the reader to our complementary “Data Book”
which contains additional and more detailed analyses related to our investigation into WOSB
Federal procurement, with a particular focus on the WOSB FCP. Finally, in our research design
and methodology we focus solely on the Federal procurement data obtained from FPDS-NG to
analyze procurement trends. Nevertheless, a large number of other variables will have an effect
on procurement performance, most notably, industry-specific data that the FPDS-NG data do not
capture. For example, a decline in WOSB procurement for a specific industry may be less a
result of changes in procurement opportunities, but a response to industry-specific events that
might lead to a shift in WOSB procurement behavior within that industry. We caution the reader
that we do not include these industry factors in our analyses.

13
Chapter 4. WOSB General Procurement Trends
In this chapter we describe patterns of women-owned small business (WOSB)
procurement over the past 14 fiscal years, specifically focusing on comparisons of contract-based
procurement trends with non-women-owned other small businesses (“OtherSBs”) and large
businesses (collectively, “non-WOSBs”). Our results provide a comparative basis for assessing
whether women-owned small businesses are increasing their number and dollar share of Federal
prime contracts over the past 14 fiscal years compared with non-WOSBs. Consistent with our
contract roll-up methodology, we capture the total dollar amount relative to the fiscal year where
we first observe a new contract activity. As a result, the total dollar amounts are skewed toward
the earlier fiscal years for two reasons. First, in all likelihood, there are dollar amounts that we
record in FY2000 that actually pertain to contracts initially executed prior to FY2000. As a
result, we technically overstate the amount of contracts and dollars in FY2000 to the extent these
amounts are associated with contracts entered into prior to FY2000. Second, similar reasoning
leads us to conclude that contracts appearing in the later fiscal years do not benefit from potential
additional funding that might be added post-FY2012.
Table 4-1 summarizes the total contracts and dollar values included in our analysis of
Federal procurement data from FY2000 through the present. Given that many governmental
agencies rely on transaction “actions” as the baseline for assessing procurement, we also include
comparable data for actions to show that while there are differences between results for contracts
versus actions, the general time-series trends are comparable.

14
Table 4-134
General Procurement Trends (Contracts and Dollars) FY2000-FY2013
With respect to procurement activity, WOSBs generally exhibit a positive, upward trend
in both the number of contracts awarded as a percentage of the total contracts awarded, as well as
the total dollar value awarded as a percent of the total dollars awarded. Despite a slight decline
in the proportionate share of contracts and dollars in FY2008, the proportion of WOSB contracts
almost doubled between FY2000 and FY2012, while the proportionate share of contract dollars
increased from 1.3 percent to a peak of 5.3 percent in FY2012. We observe similar trends when
analyzing actions, absent the contract roll-up, although more recent results indicate WOSBs
receive a lower proportion of dollars associated with actions compared to contracts.
Nevertheless, the time-series results for WOSB contract and dollar proportions are highly
correlated.35
Figure 4-1 further segments contract data results by business type.36
The results contrast
the contracts and dollars for WOSBs with those of OtherSBs and all large businesses. We
observe a relatively uniform split between OtherSB contracts and large business contracts
between FY2000 and FY2012, while WOSB contracts represent the smallest fraction. However,
34
The difference in total dollar values between the IIC, Inc. Contract Analysis ($4,471,481 million) and total dollar
values in the IIC, Inc. Actions Analysis ($4,471,436 million) is a function of data gaps that arise when rolling up
actions which might have a data gap that is controlled for in our contract roll-up. For example, on a given IIC ID,
there may be multiple actions. If one of those actions has a data gap, it is still rolled-up to the contract level and its
value is included in the contract. However, for actions, any line item with a data gap is removed from the analysis. 35
Correlation coefficients measure the linear dependence between two sets of data, with a value that ranges between
-1 and +1. Coefficients closer to +1 represent two data series that “move” together. The correlation coefficients
between data series for contracts and actions proportions for contracts/actions and dollars are 0.97 and 0.98,
respectively, indicating the results of our contract viewpoint and actions viewpoint are highly correlated. In
contrast, the correlation coefficient for the total contract dollars and total action dollars data sets is 0.34, which
highlights the impact of the contract roll-up and assignment of action dollars, regardless of fiscal year, into the first
fiscal year associated with a specific contract. 36
Recall we use the term “business type” to refer to the combination of gender ownership and size.
WOSB
Contracts
Total
Contracts
WOSB
Contract
%
WOSB
Dollars
($m)
Total
Dollars
($m)
WOSB
Dollars %
WOSB
Actions
Total
Actions
WOSB
Action %
WOSB
Dollars
($m)
Total
Dollars ($m)
WOSB
Dollars %
Year (a) (b) (c) =(a)/(b) (d) (e) (f) = (d)/(e) (g) (h) (i) = (g)/(h) (j) (k) (l) = (j)/(k)
2000 24,112 388,152 6.2% $ 7,521 $ 566,301 1.3% 31,680 518,911 6.1% 4,131$ 179,908$ 2.3%
2001 25,167 388,403 6.5% $ 5,680 $ 245,948 2.3% 36,747 567,172 6.5% 5,014$ 200,466$ 2.5%
2002 35,988 494,575 7.3% $ 7,091 $ 305,609 2.3% 52,292 730,576 7.2% 6,354$ 236,435$ 2.7%
2003 57,292 705,026 8.1% $ 8,296 $ 288,928 2.9% 79,589 1,000,388 8.0% 7,898$ 276,549$ 2.9%
2004 140,735 1,286,431 10.9% $ 9,238 $ 331,367 2.8% 172,703 1,687,077 10.2% 8,156$ 290,267$ 2.8%
2005 194,779 1,930,971 10.1% $ 10,987 $ 338,478 3.2% 243,933 2,518,787 9.7% 9,925$ 320,468$ 3.1%
2006 268,095 2,700,106 9.9% $ 12,487 $ 389,706 3.2% 328,499 3,334,485 9.9% 11,365$ 351,514$ 3.2%
2007 269,672 2,859,971 9.4% $ 13,768 $ 349,935 3.9% 343,711 3,600,301 9.5% 12,785$ 385,628$ 3.3%
2008 285,126 3,131,893 9.1% $ 15,393 $ 413,798 3.7% 365,938 3,942,332 9.3% 14,419$ 449,148$ 3.2%
2009 209,180 2,014,588 10.4% $ 15,301 $ 381,806 4.0% 302,556 2,896,843 10.4% 15,798$ 442,956$ 3.6%
2010 203,493 1,929,152 10.5% $ 16,150 $ 326,431 4.9% 308,828 2,890,873 10.7% 17,101$ 433,002$ 3.9%
2011 188,411 1,729,578 10.9% $ 14,054 $ 287,049 4.9% 301,701 2,762,220 10.9% 16,684$ 423,481$ 3.9%
2012 182,791 1,593,121 11.5% $ 11,509 $ 217,780 5.3% 293,668 2,586,298 11.4% 16,160$ 403,629$ 4.0%
2013 24,534 251,642 9.7% $ 1,244 $ 28,345 4.4% 54,614 498,956 10.9% 2,684$ 77,985$ 3.4%
Total 2,109,375 21,403,609 9.9% $148,719 $4,471,481 3.3% 2,916,459 29,535,219 9.9% 148,475$ 4,471,436$ 3.3%
IIC, Inc. Contract Analysis IIC, Inc. Actions Analysis

15
we note that large businesses account for the vast majority of contract dollars; the right panel of
Figure 4-1 captures the fact that large businesses receive a disproportionately large share of
contract dollars.
Figure 4-1
Summary of Contracts and Awards by Business Type
Figure 4-1 also illustrates increasing WOSB representation in terms of contracts and
awards among small businesses within the general pool of total contracts and awards.
Specifically, WOSBs have steadily increased the number and dollar amount of awards as a
proportion of total small business contracts and dollars awarded from FY2000 to the present.
Table 4-2 provides these data for the subset of small businesses securing Federal prime contracts
between FY2000 and the present.
Table 4-2
Small Business Procurement Metrics
-
500,000
1,000,000
1,500,000
2,000,000
2,500,000
3,000,000
3,500,000
Co
ntr
act
s
WOSB OtherSB Non-SB
$-
$100,000
$200,000
$300,000
$400,000
$500,000
$600,000
Do
lla
rs (
$ m
illi
on
s)
WOSB OtherSB Non-SB
WOSB
Contracts
Total SB
Contracts
WOSB
Contract %
WOSB
Dollars ($m)
Total SB
Dollars ($m)
WOSB
Dollars %
Year (a) (b) (c) =(a)/(b) (d) (e) (f) = (d)/(e)
2000 24,112 185,291 13.0% $ 7,521 $ 58,758 12.8%
2001 25,167 188,111 13.4% $ 5,680 $ 46,287 12.3%
2002 35,988 247,946 14.5% $ 7,091 $ 55,309 12.8%
2003 57,292 376,401 15.2% $ 8,296 $ 59,883 13.9%
2004 140,735 785,447 17.9% $ 9,238 $ 67,438 13.7%
2005 194,779 1,072,111 18.2% $ 10,987 $ 79,449 13.8%
2006 268,095 1,598,282 16.8% $ 12,487 $ 80,464 15.5%
2007 269,672 1,500,261 18.0% $ 13,768 $ 82,038 16.8%
2008 285,126 1,590,284 17.9% $ 15,393 $ 90,539 17.0%
2009 209,180 1,026,223 20.4% $ 15,301 $ 89,877 17.0%
2010 203,493 998,840 20.4% $ 16,150 $ 90,424 17.9%
2011 188,411 917,931 20.5% $ 14,054 $ 76,610 18.3%
2012 182,791 860,553 21.2% $ 11,509 $ 65,827 17.5%
2013 24,534 119,799 20.5% $ 1,244 $ 7,546 16.5%
Total 2,109,375 11,467,480 18.4% $ 148,719 $ 950,450 15.6%

16
Cross-comparison of Tables 4-1 and 4-2 illustrates that WOSBs are increasing the share
of contracts and dollars through a redistribution of contracts and awards compared to other
businesses (with the exception of FY2012 and FY2013 partial data). This is an intuitive result,
given the potential for significant barriers facing WOSBs that seek to compete for contracts
typically won by large (and mostly male-owned) businesses. Nevertheless, the results indicate
that even in the small business procurement pool, WOSBs tend to receive smaller total awards
than their other small businesses counterparts. Table 4-3 presents a summary of average contract
awards by select business types on a time-series basis. The results indicate several general
procurement trends, including a rapidly decreasing average contract value over time, which
reflects the general procurement trend towards an increase in total contract awards, but at smaller
dollar levels. In addition, we note that WOSBs have become more competitive, as we observe a
greater long-term increase in the average WOSB award than the total award (shown in column
(e) of Table 4-3).
Table 4-3
Average Procurement Award (per Contract) Analysis
Despite an increase in the average WOSB contract award amount compared to the total
pool, we observe the potential for an increasing “gender gap” within the small business pool, as
shown in column (h) of Table 4-3. Specifically, the ratio of the average WOSB contract award
to the average other small business contract award has declined in recent years. As a result,
WOSBs are not only receiving lower average awards than their other small business
counterparts, but the spread between WOSB and other small business awards widened between
FY2011 and FY2012, falling from the recent peak of 0.94 in FY2008. Several explanations exist
for why WOSBs receive a lower average award than other small businesses. Most notably,
WOSB
Average
Award
Total
Average
Award
Total Average
Award
(excluding
WOSBs)
OtherSB
Average
Award
WOSB %
Total
WOSB %
Non-
WOSB
OtherSB
% Total
WOSB Avg
Award/OtherSB
Avg Award
Year (a) (b) (c) (d) (e) = (a)/(b) (f) = (a)/(c) (g) = (d)/(b) (h) = (a)/(d)
2000 311,907$ 1,458,966$ 1,534,941$ 317,889$ 21.4% 20.3% 21.8% 0.98
2001 225,705$ 633,230$ 661,466$ 249,204$ 35.6% 34.1% 39.4% 0.91
2002 197,040$ 617,922$ 650,951$ 227,490$ 31.9% 30.3% 36.8% 0.87
2003 144,808$ 409,812$ 433,252$ 161,659$ 35.3% 33.4% 39.4% 0.90
2004 65,639$ 257,586$ 281,165$ 90,274$ 25.5% 23.3% 35.0% 0.73
2005 56,406$ 175,289$ 188,626$ 78,034$ 32.2% 29.9% 44.5% 0.72
2006 46,578$ 144,330$ 155,106$ 51,103$ 32.3% 30.0% 35.4% 0.91
2007 51,053$ 122,356$ 129,779$ 55,478$ 41.7% 39.3% 45.3% 0.92
2008 53,986$ 132,124$ 139,950$ 57,576$ 40.9% 38.6% 43.6% 0.94
2009 73,149$ 189,521$ 203,004$ 91,275$ 38.6% 36.0% 48.2% 0.80
2010 79,366$ 169,209$ 179,804$ 93,385$ 46.9% 44.1% 55.2% 0.85
2011 74,591$ 165,965$ 177,136$ 85,749$ 44.9% 42.1% 51.7% 0.87
2012 62,964$ 136,700$ 146,257$ 80,143$ 46.1% 43.1% 58.6% 0.79
2013 50,698$ 112,641$ 119,332$ 66,158$ 45.0% 42.5% 58.7% 0.77

17
results from the recent Census Bureau 2007 Survey of Business Owners (SBO) indicate that
men-owned businesses typically have 50 percent more employees than women-owned
businesses.37
In addition, men-owned small businesses, on average, have annual receipts twice
as great as those of comparable WOSBs.38
Given these size disparities, it is reasonable to expect
a difference in average awards between men-owned small businesses and WOSBs. As a result, it
may be that WOSBs’ smaller size relative to other small businesses explains their lower awards
in Federal procurement. Of course, the causality is debatable, given that the failure to obtain
higher Federal procurement awards might also contribute to the difference in size and receipts
for WOSBs versus other small businesses, notably men-owned small businesses.
Analysis of average awards provides general information, but does not shed light on the
potential distribution of awards by business type. In fact, Figure 4-2 illustrates varying trends in
analyzing the ratio of WOSB awards to other small business awards over time for different
statistical measures. Specifically, analysis of OtherSBs procurement indicates the presence of
several large awards, which skew the average contract award. In contrast, the inferred gender
gap narrows when comparing median, lower quartile and upper quartile contract award amounts
for WOSBs compared to OtherSBs over time.39
More comprehensive analysis of procurement
statistics indicate that OtherSB contract awards are subject to a higher level of volatility than
those of WOSBs, indicating differences in the distribution of awards over time.40
37
2007 Survey of Business Owners, U.S. Census bureau, data related to gender differences obtained from
http://factfinder2.census.gov/faces/nav/jsf/pages/searchresults.xhtml?refresh=t. Data indicate that the average
number of employees for men-owned businesses was 12.71 compared with 8.27 for women-owned businesses. 38
Ibid. Data indicate that the average receipts for men-owned businesses with less than 500 employees were $1.94
million, compared to only $0.89 million for women-owned businesses with less than 500 employees. 39
The lower quartile represents the dollar value at which 25 percent of contract dollar amounts are below this level.
Conversely, the upper quartile represents the dollar value at which 25 percent of the contract dollar amounts are
above this level. 40
We measured volatility using the standard deviation of contract awards over time for WOSBs compared to
OtherSBs, as well as looking at the coefficient of variation.

18
Figure 4-2
Ratio of WOSB Contract Statistics to OtherSB Contract Statistics
Analysis of WOSB Federal procurement trends at an aggregate level (i.e., without
consideration of agency, industry or use of procurement tools such as set-asides) provides some
general conclusions. We summarize our conclusions, with emphasis added for our most
noteworthy conclusions and observations, as follows:
WOSBs have typically increased the proportionate share of contracts awarded and
dollars awarded year over year from FY2000 through FY2012.
FY2013 results are preliminary and represent only a fraction of what we expect will be
the total Federal procurement opportunities in FY2013. Nevertheless, we observe a drop-
off in the share of contracts won and dollars awarded in FY2013 compared to FY2012.41
Large businesses capture a disproportionate share of total awards compared to the
number of businesses and their contracts.
o Generally, OtherSBs and large businesses capture equal proportions of contracts,
with WOSBs securing fewer contracts overall.
WOSBs have increased their number of contracts and total awards within the small
business community since FY2000, largely due to a redistribution of contracts and
awards involving non-WOSBs.
Despite WOSB progress, average WOSB awards remain lower than those of OtherSBs.
There is a potentially increasing gender gap in terms of average awards among WOSBs
and OtherSBs, although we believe differences in gender-based business characteristics
41
As stated previously, Department of Defense (DoD) procurement data are subject to a 90-day lag in public
reporting for national security reasons. Our FY2013 results only incorporate DoD data uploaded to FPDS-NG
through early December, which lessens the reliability of assessing FY2013 results, given we are still “missing” a
significant number of contracts and awards.
0.00
0.20
0.40
0.60
0.80
1.00
1.20
1.40
1.60
2000 2001 2002 2003 2004 2005 2006 2007 2008 2009 2010 2011 2012 2013
Average Median Lower Quartile Upper Quartile

19
(e.g., firm size and annual receipts) may influence the award disparities we observe
between WOSBs and OtherSBs.
These observations lay the foundation for assessing the preliminary benefits and impact
of the WOSB FCP. At face value, the general population results do not provide sufficient
information to definitively conclude that the FCP was the driving factor behind the increase in
WOSB Federal procurement activity in FY2012 compared to prior years. In fact, with only two
years of procurement data subject to the WOSB FCP, we do not believe there are sufficient data
to definitively measure or conclude the impact or efficacy of the WOSB FCP. However, the data
do allow us to increase our knowledge of WOSB Federal procurement trends at a more
disaggregated level to begin to analyze the effect of the WOSB FCP.

20
Chapter 5. Industry and Agency Analysis
Industry (NAICS)42
Analysis
IIC, Inc. performed an analysis of all NAICS codes in which WOSBs received prime
Federal contracts during the procurement analysis time period, as well as an analysis of the 83
NAICS code subset of industries in which WOSBs are underrepresented or substantially
underrepresented.43
The key research questions we explore in this section are:
How do the more recent procurement data, segmented by NAICS, compare with periods
prior to the enactment of WOSB FCP legislation?
Do the data indicate any potential gender gaps within WOSB procurement activity in
specific industries?
Given that the WOSB FCP and prior legislation focused on 83 NAICS industries where
WOSBs were either underrepresented or significantly underrepresented, do we observe
changes in WOSB procurement activity within these NAICS as a result of the WOSB
FCP?
To address these industry issues, we analyzed the number of contracts awarded to
WOSBs versus the total number of contracts awarded in each industry (NAICS), as defined by
the NAICS variable included in the FPDS-NG data. We defined WOSB participation share as
the number of WOSB contracts divided by the total number of contracts in each NAICS code.
The WOSB FCP analyzes procurement activity with a two-pronged approach, considering both
the number of contracts awarded, and the value of those awards. As a result, we performed a
time-series analysis comparing the ratio of WOSB contracts to total contracts, as well as a time-
series analysis comparing the ratio of WOSB dollars to total dollars by industry. During the
research period, contracting officers used over 350 NAICS codes to identify the industries in
which a given procurement action occurred. The “Data Book” contains the WOSB participation
share in terms of both contracts and dollars for all industries and we only present below a sample
of analyses pertaining to the largest NAICS in terms of total procurement regarding contract
number and also contract dollars.44
It is important to note that there are industry-specific factors
42
As stated earlier, NAICS stands for North American Industry Classification System. The official 2012 U.S.
NAICS Manual has definitions for each industry as well as background information.
http://www.census.gov/eos/www/naics/ 43
The Kauffman-RAND study determined industry classification (as substantially underrepresented or
underrepresented) using a disparity ratio, calculated by comparing the utility of WOSBs in Federal contracts for a
given NAICS industry code to the availability of contracts within that same given NAICS industry code. If the
resulting ratio of the comparison is less than 0.5, the industry is considered substantially underrepresented. If the
ratio of the comparison is between 0.5 and 0.8, the industry is considered underrepresented. 44
The top-5 NAICS in terms of total contracts awarded may differ from the top-5 NAICS in terms of dollars
awarded.

21
that may affect the fluctuations and distributions in contract awards, which represents a future
area of research in evaluating industry-specific WOSB procurement trends.45
Figure 5-1 presents a time-series analysis of the ratio of WOSB contracts and awards for
the aggregate across the set of 83 identified NAICS codes versus the rest of the industry
classifications. The left hand panel of Figure 5-1 indicates that WOSBs have increased the share
of contracts won within the 83 designated NAICS codes at a higher rate than WOSB shares of
contracts won in NAICS that do not fall within the set of 83 NAICS codes. Specifically, since
the implementation of the WOSB FCP, the share of contracts won increased by 1 percent for
WOSBs in the set of 83 when analyzing FY2010 (pre-implementation) with FY2012 (post-
implementation. In contrast, the net increase was only 0.8 percent for contracts won by WOSBs
in the other, non-designated industries. We observe similar results when analyzing award share,
as shown in the right hand panel of Figure 5-1. In this case, award share increased by 0.5 percent
for WOSB awards in one of the 83 designated NAICS codes, compared to 0.1 percent in the
NAICS codes that were not designated.46
Figure 5-1
Analysis of Procurement Statistics for 83 Designated NAICS versus Non-Designated
NAICS
Figure 5-1 also illustrates that WOSBs have higher contract and award shares, at an
aggregate level, within the 83 designated NAICS codes compared with the non-designated
NAICS codes. Intuitively, one might expect the opposite, that WOSBs should have a lower
share of contracts and awards in 83 designated NAICS prior to the enactment of the WOSB FCP,
compared with the aggregate results for contracts and awards in NAICS codes where WOSBs
were not underrepresented or substantially underrepresented. It is important to remember that
the 83 designated NAICS codes rely on disparity ratios that measure not only level of contracts
45
For the purposes of this report, we have implicitly assumed that industry factors affect small businesses equally,
without respect to gender. Thus, the trends we observe in WOSB procurement are the result of competition against
OtherSBs or large businesses under equivalent industry-specific economic conditions. 46
We note that WOSB award share actually declined in the non-designated NAICS codes between FY2010 and
FY2011 by 0.4 percent, such that the FY2011 to FY2012 difference was 0.4 percent. Nevertheless, the share of
WOSB contracts and award amounts won has been greater in the 83 designated NAICS codes compared with the
non-designated NAICS codes.
0.0%
2.0%
4.0%
6.0%
8.0%
10.0%
12.0%
14.0%
Contract Share
Non-Designated Designated 83
0.0%
1.0%
2.0%
3.0%
4.0%
5.0%
6.0%
7.0%
Award Share
Non-Designated Designated 83

22
and awards won, but also data and assumptions concerning the prevalence of WOSBs within a
particular NAICS code. As a result, there are numerous examples of NAICS where WOSBs are
not underrepresented or substantially underrepresented, yet have very low shares of contracts or
awards won. One example is NAICS 3364 (Aerospace Product and Parts Manufacturing), which
accounted for almost 15 percent of total contract award amounts during the procurement analysis
time period, yet WOSBs received only 0.5 percent of NAICS 3364 contract dollars.
The “Data Book” contains comprehensive data and scorecards for each NAICS
investigated. However, for the purposes of this report, we include information on several
NAICS codes as illustrative examples. For example, Figure 5-2 provides a comprehensive
“scorecard” of procurement trends and activity for NAICS 3322, Cutlery and Tool
Manufacturing. The largest number of contracts awarded to WOSBs during the procurement
analysis time period was in NAICS 3322. Analysis of WOSB procurement activity within
NAICS 3322 yields the following observations:
This NAICS code represents the largest NAICS in terms of total contracts, with nearly
1.3 million contracts from FY2000-present.47
WOSB contract share doubled since FY2000 from 10 percent to 20 percent, and starting
in 2011, the rate of WOSB contract share growth increased, coinciding with the
implementation of the WOSB FCP.
The WOSB awards share is volatile over the research period, but displays an overall
increasing trend, quadrupling since FY2000.48
Within this NAICS code, WOSBs have a proportionately higher share of contract dollars
available than the number of contracts, which is anomalous considering the inverse is true
when examining general procurement trends.49
47
Although NAICS 3322 has the most contracts over the research period, the overall average value of those
contracts is low compared to other industries. 48
Some volatility may be due to the downturn of the economy during 2008 and 2009. 49
Additional analysis indicates that of the approximately 350 NAICS with contract awards between FY2000 and
FY2013, we typically observed that between 70 and 90 each fiscal year had results which indicated that the share of
WOSB contract dollars was higher than the share of WOSB contracts. We observe similar trends within the subset
of 83 designated NAICS, as between 12 and 21 of the 83 NAICS codes had awards shares in excess of the contract
number share.

23
Figure 5-2
NAICS 3322 Procurement Scorecard
NAICS 3322
Year Total Contracts Total Awards
(Millions USD) WOSB Contracts
WOSB Awards
(Millions USD)
WOSB %
Contracts
WOSB %
AwardsTotal Average Award
WOSB Average
Award
2 2000 329 $8.3 122 $5.1 37.1% 62.3% $25,134 $42,210
3 2001 503 $25.2 53 $3.6 10.5% 14.2% $50,129 $67,787
4 2002 791 $33.9 82 $5.7 10.4% 16.8% $42,863 $69,424
5 2003 16,895 $137.2 2,176 $36.2 12.9% 26.4% $8,118 $16,647
6 2004 190,917 $150.6 24,445 $50.2 12.8% 33.4% $789 $2,056
7 2005 170,657 $179.4 25,949 $50.9 15.2% 28.4% $1,051 $1,961
8 2006 135,336 $153.8 19,581 $36.8 14.5% 23.9% $1,136 $1,877
9 2007 137,909 $307.8 22,766 $148.5 16.5% 48.3% $2,232 $6,524
10 2008 136,431 $466.9 23,773 $277.6 17.4% 59.4% $3,423 $11,676
11 2009 131,559 $289.3 22,327 $98.3 17.0% 34.0% $2,199 $4,403
12 2010 133,631 $369.3 22,882 $198.0 17.1% 53.6% $2,763 $8,655
13 2011 131,911 $235.4 20,784 $102.0 15.8% 43.3% $1,785 $4,908
14 2012 97,357 $163.1 14,910 $85.1 15.3% 52.1% $1,676 $5,705
15 2013 969 $24.0 193 $14.4 19.9% 59.8% $24,759 $74,384
Total 1,285,195 $2,544.2 200,043 $1,112.4 15.6% 43.7% $1,980 $5,561
Year Total Contracts with
Set-Asides
Total Awards with
Set-Asides (Millions
USD)
WOSB Contracts
with Set-Asides
WOSB Awards
with Set-Asides
(Millions USD)
WOSB % Set-
Aside
Contracts
WOSB % Set-
Aside Awards
Total Average Award
per Set-Aside
WOSB Average
Award per Set-Aside
2 2000 1 $0.0 - $0.0 0.0% 0.0% $32,000
3 2001 48 $3.5 4 $0.2 8.3% 4.8% $73,330 $42,320 0.6
4 2002 69 $2.6 11 $0.2 15.9% 8.9% $38,322 $21,479 0.6
5 2003 473 $25.6 39 $1.1 8.2% 4.1% $54,130 $27,148 0.5
6 2004 164 $7.4 21 $1.1 12.8% 14.2% $45,418 $50,271 1.1
7 2005 237 $12.9 43 $3.4 18.1% 26.2% $54,432 $78,672 1.4
8 2006 252 $10.0 46 $0.6 18.3% 5.7% $39,795 $12,440 0.3
9 2007 274 $9.1 53 $3.4 19.3% 37.6% $33,116 $64,437 1.9
10 2008 264 $6.7 42 $0.7 15.9% 10.6% $25,354 $16,894 0.7
11 2009 409 $10.8 86 $1.3 21.0% 11.7% $26,328 $14,692 0.6
12 2010 1,286 $14.2 155 $2.1 12.1% 14.8% $11,066 $13,543 1.2
13 2011 1,329 $18.1 152 $3.1 11.4% 17.4% $13,598 $20,680 1.5
14 2012 1,019 $14.6 123 $2.2 12.1% 15.3% $14,301 $18,183 1.3
15 2013 105 $1.3 9 $0.2 8.6% 15.6% $11,996 $21,803 1.8
Total 5,930 $136.8 784 $19.5 13.2% 14.3% $23,077 $31,888
Year EDWOSB Contracts
EDWOSB Awards
EDWOSB
Average Award
EDWOSB %
Total Set-Asides WOSB
Contracts
WOSB Awards WOSB Average Award WOSB % Total Set-
Asides
2 2011 1 47,374 47,374$ 0.075%
3 2012 1 6,283 6,283$ 0.098%
4 2013 - - 0.000%
Total - $0 0.000% 2 53,657 26,829$ 0.034%
0.0%
10.0%
20.0%
30.0%
40.0%
50.0%
60.0%
70.0%
WOSB Contract and Awards Share
WOSB Contracts Share WOSB Awards Share
$0
$10,000
$20,000
$30,000
$40,000
$50,000
$60,000
$70,000
$80,000
Overall and WOSB Average Awards
Total Average Award WOSB Average Award
0.0%
5.0%
10.0%
15.0%
20.0%
25.0%
30.0%
35.0%
40.0%
WOSB Share of Set-Aside Contracts and Awards
WOSB Share Set-Aside Contracts WOSB Share Set-Aside Awards
0
0.5
1
1.5
2
2.5
WOSB/Overall Set-Aside Awards Ratio
WOSB/Overall Set-Aside Awards Ratio

24
Figure 5-3 illustrates the time-series analysis for NAICS 3391, Medical Equipment and Supplies
Manufacturing, which contained the largest number of individual contracts in the sub-dataset
focusing on the 83 industries specifically identified by the WOSB FCP where WOSBs are
underrepresented or substantially underrepresented.
Figure 5-3
WOSB Share of Contracts and Dollars
NAICS 3391
Observations from Figure 5-3 include:
Our share analysis indicates WOSBs generally gained share against non-WOSBs from
FY2000 through FY2007, but declined sharply through FY2010.50
The share of WOSB contracts is increasing again, but in FY2012, WOSBs remained
underrepresented within the industry, earning only 6.4 percent of contracts and only 2.8
percent of awards, failing the WOSB FCP 5 percent threshold for awards.
Within NAICS 3391, WOSBs earn lower average awards per contract than other
businesses contracting within the industry, as the WOSB contract share remains greater
than the WOSB award share.51
We also analyzed several additional NAICS which were a subset of the 83 designated
industries where WOSBs were underrepresented or substantially underrepresented.52
The three
largest NAICS codes (in terms of total contracts awarded) are 3391 (discussed above), 5413, and
5415. Figure 5-4 depicts the time-series share analysis for WOSBs engaging in Federal
50
Some volatility may be due to the downturn of the economy during 2008 and 2009. 51
For example, in FY2012 the average contract value for the industry was $29,664 and the average contract value
for WOSBs for the industry was $12,769, approximately 57 percent less than the industry average. 52
Again, we refer our readers to our companion “Data Book” which contains data on every NAICS code.
0.0%
1.0%
2.0%
3.0%
4.0%
5.0%
6.0%
7.0%
8.0%
WOSB % Contracts WOSB % Awards

25
procurement within NAICS 5413 (Architectural, Engineering and Related Services) and 5415
(Computer Systems Design and Related Services).53
Figure 5-4
WOSB Share of Contracts and Dollars for NAICS 5413 and NAICS 5415
We observe positive share increases for both contracts won and the dollar amount
received by WOSBs over time. Furthermore, we observe a significant increase in the share of
contracts won by WOSBs since the implementation of the WOSB FCP. As we discuss in
Chapter 7, WOSBs within each industry benefitted from the use of the women-owned set-aside
provisions of the WOSB FCP. However, we note that despite the increase in share of contracts,
we did not observe a corresponding increase in share of dollars awarded. This is despite over
$1.3 million in contract dollars awarded to date for NAICS 5413 and over $6.5 million awarded
in NAICS 5415 specifically using the WOSB FCP set-aside programs. We discuss additional
analytical insight into the use of these set-asides in Chapter 7.54
Agency Analysis
A key component of the WOSB FCP is the goal that agencies award at least 5 percent of
their prime Federal contracts and dollars to women-owned small business. As such, it is
necessary to determine which agencies are succeeding, which are failing, and which agencies
demonstrate increased WOSB shares in contracts and amounts awarded. Table 5-1 shows share
of contracts awarded to WOSBs for the top five agencies in terms of total contracts awarded
between FY2000 and FY2013.
53
Both of these NAICS are identified as industry codes where WOSBs are significantly underrepresented. 54
We also note that despite the growing disparity in WOSB contract and awards share, NAICS 5415 currently meets
the 5 percent FCP threshold in terms of both parameters, indicating program “success.” In fact, NAICS 5415 has
exceeded the threshold since 2004, but is still considered an industry in which WOSBs are underrepresented when
compared to non-WOSBs.
0.0%
2.0%
4.0%
6.0%
8.0%
10.0%
12.0%
WOSB % Contracts WOSB % Awards
0.0%
5.0%
10.0%
15.0%
20.0%
25.0%
WOSB % Contracts WOSB % Awards
5413 5415

26
Table 5-1
WOSB Contract Share for the Top Five Agencies
Observations from Table 5-1 include:
There is a general increasing trend for the top five agencies in terms of total contracts
awarded.
All top five agencies consistently met and exceeded the 5 percent FCP threshold during
the research period.
With the exception of the Department of Defense, each agency increased the number of
contracts awarded to WOSB from the period immediately prior to implementation of the
WOSB FCP (i.e., FY2010) compared to post-implementation (i.e., FY2012).
These agencies represent approximately 88 percent of total WOSB contracts.
The Department of Defense was the largest agency in contracts and dollars awarded
during the procurement analysis time period. Figure 5-5 presents the agency scorecard for the
Department of Defense, including statistics for WOSB procurement. Figure 5-5 includes
information on the use of set-asides, although we discuss the issue of set-asides in additional
detail in Chapter 7.
Year
Department of the
Interior
Department of
Justice
Department of
Veterans Affairs
General Services
Administration
Department of
Defense
2000 7.3% 6.4% 6.5% 7.4% 5.6%
2001 7.8% 7.3% 6.2% 7.5% 5.9%
2002 9.3% 7.9% 5.9% 6.5% 7.3%
2003 10.3% 11.3% 6.0% 9.0% 7.6%
2004 9.9% 12.2% 5.9% 13.6% 8.3%
2005 9.7% 8.1% 7.9% 14.1% 8.2%
2006 10.2% 8.6% 8.5% 14.6% 8.4%
2007 9.8% 8.5% 6.7% 14.6% 9.0%
2008 10.2% 8.5% 6.3% 13.6% 9.2%
2009 11.1% 8.9% 5.7% 11.9% 9.9%
2010 11.4% 9.2% 5.6% 12.6% 9.8%
2011 13.0% 9.1% 6.3% 14.3% 9.6%
2012 15.2% 10.1% 7.8% 15.4% 9.7%
2013 13.5% 8.6% 7.1% 14.1% 8.7%
Total WOSB
Contracts 50,261 68,950 292,423 700,559 736,333
Total Contracts 463,976 772,589 4,232,764 5,209,654 8,363,674

27
Figure 5-5
Agency 9700: Department of Defense Procurement Scorecard
Agency 9700
Year Total Contracts Total Awards
(Millions USD) WOSB Contracts
WOSB Awards
(Millions USD)
WOSB %
Contracts
WOSB %
Awards
Total Average
Award
WOSB Average
Award
2 2000 219,073 $304,849.6 12,228 $3,986.6 5.6% 1.3% $1,391,544 $326,025
3 2001 211,207 $160,092.2 12,357 $2,774.6 5.9% 1.7% $757,987 $224,536
4 2002 303,311 $234,324.3 22,224 $4,115.4 7.3% 1.8% $772,555 $185,178
5 2003 382,039 $202,550.4 28,940 $4,557.8 7.6% 2.3% $530,182 $157,492
6 2004 454,660 $226,268.9 37,802 $4,609.7 8.3% 2.0% $497,666 $121,944
7 2005 944,358 $226,555.4 77,444 $6,187.5 8.2% 2.7% $239,904 $79,897
8 2006 877,657 $253,575.9 73,645 $7,212.0 8.4% 2.8% $288,924 $97,929
9 2007 852,403 $243,413.8 76,761 $7,717.1 9.0% 3.2% $285,562 $100,534
10 2008 918,007 $291,816.9 84,692 $9,203.3 9.2% 3.2% $317,881 $108,668
11 2009 813,325 $271,856.4 80,173 $9,056.6 9.9% 3.3% $334,253 $112,963
12 2010 802,353 $219,413.1 78,628 $9,256.8 9.8% 4.2% $273,462 $117,729
13 2011 742,974 $203,132.0 71,090 $8,305.6 9.6% 4.1% $273,404 $116,832
14 2012 741,557 $151,157.4 71,573 $6,852.1 9.7% 4.5% $203,838 $95,736
15 2013 100,750 $14,607.4 8,776 $455.9 8.7% 3.1% $144,987 $51,950
Total 8,363,674 $3,003,613.7 736,333 $84,291.1 8.8% 2.8% $359,126 $114,474
Year Total Contracts
with Set-Asides
Total Awards with
Set-Asides (Millions
USD)
WOSB Contracts
with Set-Asides
WOSB Awards with
Set-Asides (Millions
USD)
WOSB % Set-
Aside
Contracts
WOSB % Set-
Aside Awards
Total Average
Award per Set-
Aside
WOSB Average
Award per Set-
Aside
2 2000 26,894 $11,772.8 4,009 $1,650.3 14.9% 14.0% $437,747 $411,652 1
3 2001 38,113 $10,296.0 6,108 $1,427.3 16.0% 13.9% $270,145 $233,675 1
4 2002 59,236 $13,706.0 10,168 $1,957.0 17.2% 14.3% $231,379 $192,466 1
5 2003 78,766 $16,595.5 12,530 $2,262.2 15.9% 13.6% $210,694 $180,543 1
6 2004 79,724 $15,437.7 13,340 $1,948.4 16.7% 12.6% $193,640 $146,060 1
7 2005 193,838 $21,881.6 32,829 $3,103.1 16.9% 14.2% $112,886 $94,524 1
8 2006 168,063 $21,902.6 28,983 $3,685.7 17.2% 16.8% $130,324 $127,169 1
9 2007 120,826 $22,207.9 23,277 $3,922.4 19.3% 17.7% $183,801 $168,510 1
10 2008 121,604 $28,377.5 25,580 $5,197.3 21.0% 18.3% $233,360 $203,179 1
11 2009 149,775 $32,862.3 32,003 $6,060.6 21.4% 18.4% $219,411 $189,375 1
12 2010 150,148 $33,188.4 33,675 $6,215.4 22.4% 18.7% $221,038 $184,571 1
13 2011 142,329 $29,006.6 32,323 $5,580.2 22.7% 19.2% $203,800 $172,638 1
14 2012 142,734 $26,024.3 32,027 $4,678.8 22.4% 18.0% $182,327 $146,088 1
15 2013 16,102 $1,832.6 3,359 $289.8 20.9% 15.8% $113,814 $86,266 1
Total 1,488,152 $285,091.8 290,211 $47,978.5 19.5% 16.8% $191,574 $165,323 0
Year EDWOSB
Contracts EDWOSB Awards
EDWOSB Average
Award
EDWOSB % Total
Set-AsidesWOSB
ContractsWOSB Awards
WOSB Average
Award
WOSB % Total
Set-Asides
2 2011 20 $3,319,294 165,965$ 0.014% 78 9,534,516 $122,237 0.055%
3 2012 147 $31,491,210 214,226$ 0.103% 165 19,576,772 $118,647 0.116%
4 2013 3 $341,715 113,905$ 0.019% 16 985,065 $61,567 0.099%
Total 170 $35,152,219 206,778$ 0.011% 259 30,096,352 $302,451 0.017%
0.0%
2.0%
4.0%
6.0%
8.0%
10.0%
12.0%
WOSB Contract and Awards Share
WOSB Contracts Share WOSB Awards Share
$0
$200,000
$400,000
$600,000
$800,000
$1,000,000
$1,200,000
$1,400,000
$1,600,000
Overall and WOSB Average Awards
Total Average Award WOSB Average Award
0.0%
5.0%
10.0%
15.0%
20.0%
25.0%
WOSB Share of Set-Aside Contracts and Awards
WOSB Share Set-Aside Contracts WOSB Share Set-Aside Awards
0
0.2
0.4
0.6
0.8
1
1.2
WOSB/Overall Set-Aside Awards Ratio
WOSB/Overall Average Set-Aside Awards

28
We refer the reader to our “Data Book” for a comprehensive look at contract award
procurement statistics for each agency we reviewed and analyzed. However, we found that
several agencies were consistently awarding a higher percentage of contracts to WOSBs
compared to the historical average across all agencies. These included the Department of
Housing and Urban Development (20.7 percent over research time period), Equal Employment
Opportunity Commission (20.7 percent), Office of Personnel Management (15.1 percent) and the
Department of Education (14.3 percent).55
Each agency, with the exception of the Equal
Employment Opportunity Commission, had FY2012 results that exceeded the historical average
for the share of contracts awarded to WOSBs.56
Table 5-2 shows the WOSB award share for the top five agencies in terms of total dollars
awarded during the research period. Although the top five agencies in terms of total contracts
met and exceeded the 5 percent FCP goal during the entire research period, in FY2000, none of
the top five agencies in terms of total awards met the WOSB FCP mandate.
Table 5-2
WOSB Award Share for the Top Five Agencies
Analysis of WOSB procurement activity within the top five awarding agencies yields the
following observations:
55
These represent agencies that awarded individually awarded in excess of 2,000 contracts to WOSBs during the
research time period, including over 10,000 awarded by Office of Personnel Management. However, the agency
with the highest percentage of WOSB contract awards was the Merit Systems Protection Board, but this agency only
issued a total of 1,348 contracts since FY2000. 56
The Equal Employment Opportunity Commission had a FY2012 value of 19.7 percent, slightly below the
historical average but still exceeding the 5 percent goal by a significant amount.
Year
General Services
Administration
Department of
Health and Human
Services
National Aeronautics
and Space
Administration
Department of
Energy
Department of
Defense
2000 4.5% 3.9% 3.4% 0.1% 1.3%
2001 4.7% 3.1% 4.6% 0.7% 1.7%
2002 4.2% 3.3% 4.9% 2.0% 1.8%
2003 6.2% 4.4% 2.3% 0.6% 2.3%
2004 3.7% 7.1% 1.2% 6.4% 2.0%
2005 5.2% 5.2% 1.7% 1.7% 2.7%
2006 6.6% 4.5% 1.1% 0.6% 2.8%
2007 5.8% 4.2% 4.4% 1.7% 3.2%
2008 6.4% 5.8% 3.9% 1.0% 3.2%
2009 5.6% 6.4% 2.6% 1.6% 3.3%
2010 6.2% 5.8% 4.6% 5.0% 4.2%
2011 9.9% 6.3% 6.8% 5.0% 4.1%
2012 8.8% 5.4% 5.2% 18.2% 4.5%
2013 8.0% 5.7% 7.5% 17.2% 3.1%
Total WOSB
Awards $7,669 $7,830 $4,488 $2,360 $84,291
Total Awards $137,278 $151,196 $157,509 $328,057 $3,003,614
(Millions USD)

29
Until FY2003, none of the top five awarding agencies reached the WOSB FCP 5 percent
threshold.57
In FY2012, the Department of Energy WOSB awards share increased dramatically, the
direct result of one vendor, classified as a WOSB, receiving almost 10 percent of contract
dollars.58
However, as shown by the total WOSB awards, the long-term average is only
0.7 percent, influenced by a lack of dollars awarded on contracts to WOSBs in FY2000,
FY2001, FY2003, and FY2005 through FY2009.59
Since FY2010, WOSB award share has increased at a greater rate than in previous years,
potentially due to the impact of the WOSB FCP implementation in 2011.
The Department of Defense remains the largest agency in terms of awards, disbursing
approximately ten times more awards than the next largest agency.
Despite the fact that the Department of Defense missed the WOSB FCP 5 percent goal in
FY2012, its WOSB awards share has increased over time.
Similar to our analysis of contracts, we also recognized that several agencies had dollars
awarded to WOSBs that were above the historical average of dollars awarded to WOSBs
compared to the total population across all agencies. For example, the Small Business
Administration awarded 19.2 percent of all dollars to WOSBs during the research time period,
although this amount was only 15.0 percent in FY2012. In addition, the Department of Housing
and Urban Development awarded 14.9 percent of dollars to WOSBs, complementing the strong
performance discussed previously concerning the number of contracts awarded. Finally, the
Department of Commerce also awarded 10.1 percent of all dollars to WOSBs, including 16.0
percent in FY2012.60
In addition to examining the top five agencies in terms of total contracts and awards, it is
important to identify how many, of a total 77 agencies, are meeting the WOSB FCP 5 percent
goals in terms of both dollars and contracts. It is important to note that in some years, small
agencies may not issue any Federal contracts and thus 77 agencies may not be contracting in any
given year. As seen in Figure 5-6, the number of agencies meeting the 5 percent goal has
increased over time to reach a high of 60 in terms of WOSB contract share and 47 in terms of
WOSB award share in FY2012.
57
Contrasts with contracts (Table 5-1) in which the top five contracting agencies have achieved the FCP since
FY2000. 58
In addition, we note that contract awards in the IIC, Inc. contract roll-up declined from almost $3 billion in
FY2011 to $1 billion in FY2012. In FY2011, the largest contract dollar amount associated with a WOSB was $13.6
million, compared to $104.9 million in FY2012. 59
Finally, we note that the Department of Energy is the one agency most heavily influenced by our contract roll-up,
such that over 50 percent of “contract” dollars appear in FY2000. Contract dollar awards for the Department of
Energy fell precipitously from FY2008 through the present. 60
These are the three agencies which had total awards exceeding $1 billion during the research time period and
awarded in excess of 10.0 percent of these dollars to WOSBs.

30
Figure 5-6
Number of Agencies Successful in Meeting the 5 Percent WOSB Share Goal
In contrast a number of agencies are not meeting the WOSB FCP goals, shown in Table
5-3.
Table 5-3
Agencies Failing the WOSB FCP Goals, FY2012
0
10
20
30
40
50
60
70
Contracts Awards
Agency
WOSB Contracts
Share
9000: SELECTIVE SERVICE SYSTEM 2.7%
2700: FEDERAL COMMUNICATIONS COMMISSION 4.0%
Agency
WOSB Awards
Share
0300: LIBRARY OF CONGRESS 0.0%
3352: JOHN F. KENNEDY CENTER FOR THE PERFORMING ARTS 0.2%
1145: PEACE CORPS 0.5%
2700: FEDERAL COMMUNICATIONS COMMISSION 1.1%
9000: SELECTIVE SERVICE SYSTEM 1.2%
9507: COMMODITY FUTURES TRADING COMMISSION 1.3%
9577: CORPORATION FOR NATIONAL AND COMMUNITY SERIVCE 1.3%
6300: NATIONAL LABOR RELATIONS BOARD 2.2%
8961: FEDERAL ENERGY REGULATORY COMMISSION 2.3%
0500: GENERAL ACCOUNTING OFFICE 2.5%
3600: DEPARTMENT OF VETERANS AFFAIRS 2.9%
9506: FEDERAL ELECTION COMMISSION 3.3%
9508: NATIONAL TRANSPORTATION SAFETY BOARD 3.7%
6100: CONSUMER PRODUCT SAFETY COMMISSION 4.4%
9700: DEPARTMENT OF DEFENSE 4.5%

31
Analysis of WOSB procurement trends at the NAICS (industry) and agency level yields several
general conclusions. We summarize our conclusions, with emphasis added for our most
noteworthy conclusions and observations, as follows:
The contract award gender gap appears to be closing in select industries, most notably
in NAICS 3359 (Other Electrical Equipment and Component Manufacturing), NAICS
5416 (Management, Scientific and Technical Consulting Services), and NAICS 6214
(Outpatient Care Centers). Each of these NAICS codes represent an industry in which
WOSBs are substantially underrepresented.61
The number of industries in which WOSB awards share is greater than WOSB
contract share remains low, indicating that on average, WOSBs are earning less
money per contract than non-WOSBs in the majority of industries.
Within the 83 underrepresented NAICS, WOSBs are on average meeting the contract
threshold, but remain underrepresented in terms of awards share.
The top five agencies in terms of total contracts awarded have all met the WOSB FCP 5
percent goal in terms of contracts since FY2000.
Four of the top five agencies in terms of total awards met the WOSB FCP 5 percent
threshold in FY2012, the exception was the Department of Defense, which missed the
goal with a 4.5 percent WOSB awards share in FY2012.
Since FY2010, the WOSB award share has increased at a greater rate than in previous
years among the top five awarding agencies.
In FY2012, 60 of 62 agencies issuing prime Federal contracts met the WOSB contract
share goal; 47 of 62 agencies met the WOSB awards share goal.
The number of agencies meeting the WOSB FCP goal has increased over time in terms of
both awards and contracts and reached a peak in FY2012.
61
This represents a sample of NAICS where we observe a decrease in the gap between average awards of WOSBs
and non-WOSBs. We refer the reader to our “Data Book” for analyses on each NAICS.

32
Chapter 6. Vendor-level WOSB Procurement Analysis
In the preceding section, we provide procurement results across several different business
types, including women-owned small businesses.62
One of the key variables underlying each
contract record is the specific vendor that receives the contract award and the associated funding
amount. As part of IIC, Inc.’s contract roll-up process, we relied on the contracting officer size
determination to establish those vendors which qualified as a small business on a particular
contract. Given the subjectivity in determining size classifications and the impact on our
definition of women-owned small businesses, we were interested in whether we could develop
insight into WOSB procurement activity at the vendor level.63
We sought to evaluate the
following research objectives from a vendor level:
Does the split between WOSB vendors and non-WOSB vendors participating in Federal
procurement correlate with the ratio of contracts and dollars observed at the aggregate
level?
How concentrated is procurement for WOSBs among vendors? Do select vendors
continue to win contracts year after year?
Do we observe any correlation between the activity-level of WOSB vendors, as defined
by number of years with distinct procurement contract awards, and the level of contracts
and dollars?
Do we observe an increase in WOSB vendor participation given recent legislative and
industry efforts designed to encourage WOSB participation in Federal procurement?
The underlying IIC, Inc. Federal procurement contract database included 493,124 vendors, as
identified by the DUNS variable, engaged in Federal procurement from FY2000 through the
present. We note that Federal procurement for large businesses was highly concentrated, given
that the top ten overall vendors accounted for 8.98 percent of total dollars awarded from FY2000
forward, while the top 25 vendors represented 16.01 percent of total dollars awarded and the top
100 vendors were responsible for 32.38 percent of contract dollars awarded.
As part of our contract roll-up, we elected to use the earliest observed contract action to
define our business type (e.g., WOSB, OtherSB, WOLB, etc.). Table 6-1 provides a high-level
summary of the vendors receiving a contract award during our procurement analysis time period.
We observed 493,124 different DUNS numbers, representing vendors which won at least one
62
Recall, we use the term “business type” to refer to the type of business by gender and size classification. Thus a
WOSB is a “business type” identified by gender (women-owned) and size (small). 63
The subjectivity involves contracting officers potentially using different size standards to classify a particular
vendor or business as small or large. In some cases, contracting officers within one agency could evaluate a vendor
using size standards specific to a particular industry, which might differ from a separate contracting officer’s size
standard criteria for the same vendor in the same fiscal year. As a result, at the vendor-level, the procurement data
could include a vendor which was classified as both a small and large business (on separate contracts) within the
same fiscal year. We accepted the size definitions included the FPDS-NG data “as-is” and did not make any
adjustments to standardize size classifications for particular vendors.

33
award at some point since FY2000. As the table shows, vendors awarded a contract or contracts
solely as a WOSB represented approximately 11 percent of the total vendor count. In contrast,
OtherSBs (i.e., non-women-owned small businesses) represented approximately 53 percent of
the total vendor observations.
Table 6-1
Vendor (DUNS) Analysis by Business Type
Certain vendors won contracts under different business type classifications during the
procurement analysis time period. For example, there are instances where a vendor won a
contract as a WOSB in one year, but won a contract as a WOLB in another year (e.g., Row 3 in
Table 6-1). There are three principal reasons for a change in business type classification:
Contracting officers applied different size standards based on agency or NAICS during
the procurement analysis time period, such that a vendor could be classified as “small”
for the purposes of one contract award, but as “large” for the purposes of another
contract award, even in the same fiscal year (e.g., Rows 3 and 6 from Table 6-1);
The vendor changed ownership, such that a business that was previously a WOSB might
no longer be majority owned by a woman or women in subsequent fiscal years (e.g.,
becomes a “OtherSB”), or vice versa (e.g., Row 7 from Table 6-1); and
The particular vendor was erroneously classified on a specific contract within FPDS-NG.
Our review of the data indicates that approximately 81,775 vendors won at least one contract
when classified as a WOSB. These include the vendors who were entirely classified as WOSBs
throughout the time period (Row 1 of Table 6-1), as well as vendors who had at least one
contract awarded as a WOSB, but won other contracts under a different business type (from
Rows 3 and 7 of Table 6-1).
Initial analysis indicates that WOSBs are not awarded contracts and funding levels
commensurate with the number of WOSBs vendors as a percentage of the total number of
vendors receiving awards within Federal procurement. For example, WOSBs received only 3.3
percent of contract dollars over the procurement analysis time period, despite 16.6 percent of all
vendors winning at least one award when classified as a WOSB. There are several potential
Row Vendors Awarded Contracts between FY2000 and FY2013: Count Percent of Total
1 Contracts awarded as a WOSB for every contract award 53,470 10.84%
2 Contracts awarded as a WOLB for every contract award 2,470 0.50%
3 Contracts awarded as a WOSB on some occasions and a WOLB on others 5,555 1.13%
4 Contracts awarded as an OtherSB for every contract award 263,462 53.43%
5 Contracts awarded as an OtherLB for every contract award 62,635 12.70%
6 Contracts awarded as an OtherSB on some occasions and an OtherLB on others 81,376 16.50%
7 Contracts awarded as "women-owned" on some contracts, and "non-women-owned" on others 24,156 4.90%
8 Total 493,124 100.00%
9 Vendors winning at least one contract when classified as a WOSB 81,775 16.58%

34
reasons for this disparity, most notably that OtherLBs are almost equally represented as WOSBs
in the data set. As discussed in Chapter 4, the distribution of awards is weighted to larger
contracts, such that the average contract award for large businesses is significantly higher than
for small businesses. Another potential reason for the disparity might be that WOSBs have only
been more active in winning awards in recent time periods. We analyzed the trends in WOSB
vendors winning awards compared to OtherSBs during the procurement analysis time period.
Table 6-2 shows vendor participation for small business procurement during the procurement
analysis time period.64
Table 6-2
Small Business Vendors Receiving a Contract Award Each Fiscal Year
The data indicate that WOSB vendor participation has risen over time compared to other
small business vendor participation in Federal procurement. These results are also consistent
with trends analyzed in Chapter 4 regarding the rise in WOSB share of total small business
contracts and dollars achieved compared to OtherSBs share between FY2000 and the present.
Comparison of Tables 4-2 and 6-2 highlights a trend that the number of WOSBs as a percent of
total small business vendors is less than comparable contract share data, indicating that WOSBs
have been receiving more contracts per vendor than OtherSBs since FY2004, although the same
cannot be said for contract dollars. For example, Table 4-2 in Chapter 4 indicates that WOSBs
received 21.2 percent of all small business contracts awarded in FY2012. Comparison to Table
6-2 shows that WOSB represented only 19.2 percent of all vendors winning an award as a small
64
These data represent the number of separate DUNS numbers associated with small business contracts in each
fiscal year. A single vendor may have won a contract in multiple fiscal years and are included in each year a
contract was awarded.
Year
WOSB
vendors
OtherSB
vendors
Total SB
vendors
WOSB vendors %
Total SB vendors
(a) (b) (c) (d) = (b) + (c) (e) = (b) / (d)
2000 6,398 38,288 44,686 14.3%
2001 6,468 37,835 44,303 14.6%
2002 8,721 46,047 54,768 15.9%
2003 10,610 57,361 67,971 15.6%
2004 15,160 77,665 92,825 16.3%
2005 18,837 95,975 114,812 16.4%
2006 19,932 103,829 123,761 16.1%
2007 19,889 102,542 122,431 16.2%
2008 21,412 103,300 124,712 17.2%
2009 20,496 93,383 113,879 18.0%
2010 20,705 91,207 111,912 18.5%
2011 20,349 84,123 104,472 19.5%
2012 17,692 74,590 92,282 19.2%
2013 6,427 26,201 32,628 19.7%

35
business in FY2012. In contrast, Table 4-2 indicates that WOSBs only won 17.5 percent of all
contract dollars awarded on small business contracts in FY2012, which is a lower percentage
than the 19.2 percent vendor share shown in Table 6-2.
Table 6-3 summarizes this analysis by categorizing vendor participation by number of
active years, which we define as a fiscal year in which a vendor had at least one contract award.
Table 6-3
WOSB Vendor Participation by Number of Years Awarded a Contract
The left side of Table 6-3 includes several interesting highlights. First, almost 50 percent
of WOSBs who received a prime Federal contract only had activity in a single fiscal year. We
provide a breakdown of these vendors by activity on the right side of Table 6-3. For example, in
FY2005, we observe 3,983 WOSB vendors who received a contract only in that fiscal year,
without any other contracts during the research period. We contrast these numbers with the total
WOSB vendor participation in each year and calculate the percent of WOSB vendors with a
single contract over the entire research period versus the total population of WOSB vendors with
contract awards in a given fiscal year. The percentage of WOSBs with procurement activity in a
single year as a percent of the total participation in each fiscal year declined steadily from
FY2000 through FY2007, but increased between FY2007 and FY2012. However, we cannot
conclude that this is a negative trend given that we are unaware of whether vendors active in
only one year will participate in Federal procurement post-FY2012.
Second, the rate of activity, as defined by the fiscal years in which a WOSB vendor
received a contract, declines with time, such that less than 9 percent of all WOSBs had contract
awards in more than six fiscal years. However, we note that the data in Table 6-3 represent
Active
Years Count % of Total
Total Dollars
($m) % of Total
Avg contract
amount ($m) Year
Vendors
(Single Year)
Total WOSB
Vendors in
Select FY Percent
1 40,577 49.6% 5,082.0$ 3.4% 0.13$ -------> 2000 2,163 6,398 33.8%
2 14,915 18.2% 4,349.9$ 2.9% 0.15$ 2001 1,445 6,468 22.3%
3 8,168 10.0% 6,308.2$ 4.2% 0.26$ 2002 1,997 8,721 22.9%
4 5,058 6.2% 6,811.4$ 4.6% 0.34$ 2003 2,236 10,610 21.1%
5 3,436 4.2% 7,151.7$ 4.8% 0.42$ 2004 3,348 15,160 22.1%
6 2,421 3.0% 8,509.5$ 5.7% 0.59$ 2005 3,983 18,837 21.1%
7 1,857 2.3% 10,470.3$ 7.0% 0.81$ 2006 3,305 19,932 16.6%
8 1,486 1.8% 12,911.2$ 8.7% 1.09$ 2007 2,830 19,889 14.2%
9 1,163 1.4% 11,225.7$ 7.5% 1.07$ 2008 3,565 21,412 16.6%
10 889 1.1% 12,523.2$ 8.4% 1.41$ 2009 3,688 20,496 18.0%
11 672 0.8% 13,128.9$ 8.8% 1.78$ 2010 3,831 20,705 18.5%
12 422 0.5% 14,476.4$ 9.7% 2.86$ 2011 3,984 20,349 19.6%
13 407 0.5% 16,415.5$ 11.0% 3.10$ 2012 3,558 17,692 20.1%
14 304 0.4% 19,355.3$ 13.0% 4.55$ 2013 644 6,427 10.0%
Total 81,775 148,719.4$ Total 40,577
Analysis of WOSB Vendor Activity by Number of Years with
Contract Award
Subset Analysis of WOSB Vendors Receiving
Contract Awards in a Single Fiscal Year

36
actual awards, and it is possible that a WOSB vendor with only one year of participation may
have participated in Federal procurement either by bidding on, but not receiving awards in other
fiscal years, or alternatively engaging in Federal procurement opportunities via subcontracting
opportunities. Alternatively, a function of the contract roll-up also masks whether WOSBs who
only have activity in one fiscal year are in fact working on a multi-year project, with additional
funding added to the original contract via modifications. In this case, these amounts would roll-
up to the initial contract via the IIC, Inc. contract roll-up methodology.
The third key observation from Table 6-3 is that a higher activity rate is correlated with
both a greater share of contract awards among WOSBs and higher average awards. Thus, the 8.8
percent of WOSB vendors who received contract awards in more than six fiscal years
represented 74.3 percent of the total WOSB contract awards. In addition, the average annual
awards per vendor increases with increasing years of activity. For example, for WOSBs
receiving at least one contract in all 14 fiscal years included in the procurement analysis time
period, the average total of dollars awarded each year was $4.55 million, in contrast to the
average vendor awards of $125.2 thousand for WOSB vendors receiving contracts in only one
fiscal year. Table 6-3 provides quantitative support for the importance of fostering long-term
Federal procurement participation for WOSBs.
We also note that “births,” “deaths” and continuity information is masked in Table 6-3.65
For example, we observe that 1,486 WOSB vendors were awarded contracts in at least eight
distinct procurement years between FY2000 and FY2013. What the data do not show is whether
these eight years are continuous, whether gaps exist within the WOSB procurement activity, or
whether the majority of participation is in early years or later years. We segmented the data to
address the issue of continuity based on years of activity. Our analysis indicates that vendors
who received contracts and awards more recently are more likely to stay active in Federal
procurement. For example, of the 1,486 WOSB vendors awarded contracts in at least eight
years, 72 of these vendors were active each year from FY2000 through FY2007, but not
thereafter. In contrast, 1,057 vendors, or over 71 percent of the total, engaged in procurement
activity as recently as FY2011, including 359 active vendors each year between FY2011 and
FY2013. We view this as positive news for WOSB Federal procurement, especially considering
65
We classify “births” as occasions where a WOSB vendor begins participation in a year other than FY2000, with
an emphasis on later years. For example, observations of a vendor participating annually between FY2006 through
FY2013 might indicate a WOSB entering the Federal procurement process in 2006, given there were no
observations prior to FY2006. Alternatively, a WOSB vendor who last participated in FY2008, with no contracts
for FY2009 through FY2013, represents a “death” given that the business either no longer exists, has not elected to
participate in Federal procurement, or potentially, has participated but has not been successful in securing prime
Federal contracts since the last observation several years prior.

37
the incomplete data for FY2013.66
Finally, of the 1,486 vendors awarded contracts within the
last eight fiscal years, only 212 were inactive during the last four years of the research period.
A related consideration regarding WOSB procurement activity involves the level of
concentration in contracts and awards by specific WOSB vendors. Analysis of the levels of
concentration in dollars awarded each fiscal year indicates a high level of concentration. In other
words, a small number of WOSB vendors account for a disproportionately large share of WOSB
contract award dollars throughout the procurement analysis time period. Figure 6-1 depicts this
phenomenon.
Figure 6-1
Concentration of Awards ($) for WOSBs by Vendor Count
The blue bar represents the number of WOSB vendors that account for 10 percent of total
dollars associated with WOSB contracts awarded in each fiscal year. For example, in FY2000,
three WOSB vendors received approximately 10 percent of all dollars associated with WOSB
contracts awarded in FY2000. The red bar represents the additional WOSB vendors who
comprise the next 10 percent of award dollars. For example, seven additional WOSB vendors
accounted for the next 10 percent of WOSB contract dollars in FY2000, indicating that 10
WOSB vendors were receiving approximately 20 percent of all WOSB contract dollars in
FY2000. While the level of concentration decreases over time, it is worth noting that in FY2012,
13 WOSB vendors accounted for approximately 10 percent of total WOSB contract dollars and
44 WOSB vendors accounted for approximately 20 percent of total WOSB contract dollars. As a
comparison, we recall that FY2012 had in excess of 17,500 WOSB vendors with at least one
66
FY2013 extends through September 30, 2013. Given our download date of March 6, 2013 for FY2013 we are not
only missing the remainder of the fiscal year, but also a substantial portion of Department of Defense procurement
data, given that the Department of Defense procurement data are subject to a 90-day lag in public reporting.
0
10
20
30
40
50
60
2000 2001 2002 2003 2004 2005 2006 2007 2008 2009 2010 2011 2012 2013
WO
SB
Ven
do
rs
Top 10% Top 20%

38
contract award. Therefore, when considering dollars awarded, WOSB prime Federal
procurement remains highly concentrated among a select number of WOSB vendors.
Analysis of vendor participation leads to several conclusions regarding WOSB
procurement activity. We summarize our conclusions, with emphasis added for our most
noteworthy conclusions and observations, as follows:
WOSB vendors typically represent between 10-20 percent of total vendors receiving
contracts and associated award dollars for each fiscal year.
The rate at which WOSBs have won contracts and awards has risen commensurate with
the increase in general contracting activity, peaking in FY2008.
The rate at which WOSBs have won contracts and awards has risen against those of
OtherSBs, consistent with observed increases in the number of contracts awarded and the
amount of dollars awarded.
Almost half of all WOSB vendors receive contracts only in a single fiscal year,
indicating a high rate of turnover – however, it is likely some of these have remained
active in procurement but contracted as a different business type (e.g., change in
gender ownership), as a WOSB bidding on, but not receiving contracts, through
subcontracting, or as a relatively new vendor with anticipated participation and awards
post-FY2012.
WOSB vendors with long periods of activity across different fiscal years tend to receive
a greater share of contract dollars.
WOSB contract dollars are highly concentrated among select vendors in each fiscal
year, although there is often a shift in the specific vendors between fiscal years (i.e., it
is not necessarily the same vendors receiving disproportionately large shares of awards
year after year).
39
Chapter 7. Set-Aside Analysis
The previous research sections focus on WOSB procurement activity at a vendor, agency
and industry level. In this section, we investigate the role that set-asides play in influencing
WOSB procurement trends. This is a critical area of investigation, given that recent legislative
efforts target the use of set-asides to assist WOSBs. Data analysis across different agencies and
industry codes permits complete assessment of WOSB set-aside use. Key research questions we
address include:
What procurement trends do we observe for WOSBs using set-asides to win contracts
and dollars? How do these trends compare to those of OtherSBs?
Has the introduction of the new set-asides arising from the FCP led to new entrants or
incremental dollars flowing to WOSBs already contracting with the Federal government?
Alternatively, does the implementation of these set-asides result in an offset in WOSB
use of other set-asides?
Does analysis of the EDWOSB and WOSB set-asides by agency and industry codes
provide insight into which agencies and industries are currently implementing the set-
aside programs specifically designed to increase the competitiveness and participation
level of WOSBs?
There are a number of different set-aside programs in use to assist and encourage Federal
procurement activity among select business types. Table 7-1 provides a summary of the use of
set-aside contracts for the entire period of FY2000 through FY2013. The “none” category
reflects contracts and amounts awarded that do not use a set-aside. The most prevalent set-aside
program in use over the time period is the SBA set-aside, which sets aside Federal procurement
opportunities for small business concerns, regardless of gender. Other popular small business-
related set aside types include the service disabled veteran-owned small business set-aside
(SDVOSBC) and the reserved for small business set-aside (RSB).67
Table 7-1 also includes the
WOSB and EDWOSB set-asides, which as part of the WOSB FCP, are reserved only for
WOSBs.68
With respect to the universe of set-asides, WOSBs tend to garner approximately 19.5
percent of the total set-aside contracts and 17.5 percent of the total awards issued on these
contracts. These data exceed overall contracting by WOSBs in the small business population,
given that WOSBs received only 18.4 percent of total small business contracts and 15.6 percent
of small business dollars between FY2000 and the present.
67
We note that the RSB set-aside type was technically not valid after October 31, 2009. While we observed a
dramatic drop-off in use of this set-aside, we still encountered contracts in FY2010 through the present. However,
97 percent of contracts listing RSB as a set-aside occurred prior to the cut-off date. 68
We note there are three contracts with misclassifications of ownership for the WOSB set-aside program. We have
left these “as-is” consistent with our treatment of potential misclassifications in other variables.

40
Table 7-1
Summary of Set-Aside Programs and Federal Procurement Awards
In addition, WOSBs exhibit a higher percentage of contracts and dollars for select set-
asides in comparison to the general procurement percentages discussed previously. For example,
WOSBs appear highly successful in procuring 8(a) contracts and awards, as well as HUBZone
awards (e.g., including HZC, HS3 and HZS types). With respect to the latter, WOSBs receive a
higher proportion of dollars than contracts, opposite of the general procurement trends that
indicate that WOSBs are able to compete more effectively for the number of contracts than
actual award amounts. Alternatively, WOSBs are far less represented in the use of veteran-
owned set-asides. We do not find this surprising given that the vast majority of veteran-owned
businesses are men-owned, given disparities in gender for the veteran population. However, this
is an area of potential future research given the growing number of female veterans, particularly
those serving in the Afghanistan and Iraqi conflicts.
Time-series analysis also illustrates the increasing competitiveness of WOSBs in
procuring contracts and dollars through the use of set-aside programs. Figure 7-1 illustrates a
time-series analysis showing the increasing percentage of set-aside contracts and dollars
successfully procured by WOSBs for the four largest set-aside programs based on WOSB-
participation in terms of both contracts and dollars, per Table 7-1. While the contract awards
tend to exhibit greater annual volatility in the percentage obtained by WOSBs, the general trend
for each set-aside is an increase in both percentage of contracts and percentage of dollars.69
69
Some volatility may be due to the downturn of the economy during 2008 and 2009.
Set-Aside
First Year of
Observation
in Data
WOSB
Contracts
Total
Contracts
WOSB
Contracts
% Total
WOSB
Awards
($m)
Total Awards
($m)
WOSB
Awards %
Total
None 2000 1,667,592 19,135,728 8.7% $ 74,259 $ 4,045,024 1.8%
SBA: Small business administration 2000 304,046 1,649,261 18.4% $ 34,528 $ 219,109 15.8%
8AN: 8(a) business development sole source 2000 77,752 286,464 27.1% $ 20,953 $ 99,277 21.1%
8A: 8(a) business development 2000 31,469 112,508 28.0% $ 12,279 $ 49,940 24.6%
SDVOSBC: Service disabled veteran owned small business competed 2000 4,222 77,686 5.4% $ 768 $ 18,724 4.1%
RSB: Reserved for small business $2501 to 100K 2000 7,596 42,945 17.7% $ 133 $ 1,212 11.0%
HZC: HUBZone 2000 7,917 34,653 22.8% $ 3,817 $ 15,864 24.1%
SBP: Small business partial 2000 2,707 24,648 11.0% $ 1,110 $ 15,680 7.1%
ESB: Emerging small business 2000 1,462 11,090 13.2% $ 42 $ 244 17.2%
SDVOSBS: Service disabled veteran owned small business sole source 2002 695 9,898 7.0% $ 166 $ 2,628 6.3%
SDB: Small disadvantaged business 2000 750 3,636 20.6% $ 141 $ 813 17.3%
BI: Buy indian 2000 503 3,511 14.3% $ 32 $ 438 7.3%
HS3: SDB, 8(a) with HUBZone Priority 2000 874 3,133 27.9% $ 196 $ 992 19.8%
HZS: HUBZone sole source 2000 648 2,698 24.0% $ 171 $ 752 22.7%
VSB: Very small business 2000 281 1,718 16.4% $ 5 $ 28 16.6%
VSA: Veteran set-aside 2007 50 1,577 3.2% $ 8 $ 289 2.8%
VSS: Veteran sole-source 2007 26 893 2.9% $ 7 $ 152 4.9%
WOSB: Woman-owned small business 2011 552 555 99.5% $ 54 $ 54 99.8%
HMT: HMP HBCU = Historically black college/university or minority institution 2000 1 550 0.2% $ - $ 181 0.0%
HMP: HMP HBCU = Historically black college/university or minority institution 2001 7 232 3.0% $ 4 $ 32 11.4%
EDWOSB: Economically disadvantaged women-owned small business 2011 225 225 100.0% $ 47 $ 47 100.0%
Total 2,109,375 21,403,609 9.9% $148,719 $ 4,471,481 3.4%
Total Set-Aside Procurement Contracts and Awards 441,783 2,267,881 19.5% $ 74,460 $ 426,458 17.5%
Note: Total Set-Aside summary row represents the total procurement awards less the "None" category

41
Figure 7-1
WOSB Share for the Top Four Set-Asides
We also analyzed agency use of set-asides, including how WOSBs fared in procuring set-
aside contracts from each agency. We include the comprehensive data and analyses by agency in
our “Data Book” and, for the purposes of this report, provide a summary of the aggregate use of
set-asides by the ten largest agencies in terms of procurement dollars. Table 7-2 summarizes the
total procurement dollars for each agency, as well as a breakout by set-aside with a particular
focus on WOSBs.
Table 7-2
Set-Aside Analysis by Major Agency
Table 7-2 illustrates the varying levels at which select agencies not only use set-asides,
but the relative success that WOSBs have in obtaining contracts through those set-aside
programs. For example, the Department of Defense only allocated 9.5 percent of total
procurement dollars using set-asides, compared to almost 18.8 percent for the Department of
Agriculture. With respect to WOSBs, NASA awarded approximately 68 percent of all
procurement dollars awarded to WOSBs using set-aside programs, while all agencies awarded
only 29 percent of total WOSB procurement dollars through set-aside programs. Perhaps most
interesting, is column (h) which shows the success of WOSBs in obtaining set-aside dollars by
0%
5%
10%
15%
20%
25%
30%
35%
40%
45%
2000 2001 2002 2003 2004 2005 2006 2007 2008 2009 2010 2011 2012 2013
Contracts
SBA: 8A: 8AN: HZC:
0%
5%
10%
15%
20%
25%
30%
35%
40%
45%
2000 2001 2002 2003 2004 2005 2006 2007 2008 2009 2010 2011 2012 2013
Dollars
SBA: 8A: 8AN: HZC:
Agency
Total Dollars
($m)
Set-Aside
Dollars ($m)
Set-Aside
Percent of
Total
WOSB Total
Dollars ($m)
WOSB Set-
Aside
Dollars ($m)
WOSB Set-
Aside Percent
of WOSB Total
WOSB Set-
Aside Percent of
Total Set-Aside
(a) (b) (c) (d) = (c) / (b) (e) (f) (g) = (f) / (e) (h) = (f) / (c)
9700: Department of Defense 3,003,613.7$ 285,091.8$ 9.5% 84,291.1$ 47,978.5$ 56.9% 16.8%
8900: Department of Energy 328,056.8$ 7,552.3$ 2.3% 2,360.1$ 1,414.3$ 59.9% 18.7%
8000: National Aeronautics and Space Administration 157,508.6$ 18,029.3$ 11.4% 4,488.0$ 3,028.4$ 67.5% 16.8%
7500: Department of Health and Human Services 151,196.3$ 12,871.8$ 8.5% 7,830.5$ 3,592.5$ 45.9% 27.9%
4700: General Services Administration 137,278.3$ 13,014.7$ 9.5% 7,668.7$ 2,400.7$ 31.3% 18.4%
3600: Department of Veterans Affairs 134,675.5$ 18,974.8$ 14.1% 5,366.4$ 1,737.0$ 32.4% 9.2%
7000: Department of Homeland Security 113,452.7$ 12,846.5$ 11.3% 7,369.3$ 2,454.5$ 33.3% 19.1%
1500: Department of Justice 66,708.6$ 5,235.4$ 7.8% 3,379.0$ 966.8$ 28.6% 18.5%
1200: Department of Agriculture 55,317.2$ 10,368.0$ 18.7% 3,584.3$ 1,496.0$ 41.7% 14.4%
6900: Department of Transportation 50,061.6$ 3,991.3$ 8.0% 3,160.1$ 1,066.8$ 33.8% 26.7%

42
agency versus non-WOSBs. WOSBs were particularly successful with respect to the
Department of Health and Human Services where approximately 28 percent of set-aside
procurement funds went to WOSBs. At the other end of the spectrum was the Department of
Veterans Affairs, where WOSBs only secured 9.2 percent of set-aside funding.70
One of the more encouraging trends in Federal procurement is the increase in set-aside
use since 2004. Figure 7-2 illustrates the percentage of procurement opportunities funded
through set-aside vehicles for two of the largest agencies, the Department of Defense and the
General Services Administration. In both cases, these agencies have increased their use of set-
asides. As discussed previously, WOSBs tend to win awards more often using set-asides than
OtherSBs, such that a prolonged trend toward increasing the use of set-asides by agencies might
favor procurement opportunities and success for WOSBs.
Figure 7-2
Percentage of Total Dollars Funded Through Set-Asides, DoD and GSA
We also analyzed the prevalence of set-asides associated with different industries.
Specifically, we compiled procurement data by industry, set-aside, and business type to
investigate procurement trends for WOSBs active in those industries. Table 7-3 shows the set-
aside trends overall and for WOSBs in the top five industries in terms of total dollars awarded
during the research period. The results indicate that women-owned small businesses are at least
three times as likely as the average business to use set-asides to secure prime Federal
procurement dollars in a given industry. Four of the five top industries in terms of total dollars
awarded are those in which WOSB set-asides are targeted under the WOSB FCP (part of the 83).
It is clear that set-asides are a major component to WOSB procurement in the largest industries
as the WOSB percentage of set-asides is significantly higher than the overall percentage of set-
asides in these industries. In particular, in NAICS 3364, aerospace product and parts
70
We note that this is not necessarily indicative of a gender bias. Rather, veteran-owned business set-aside
programs represent over 50 percent of set-aside funding opportunities for the Department of Veterans Affairs.
Given potential gender disparities in the veteran population, including business ownership, the results are not
necessarily indicative of a gender bias against women by the Department of Veterans Affairs.
0%
5%
10%
15%
20%
25%
2004 2005 2006 2007 2008 2009 2010 2011 2012 2013
9700: Defense 4700: GSA

43
manufacturing, WOSB set-asides account for over 12 percent of total awards earned through all
set-aside programs, indicating that the WOSB/EDWOSB set-asides are being used effectively in
some industries to increase WOSB awards share.
Table 7-3
Set-Aside Analysis by Major Industry NAICS Codes
In assessing the efficacy of the WOSB FCP, we focus specifically on the WOSB and
EDWOSB set-asides. Table 7-4 provides a summary of statistics related to the contracts
awarded under the WOSB and EDWOSB set-asides. After becoming effective during the middle
of FY2011, the number of contracts and dollars awarded under the program grew in FY2012, the
first full year of the program. Conclusions regarding set-aside use in FY2013 are premature
given the partial-year data limitations. Nevertheless, the percentage of total WOSB contracts
obtained via the WOSB and EDWOSB set-asides has grown since inception.
Table 7-4
Analysis of EDWOSB and WOSB Set-Aside Contracts
Use of the WOSB set-asides is approximately double that of EDWOSB set-asides from a
contract number standpoint, but total dollars awarded on EDWOSB set-aside contracts are closer
to the amount of funding on WOSB set-aside contracts. In addition, several agencies account for
Industry Total Awards
Set-Aside
Awards % Set Aside
WOSB
Total
WOSB Set
Aside % Set Aside
5612: Facilities Support Services EDWOSB 186,764$ 21,379$ 11.4% 4,818$ 3,738$ 77.6%
5415: Computer Systems Design and Related Services EDWOSB 281,088$ 35,753$ 12.7% 19,010$ 7,037$ 37.0%
5413: Architectural, Engineering, and Related Services EDWOSB 346,096$ 21,381$ 6.2% 8,356$ 3,457$ 41.4%
5417: Scientific Research and Development Services WOSB 417,900$ 37,360$ 8.9% 7,199$ 4,933$ 68.5%
3364: Aerospace Product and Parts Manufacturing 594,419$ 9,457$ 1.6% 3,162$ 1,164$ 36.8%
Dollar Summary ($) 2011 2012 2013 Grand Total
EDWOSB Set-Aside 7,956,174$ 38,232,563$ 531,087$ 46,719,823$
WOSB Set-Aside 19,085,953$ 30,344,759$ 4,433,899$ 53,864,611$
Combined EDWOSB/WOSB 27,042,127$ 68,577,321$ 4,964,986$ 100,584,434$
Total WOSB Dollars 14,053,824,590$ 11,509,282,763$ 1,243,822,899$ 26,806,930,253$
% of Total WOSB Dollars 0.19% 0.60% 0.40% 0.38%
Contract Count Summary
EDWOSB Set-Aside 36 176 13 225
WOSB Set-Aside 155 329 68 552
Combined EDWOSB/WOSB 191 505 81 777
Total WOSB Contracts 188,411 182,791 24,534 395,736
% of Total WOSB Contracts 0.10% 0.28% 0.33% 0.20%
Average Contract Value ($)
EDWOSB Set-Aside 221,005$ 217,230$ 40,853$ 207,644$
WOSB Set-Aside 123,135$ 92,233$ 65,204$ 97,581$
Average WOSB Value 74,591$ 62,964$ 50,698$ 67,739$

44
the majority of dollars awarded using the EDWOSB and WOSB set-asides. Figure 7-3 shows
the break-out of funding by agency for these set-asides.71
Figure 7-3
Agencies Funding WOSB and EDWOSB Set-Aside Contacts
Twenty-six major agencies funded WOSB contracts through the use of the WOSB and
EDWOSB set-asides since implementation of the WOSB FCP in 2011. In contrast, 51 other
agencies had yet to implement a WOSB or EDWOSB set-aside given data available as of March
5, 2013. The majority of these agencies had significantly lower funding levels than the 26
agencies that have used the WOSB and EDWOSB set-asides. However, the data indicate that
several major agencies with significant funding activity have yet to use a WOSB or EDWOSB
set-aside, most notably the Social Security Administration.72
We also analyzed the use of WOSB and EDWOSB set-asides across different industrial
sectors. Table 7-5 summarizes the top ten industrial sectors, defined by NAICS code, with
WOSBs receiving funding via the WOSB and EDWOSB set-asides. Notably, all ten of these
NAICS are part of the 83 NAICS codes that are considered underrepresented or substantially
underrepresented in the WOSB FCP. In addition, nine of the ten NAICS codes represent
industries in which WOSBs are substantially underrepresented.
71
The data show that NASA and the Department of Housing and Urban Development (HUD) issued only two and
one contracts, respectively, under the WOSB and EDWOSB set-asides since inception. However, these contract
awards were in excess of $5.4 million, representing over 5 percent of total awards under the WOSB and EDWOSB
set-asides. 72
The Social Security Administration (SSA) has awarded approximately $11.4 billion in awards since FY2000.
While the SSA has not yet awarded a contract using the EDWOSB or WOSB set-asides, the SSA exceeded the 5
percent WOSB thresholds in FY2011 and FY2012.
65%9%
4%
3%
3%3%
2%2%
9%
9700: DOD 7000: DHS 4700: GSA
1200: Agriculture 8000: NASA 8600: HUD
3600: VA 1400: Interior Other

45
Table 7-5
Analysis of EDWOSB and WOSB Set-Asides by Major NAICS Code
The WOSB FCP appears to be working in terms of directing contracts and awards to
WOSBs contracting in underrepresented or substantially underrepresented NAICS codes. In
fact, of the 83 NAICS identified as fitting the criteria, WOSB or EDWOSBs contracts have been
awarded to WOSBs operating in 60 of them, leaving only 23 NAICS that have yet to award an
EDWOSB or WOSB set-aside. Table 7-6 presents a summary of these 23 NAICS, including the
total amount of contract dollars awarded during the procurement analysis time period, as well as
the amount awarded to WOSBs.
NAICS EDWOSB: WOSB: Combined Percent of Grand TotalContracts
2382: Building Equipment Contractors (SU) 11,613,488$ 4,660,683$ 16,274,171$ 16.2% 58
2389: Other Specialty Trade Contractors (SU) 5,072,061$ 2,618,820$ 7,690,882$ 7.6% 42
2381: Foundation, Structure, and Building Exterior Contractors (SU) 6,997,274$ 428,591$ 7,425,864$ 7.4% 19
5416: Management, Scientific, and Technical Consulting Services (SU) 3,396,718$ 3,636,084$ 7,032,802$ 7.0% 39
5415: Computer Systems Design and Related Services (SU) 4,897,017$ 1,728,072$ 6,625,089$ 6.6% 22
2371: Utility System Construction (SU) 5,229,318$ 992,425$ 6,221,743$ 6.2% 13
5611: Office Administrative Services (SU) 1,171,335$ 4,480,530$ 5,651,865$ 5.6% 16
6114: Business Schools and Computer and Management Training 55,000$ 4,509,897$ 4,564,897$ 4.5% 27
7223: Special Food Services (SU) -$ 2,824,976$ 2,824,976$ 2.8% 8
Subtotal 38,432,211$ 25,880,078$ 64,312,289$ 63.9% 244
Grand Total 46,719,823$ 53,988,790$ 100,708,614$ 775
Note: "SU" indicates an NAICS WOSBs are "substantially underrepresented" compared to "underrepresented"

46
Table 7-6
Summary of Designated NAICS without a an EDWOSB or WOSB Set-Aside Award
The largest of these remaining 23 NAICS, in terms of total procurement funding since FY2000
are 4881: Support Activities for Air Transportation and 5171: Wired Telecommunications
Carriers.73
As discussed previously, the Department of Defense is the single largest procurement
agency in terms of total contracts and dollars awarded, as well as the largest agency using
WOSB FCP set-asides. We analyzed the Department of Defense use of EDWOSB and WOSB
set-asides in FY2011 through the present. The data show:
Awards using WOSB FCP set-asides occurred in over 40 industries of the 83 NAICS in
which WOSBs are underrepresented or substantially underrepresented;
73
Interestingly, we observed WOSB and EDWOSB set-aside contracts and awards for 63 other NAICS codes that
are not included in the 83 codes encompassing underrepresented or significantly underrepresented WOSBs. While
the total dollar amount associated with contracts awarded to WOSBs in these NAICS codes was only $8.3 million,
this still represented approximately 8 percent of all awards.
($ - millions)
NAICS
Total
Awards
Awards to
WOSBs
3159: Apparel Accessories and Other Apparel Manufacturing (SU) 10,546.7$ 476.8$
3231: Printing and Related Support Activities (U) 1,904.4$ 105.5$
3321: Forging and Stamping (SU) 437.4$ 47.9$
3324: Boiler, Tank, and Shipping Container Manufacturing (SU) 10,738.3$ 135.7$
3346: Manufacturing and Reproducing Magnetic and Optical Media (SU) 1,098.8$ 57.1$
4881: Support Activities for Air Transportation (SU) 25,049.3$ 201.4$
4884: Support Activities for Road Transportation (SU) 371.5$ 60.9$
4885: Freight Transportation Arrangement (SU) 1,059.0$ 13.3$
4889: Other Support Activities for Transportation (U) 1,038.6$ 223.4$
4931: Warehousing and Storage (U) 3,432.4$ 299.0$
5121: Motion Picture and Video Industries (SU) 1,233.1$ 118.6$
5171: Wired Telecommunications Carriers (U) 29,043.0$ 368.7$
5191: Other Information Services (U) 3,469.5$ 205.0$
5311: Lessors of Real Estate (SU) 3,139.1$ 411.2$
5312: Offices of Real Estate Agents and Brokers (U) 1,911.6$ 193.9$
5412: Accounting, Tax Preparation, Bookkeeping, and Payroll Services (U) 7,575.2$ 468.9$
5615: Travel Arrangement and Reservation Services (U) 968.7$ 46.0$
6242: Community Food and Housing, and Emergency and Other Relief Services (U) 737.4$ 27.1$
7115: Independent Artists, Writers, and Performers (SU) 236.0$ 63.2$
8111: Automotive Repair and Maintenance (SU) 2,887.1$ 103.4$
8114: Personal and Household Goods Repair and Maintenance (SU) 244.9$ 59.9$
8129: Other Personal Services (U) 782.7$ 42.2$
8139: Business, Professional, Labor, Political, and Similar Organizations (U) 775.9$ 21.9$
Note: (SU) indicates an NAICS where WOSB are Substantially Underrepresented, while (U) indicates an NAICS
where WOSB are underrepresented

47
The single largest NAICS for DoD WOSB FCP set-asides was NAICS 2382: Building
Equipment Contractors with 15.4 percent of set-aside dollars associated with this
industry; and
The top four NAICS codes (in terms of DoD dollars awarded using WOSB FCP set-
asides) were NAICS codes where WOSBs were substantially underrepresented.
We also analyzed whether DoD set-asides targeted specific industries, including those that might
be lower-receipt industries where WOSBs might be disproportionately present. For example,
recent NWBC analyses indicate that WOSBs are disproportionately present in low-receipt
industries such as Real Estate and Rental and Leasing or Educational Services.74
Table 7-7
presents a summary of the DoD use of WOSB FCP set-asides by major industrial category. The
majority of set-aside dollars were in “middle-receipt”75
industries, primarily Construction or
Professional, Scientific and Technical Services.
Table 7-7
Department of Defense WOSB FCP Contract Awards by Industry
74
“Women in Business 2007-2010,” NWBC infographic available at http://www.nwbc.gov/research/new-data-
analysis-shows-women-owned-business-thriving-still-facing-obstacles. 75
“High” receipt industries include median receipts in excess of $500,000, “Middle” receipt industries include
median receipts between $225,000 and $500,000, and “Low” receipt industries include median receipts below
$225,000.
Industry Amount Industry Receipts
Construction 29,813,196$ Middle
Professional, Scientific, and Technical Services 9,789,836$ Middle
Manufacturing 8,694,028$ High
Administrative and Support and Waste Management and Remediation Services 5,027,793$ Low
Educational Services 4,044,875$ Low
Accommodation and Food Services 2,862,484$ Middle
Information 2,010,894$ Middle
Other Services (except Public Administration) 913,996$ Low
Utilities 566,226$ Middle
Wholesale Trade 538,823$ High
Real Estate and Rental and Leasing 317,288$ Low
Transportation and Warehousing 239,483$ Middle
Retail Trade 203,775$ High
Health Care and Social Assistance 100,139$ Middle
Agriculture 84,500$ Middle
Public Administration 22,090$ Low
Mining 19,146$ High
Low Total 10,326,042$
Middle Total 45,466,757$
High Total 9,455,772$
Note: Classification of Low, Middle and High industry receipts from NWBC "Women in Business 2007-2010" analysis

48
As a result, we do not observe any inherent bias in using the WOSB FCP set-asides
predominantly in industries that are stereotypically women-dominated. In fact, the majority of
DoD set-asides are in construction, where NWBC data analysis has recently shown the ratio of
MOBs to WOBs is 2.7, the highest disparity in ownership among all industrial classifications.76
The EDWOSB and WOSB set-aside data provide an indication of the opportunities
available to WOSBs to engage in Federal procurement via these set-asides. The previous results
illustrate that these opportunities not only span multiple agencies, but also different industry
sectors. Another important research objective involves assessing whether the WOSB FCP and
use of EDWOSB and WOSB set-asides has increased WOSB Federal procurement activity by
encouraging new participants. We performed several analyses which sought to investigate
vendor behavior with respect to the EDWOSB and WOSB set-aside program. Table 7-8
illustrates vendor participation under the WOSB FCP and use of WOSB and EDWOSB set-
asides.
Table 7-8
Vendor Participation in EDWOSB and WOSB Set-Aside Procurement Opportunities
Table 7-8 provides two interesting insights into WOSB procurement activity under the
WOSB FCP. First, 94 WOSBs engaged in Federal procurement solely through the use of these
set-asides. These represent WOSBs that had no previous experience receiving a contract or
award through prime Federal procurement. As a result, almost 20 percent of EDWOSB and
WOSB funding went to first-time procurement participants. While we believe this provides solid
evidence regarding the benefits of the use of WOSB and EDWOSB set-asides, we anticipate this
should be an area of future research to better understand WOSB motivations concerning
procurement opportunities using these set-asides. Second, we observe that fewer vendors
received an award with an EDWOSB set-aside, although Table 7-4 previously indicated the
average award was significantly higher than for vendors who won an award with a WOSB set-
aside.
76
NWBC infographic, op cit.
Vendors awarded at least one contract as a WOSB 81,775
Vendors awarded at least one contract through a WOSB FCP Set-Aside 500
WOSBs awarded at least one WOSB FCP Set-Aside contract as a WOSB 363
WOSBs awarded at least one WOSB FCP Set-Aside contract as an EDWOSB 104
WOSBs awarded at least one WOSB FCP Set-Aside contract as a WOSB and at
least one contract as an EDWOSB33
WOSB vendors whose only contract awards were through a WOSB FCP Set-Aside
contract94

49
Given the reliance on set-asides to meet Federal procurement objectives for a number of
WOSBs active under the WOSB FCP, we investigated procurement activity more closely for the
500 vendors who received awards via the EDWOSB and WOSB set-asides. Additional data
analysis confirms our position that the WOSB FCP has helped stimulate Federal procurement
activity for WOSBs who previously had little or no experience being awarded a contract.
Specifically, we observed:
Forty percent of vendors receiving a WOSB or EDWOSB set-aside contract had less than
two years of activity in receiving Federal procurement activity and awards, indicating
these were relatively “new” WOSBs with respect to Federal procurement.
WOSB set-asides were evenly dispersed among different activity levels for WOSBs with
procurement activity in more than three years (e.g., years receiving contracts and
awards), with a high of 45 vendors awarded contracts in three years and a low of 13
vendors awarded contracts in twelve different fiscal years.
Confirming our previous analysis regarding concentration, we observe that 33 vendors
were awarded contracts in every fiscal year of our analysis and furthermore, the total
awards associated with these vendors (i.e., including award values outside of the
EDWOSB and WOSB set-asides) represented almost 50 percent of the total contract
dollars (i.e. including EDWOSB, WOSB, and other awards) garnered by the 500 vendors
who received at least one WOSB or EDWOSB set-aside contract.
As a final component of our vendor-specific analysis regarding the use of WOSB and EDWOSB
set-asides, we analyzed observable changes in vendor behavior that were apparent from the use
of the WOSB and EDWOSB set-asides. The data were inconclusive, even at a vendor-specific
level, to assess the particular motivations concerning use of the EDWOSB and WOSB set-asides.
As shown in Table 7-9, there was insufficient data to clearly contrast the use of only EDWOSB
and WOSB set-asides versus the full scope of procurement activity for the 500 vendors.

50
Table 7-9
Contract Analysis of Vendors Receiving an EDWOSB or WOSB Set-Aside Contract
The primary barrier to this analysis is that certain vendors receiving WOSB and
EDWSOB set-asides have significant procurement activity, including volatility in terms of the
number and amount of contracts awarded in years prior to the WOSB FCP. As a result, the data
do not shed light on the motivations of these vendors, i.e., a clear shift in contracts and dollars
awarded through the EDWOSB and WOSB set-asides either in addition to, or at the expense of,
other procurement activities.77
Despite our inability to investigate causal relationships between observed data differences
and vendor behavior related to the use of the EDWOSB and WOSB set-asides, the research in
this section provides several interesting observations and conclusions. We summarize our
conclusions, with emphasis added for our most noteworthy conclusions and observations, as
follows:
WOSBs tend to engage in Federal procurement through the use of set-asides more
frequently, or with more success, than do OtherSBs when comparing results of set-aside
use with contracts and amounts awarded outside the set-aside programs.
WOSBs have increased their procurement share through set-aside programs over time.
WOSBs have been particularly successful with the 8A and HubZone set-asides in
comparison to procurement activity absent set-asides.
The introduction of the WOSB FCP and the EDWOSB and WOSB set-asides has
generated in excess of $100 million in contract awards restricted to WOSBs.
77
We observed similar results when examining the number of contracts awarded to these WOSBs.
Year
No Set Aside
($)
ED/WOSB
Set Aside ($)
Other Set
Aside ($) Grand Total ($)
Set Aside
Total ($)
Percent
Set Aside
2000 59,678,864$ -$ 54,539,630$ 114,218,494$ 54,539,630$ 47.8%
2001 89,000,054$ -$ 68,979,260$ 157,979,315$ 68,979,260$ 43.7%
2002 83,478,424$ -$ 92,719,507$ 176,197,931$ 92,719,507$ 52.6%
2003 137,944,249$ -$ 101,960,148$ 239,904,397$ 101,960,148$ 42.5%
2004 180,381,309$ -$ 99,531,051$ 279,912,361$ 99,531,051$ 35.6%
2005 234,098,584$ -$ 159,217,963$ 393,316,546$ 159,217,963$ 40.5%
2006 262,812,760$ -$ 272,958,965$ 535,771,725$ 272,958,965$ 50.9%
2007 262,980,645$ -$ 275,216,336$ 538,196,981$ 275,216,336$ 51.1%
2008 325,739,541$ -$ 306,970,409$ 632,709,949$ 306,970,409$ 48.5%
2009 348,512,720$ -$ 327,705,523$ 676,218,243$ 327,705,523$ 48.5%
2010 333,186,084$ -$ 478,014,457$ 811,200,541$ 478,014,457$ 58.9%
2011 431,726,606$ 11,733,256$ 580,466,831$ 1,023,926,693$ 592,200,087$ 57.8%
2012 416,569,478$ 33,148,887$ 545,105,547$ 994,823,911$ 578,254,433$ 58.1%
2013 53,697,545$ 3,203,193$ 37,453,475$ 94,354,213$ 40,656,668$ 43.1%

51
The WOSB FCP has facilitated entry of new participants through the use of the WOSB
and EDWOSB set-asides.
Many agencies have implemented the use of the EDWOSB and WOSB set-asides,
although several large agencies have yet to do so.
The use of the EDWOSB and WOSB set-asides are successfully targeting NAICS
industries where WOSBs are underrepresented or significantly underrepresented,
however, not all of the 83 designated NAICS have executed contract awards using these
set-asides.
Consistent with general procurement trends for WOSBs, vendors with more longevity
and stability (i.e., receiving contracts in multiple fiscal years) were able to secure a
larger portion of contracts through the use of the WOSB and EDWOSB set-asides.

52
Chapter 8. Additional Procurement Analyses
In this chapter, we focus on additional and supplemental analyses related to WOSB
procurement trends for other FPDS-NG variables, including contract action type, type of contract
pricing, solicitation procedures, extent competed, reason not competed and product service code.
Ideally, we sought information that might support or alternatively, clarify, issues we identified in
prior chapters. We refer the reader to our companion “Data Book” for detailed analyses related
to these other FPDS-NG variables and limit this section to focusing on the following main
observations by variable. We summarize our conclusions, with emphasis added for our most
noteworthy conclusions and observations, for the following variables.
Contract Action Type78
We analyzed the different contract action types for WOSB contracts compared to non-
WOSB contracts during the procurement analysis time period. The majority of all contracts are
either “Delivery Order” contracts or “Purchase Order,” although there is a more recent trend
toward Delivery Order contracts. In contrast, the majority of contract awards occurred under
delivery orders or “Definitive Contracts.” Figure 8-1 provides a break-out of the contract awards
by contract action type for FY2011 through FY2012 contracts. The left panel includes data on
the percentage of total contracts awarded, while the right panel includes data on the award
amounts. Comparison of the two panels illustrates that the average award on definitive contracts
was several magnitudes higher than the average awards on other contract action types.
Figure 8-1
Analysis of Contracts and Dollar Awards by Contract Action Type – FY2007 through
FY2012
From our review of the data and underlying contract award amounts, we concluded:
Between FY2007 and FY2012, the most common type of contract award for WOSBs
was a purchase order, followed closely by delivery orders.
78
Given the focus of our analysis was on contracts as opposed to actions, we limit the analysis to the major observed
contract action types associated with the highest dollar values.
0.0%
10.0%
20.0%
30.0%
40.0%
50.0%
60.0%
70.0%
DO
Delivery
Order
DCA
Definitive
Contract
PO
Purchase
Order
BPA Call
Blanket
Purchase
Agreement
IDC
Indefinite
Delivery
Contract
All Others
All Awards WOSB Awards
0.0%
10.0%
20.0%
30.0%
40.0%
50.0%
60.0%
70.0%
DO
Delivery
Order
DCA
Definitive
Contract
PO
Purchase
Order
BPA Call
Blanket
Purchase
Agreement
IDC
Indefinite
Delivery
Contract
All Others
All Contracts WOSB Contracts

53
In contrast, for the population of all businesses, the number of contracts awarded via
purchase order declined sharply in FY2008, and the number of delivery order contracts
almost doubled the number of purchase order contracts.
One reason for potential disparities in award levels between WOSBs and non-WOSBs
is that the average purchase order contract award was only 12 percent the level of a
delivery order award. Given that WOSBs favored purchase orders more so than non-
WOSBs, this facilitated a lower level of award compared to non-WOSBs.
Type of Contract Pricing
We analyzed the type of contract pricing associated with each contract in our dataset. The most
common type of contract pricing is “Firm Fixed Price” which represents a contract with a
specified dollar amount typically not subject to any adjustment. During the procurement analysis
time period, 75 percent of all contracts and 69 percent of dollar awards were categorized as Firm
Fixed Price. We analyzed the type of contract pricing for WOSBs versus the general pool and
found:
The most common type of contract pricing on WOSB contracts between FY2000 and
FY2012 was also “Firm Fixed Price,” as by FY2012, 88 percent of contracts awarded to
WOSB were “Firm Fixed Price,” representing 83 percent of total dollars awarded.
The second most frequently used type of contract pricing was “Cost Plus Fixed Fee.”
This type of contract pricing accounted for approximately 13 percent of all dollar awards
in FY2012 and 8 percent of WOSB dollar awards.
The average Firm Fixed Price award for WOSBs has fallen from approximately $78
thousand in FY2009 to approximately $59 thousand in FY2012.
The WOSB Firm Fixed Price average award has been between 52 and 59 percent of the
total average Firm Fixed Price contract since FY2007.79
Solicitation Procedures
We examined the different types of solicitation procedures used by WOSBs, in comparison to
the general population. Our observations include:
We observed similar procurement trends across different business types involving
solicitation procedures, as both WOSBs and non-WOSBs tend to win contracts under a
mix of procedures subject to “multiple award fair opportunity,” “negotiated
proposal/quote,” “simplified acquisition,” and “only one source.”
Although general solicitation procedure trends are similar across business types, we
observed that WOSB procurement favored simplified acquisition over the other
solicitation procedures when compared to the general population.
79
We are comparing the average awards across all types of contracts in the general pool, not just small business
contracts.

54
Extent Competed
Each contract contained information on the extent competed, including whether the
contract award was subject to competition. For the general population of all contracts and
awards, the two most prevalent “extent competed” situations were “Full and Open Competition”
and “Not Competed,” representing 49 percent and 28 percent of contract dollars awarded,
respectively, during the procurement analysis time period. These ratios have been relatively
consistent since FY2000, although a more recent trend has been the growth of “Competed under
SAP”80
procurement. We observed the following observations from our analysis of WOSB
procurement trends:
Analysis of the extent competed variable indicates that a higher percentage of WOSB
contract awards occur under some level of competition than the rest of the general
population, as defined by contracts awarded under the following extent competed
categories:
o Full and Open Competition
o Competitive Delivery Order
o Full and Open Competition after Exclusion of Sources81
o Competed under SAP [Simplified Acquisition Procedures]
In FY2012, 85.0 percent of WOSB contracts were awarded under some level of
competitive procurement actions, while 77.8 percent of dollars were awarded to WOSBs
under some level of competitive procurement actions.
In contrast, only 79.7 percent of total contracts and 69.1 percent of total dollars were
awarded under some level of competitive procurement actions during FY2012.
Seventy percent of contract dollars awarded through WOSB FCP set-asides were subject
to “Full and Open Competition after Exclusion of Sources,” with the remaining 30
percent largely competed under SAP.
Reason Not Competed
In conjunction with the extent competed analysis, we also examined the reason not
competed procurement variable for the general population and subset of WOSBs. Our analysis
found:
Between FY2009 and FY2012, approximately 75 percent of “non-competitive” WOSB
dollar awards were categorized under “Other – Authorized by Statute.”
80
SAP refers to Simplified Acquisition Procedures. 81
We recognize that this category inherently assumes restriction, but not elimination of competition. As a result,
our use of “some level of competition” reflects our analysis of excluding contracts awarded specifically under “Not
Available for Competition,” “Not Competed,” “Follow On to Competed Action,” “Not Competed under SAP” or
“Non-Competitive Delivery Order.”

55
In contrast, only one-third of all contracts were categorized under this code, with the
majority of non-competitive contracts awarded under non-competitive simplified
acquisition procedures.
The second largest category for WOSB non-competitive contracts was “Only One
Source.”
One area where we observed a major difference in non-competitive procurement trends
involved Unique Source contracts – for WOSBs the percentage of non-competitive
dollars awarded using unique source contracts ranged from 1.3 to 1.9 percent between
FY2009 and FY2012, while this percentage was between 12 and 19 percent for the
general population.
Product-Service Code
As part of our analysis, we also analyzed the specific product-service codes associated
with contracts won by WOSBs to determine if there were any general trends concerning the
types of activities WOSBs were performing in contracts awarded through prime contracts. Our
analysis indicated:
Approximately 5.5 percent of all WOSB dollar awards between FY2000 and FY2013
were associated with the product-service code (PSC) R499: Other Professional Services.
The top five PSC codes for WOSB accounted for 18.3 percent of all WOSB dollar
awards between FY2000 and FY2013.
The majority of dollars associated with WOSB contract awards involved a service-related
PSC.
We identified 281 different product-service codes associated with contracts awarded
through the WOSB FCP. Similar to overall WOSB contract award trends, the majority
were service-related.
Table 8-1 summarizes the top 10 product-service codes associated with WOSB contract
dollar awards.

56
Table 8-1
Analysis of Top 10 PSCs for WOSBs (in terms of dollar awards FY2000-FY2013)
($ - millions)
PSC None SBA
WOSB/
EDWOSB
All Other
Set Asides Grand Total
% Set
Aside
R499: OTHER PROFESSIONAL SERVICES 3,864.04$ 1,924.45$ 5.26$ 2,332.54$ 8,126.29$ 52.5%
D399: OTHER ADP & TELECOMMUNICATIONS SVCS 4,679.79$ 930.78$ 3.58$ 1,331.87$ 6,946.02$ 32.6%
R425: ENGINEERING AND TECHNICAL SERVICES 2,981.56$ 1,047.26$ 0.39$ 890.92$ 4,920.13$ 39.4%
R408: PROGRAM MANAGEMENT/SUPPORT SERVICES 2,099.87$ 749.68$ 2.44$ 1,005.42$ 3,857.41$ 45.6%
R699: OTHER ADMINISTRATIVE SUPPORT SVCS 1,524.08$ 477.98$ 4.68$ 1,337.22$ 3,343.95$ 54.4%
Z199: MAINT-REP-ALT/MISC BLDGS 484.81$ 182.19$ 2.46$ 1,974.04$ 2,643.49$ 81.7%
R799: OTHER MANAGEMENT SUPPORT SERVICES 1,394.21$ 334.91$ 0.36$ 812.78$ 2,542.26$ 45.2%
D301: ADP FACILITY MANAGEMENT 1,461.64$ 547.59$ -$ 513.31$ 2,522.54$ 42.1%
Y199: CONSTRUCT/MISC BLDGS 432.89$ 412.34$ 2.61$ 1,557.67$ 2,405.50$ 82.0%
S206: GUARD SERVICES 923.50$ 579.64$ -$ 707.38$ 2,210.52$ 58.2%
Set-Aside

57
Chapter 9. Key Conclusions and Future Research
The primary objective of our analysis was to investigate the potential impact of the
WOSB FCP on WOSB procurement activity. However, as the enactment of WOSB FCP and the
implementation of the EDWOSB and WOSB set-aside program only became effective in early
2011 (or mid FY2011), there are limited procurement data available to conduct analyses post-
WOSB FCP enactment. In most instances, we observed an increase in the share of contracts and
award dollars received by WOSBs over time, including after the enactment of the WOSB FCP.
What remains unclear is whether the WOSB FCP had a significant impact on WOSBs obtaining
Federal procurement awards or if other causal factors contributed to the more recent success of
WOSBs in increasing prime Federal procurement share. Regardless, it is clear that WOSBs are
winning prime Federal contracts at a greater rate than they have in the past. This is true across
different agencies and industries, although as we noted there are still areas for improvement with
certain agencies in terms of meeting the 5 percent contract and dollar thresholds. Our principal
conclusions include:
WOSBs have typically increased the proportionate share of contracts awarded and dollars
awarded year over year from FY2000 through FY2012.
Despite WOSB progress, average WOSB awards remain lower than those of OtherSBs.
The contract award gender gap appears to be closing in select industries, most notably in
NAICS 3359 (Other Electrical Equipment and Component Manufacturing), NAICS 5416
(Management, Scientific and Technical Consulting Services), and NAICS 6214
(Outpatient Care Centers). Each of these NAICS codes represent an industry in which
WOSBs are substantially underrepresented.82
The number of industries in which WOSB awards share is greater than WOSB contract
share remains low, indicating that on average, WOSBs are earning less money per
contract than non-WOSBs in the majority of industries.
Within the 83 underrepresented NAICS, WOSBs are on average meeting the contract
threshold, but remain underrepresented in terms of awards share.
Almost half of all WOSB vendors receive contracts only in a single fiscal year, indicating
a high rate of turnover. However, it is likely some of these have remained active in
procurement but contracted as a different business type (e.g., change in gender
ownership), as a WOSB bidding on, but not receiving contracts, through subcontracting,
or as a relatively new vendor with anticipated participation and awards post-FY2012.
WOSB vendors with long periods of activity across different fiscal years tend to receive a
greater share of contract dollars.
WOSB contract dollars are highly concentrated among select vendors in each fiscal year,
although there is often a shift in the specific vendors between fiscal years (i.e., it is not
82
This represents a sample of NAICS where we observe a decrease in the gap between average awards of WOSBs
and non-WOSBs. We refer the reader to our “Data Book” for analyses on each NAICS.
58
necessarily the same vendors receiving disproportionately large shares of awards year
after year).
WOSBs have increased their procurement share through set-aside programs over time.
The introduction of the WOSB FCP and the EDWOSB and WOSB set-asides has
generated more than $100 million in contract awards restricted to WOSBs.
The WOSB FCP has facilitated entry of new participants through the use of the WOSB
and EDWOSB set-asides.
Consistent with general procurement trends for WOSBs, vendors with more longevity
and stability (i.e., receiving contracts in multiple fiscal years) were able to secure a larger
portion of contracts through the use of the WOSB and EDWOSB set-asides.
Between FY2007 and FY2012, the most common type of contract award for WOSBs was
a purchase order, followed closely by delivery orders.
One reason for potential disparities in award levels between WOSBs and non-WOSBs is
that the average purchase order contract award was only 12 percent the level of a delivery
order award. Given that WOSBs favored purchase orders more so than non-WOSBs, this
facilitated a lower level of award compared to non-WOSBs.
Analysis of the “extent competed” variable indicates that a higher percentage of WOSB
contract awards occur under some level of competition than the rest of the general
population.
Lastly, while the quantitative results do not provide definitive proof that the WOSB FCP
program is working as intended, the data and analyses raise several different avenues for
additional research. These include:
What other exogenous factors (e.g., non-FPDS-NG data elements) influence WOSB
procurement participation and winning of awards through the WOSB FCP?
Can we gain additional insight into WOSB competitive behavior by analyzing WOSB
participation (e.g., bidding on Federal prime contracts) as opposed to solely analyzing
awards?
Does an increased effort in subcontracting detract from WOSBs pursuing and winning
prime awards?
Do we observe regional differences based on WOSB geographic dispersion – both in
general terms by regions of the United States (e.g., West versus Northeast), as well as for
rural versus urban participation?
What industry specific factors might influence WOSB procurement behavior?
Do we tend to observe WOSBs winning procurement awards in industries with different
characteristics (e.g., low-wage, service-oriented) than non-WOSBs?