quantitative phase imaging using multi-wavelength optical phase
TRANSCRIPT
33
Quantitative Phase Imaging using Multi-wavelength Optical Phase Unwrapping
Nilanthi Warnasooriya and Myung K. Kim University of South Florida
U.S.A.
1. Introduction
Quantitative phase imaging is a vital technique in many areas of science. Studying
properties and characteristics of biological and other microscopic specimens has been
facilitated with new quantitative phase imaging microscopy methods. In quantitative phase
imaging, phase images are obtained by interfering two light beams – one reflected from, or
traversed through, the specimen and the other reflected from a reference mirror. This can be
achieved by two methods; holography or phase-shifting interferometry. In holography, one
interferogram is used to produce the phase image, while phase-shifting interferometry uses
three or more interferograms.
Each fringe in an interferogram represents an area of data ranging from 0 to 2 π . Therefore,
the final phase map obtained from a series of interferograms also contains 2 π ambiguities.
Such phase maps are called ‘wrapped’ phase maps, and are needed to be ‘unwrapped’ by
removing 2 π ambiguities. Once these 2 π ambiguities are removed, a continuous surface
profile of the test object can be obtained. Such a surface profile provides height information
of surface features. Generally, phase unwrapping is done by using numerical algorithms.
Most of these numerical algorithms are computationally intensive and can fail when there
are irregularities in the test object.
In the basic phase unwrapping method, the phase image is divided to horizontal lines and
these lines are unwrapped separately by scanning pixels and adding an offset to each pixel. At each discontinuity a 2 π offset is added or subtracted. After all horizontal lines are
unwrapped, they are connected vertically and the unwrapping process is done along
vertical lines. There are many phase unwrapping methods to remove 2 π ambiguities and
most can be categorized into two types; path-dependent methods and path-independent
methods. Path-dependent methods detect positions of edges and phase ambiguities in
images and use this information to calculate phase offset values. In path-independent
methods, areas that can cause errors in unwrapping are identified and eliminated before the
unwrapping process starts.
In 1994 Ghiglia and Romero used a least squares integration method with phase unwrapping. In this method, which is known as least squares integration of phase gradient method, the phase gradient is obtained as wrapped phase differences along two perpendicular directions and the gradient field is least squares integrated to obtain continuous phase. However, this method is not effective for phase maps with high noise. P.
Source: Advances in Lasers and Electro Optics, Book edited by: Nelson Costa and Adolfo Cartaxo, ISBN 978-953-307-088-9, pp. 838, April 2010, INTECH, Croatia, downloaded from SCIYO.COM
www.intechopen.com
Advances in Lasers and Electro optics
770
G. Charette and I. W. Hunter proposed a robust phase unwrapping method for phase images with high noise content. The basic concept behind this method is to identify contiguous areas that are not on or close to a fringe boundary by locally fitting planes to the phase data. Then these areas are phase shifted with respect to one another by multiples of 2 π to unwrap the phase.
Software algorithms that exist for detecting and removing 2 π ambiguities are mostly
computational-intensive and prone to errors when the phase profile is noisy or when the object has irregularities. Multi-wavelength optical phase unwrapping is an easy method that can be used to eliminate 2 π ambiguities in phase maps without such problems.
In this chapter we will present quantitative phase images of cells and other microscopic samples, using multi-wavelength optical phase unwrapping. Three types of light sources are used in a standard four-frame phase shifting interferometer to obtain phase profiles with larger beat wavelengths, thus removing 2 π ambiguities without increasing phase noise.
The effectiveness of multi-wavelength optical phase unwrapping with both incoherent and coherent light sources will be demonstrated.
2. Multi-wavelength optical phase unwrapping
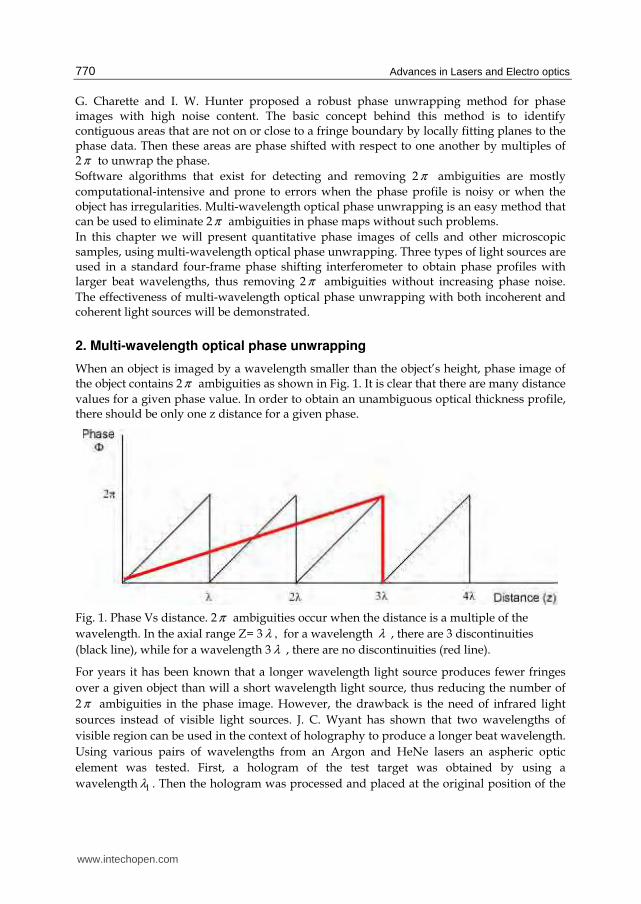
When an object is imaged by a wavelength smaller than the object’s height, phase image of the object contains 2 π ambiguities as shown in Fig. 1. It is clear that there are many distance
values for a given phase value. In order to obtain an unambiguous optical thickness profile, there should be only one z distance for a given phase.
Fig. 1. Phase Vs distance. 2 π ambiguities occur when the distance is a multiple of the
wavelength. In the axial range Z= 3 λ , for a wavelength λ , there are 3 discontinuities
(black line), while for a wavelength 3 λ , there are no discontinuities (red line).
For years it has been known that a longer wavelength light source produces fewer fringes
over a given object than will a short wavelength light source, thus reducing the number of
2 π ambiguities in the phase image. However, the drawback is the need of infrared light
sources instead of visible light sources. J. C. Wyant has shown that two wavelengths of
visible region can be used in the context of holography to produce a longer beat wavelength.
Using various pairs of wavelengths from an Argon and HeNe lasers an aspheric optic
element was tested. First, a hologram of the test target was obtained by using a
wavelength 1λ . Then the hologram was processed and placed at the original position of the
www.intechopen.com
Quantitative Phase Imaging using Multi-wavelength Optical Phase Unwrapping
771
interferometer and illuminated by a second wavelength 2λ . The resultant interferogram was
identical to the interferogram that would have been illuminated by a light source of 12Λ ; the
beat wavelength of wavelengths 1λ and 2λ , where 12 1 2 1 2/λ λ λ λΛ = − .
The term ‘two-wavelength interferometry’ was first used by C. Polhemus in a paper where
he introduced a two-wavelength technique for interferometric testing. In the method of
static interferometry, a fringe pattern obtained with a light source of wavelength 1λ is
recorded and replaced into the system as a moiré reference mask. Then the light source is
replaced by one with wavelength 2λ . The resultant moiré fringe pattern is identical to the
fringe pattern that would have been obtained with a light source of 12Λ . Polhemus modified
the method to apply in real time systems. In the method of dynamic interferometry, light
sources of 1λ and 2λ are operated simultaneously in the interferometer setup, giving a
resultant fringe pattern of 12Λ .
In 1984, two-wavelength phase shifting interferometry was introduced as an optical phase
unwrapping method. In this method, phase shifting interferometry and two-wavelength
interferometry were combined to extend the phase measurement range of single-
wavelength phase shifting interferometry. Two methods were introduced to solve 2 π
ambiguities by using two-wavelength phase shifting interferometer. In the first method, two
sets of wrapped phase data are obtained with wavelengths 1λ and 2λ . The data is then used
to calculate the phase difference between pixels for beat wavelength 12Λ . Then all phase
difference values are integrated to calculate the relative surface height of the test object. In
the second method, two phase maps of different wavelengths are used to produce a phase
map of beat wavelength. The beat wavelength phase map is then used as a reference to
correct 2 π ambiguities in the single wavelength phase map. Both methods were used to
measure 1-D surface heights. Two-wavelength phase shifting interferometry has also been
used to obtain three dimensional contour maps of aspheric surfaces with an accuracy of
12Λ /100. However, a disadvantage of this optical phase unwrapping is that the phase noise
in each wavelength is magnified by a factor equal to the magnification of the wavelengths.
This problem has been addressed by J. Gass, A. Dakoff and M. K. Kim. In the context of
digital holography, two phase maps of wavelengths 1λ and 2λ are used to produce a phase
map called “coarse map” with beat wavelength 12Λ . Then one of the single wavelength
phase maps is used to reduce the amplified phase noise of the coarse map. The resultant
‘fine map’ has noise similar to the noise of the single wavelength phase map, with a larger
axial range free of 2 π ambiguities. The two-wavelength phase unwrapping method has been extended to multiple
wavelengths; enabling measurements of steep surfaces without software phase unwrapping.
A hierarchical phase unwrapping algorithm that chooses a minimum number of
wavelengths to increase the accuracy of optical unwrapping has been introduced by C.
Wagner, W. Osten and S. Seebacher. The basic principle of this method is to start with a
larger beat wavelength. Then a systematic reduction of beat wavelengths is used to improve
the accuracy of the measurement while the information of the preceding measurements is
used to eliminate 2 π ambiguities. A similar version of hierarchical phase unwrapping has
been presented by U. Schnars and W. Jueptner, however it has not been used
experimentally. Three-wavelength phase unwrapping algorithms have been introduced in
both interferometry and digital holography enabling measurements of steep surfaces
www.intechopen.com
Advances in Lasers and Electro optics
772
without software phase unwrapping. While the principle of multi-wavelength phase
unwrapping has been known in interferometry, until recently known applications had been
confined to optical profilers with raster-scanned point-wise interferometry. Other than
recent digital holography experiments, the first known application of multi-wave phase
unwrapping to full-frame phase images in interferometry has been presented by N.
Warnasooriya and M. K. Kim.
2.1 Principle of two-wavelength optical phase unwrapping
The basis of multi-wavelength optical phase unwrapping method is the idea of beat
wavelength. For two wavelengths 1λ and 2λ , the beat wavelength 12Λ is defined by
1 212
1 2
λ λ
λ λΛ =
− (1)
For the mth wavelength mλ , the surface profile mZ of an object is related to the phase
difference mϕ as follows;
2
m mmZ
λ ϕ
π= (2)
It is apparent that unambiguous range of Z can be increased by using a longer λ .
Consider two single wavelength phase maps 1ϕ and 2ϕ with wavelengths 1λ = 530 nm and
2λ = 470 nm respectively. The beat wavelength 12Λ for 1λ and 2λ is 12Λ = 4.151 ┤m. The
12Λ can be increased by choosing closer values of 1λ and 2λ . The phase map for 12Λ is
obtained by subtracting one single wavelength phase map from the other and then adding
2 π whenever the resultant value is less than zero. This phase map is called “coarse map”
12ϕ . The surface profile for coarse map 12ϕ is given by 12 12 / 2mZ ϕ π= Λ . However, the phase
noise in each single wavelength phase map is magnified by the same factor as the
magnification of wavelengths. In the two-wavelength optical phase unwrapping method
introduced by J. Gass et.al., the phase noise is reduced by using the following steps.
First, the surface profile 12Z is divided into integer multiples of a single wavelength, say 1λ .
Then, the result is added to the single wavelength surface profile 1Z . This significantly
reduces the phase noise in the coarse map. However, at the boundaries of wavelength
intervals 1λ the noise of the single wavelength phase map appears as spikes. These spikes
can be removed by comparing the result with the coarse map surface profile 12Z . If the
difference is more than half of 1λ , addition or subtraction of one 1λ depending on the sign of
the difference removes the spikes. The final result ‘fine map’ has a noise level equal to that
of single wavelength surface profile. If a single wavelength phase map mϕ contains a phase
noise of 2 mπε the two-wavelength phase unwrapping method works properly
for 12/ 4m mε λ< Λ . Using a lager beat wavelength reduces the maximum noise limit.
2.2 Principle of three-wavelength optical phase unwrapping
The advantage of three wavelength phase unwrapping method is that the beat wavelength
can be increased without reducing the maximum noise limit. Suppose the three chosen
wavelengths are 1λ = 625 nm, 2λ = 590 nm, and 3λ = 530 nm. The first two wavelengths
give beat wavelength 12Λ = 10.53 ┤m. Instead of using the surface profile of 12Z , which has
www.intechopen.com
Quantitative Phase Imaging using Multi-wavelength Optical Phase Unwrapping
773
a high noise, an identical surface profile can be produced by using surface profiles 13Z and
23Z with beat wavelengths 13Λ = 3.49 ┤m and 23Λ = 5.21 ┤m. The resultant “coarse map of
coarse maps” 13 23ϕ − with surface profile 13 23Z − also has the same beat wavelength
13 23 13 23 13 23/ | |−Λ = Λ Λ Λ − Λ = 10.53 ┤m.
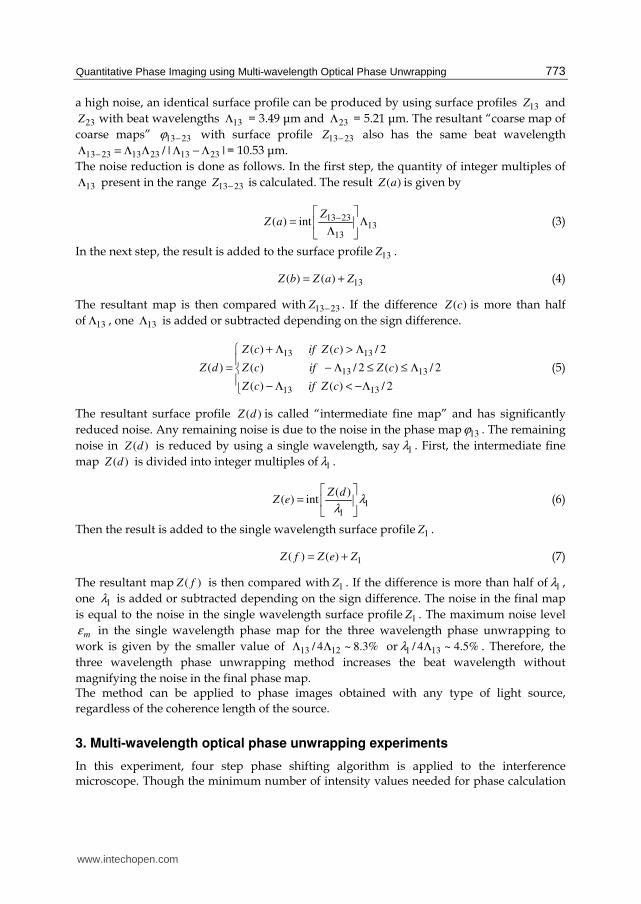
The noise reduction is done as follows. In the first step, the quantity of integer multiples of
13Λ present in the range 13 23Z − is calculated. The result ( )Z a is given by
13 2313
13
( ) intZ
Z a −⎡ ⎤= Λ⎢ ⎥
Λ⎣ ⎦ (3)
In the next step, the result is added to the surface profile 13Z .
13( ) ( )Z b Z a Z= + (4)
The resultant map is then compared with 13 23Z − . If the difference ( )Z c is more than half
of 13Λ , one 13Λ is added or subtracted depending on the sign difference.
13 13
13 13
13 13
( ) ( ) / 2
( ) ( ) / 2 ( ) / 2
( ) ( ) / 2
Z c if Z c
Z d Z c if Z c
Z c if Z c
+ Λ > Λ⎧⎪= − Λ ≤ ≤ Λ⎨⎪ − Λ < −Λ⎩
(5)
The resultant surface profile ( )Z d is called “intermediate fine map” and has significantly
reduced noise. Any remaining noise is due to the noise in the phase map 13ϕ . The remaining
noise in ( )Z d is reduced by using a single wavelength, say 1λ . First, the intermediate fine
map ( )Z d is divided into integer multiples of 1λ .
11
( )( ) int
Z dZ e λ
λ
⎡ ⎤= ⎢ ⎥⎣ ⎦ (6)
Then the result is added to the single wavelength surface profile 1Z .
1( ) ( )Z f Z e Z= + (7)
The resultant map ( )Z f is then compared with 1Z . If the difference is more than half of 1λ ,
one 1λ is added or subtracted depending on the sign difference. The noise in the final map
is equal to the noise in the single wavelength surface profile 1Z . The maximum noise level
mε in the single wavelength phase map for the three wavelength phase unwrapping to
work is given by the smaller value of 13 12/ 4 ~ 8.3%Λ Λ or 1 13/ 4 ~ 4.5%λ Λ . Therefore, the
three wavelength phase unwrapping method increases the beat wavelength without
magnifying the noise in the final phase map. The method can be applied to phase images obtained with any type of light source,
regardless of the coherence length of the source.
3. Multi-wavelength optical phase unwrapping experiments
In this experiment, four step phase shifting algorithm is applied to the interference microscope. Though the minimum number of intensity values needed for phase calculation
www.intechopen.com
Advances in Lasers and Electro optics
774
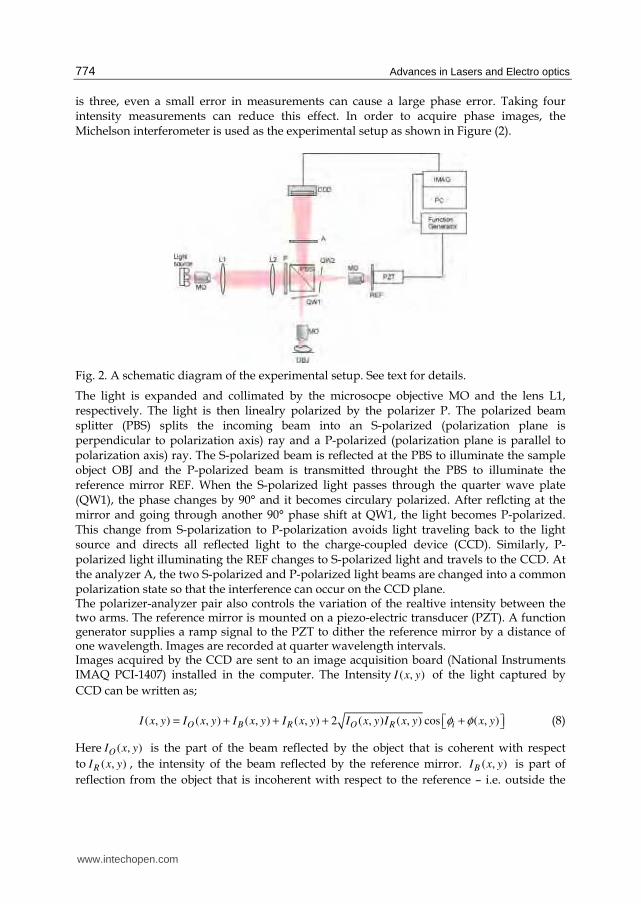
is three, even a small error in measurements can cause a large phase error. Taking four intensity measurements can reduce this effect. In order to acquire phase images, the Michelson interferometer is used as the experimental setup as shown in Figure (2).
Fig. 2. A schematic diagram of the experimental setup. See text for details.
The light is expanded and collimated by the microsocpe objective MO and the lens L1, respectively. The light is then linealry polarized by the polarizer P. The polarized beam splitter (PBS) splits the incoming beam into an S-polarized (polarization plane is perpendicular to polarization axis) ray and a P-polarized (polarization plane is parallel to polarization axis) ray. The S-polarized beam is reflected at the PBS to illuminate the sample object OBJ and the P-polarized beam is transmitted throught the PBS to illuminate the reference mirror REF. When the S-polarized light passes through the quarter wave plate (QW1), the phase changes by 90° and it becomes circulary polarized. After reflcting at the mirror and going through another 90° phase shift at QW1, the light becomes P-polarized. This change from S-polarization to P-polarization avoids light traveling back to the light source and directs all reflected light to the charge-coupled device (CCD). Similarly, P-polarized light illuminating the REF changes to S-polarized light and travels to the CCD. At the analyzer A, the two S-polarized and P-polarized light beams are changed into a common polarization state so that the interference can occur on the CCD plane. The polarizer-analyzer pair also controls the variation of the realtive intensity between the two arms. The reference mirror is mounted on a piezo-electric transducer (PZT). A function generator supplies a ramp signal to the PZT to dither the reference mirror by a distance of one wavelength. Images are recorded at quarter wavelength intervals. Images acquired by the CCD are sent to an image acquisition board (National Instruments IMAQ PCI-1407) installed in the computer. The Intensity ( , )I x y of the light captured by
CCD can be written as;
( , ) ( , ) ( , ) ( , ) 2 ( , ) ( , ) cos ( , )O B R O R iI x y I x y I x y I x y I x y I x y x yφ φ= + + + +⎡ ⎤⎣ ⎦ (8)
Here ( , )OI x y is the part of the beam reflected by the object that is coherent with respect
to ( , )RI x y , the intensity of the beam reflected by the reference mirror. ( , )BI x y is part of
reflection from the object that is incoherent with respect to the reference – i.e. outside the
www.intechopen.com
Quantitative Phase Imaging using Multi-wavelength Optical Phase Unwrapping
775
coherence length. ( , )x yφ the relative phase between the object and the reference mirror
and iφ is the phase shift introduced by moving the reference mirror by quarter wavelength
intervals. Intensity distributions corresponding to the four images, acquired at 0, / 2,iφ π π=
and 3 / 2π , can be given as follows;
0
/ 2
3 / 2
2 cos
2 sin
2 cos
2 sin
O B R O R
O B R O R
O B R O R
O B R O R
I I I I I I
I I I I I I
I I I I I I
I I I I I I
π
π
π
φ
φ
φ
φ
= + + +
= + + −
= + + −
= + + +
(9)
The phase map of the object is given by;
1 3 / 2 / 2
0
I ITan
I I
π π
π
φ − ⎛ ⎞−= ⎜ ⎟⎜ ⎟−⎝ ⎠ (10)
Once a phase profile of the specimen is obtained, it can be used to determine the height
profile of the specimen.
The optical path difference (OPD) between the object wave and reference wave is given by
2
OPDλφ
π= (11)
Here λ is the wavelength of the light beam and φ is the relative phase between the object
and reference mirror. In the given Michelson type interferometer, the height profile of the
object is half the OPD because the light travels towards the object, reflects and travels back.
Therefore, the height profile h is related to the phase φ s follows.
1
2 2h
λφ
π
⎛ ⎞= ⎜ ⎟⎝ ⎠ (12)
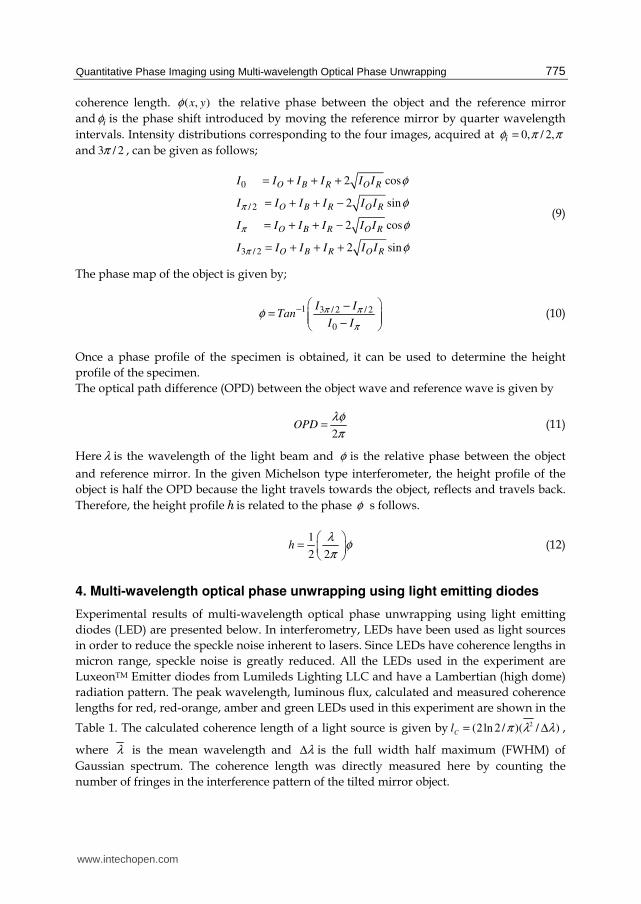
4. Multi-wavelength optical phase unwrapping using light emitting diodes
Experimental results of multi-wavelength optical phase unwrapping using light emitting
diodes (LED) are presented below. In interferometry, LEDs have been used as light sources
in order to reduce the speckle noise inherent to lasers. Since LEDs have coherence lengths in
micron range, speckle noise is greatly reduced. All the LEDs used in the experiment are
LuxeonTM Emitter diodes from Lumileds Lighting LLC and have a Lambertian (high dome)
radiation pattern. The peak wavelength, luminous flux, calculated and measured coherence
lengths for red, red-orange, amber and green LEDs used in this experiment are shown in the
Table 1. The calculated coherence length of a light source is given by )/)(/2ln2(2 λλπ Δ=
Cl ,
where λ is the mean wavelength and λΔ is the full width half maximum (FWHM) of
Gaussian spectrum. The coherence length was directly measured here by counting the
number of fringes in the interference pattern of the tilted mirror object.
www.intechopen.com
Advances in Lasers and Electro optics
776
Colour Luminous Flux
Φ (lm) *
Peak Wavelength ┣
(nm)
Spectral Width (nm)
Calculated Coherence
Length (┤m)
Measured Coherence
Length (┤m)
Red 44 653.83±0.07 27.24±0.15 6.91±0.04 9.15±2.45
Red-Orange 55 643.42±0.07 23.21±0.14 7.85±0.05 10.29±2.57
Amber 36 603.48±0.03 17.53±0.05 9.14±0.03 10.86±2.56
Green 25 550.18±0.09 38.39±0.19 3.42±0.02 3.85±1.46
Table 1. Characteristics of LEDs. Luminous flux values are at 350 mA, Junction Temperature TJ= 25°C. * LuxeonTM Emitter and Star sample information AB11, 2 (Feb 2002).
4.1 Results for two-wavelength optical phase unwrapping
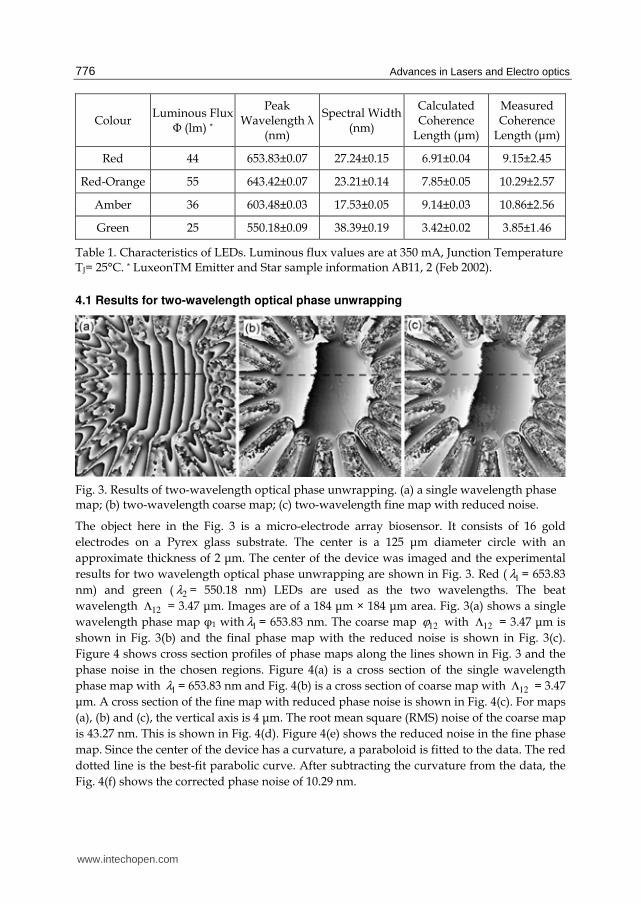
Fig. 3. Results of two-wavelength optical phase unwrapping. (a) a single wavelength phase map; (b) two-wavelength coarse map; (c) two-wavelength fine map with reduced noise.
The object here in the Fig. 3 is a micro-electrode array biosensor. It consists of 16 gold
electrodes on a Pyrex glass substrate. The center is a 125 ┤m diameter circle with an
approximate thickness of 2 ┤m. The center of the device was imaged and the experimental
results for two wavelength optical phase unwrapping are shown in Fig. 3. Red ( 1λ = 653.83
nm) and green ( 2λ = 550.18 nm) LEDs are used as the two wavelengths. The beat
wavelength 12Λ = 3.47 ┤m. Images are of a 184 ┤m × 184 ┤m area. Fig. 3(a) shows a single
wavelength phase map φ1 with 1λ = 653.83 nm. The coarse map 12ϕ with 12Λ = 3.47 ┤m is
shown in Fig. 3(b) and the final phase map with the reduced noise is shown in Fig. 3(c).
Figure 4 shows cross section profiles of phase maps along the lines shown in Fig. 3 and the
phase noise in the chosen regions. Figure 4(a) is a cross section of the single wavelength
phase map with 1λ = 653.83 nm and Fig. 4(b) is a cross section of coarse map with 12Λ = 3.47
┤m. A cross section of the fine map with reduced phase noise is shown in Fig. 4(c). For maps
(a), (b) and (c), the vertical axis is 4 ┤m. The root mean square (RMS) noise of the coarse map
is 43.27 nm. This is shown in Fig. 4(d). Figure 4(e) shows the reduced noise in the fine phase
map. Since the center of the device has a curvature, a paraboloid is fitted to the data. The red
dotted line is the best-fit parabolic curve. After subtracting the curvature from the data, the
Fig. 4(f) shows the corrected phase noise of 10.29 nm.
www.intechopen.com
Quantitative Phase Imaging using Multi-wavelength Optical Phase Unwrapping
777
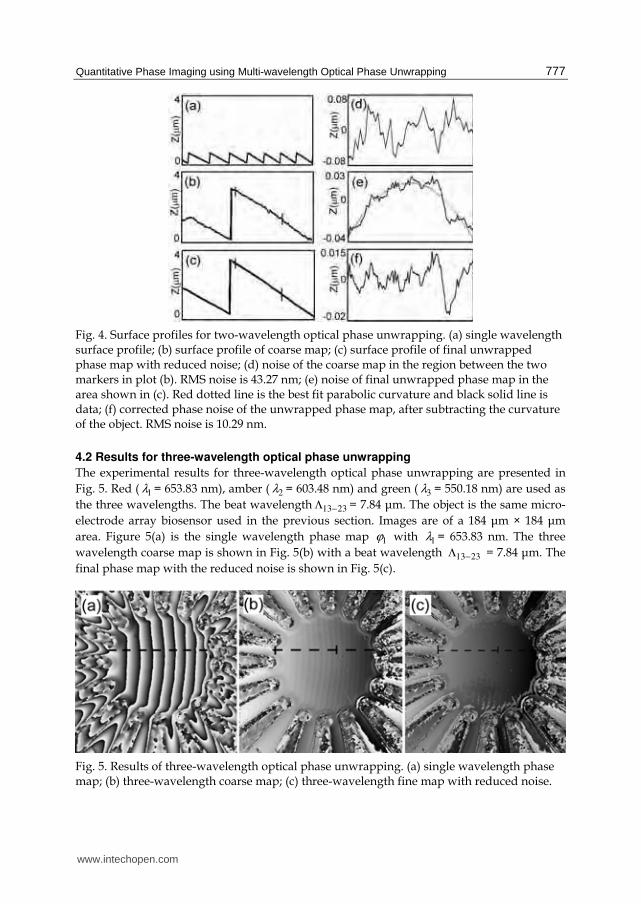
Fig. 4. Surface profiles for two-wavelength optical phase unwrapping. (a) single wavelength surface profile; (b) surface profile of coarse map; (c) surface profile of final unwrapped phase map with reduced noise; (d) noise of the coarse map in the region between the two markers in plot (b). RMS noise is 43.27 nm; (e) noise of final unwrapped phase map in the area shown in (c). Red dotted line is the best fit parabolic curvature and black solid line is data; (f) corrected phase noise of the unwrapped phase map, after subtracting the curvature of the object. RMS noise is 10.29 nm.
4.2 Results for three-wavelength optical phase unwrapping
The experimental results for three-wavelength optical phase unwrapping are presented in
Fig. 5. Red ( 1λ = 653.83 nm), amber ( 2λ = 603.48 nm) and green ( 3λ = 550.18 nm) are used as
the three wavelengths. The beat wavelength 13 23−Λ = 7.84 ┤m. The object is the same micro-
electrode array biosensor used in the previous section. Images are of a 184 ┤m × 184 ┤m
area. Figure 5(a) is the single wavelength phase map 1ϕ with 1λ = 653.83 nm. The three
wavelength coarse map is shown in Fig. 5(b) with a beat wavelength 13 23−Λ = 7.84 ┤m. The
final phase map with the reduced noise is shown in Fig. 5(c).
Fig. 5. Results of three-wavelength optical phase unwrapping. (a) single wavelength phase map; (b) three-wavelength coarse map; (c) three-wavelength fine map with reduced noise.
www.intechopen.com
Advances in Lasers and Electro optics
778
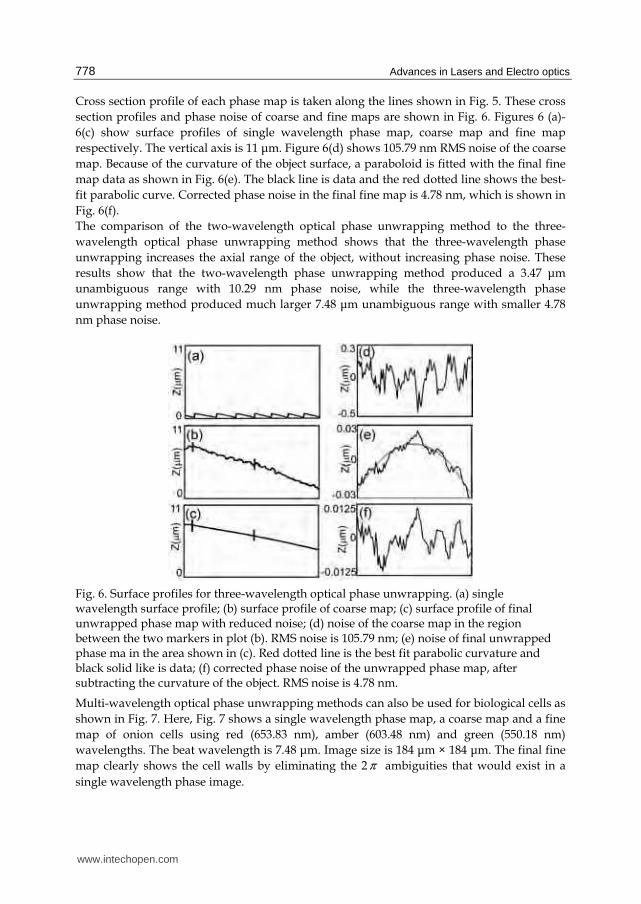
Cross section profile of each phase map is taken along the lines shown in Fig. 5. These cross
section profiles and phase noise of coarse and fine maps are shown in Fig. 6. Figures 6 (a)-
6(c) show surface profiles of single wavelength phase map, coarse map and fine map
respectively. The vertical axis is 11 ┤m. Figure 6(d) shows 105.79 nm RMS noise of the coarse
map. Because of the curvature of the object surface, a paraboloid is fitted with the final fine
map data as shown in Fig. 6(e). The black line is data and the red dotted line shows the best-
fit parabolic curve. Corrected phase noise in the final fine map is 4.78 nm, which is shown in
Fig. 6(f).
The comparison of the two-wavelength optical phase unwrapping method to the three-
wavelength optical phase unwrapping method shows that the three-wavelength phase
unwrapping increases the axial range of the object, without increasing phase noise. These
results show that the two-wavelength phase unwrapping method produced a 3.47 ┤m
unambiguous range with 10.29 nm phase noise, while the three-wavelength phase
unwrapping method produced much larger 7.48 ┤m unambiguous range with smaller 4.78
nm phase noise.
Fig. 6. Surface profiles for three-wavelength optical phase unwrapping. (a) single wavelength surface profile; (b) surface profile of coarse map; (c) surface profile of final unwrapped phase map with reduced noise; (d) noise of the coarse map in the region between the two markers in plot (b). RMS noise is 105.79 nm; (e) noise of final unwrapped phase ma in the area shown in (c). Red dotted line is the best fit parabolic curvature and black solid like is data; (f) corrected phase noise of the unwrapped phase map, after subtracting the curvature of the object. RMS noise is 4.78 nm.
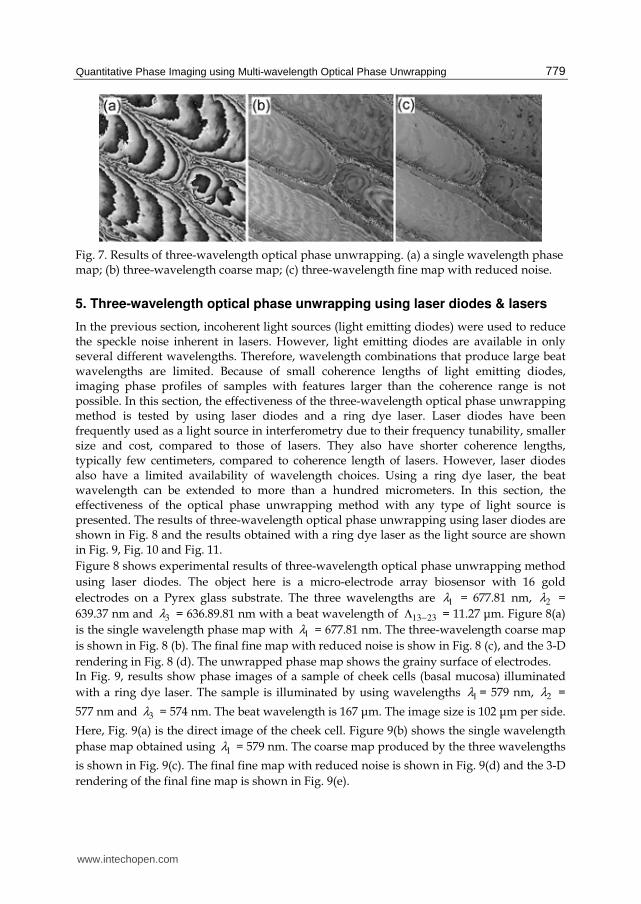
Multi-wavelength optical phase unwrapping methods can also be used for biological cells as
shown in Fig. 7. Here, Fig. 7 shows a single wavelength phase map, a coarse map and a fine
map of onion cells using red (653.83 nm), amber (603.48 nm) and green (550.18 nm)
wavelengths. The beat wavelength is 7.48 ┤m. Image size is 184 ┤m × 184 ┤m. The final fine
map clearly shows the cell walls by eliminating the 2 π ambiguities that would exist in a
single wavelength phase image.
www.intechopen.com
Quantitative Phase Imaging using Multi-wavelength Optical Phase Unwrapping
779
Fig. 7. Results of three-wavelength optical phase unwrapping. (a) a single wavelength phase map; (b) three-wavelength coarse map; (c) three-wavelength fine map with reduced noise.
5. Three-wavelength optical phase unwrapping using laser diodes & lasers
In the previous section, incoherent light sources (light emitting diodes) were used to reduce the speckle noise inherent in lasers. However, light emitting diodes are available in only several different wavelengths. Therefore, wavelength combinations that produce large beat wavelengths are limited. Because of small coherence lengths of light emitting diodes, imaging phase profiles of samples with features larger than the coherence range is not possible. In this section, the effectiveness of the three-wavelength optical phase unwrapping method is tested by using laser diodes and a ring dye laser. Laser diodes have been frequently used as a light source in interferometry due to their frequency tunability, smaller size and cost, compared to those of lasers. They also have shorter coherence lengths, typically few centimeters, compared to coherence length of lasers. However, laser diodes also have a limited availability of wavelength choices. Using a ring dye laser, the beat wavelength can be extended to more than a hundred micrometers. In this section, the effectiveness of the optical phase unwrapping method with any type of light source is presented. The results of three-wavelength optical phase unwrapping using laser diodes are shown in Fig. 8 and the results obtained with a ring dye laser as the light source are shown in Fig. 9, Fig. 10 and Fig. 11.
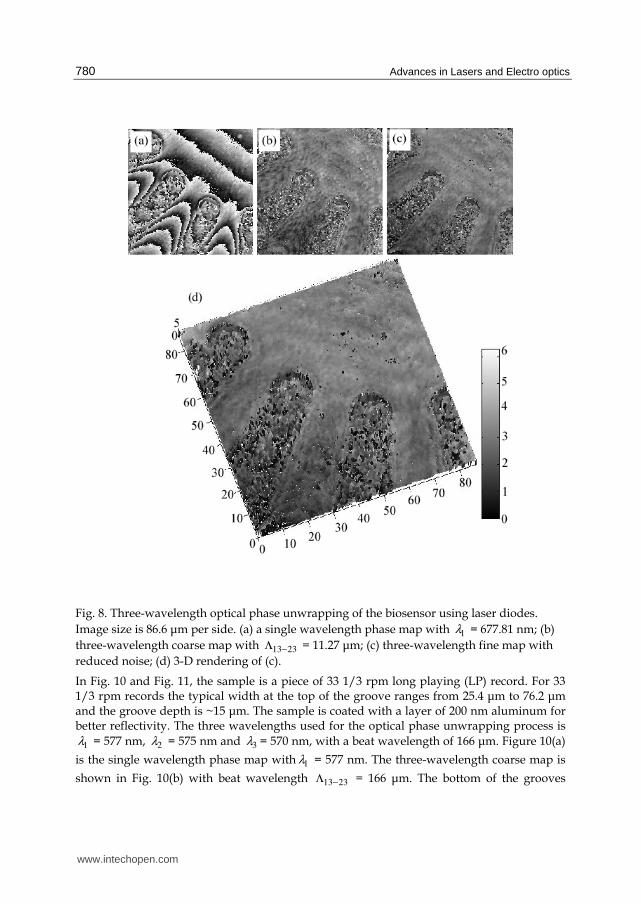
Figure 8 shows experimental results of three-wavelength optical phase unwrapping method
using laser diodes. The object here is a micro-electrode array biosensor with 16 gold
electrodes on a Pyrex glass substrate. The three wavelengths are 1λ = 677.81 nm, 2λ =
639.37 nm and 3λ = 636.89.81 nm with a beat wavelength of 13 23−Λ = 11.27 ┤m. Figure 8(a)
is the single wavelength phase map with 1λ = 677.81 nm. The three-wavelength coarse map
is shown in Fig. 8 (b). The final fine map with reduced noise is show in Fig. 8 (c), and the 3-D
rendering in Fig. 8 (d). The unwrapped phase map shows the grainy surface of electrodes. In Fig. 9, results show phase images of a sample of cheek cells (basal mucosa) illuminated
with a ring dye laser. The sample is illuminated by using wavelengths 1λ = 579 nm, 2λ =
577 nm and 3λ = 574 nm. The beat wavelength is 167 ┤m. The image size is 102 ┤m per side.
Here, Fig. 9(a) is the direct image of the cheek cell. Figure 9(b) shows the single wavelength
phase map obtained using 1λ = 579 nm. The coarse map produced by the three wavelengths
is shown in Fig. 9(c). The final fine map with reduced noise is shown in Fig. 9(d) and the 3-D
rendering of the final fine map is shown in Fig. 9(e).
www.intechopen.com
Advances in Lasers and Electro optics
780
Fig. 8. Three-wavelength optical phase unwrapping of the biosensor using laser diodes.
Image size is 86.6 ┤m per side. (a) a single wavelength phase map with 1λ = 677.81 nm; (b)
three-wavelength coarse map with 13 23−Λ = 11.27 ┤m; (c) three-wavelength fine map with
reduced noise; (d) 3-D rendering of (c).
In Fig. 10 and Fig. 11, the sample is a piece of 33 1/3 rpm long playing (LP) record. For 33 1/3 rpm records the typical width at the top of the groove ranges from 25.4 ┤m to 76.2 ┤m and the groove depth is ~15 ┤m. The sample is coated with a layer of 200 nm aluminum for better reflectivity. The three wavelengths used for the optical phase unwrapping process is
1λ = 577 nm, 2λ = 575 nm and 3λ = 570 nm, with a beat wavelength of 166 ┤m. Figure 10(a)
is the single wavelength phase map with 1λ = 577 nm. The three-wavelength coarse map is
shown in Fig. 10(b) with beat wavelength 13 23−Λ = 166 ┤m. The bottom of the grooves
www.intechopen.com
Quantitative Phase Imaging using Multi-wavelength Optical Phase Unwrapping
781
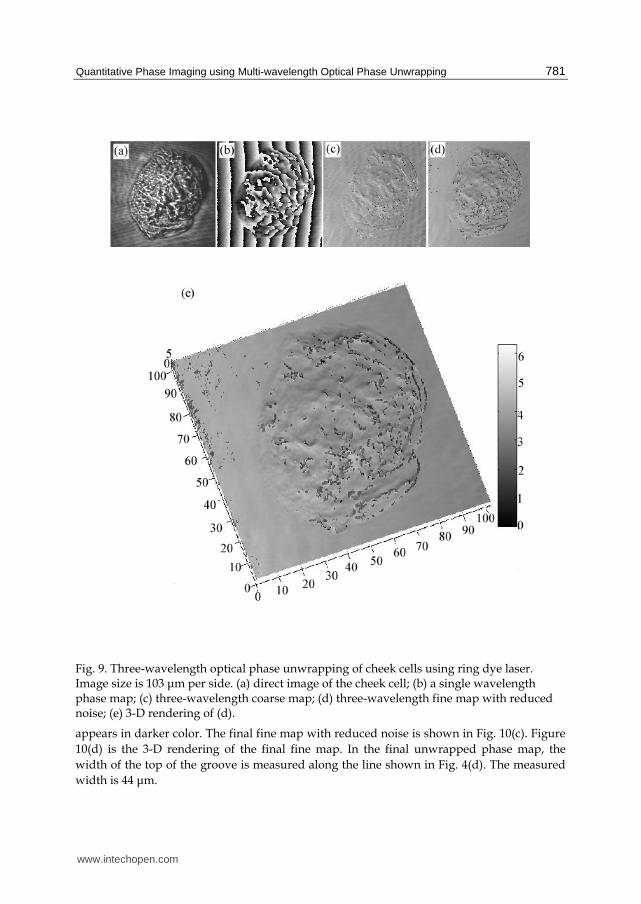
Fig. 9. Three-wavelength optical phase unwrapping of cheek cells using ring dye laser. Image size is 103 ┤m per side. (a) direct image of the cheek cell; (b) a single wavelength phase map; (c) three-wavelength coarse map; (d) three-wavelength fine map with reduced noise; (e) 3-D rendering of (d).
appears in darker color. The final fine map with reduced noise is shown in Fig. 10(c). Figure
10(d) is the 3-D rendering of the final fine map. In the final unwrapped phase map, the
width of the top of the groove is measured along the line shown in Fig. 4(d). The measured
width is 44 ┤m.
www.intechopen.com
Advances in Lasers and Electro optics
782
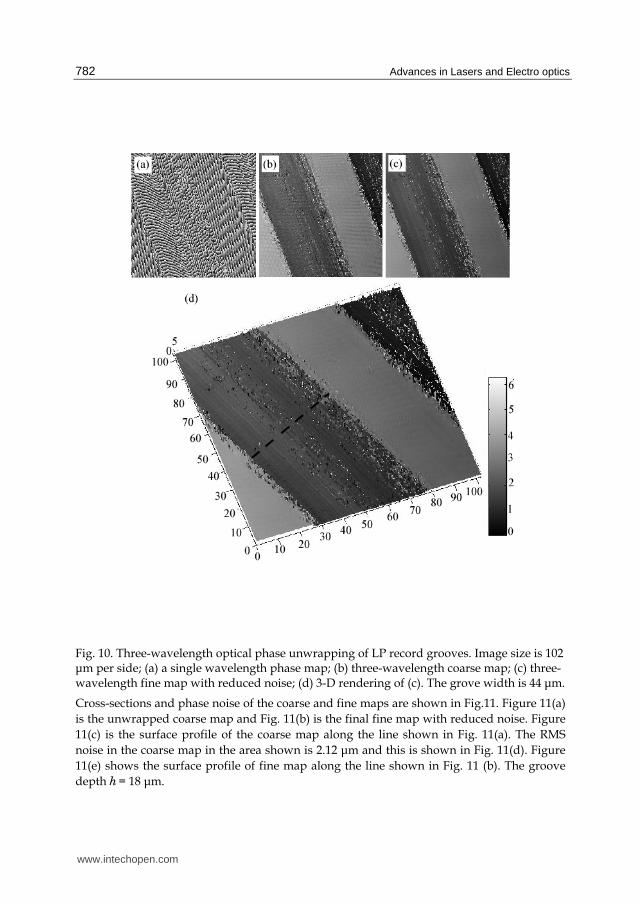
Fig. 10. Three-wavelength optical phase unwrapping of LP record grooves. Image size is 102 ┤m per side; (a) a single wavelength phase map; (b) three-wavelength coarse map; (c) three-wavelength fine map with reduced noise; (d) 3-D rendering of (c). The grove width is 44 ┤m.
Cross-sections and phase noise of the coarse and fine maps are shown in Fig.11. Figure 11(a)
is the unwrapped coarse map and Fig. 11(b) is the final fine map with reduced noise. Figure
11(c) is the surface profile of the coarse map along the line shown in Fig. 11(a). The RMS
noise in the coarse map in the area shown is 2.12 ┤m and this is shown in Fig. 11(d). Figure
11(e) shows the surface profile of fine map along the line shown in Fig. 11 (b). The groove
depth h = 18 ┤m.
www.intechopen.com
Quantitative Phase Imaging using Multi-wavelength Optical Phase Unwrapping
783
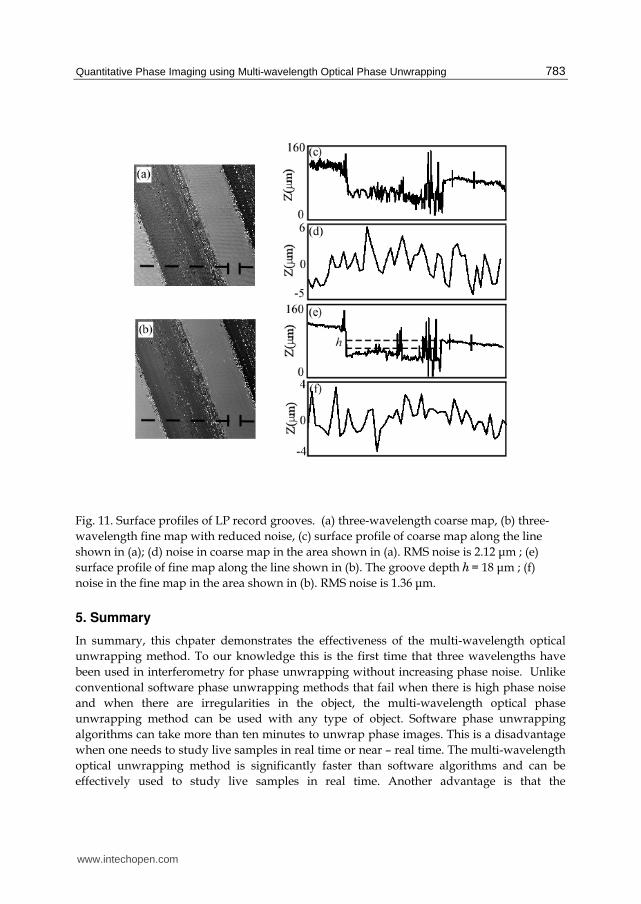
Fig. 11. Surface profiles of LP record grooves. (a) three-wavelength coarse map, (b) three-
wavelength fine map with reduced noise, (c) surface profile of coarse map along the line
shown in (a); (d) noise in coarse map in the area shown in (a). RMS noise is 2.12 ┤m ; (e)
surface profile of fine map along the line shown in (b). The groove depth h = 18 ┤m ; (f)
noise in the fine map in the area shown in (b). RMS noise is 1.36 ┤m.
5. Summary
In summary, this chpater demonstrates the effectiveness of the multi-wavelength optical
unwrapping method. To our knowledge this is the first time that three wavelengths have
been used in interferometry for phase unwrapping without increasing phase noise. Unlike
conventional software phase unwrapping methods that fail when there is high phase noise
and when there are irregularities in the object, the multi-wavelength optical phase
unwrapping method can be used with any type of object. Software phase unwrapping
algorithms can take more than ten minutes to unwrap phase images. This is a disadvantage
when one needs to study live samples in real time or near – real time. The multi-wavelength
optical unwrapping method is significantly faster than software algorithms and can be
effectively used to study live samples in real time. Another advantage is that the
www.intechopen.com
Advances in Lasers and Electro optics
784
optical phase unwrapping method is free of complex algorithms and needs less user
intervention.
The method is a useful tool for determining optical thickness profiles of various microscopic
samples, biological specimens and optical components. The optical phase unwrapping
method can be further improved by adding more wavelengths, thus obtaining beat
wavelengths tailored for specific samples.
6. References
Charette, P. G.; Hunter, I. W. (1996). Robust phase-unwrapping method for phase images
with high noise content. Applied Optics, Vol. 35, Issue 19, (July 1996), pp. 3506-3513,
ISSN 0003-6935.
Cheng, Y; Wyant, J. C. (1984). Two-wavelength phase shifting interferometry. Applied Optics,
Vol. 23, Issue 24, (December 1984), pp. 4539-4543, ISSN 0003-6935.
Cheng, Y.; Wyant, J. C. (1985). Multiple-wavelength phase-shifting interferometry. Applied
Optics, Vol. 24, Issue 6, (March 1985), pp. 804-807, ISSN 0003-6935.
Creath, K.; Cheng, Y.; Wyant, J. C. (1985). Contouring aspheric surfaces using two-
wavelength phase-shifting interferometry. Journal of Modern Optics, Vol. 32, No. 12,
(December 1985), pp. 1455-1464, ISSN 0950-0340.
Dilhaire,S.; Grauby, S.; Jorez, S.; Lopez, L. D. P.; Rampnoux, J.; Claeys, W. (2002). Surface
displacement imaging by interferometry with a light emitting diode. Applied Optics,
Vol. 41, Issue 24, pp.4996-5001, (August 2002),ISSN 0003-6935.
De Groot, P.; Kishner, S. (1991). Synthetic wavelength stabilization for two color laser-diode
interferometry. Applied Optics, Vol. 30, Issue 28, pp 4026-4033 (October 1991), ISSN
0003-6935.
Fedeyev, V.; Haber, C. C. (2003). Reconstrcution of mechanically recorded sound by image
processing. LBNL Report 51983, 2003.
Fercher, A.; Drexler, W.; Hitzenberger, C. K.; Lasser, T. (2003). Optical coherence
tomography - principles and applications. Reports on Progress in Physics, Vol. 66, pp.
239-303 (January 2003).
Gass, J.; Dakoff, A.; Kim, M. K. (2003). Phase imaging without 2π ambiguity by
multiwavelength digital holography. Optics Letters, Vol. 28, Issue 13, (July 2003),
pp. 1141-1143, ISSN 0146-9592.
Ghiglia,D. C.; Romero, L. A. (1994). Robust two-dimensional weighted and unweighted
phase unwrapping that uses fast transforms and iterative methods. Journal of the
Optical Society of America A, Vol. 11, No. 1, (January 1994), pp. 107-117, ISSN 1084-
7529.
Ishii, Y.; Onodera, R. (1995). Phase-extraction algorithm in laser-diode phase shifting
interferometry. Optics Letters, Vol. 20, Issue 18, pp. 1883-1885 (September 1995),
ISSN 0146-9592.
Liu, J.; Yamaguchi, I. (2000). Surface profilometry with laser-diode optical feedback
interferometer outside optical benches. Applied Optics, Vol. 39, Issue 1, pp. 104-107
(January 2000), ISSN 0003-6935.
Lukashkin,A. N.; Bashtanov, M. E.; Russell, I. J. (2005). A self-mixing laser diode
interferometer for measuring basilar membrane vibrations without opening the
www.intechopen.com
Quantitative Phase Imaging using Multi-wavelength Optical Phase Unwrapping
785
cochlea. Journal of Neuroscience Methods, Vol. 148, Issue 2, pp. 122-129 (October
2005), ISSN 0735-7044.
LuxeonTM Emitter and Star sample information AB11, 2 (Feb 2002).
Meiners-Hagen, K.; Burgarth, V.; Abou-Zeid, A. (2004). Profilometry with a multi-
wavelength diode laser interferometer. Measurement Science & Technology, Vol. 15,
No. 4, (April 2004), pp. 741-746, ISSN 0957-0233.
Montfort, F.; Colomb, C.; Charriere, F.; Kuhn, J.; Marquet, P.; Cuche, E.; Herminjard, S.;
Depeursinge, C. (2006). Submicrometer optical tomography by multi-wavelength
digital holographic microscopy. Applied Optics, Vol. 45, Issue 32, (November 2006),
pp. 8209-8217, ISSN 0003-6935.
Onodera, R.; Ishii, Y. (1996). Phase-extraction analysis of laser-diode phase shifting
interferometry that is insensitive to changes in laser power. Journal of the
Optical Society of America A, Vol. 13, Issue 1, pp. 139-146 (January 1996), ISSN 1084-
7529.
Parshall, D; Kim, M. K. (2006). Digital holographic microscopy with dual wavelength phase
unwrapping. Applied Optics, Vol. 45, Issue 3, (January 2006), pp. 451-459, ISSN 0003-
6935.
Polhemus,C. (1973). Two-wavelength interferometry. Applied Optics, Vol. 12, Issue 9,
(September 1973), pp. 2071-2074, ISSN 0003-6935.
Repetto, L.; Piano, E.; Pontiggia, C. (2004). Lensless digital holographic microscope with
light-emitting diode illumination. Optics Letters, Vol. 29, Issue 10, pp. 1132-1134
(May 2004), ISSN 0146-9592.
Schnars, U; Jueptner, W. (2005). Digital Holography – Digital Hologram Recording, Numerical
Reconstruction, and Related Techniques, Springer, ISBN 354021934X, Berlin
Heidelberg.
Servin, M.; Marroquin, J. L.; Malacara, D; Cuevas, F. J. (1998). Phase unwrapping with a
regularized phase-tracking system. Applied Optics, Vol. 37, No. 10, (April 1998), pp.
1917-1923, ISSN 0003-6935.
Tziraki, M.; Jones, R.; French, P. M. W.; Melloch, M. R.; Nolte, D. D. (2000). Photorefractive
holography for imaging through turbid media using low coherent light. Applied
Physics B, Vol. 70, No. 1, (January 2000), pp. 151-154, ISSN 0946-2171.
Wagner, C.; Osten, W.; Seebacher, S. (2000). Direct shape measurements by digital
wavefront reconstruction and multiwavelength countoutring. Optical Engineering,
Vol. 39, Issue 1, (January 2000), pp. 79-85, ISSN 0091-3286.
Warnasooriya, N.; Kim, M. K. (2006). Multi-wavelength Phase Imaging Interference
Microscopy. Proceedings of SPIE – Volume 6090 Three-Dimensional and
Multidimensional Microscopy: Image Acquisition and Processing XIII, pp. 60900U-1 -
60900U-8, SPIE, January 2006, San Jose, California, USA.
Warnasooriya, N.; Kim, M. K. (2007). LED-based multi-wavelength phase imaging
interference microscopy. Optics Express, Vol. 15, Issue 15, (July 2007), pp. 9239-9247,
ISSN 1094-4087.
Warnasooriya, N.; Kim, M. K. (2009). Quantitative phase imaging using three-wavelength
optical phase unwrapping, Journal of Modern Optics, Vol. 56, No. 1, (January 2009),
pp; 85-92, ISSN 0950-0340.
www.intechopen.com
Advances in Lasers and Electro optics
786
Wyant,J. C. (1971). Testing aspherics using two-wavelength holography. Applied Optics, Vol.
10, Issue 9, (September 1971), pp. 2113-2118, ISSN 0003-6935.
www.intechopen.com
Advances in Lasers and Electro OpticsEdited by Nelson Costa and Adolfo Cartaxo
ISBN 978-953-307-088-9Hard cover, 838 pagesPublisher InTechPublished online 01, April, 2010Published in print edition April, 2010
InTech EuropeUniversity Campus STeP Ri Slavka Krautzeka 83/A 51000 Rijeka, Croatia Phone: +385 (51) 770 447 Fax: +385 (51) 686 166www.intechopen.com
InTech ChinaUnit 405, Office Block, Hotel Equatorial Shanghai No.65, Yan An Road (West), Shanghai, 200040, China
Phone: +86-21-62489820 Fax: +86-21-62489821
Lasers and electro-optics is a field of research leading to constant breakthroughs. Indeed, tremendousadvances have occurred in optical components and systems since the invention of laser in the late 50s, withapplications in almost every imaginable field of science including control, astronomy, medicine,communications, measurements, etc. If we focus on lasers, for example, we find applications in quite differentareas. We find lasers, for instance, in industry, emitting power level of several tens of kilowatts for welding andcutting; in medical applications, emitting power levels from few milliwatt to tens of Watt for various types ofsurgeries; and in optical fibre telecommunication systems, emitting power levels of the order of one milliwatt.This book is divided in four sections. The book presents several physical effects and properties of materialsused in lasers and electro-optics in the first chapter and, in the three remaining chapters, applications of lasersand electro-optics in three different areas are presented.
How to referenceIn order to correctly reference this scholarly work, feel free to copy and paste the following:
Nilanthi Warnasooriya and Myung K. Kim (2010). Quantitative Phase Imaging Using Multi-Wavelength OpticalPhase Unwrapping, Advances in Lasers and Electro Optics, Nelson Costa and Adolfo Cartaxo (Ed.), ISBN:978-953-307-088-9, InTech, Available from: http://www.intechopen.com/books/advances-in-lasers-and-electro-optics/quantitative-phase-imaging-using-multi-wavelength-optical-phase-unwrapping

© 2010 The Author(s). Licensee IntechOpen. This chapter is distributedunder the terms of the Creative Commons Attribution-NonCommercial-ShareAlike-3.0 License, which permits use, distribution and reproduction fornon-commercial purposes, provided the original is properly cited andderivative works building on this content are distributed under the samelicense.