quantitative leak test design guide
TRANSCRIPT

I
QUANTITATIVE LEAK TEST DESIGN GUIDE
bY J. L. Ma nga na ro D. L. Hol l inger GPO PRICE $
CFSTl PRICE(S) $
August 1967
ff 653 July65
Final Repor
S-67-1128
S C H E N E C T A D Y , N E W Y O R K

QUANTITATIVE LEAK TEST DESIGN GUIDE
August 1967
Prepared for
JET PROPULSION LABORATORY CALIFORNIA INSTITUTE O F TECHNOLOGY
4800 OAK GROVE DRIVE PASADENA, CALIFORNIA 91103
Prepared by
J. L. Manganaro P. L. Hollinger
Research and Development Center General Electric Company
Schenectady, New York 12305
This work was pedwmed for the j e t Proputsion Labontory, Cetifoda Institute of Technology, sponsored by the National Aeronmtics and Space Administration under Contract NAS7-100.
JPL Technical Representative: Edgar Koch

FOREWORD
This final report, "Quantitative Leak Test De- I 1 sign Guide,
Laboratory, California Institute of Technology, Pasadena, California. The work was performed by J, L. Manganaro of the Electrochemical Systems Branch of the Chemical Systems and Processes Laboratory of the General Electric Research and Development Center, Schenectady, New York and D. L. Hollinger of the Plastics Process Development Operation of the Manufacturing Engineering Service of the General Electric Company, Schenectady, New York. 7 August 1967 under Contract No. 951763.
was prepared for the Jet Propulsion
It was done between 8 December 1966 and
ii
TABLEOFCONTENTS
Section
1
2
3
4
5
6
7
SUMMARY . . . . . . . . . . . . . . . . . . . . INTRODUCTION . . . . . . . . . . . . . . . . . SYMBOLS . . . . . . . . . . . . . . . . . . . . . . TEST EQUIPMENT . . . . . . . . . . . . . . . .
Steady Leak Flow Calibrator System . . . . . . Enclosure . . . . . . . . . . . . . . . . . .
SYSTEM CHARACTERISTICS
Circulation and Diffusion of Helium in . E ~ C ~ Q s.ur.e , System Linearity . . . . . . . . . . . . . . . System Stability . . . . . . . . . . . . . . . Effect of Leak and Probe Position System Sensitivity . . . . . . . . . . . . . .
. . . . . . .
SUMMARY OF EXPERIMENTAL TEST RESULTS . . Comparison Method . . . . . . . . . . . . . . Superposition Method . . . . . . . . . . . . . Injection Method . . . . . . . . . . . . . . .
CONCLUSIONSANDRECOMMENDATIONS . . . . . Appendix I .. DATA FOR SUPPLIED LEAKS . . . .
Page
1
3
5
7
7 10
15
15 18 18 20 22
25
25 27 29
3 3
35

LIST OF ILLUSTRATIONS
Figure
1
2
3
4
5
6
7
8 .
9
10
Page
8 Schematic of Ballast Tank Calibrator . . . . . . . . . Comparison of Mixing With and Without Fan . . . . . . 1 6
Experimental Run Showing the EXfect of a Fan on Mixing and also the Effect of a Hole in the Enclosure . . . 17
Scale Linearity Test . . . . . . . . . . . . . . . . 19
Injection Method With Probe and Leak Interchanged . . 2 1
Detector Sensitiv’ityversus Tube P r e s s u r e . . . . . . . 23
Comparison Method D a t a . . . . . . . . . . . . . . 26
Superposition Method Data. . . . . . . . . . . . . . 28
Injection Method Data . . . . . . . . . . . . . . . . 30
Data fo r Supplied Leaks . . . . . . . . . . . . . . . 36
LIST OF TABLES
Figure Page
18 1 Scale Linearity Data Increments . . . . . . . . . . . 2 Flow Rates and Percent Differences . . . . . . . . . 20
3 Injection Method Data. . . . . . . . . . . . . . . . 31
iv

Section 1
I SUMMARY
The object of this report is to document the performance of equipment for estimating leak rates by a calibrated enclosure technique, and to report the results of experimental t es t s run with this equipment. procedure is also outlined. The equipment w a s designed and fabricated for and delivered to the Jet Propulsion Laboratory under Contract No. 951763. The major items of hardware delivered under this contract were:
An operating
I
Steady leak flow calibrating system
Set of three leaks with f i l ters to span the range from
0 Enclosure including a rigid LEXAN frame, a polyvinyl chloride bag, and a lifting harness
to cubic centimeters atmosphere pe r second
Syringe for the injection testing method
Calibrating pipet ' .
A "Quantitative Tes t Design Guide, I t including a suggested operating pro- cedure and a technical discussion of the equipment was also written.
~
In this report the results a r e given of an investigation of the following system characterist ics: circulation and diffusion of helium, system linearity, system stability, the effect of leak and proper position, and sysiei'n sensitivity. Three experimental procedures for leak testing with this equipment were investigated: comparison method, superposition method, and an injection method. The methods a r e compared and data a re given for each.
The Injection Method proved to be the easiest and most rapid. Leaks ranging f rom 14.4 to 99.2 cubic centimeters (standard temperature and pressure) per hour were detected with an average accuracy of 10 percent in the delivered enclosure which had a volume of 231 cubic feet. Testing t imes f o r the runs ranged f rom 2 to 4 hours. adequate f o r mixing i n the enclosure. The detector system exhibited a h e a r response over the helium concentration range investigated. operation was obtained over a period of several hours. ing the probe and leak positions was observed. 15p and a tube pressure of 4 x 10⁻⁶ torr , 15palpatrn He.
A small office f a n was found
Stable
At a manifold pressure of NO effect of chang-
'the leak detector sensitivity was
1

rpAECEDiNG PAC5 BLANK NOT FILMED. Section 2
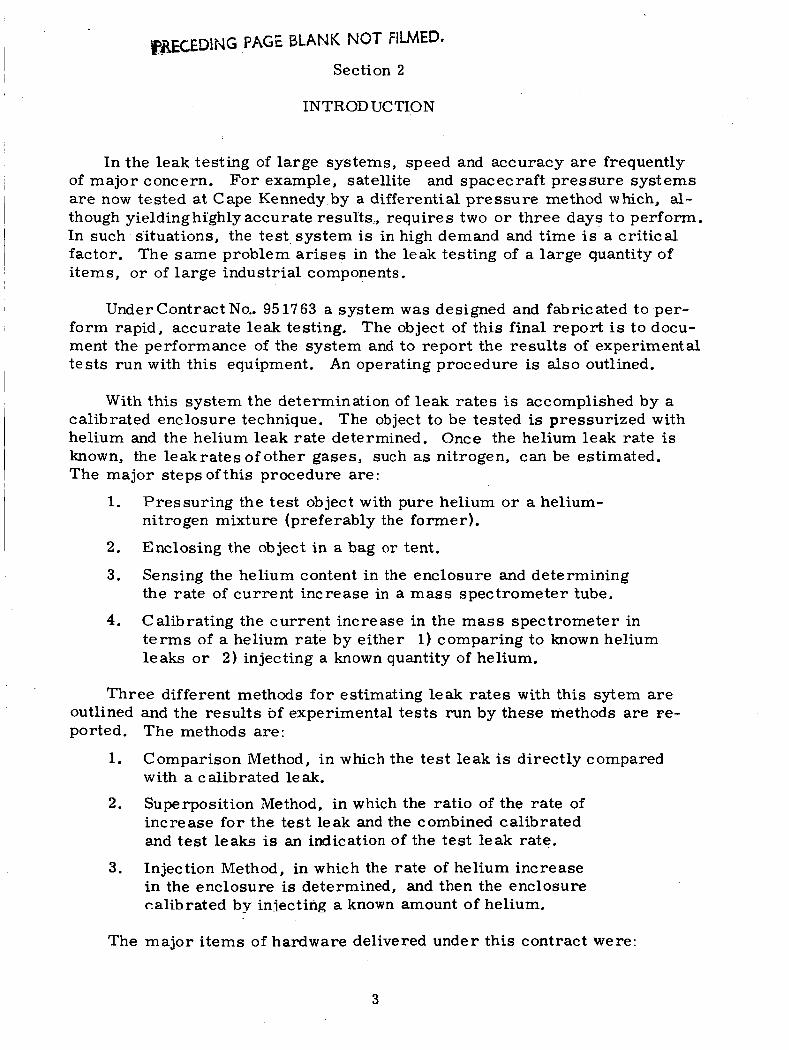
INTRODUCTION
In the leak testing of large systems, speed and accuracy are frequently of major concern. For example, satellite and spacecraft p ressure systems are now tested at Cape Kennedy by a differential p ressure method which, al- though yieldinghi'ghly accurate results., requires two o r three days to perform. In such s'ituations, the tes t ,system is i n high demand and t ime is a crit ical factor. The same problem a r i se s in the leak testing of a large quantity of items, or of large industrial components.
UnderContractNo.. 951763 a system w a s designed and fabricated to per- form rapid, accurate leak testing, The object of this final report is to docu- ment the performance of the system and to report the resul ts of experimental tes ts run with this equipment. An operating procedure is also outlined.
With this system the determination of leak ra tes is accomplished by a calibrated enclosure technique. helium and the helium leak rate determined. Once the helium leak rate is known, the leakra tesofo ther gases, such as nitrogen, can be estimated. The major steps of this procedure are:
The object to be tested is pressurized with
1.
2.
3.
Pressuring the test object with pure helium o r a helium- nitrogen mixture (preferably the former).
Enclosing the object in a bag o r tent.
Sensing the helium content in the enclosure and determining the rate of current increase in a mass spectrometer tube.
Calibrating the current increase in the m a s s spectrometer in t e r m s of a helium rate by either 1) comparing to known helium leaks o r 2) injecting a known quantity of helium.
4.
Three different methods f o r estimating leak ra tes with this sytem a re outlined and the results bf experimental tes ts run by these methods a re pe- ported. The methods are:
1. Comparison Method, in which the test leak is directly compared with a calibrated leak.
Superposition Method, in which the ratio of the rate of increase for the test leak and the combined calibrated and test leaks is an indication of the test leak rate.
Injection Method, in which the rate of helium increase in the enclosure is determined, and then the enclosure calibrated by injecting a known amount of helium.
2.
3.
The major i tems of hardware delivered under this contract were:
3

Steady leak flow calibrating sys t em
Set of three leaks with fi l ters to span the range from to
Enclosure including a rigid LEXAN frame , a polyvinyl chloride bag, and a lifting harness
Syringe for the Injection Testing Method
C alib rating pipet
cubic centimeters atmosphere pe r second
A "Quantitative Leak Tes t Design Guide" w a s written. scription and theoretical discussion of the operating and testing procedures, the "Design Guide'' has :
In addition to a de-
D e s i g n Cr i te r ia for the Enclosure and Calibrator
Discussion of Various Test Procedures with Actual Data
Discussion of E r r o r Analysis
Discussion of Leak Rate as a Function of Gas Composition and Pressure, and Leak Structure
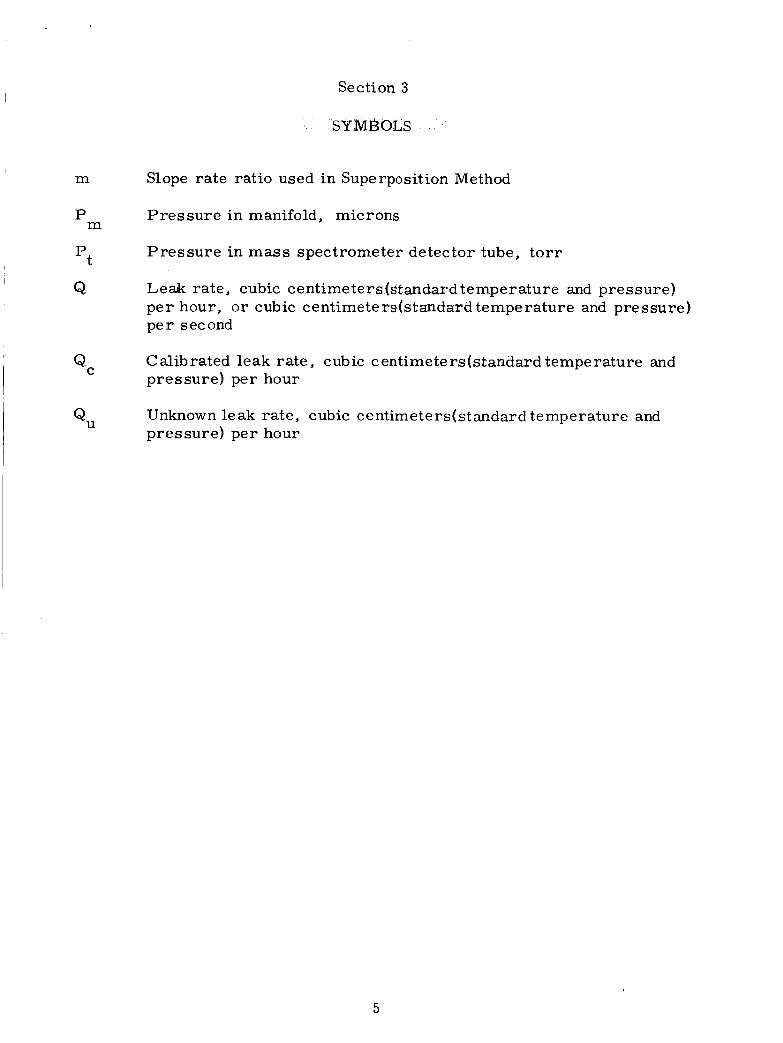
Section 3
SY MI20LS
m Slope rate ratio used in Superposition Method
I Pressu re in manifold, microns I m P
Pres su re in m a s s spectrometer detector tube, t o r r
Leak rate, cubic centimeters(standard temperature and pressure) p e r hour, o r cubic centimeters(standard temperature and pressure) pe r s ec ond
Pt I Q
I Calibrated leak rate , cubic centimeters(standard temperature and pressure) per hour C
Q
Unknown leak rate , cubic centimeters(standard temperature and pressure) per hour U
Q
5

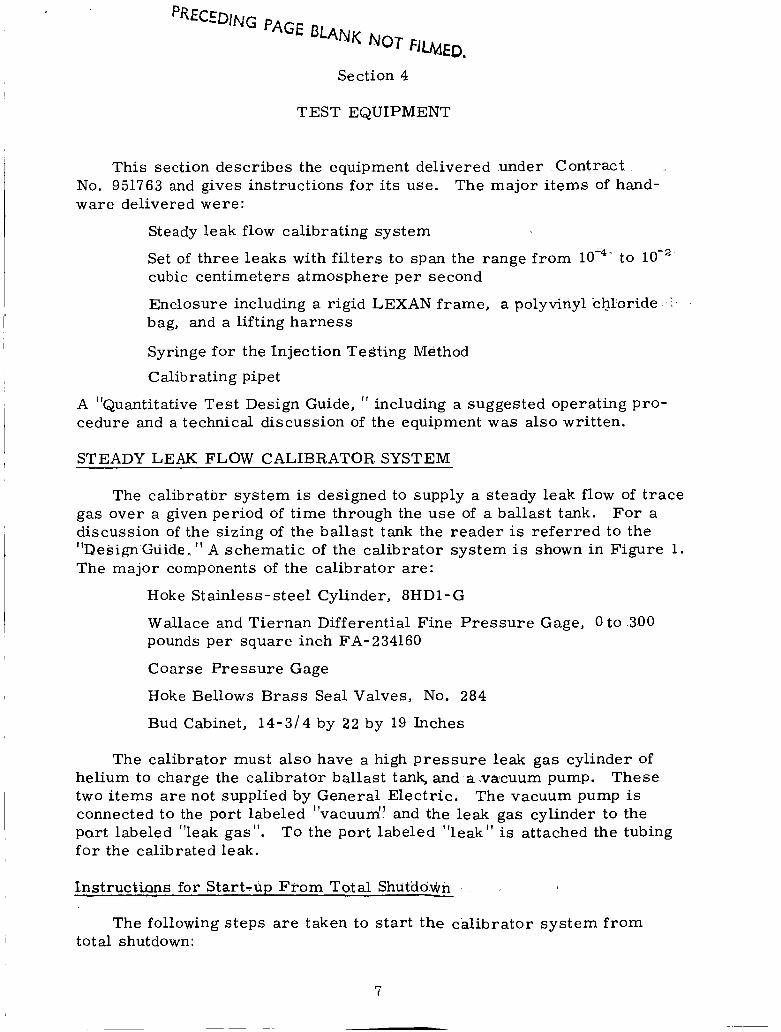
Section 4
TEST EQUIPMENT
This section describes the equipment delivered under Contract No. 951763 and gives instructions for i t s use. ware delivered were:
The major i tems of hand-
Steady leak flow calibrating system
Set of three leaks with f i l ters to span the range f r o m lov4- to cubic centimeters atmosphere pe r second
Enclosure including a rigid LEXAN frame, a polyvinyl 'chloride '
bag, and a lifting harness
Syringe for the Injection Testing Method
Calibrating pipet
A "Quantitative Test Design Guide, cedure and a technical discussion of the equipment was also written.
II including a suggested operating pro-
STEADY LEAK FLOW CALIBRATOR SYSTEM
The calibratbr system is designed to supply a steady leak flow of t race gas over a given period of time through the use of a ballast tank. discussion of the sizing of the ballast tank the reader is referred to the "Design Guide,, I ' A schematic of the calibrator system is shown in Figure 1. The major components of the calibrator are:
Fo r a
Hoke Stainless- steel Cylinder, 8HD1 -G
Wallace and Tiernan Differential Fine P res su re Gage, 0 to 3QO pounds per square inch FA-234160
Coarse Pressure Gage
Hoke Bellows Brass Seal Valves, No. 284
Bud Cabinet, 14-3/4 by 2 2 by 19 Inches
The calibrator must also have a high p res su re leak gas cylinder of helium to charge the calibrator ballast tank, and a vacuum pump. two items a r e not supplied by General Electric. connected to the part labeled I'vacuud' and the leak gas cylinder to the part labeled "leak gas". fo r the calibrated leak.
These The vacuum pump is
To the port labeled 'lleak" is attached the tubing
hs t ruc t i ans for Start-up From Total ShutdovLn
The following steps a r e taken to s tar t the calibrator system f rom total shutdown:
7

Vacuum Leak G a s
B a l l a s t Tank
Vent F i n e
P r e s s u r e Gage
Figure 1. Schematic of Ballast Ts.nk Calibrator.
8

1.
2.
3.
4.
The vacuum pump, leak gas cylinder, and leak are attached to the cyl- inder, then opened. the Bourdon tube in the fine gage. gage to read approximately - 14,7 pounds pe r square inch. not, however, harmful. The coarse pressure gage may also be used in this step as a means of indicating when a sufficiently low pressure has been achieved in the system, i t was not believed that the fine gage could be subjected to vacuum, hence the use of the coarse , combination gage. The system should be evacuated for five minutes after the fine gage indicates - 14.7 pounds per square inch.
The leak gas cylinder is isolated from the calibrator for this s tep by attaching a valve and regulator to the leak gas cylinder. The regula- t o r is set to deliver 250 pounds pe r square inch to the calibrator. Thus, during the evacuation, the air in the tube leading from the leak gas valve to the valve of the leak gas cylinder is also evacuated.
The vacuum, ballast tank, leak gas,and fine gage valves are
Vacuum causes the fine pressure Opening of the fine gage valve permits evacuation of
This is
When the calibrator w a s designed
The vacuum and leak gas valves are closed,and the leak gas cylinder valve is opened. The leak gas valve of the calibrator is opened, ad- mitting helium to a pressure of about 100 pounds per square inch, slowly, so that the precision gage is not surged. ing to the leak, which is a capper tubing extension, is opened. The Swagelok fitting holding the appropriate calibrated leak is loosened , in order to purge the leak and i t s surroundings of any occluded air, and then tightened. may be repeated to completely remove all a i r .
Next the valve lead-
In starting from total shutdown steps 1 and 2
The leak gas pressure , as read on the fine pressure gage, is ad- justed to the level which w i l l produce the desired flow rate by means of the vent and/or leak gas valves, lowed for the system to achieve p res su re equilibrium, w i l l tend to overshoot and gradually decay to a steady value. system should not be pressurized above 200 pounds per square inch. With the leaks supplied this w i l l be sufficient t o span the leak range of interest. P r e s s u r e s greater than 300 pounds p e r square inch w i l l ruin the fine pressure gage i f the protection valve is open.
About one minute should be al- The pressure
The
Once the pressure has been adjusted and the valve to the leak opened, t h e calibrator is ready to deliver a given flow rate .
Instructions fo r Par t ia l Shutdown
Less t ime is taken to s ta r t the cal ibrator system from a state of par- t ial shutdown than from one of total shutdown. In a state of partial shut- down the ballast tank remains charged with leak gas . The only parts of the system which see a i r are the copper tubes running between the ports and valves for the vacuum, the leak gas, and the leak. Par t ia l shutdown is readily achieved by:
9

1. Maintaining a positive leak gas pressure while closing all valve s
Disconnecting the leads to the ports 2.
It may be convenient to ship the calibrator in this state.
Instructions for Start-up from Partial Shutdown
The following steps a r e taken to s t a r t the calibrator system from
1.
partial shutdown:
The vacuum pump, leak gas cylinder, and leak are attached to calibrator.
2. With all valves originally closed, the vacuum and leak gas valves a r e opened. This evacuates the tubing up to the leak gas cylinder and ballast tank, whose valves remain closed.
3. The vacuum and leak gas valves a r e closed. der valve is opened.
The leak gas cylin-
4. The ballast tank and pressure gage valves a r e opened and the pressure is adjusted to desired level in the usual manner.
Instructions for Total Shutdown
A l l contained leak gas is released and the valves a r e closed.
ENCLOSURE
Gene ra l Requirements
The requirements fo r an enclosure to confine and allow measurement A constant, of the gas escaping from leaks in a space vehicle a r e simple.
but not necessarily known, f ree volume and a low, but not necessarily zero, permeability to helium a r e the principal process-defined needs. The volume is fixed by the dimensions of the various space vehicles to be tested, and the upper limit on bag permeability and porosity is a function of the free volume, anticipated leak rate, and testing time available. The values for these parameters which were supplied by Je t Propulsion Labor- a tory.are: ment of leak rates in the range 1 / 2 to 100 cubic centimeters p e r hour, with testing times less than 24 hours. Penetrations into the bag for connection to measuring instruments, calibrated leaks, and a i r circulating devices w e r e anticipated.
f ree volume of between 10 and 1000 cubic feet, for measure-
The shape of the enclosure was not specified. ing reasons a cylindrical design is desirable. with the shapes of the space vehicles to be tested.
For practical engineer-
To make the developmental This shape is compatible
10

bag usable for testing at least one current , specific space vehicle, a cyl- indrically shaped bag, 66 inches in diameter and 117 inches high was decided upon. adjacent to the space vehicle test site and lowered over the vehicle by crane facilities.
The enclosure is to be completely assembled in an area
Hence, a reasonable degree of form stability is necessary.
D esi gn Consider ations
In addition to the general requirements mentioned above, these factors were also considered in arriving at a suitable design for the enclosure:
1.
2.
3.
4.
5.
The enclosure should be easi ly adaptable to existing tes t facili- t ies in a number of different locations. It should be essentially self-contained, or require almost no on- si te par t s acquisition, except such mater ia ls as ladders and standard hand tools.
Assembly and disassembly of the complete enclosure should be simple. I t should require not more than a couple of hours to se t up o r take down.
Al l par t s should be reducible to relatively smal l packaging s ize for shipping. kept to a minimum.
The number of easi ly lost small par ts should be
The enclosure should be durable enough to withstand repeated assembly, disassembly, repackaging, and shipping without developing porosity. Procedures should be available to re- pair damage.
Transparency of the enclosure w a s not considered a pr imary requi re me nt .
Design and Fabrication Procedures
The volume within the bag, i t was decided, would be controlled almost entirely by means of a rigid frame. drawn over this f rame would provide the impermeable gas ba r r i e r . complete enclosure would be comprised of four major components:
A conforming, flexible plastic bag The
Semirigid, plastic, cylindrical frame
Rigid reinforcing rings for the cylindrical f r ame ends
Flexible plastic bag
Lifting harness
Semirigid Plastic Cylindrical .Frame
The enclosure frame is a cylinder of LEXAN plastic sheet, 66 inches in diameter and 117 inches high, with a wall thickness of 0.090 inch.
1 1
LEXAN was chosen as the frame material because i t is tough enough to re- s is t damage from repeated handling, because i t has dimensional stability including lack of creep at service temperatures, and because i t is self-ex- ti ngu i s hing .
The cylinder is assembled from five smaller , flat sheets of LEXAN, four measuring 48 inches by 117 inches and a fifth measuring 31 inches by 117 inches. Since the largest size sheet available in smal l quantities was 48 by 96 inches, the 117-inch long panels were made up by bonding on ex- tensions with a polyurethane adhesive, Adiprene L- 100 by DuPont, cured with 11 parts by weight of methylenebis(oFthochloroal?iline).Each sheet, o r panel, has a s e r i e s of Quick-Lock fasteners attached permanently along the two long edges. cylinder and a r e operated by a one-quarter turn with a common screw- dr iver .
These bind the panels together to form the complete
Rigid Reinforcing Rings
To maintain the cylinder in an accurately round shape, reinforcing rings of fiberglass laminate a re bolted inside to i t s top and bottom. These rings a r e composed of six overlapping segments, bolted together, and have an essentially L-shaped c r o s s section. cause the desired shape could be obtained with low tooling cost. inforcing rings could also be aluminum.
Fiberglass is used primarily be- The re-
Polyvinyl Chloride Bag
A tailored plastic bag made of polyvinyl chloride film, 0.020 inch thick, is placed over the frame. The bag has reasonably low gas permea- bility, has good strength and toughness, can be readily obtained in heavy gages and large sheet widths, is self-extenmishing, lends itself well to fabricatian by heat sealing, and has a useful degree of elasticity and flexi- bility.
A separate sheet of the same polyvinyl chloride mater ia l is supplied f o r use as a floor covering. It is to be placed beneath the test vehicle in locations where the existing floor does not lend itself to forming a seal with the bag. direct ly to the asphalt tile floor, using black vinyl plastic tape.
In the test work done a t General Electric, the bag was taped
Lifting Harness
A nylon rope lifting harness is supplied to facilitate the positioning of the enclosure over a space vehicle. s u r e and the th’ree hooks of the h r n e s s a re inserted into the holes i n ’ the LEXAN f rame and the bottom reinforcing ring.
The harness is placed over the enclo-
The s teel ring at the top of this harness may then clnsure lifted into position. t u re when the bottom seal is the outside.
be picked up by a crane arid L h t . C G i i i p I e t C 22-
The three hooks a r e released from the struc- made, but the harness remains in position on
12

The only hardware which is not permanently attached to the major pieces of this equipment a re some 5 / 1 6 - 18 x 3/4 inch long pan head machine screws and matching nuts. The& a r e used to fasten the reinfor-
I cing ring segments together and to fasten the rings to the LEXAN panels.
Since the polyvinyl chloride bag fits ra ther tightly over the LEXAN frame, it is not feasible to align the same small holes made through these two hard- wares for instrument penetrations in subsequent runs. It is recommended that, when the instrumentation is withdrawn at the end of a run, the holes in the polyvinyl chloride bag be seaIed with either polyvinylL chloride
'
pressure sensitive tape o r small patches of the floor piece mater ia l applied wit'n vinyl plastic cement, f o r example, VC-2 by Schwartz Chemical Com- pany, Inc . , Long Island City, New York. When the next run is to be made, new holes can easily be made in the polyvinyl chloride bag to coincide with the existing holes in the LEXAN frame.
I Enclosure Ventilation
The contents of the enclosure may be exhausted by lifting the structure from the floor o r plastic sheet and ventilating by means of fans o r blowers.
mater ia l to a height of about four feet from the floor. l es t LEXAN panel to be opened at the bottom by releasing about four disconnect screws along a side. fans inside the enclosure a re operating w i l l ventilate the system in 15 to 30 minutes.
Ventilation may also be accomplished by raising the polyvinyl chloride bag . I
This enables the smal- '
Leaving the panel partially open while the
Blowers may be used to speed ventilation.
13


Iq?BECEMNG PAGE BLANK NOT FILMED. Section 5
SYSTEM CHARACTERISTICS
The following system characterist ics were investigated with the equip- ment designed and fabricated under this contract:
0 Circulation and Diffusion of Helium In Enclosure
0 System Linearity
0 System Stability
Effect of Leak and Probe Position
0 System Sensitivity
CIRCULATION AND DIFFUSION O F HELIUM I N ENCLOSURE
In o rde r to gain a better understanding of the mixing effectiveness within the enclosure, a fixed quantity of helium (5 cubic centimeters) w a s injected into the bag for two cases:
1. Fan operating
2. Fan not operating
The results of this test a re shown in Figure 2 .
The sniffer probe w a s placed about 7 feet from the point of injection. The response of the leak detector was almost instantaneous'hitl? the fan on (Figure 2A). The overshoot may have been due to a "pocket'' of helium being car r ied along the enclosure w a l l s to the probe and then mixed, since both the probe and injection were located near the wal l . Mixing appeared complete, when determined by a steady-state value, within two minutes. Therefore, the single household fan employed appeared to be adequate f o r the enclosure volume of 231 cubic feet.
Figure 2B shows the response obtained fo r injecting 5 cubic cent imeters of helium w i t h the fan off. tected. The profile of the response indicated that the helium in fact t r a - veled as a "pocket" and was gradually dispersed by diffusion and convec- tion. within five minutes.
Within 45 seconds a "pocket" of helium w a s de-
Steady- state o r complete mixing was achieved for this situation
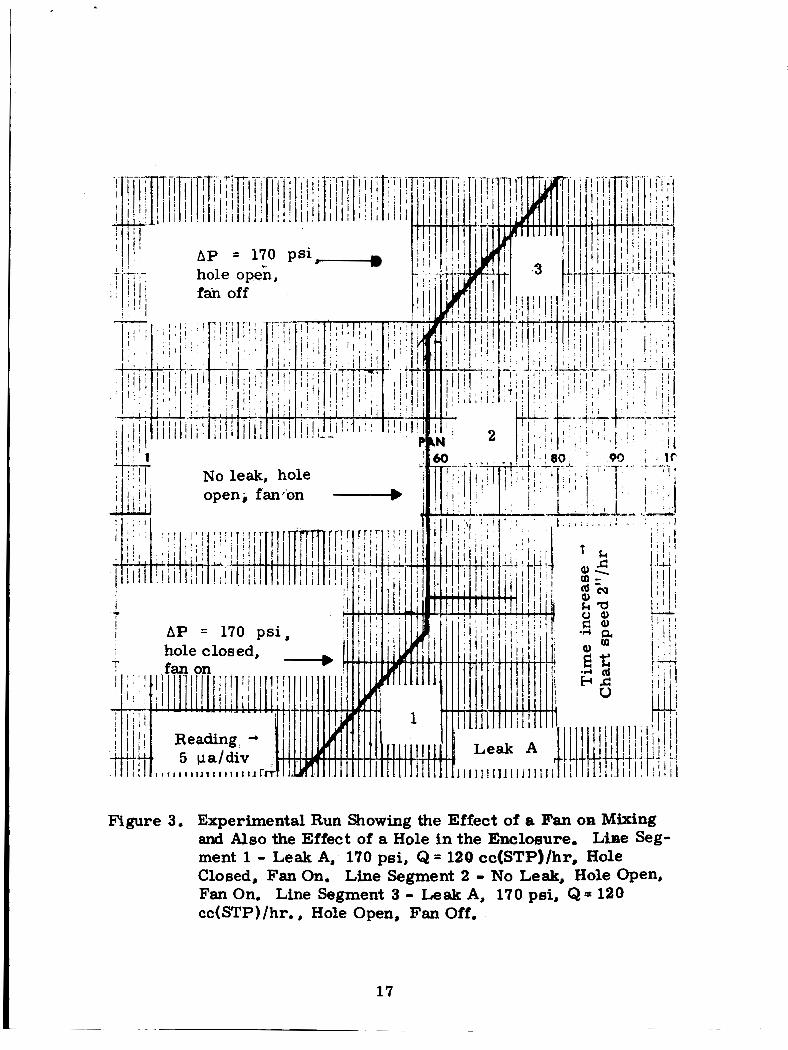
Rapid mixing has also been confirmed in a run where 120 cubic centi- meters per hour were leaked into the enclosure (Figure 3). Since this is a large flow rate, it is the worst condition. The slope with the fan operating w a s 14.5 and without w a s 13.7, a difference of about six percent. curve for the fan-off condition w a s more choppy, as is to be expected.
The
15

16
= 170 p s i - hole opgn, fcin off
No leak, hole open; fan*on
AP = 170 p s i ,
Figure 3. Experimental Run Showing the Effect of a Fan on Mixing and Also the Effect of a Hole in the Enclosure. Line S g - ment 1 - Leak A, 170 psi, Q = 128 cc(STP)/hr, Hole Closed, Fan On. Line Segment 2 - No Leak, Hole Open, Fan On. Line Segment 3 - Leak A, 170 psi, Q = 120 cc(STP)/hr., Hole Open, Fan Off.
17
SYSTEM LINEARITY ,
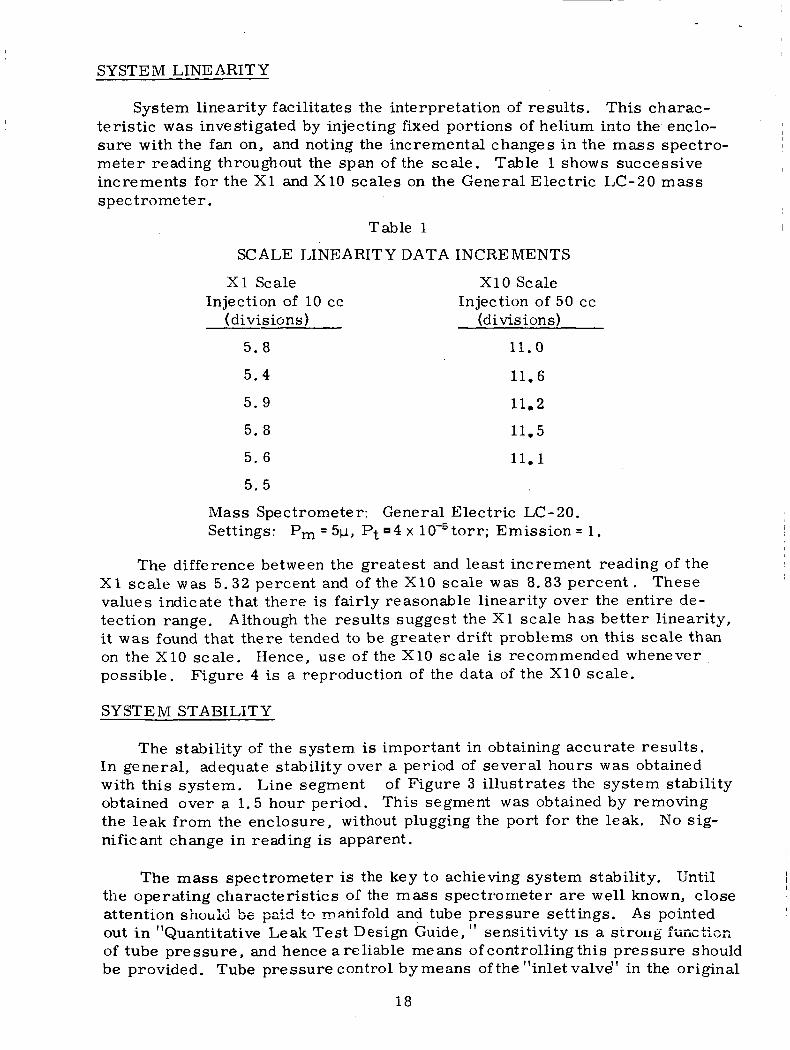
System linearity facilitates the interpretation of results. This charac- terist ic was investigated by injecting fixed portions of helium into the enclo- sure with the fan on, and noting the incremental changes in the m a s s spectro- meter reading throughout the span of the scale. Table 1 shows successive increments for the X1 and X10 scales on the General Electric LC-20 m a s s spectrometer.
Table 1
SCALE LINEARITY DATA INCREMENTS
X 1 Scale
(divisions) Injection of 10 cc
5.8
X10 Scale
(divisions) Injection of 50 cc
11.0
5.4 11.6
5 .9 11.2
5. 8 11-5
5. 6 11-1
5 . 5
Mass Spectrometer: General Electric LC-20. Settings: Pm = 5p, Pt 4 x to r r ; Emission = 1.
The difference between the greatest and least increment reading of the X 1 scale was 5.32 percent and of the X10 scale was 8.83 percent . These values indicate that there is fairly reasonable linearity over the entire de- tection range. it was found that there tended to be greater drift problems on this scale than on the X10 scale. possible. Figure 4 is a reproduction of the data of the X10 scale.
Although the results suggest the X1 scale has better linearity,
Hence, use of the X10 scale is recommended whenever
SYSTEM STABILITY
The stability of the system is important in obtaining accurate resul ts . In general, adequate stability over a period of several hours was obtained with this system. Line segment of Figure 3 illustrates the system stability obtained over a 1.5 hour period. This segment w a s obtained by removing the leak from the enclosure, without plugging the port for the leak. nificant change in reading is apparent.
No sig-
The mass spectrometer is the key to achieving system stability. Until
A s pointed the operating characterist ics of the m a s s spectrometer are well known, close attention s 'nuuld be p i 5 tc manifold and tube pressure settings. out i n "Quantitative Leak Test Design Guide, sensitivity is a s t ruug fiizctkz of tube pressure , and hence a reliable means of controlling this pressure should be provided. Tube pressure control by means of the "inlet valve" in the original
1 1

19
c, m 2

General Electr ic LC-20 mass Spectrometer w a s ra ther touchy. j a r to the inlet valve would result in large pressure excursions. with the use of a deep seated valve base, constant tube pressure and, there- fore, stable operation were obtained. The latest General Electric models use a different valve.
The slightest However,
A mass spectrometer with a large volume cold t r ap is recommended, since the quantity of liquid nitrogen remaining in the t r ap w i l l also affect the tube pressure . Furthermore, it is recommended that the mass spectrometer be operated in a standby state for at least 1 2 hours before a run.
The calibrator also plays a part in system stability. It is recommended that, after adjusting the calibrator to the selected pressure, the proper valves be carefully closed so that there is neither pressure gain o r undue loss. A s a precautionary measure, the calibrator should be examined for p re s su re changes at least every 30 minutes and adjusted if necessary.
EFFECT O F LEAK AND PROBE POSITION
The concentration of helium, it might be anticipated, would be somewhat greater in the upper portion of the enclosure because of the relative densities of helium and air. F o r this reason the majority of tests were conducted with the probe relatively high (88 inches from the floor) and the calibrating leak relatively low ( 3 9 inches from the floor). However, a series of tests were performed in which the probe and the calibrating leak positions were inter- changed. There is no evidence of any difference between the interchanged and normal positions; the spikes were caused by the electronics. A listing of the flow rates and e r r o r s for the interchanged configuration are given in Table 2 .
Figure 5 is typical of the resul ts for the interchanged position.
Table 2
FLOW RATES AND PERCENT DIFFERENCES
15.8
15.8
'% Difference
- 2 . 3 t
- 7.5
+12.0
17.3 -12.5
36.0 +lo . 9
45.0 -16.3
68.5 + 1. 6
68.5 - 1 2 . 6
Data a re based on the Injection Method. t rometer was set at Pm = 51.1, P t = 4 x 10⁻⁵torr in all the runs except the one marked with t where P,= 101.1
The mass spec-
20

Figure 5. Injection Method With Probe And Leak Interchanged.
21

The average e r r o r in this setup was 9. 5 percent, not significantly dif- ferent from the average e r r o r for the original positioning. vided the enclosure is adequately equipped with fans o r blowers there is no effect of probe o r leak position.
Therefore, pro-
SYSTEM SENSITIVITY
A plot of the sensitivity of the system versus tube pressure at a mani- fold pressure of 15y is given in Figure 6. pa/patm where yatm equals 10% atm.
The sensitivity is in units of
2 2

16
14
12
E 10
3 cd 3
\
I I 8 h .x * .x c 6
'4
rn a, vl
4
2
0
2 3 4 5 0 1
Pt x 10 5 , t o r r
I Figure 6. Detector Sensitivity versus Tube P r e s s u r e
23


Section 6
SUMMARY O F EXPERIMENTAL TEST RESULTS
Three different methods for estimating leak rates with this system a r e described in the "Quantitative Leak Test Design Guide. 'I a r e outlined in this section and the resul ts of experimental t es t s run by the methods are reported.
The Comparison Method, in which the test leak is directly compared with a calibrated leak.
The Superposition Method, in which the ratio of the ra te of increase for the test leak alone and the combined calibrated and test leaks is an indication of the test leak rate.
The Injection Method, in which the rate of helium increase in the enclosure is determined, and then the enclosure C a l i - brated by injecting a known amount of helium.
These methods
The methods are:
1.
2.
3 .
Procedures common to all the methods a re :
1. Pressurizing the test object with pure helium o r a helium- nitrogen mixture (preferably the former) .
Enclosing the object in a bag or tent.
Sensing the helium content in the enclosure and determining the rate of current increase i n a m a s s spectrometer tube.
Calibrating the current increase in the m a s s spectrometer in te rms of a helium ra te by either 1) comparing to known helium leaks o r 2) injecting a known quantity of helium
2.
3.
4.
COMPARISON METHOD
In the Comparison Method the leak ra te data of an unknown leak a r e compared directly with the data obtained from a known leak. mental tes t run helium w a s allowed to leak into the enclosure (Run A). The enclosure w a s ventilated and the leak allowed to continue at the same rate (Run B). Conditions of permeability and detector sensitivity a r e as- sumed identical for both runs.
In the experi-
Data from an experimental t es t run of the comparison method a re given in Figure 7. In this figure, as in all the others , time increases to the left. Both Figures 7A and 7B show data from a tes t where the leak r a t e w a s 15.8 cubic centimeters per hour. A t racing made of the data from Run A super- imposed on the data from Run B would show an almost exact agreement be- tween the data from the two runs. Some very interesting observations may be made f rom these figures. directly f rom the curves:
The following data fo r the slope w a s taken
25

~-
Figure 7A. (Q = 15.8 cc/hr, 2"/hr)
I
Figure 7B. (Q = 15. 8 cc/hr, 2"/hr)
Rgure 7. Comparison Method Data
26

Run Range Slope
A 30 to 40 divisions 6. 14 divisions p e r hour
B 30 to 4 0 divisions 6. 00 divisions pe r hour
B 40 to 50 divisions 5. 34 divisions pe r hour
The slopes of the curves f rom Runs A and B agree within 2.3 percent in the same range, that is, the 30 to 40 divisions range. However, a compari- son of slope A in the 30 to 40 range with slope B in the 40 to 50 range reveals a discrepancy of 11 percent. This might be attributable to permeation at the higher helium concentrations. Permeation here does not necessarily mean permeation through the bag but through seals, say, to the floor. This might appear to contradict the statements regarding system stability which were made in Section 5, "System Characteristics". However, the hole caused by opening the port for the leak in the system stability study w a s protected by a fitting, and therefore may not have been as susceptible to helium loss a s an unpro- tected hole or one in another position. Ca re should be exercised in forming the enclosure seals.
Of the three procedures, the Comparison Method requires the most t ime. results in cases of high permeation. e s sa ry to obtain a good estimate of the unknown leak.
I t is the most general and w i l l be the most likely to yield accurate Several calibrator runs may be nec-
SUPERPOSITION METHOD
The data shown in Figure 8 were obtained by the Superposition Method. The f i rs t leak of 15.8 cubic centimeters (STP) p e r hour w a s run into the enclosure for a period of time and then another leak of 45.0 cubic centi- meters (STP) p e r hour w a s superimposed. In an actual tes t the f i r s t leak would have been the unknown and the second would have been the s t a n d a d o r calibrated leak. The slopes of segments 1 and 2 are, respectively:
S, = 6.4 divisions pe r hour
Sa = 2 2 . 6 divisions per hour
The slope ratio is m = 2 2 . 6 / 6.4 = 3.53. tion Method in the "Quantitative Leak Tes t Design Guidd', i t was shown that the unknown leak is related to the calibrated leak r a t e by the expression:
In the discussion of the Superposi-
C Q
Q = - u m - 1
where QU is the unknown leak rate and Qc is the calibrated leak rate. ving for Qu:
sol-
45.0 Q = = 17. 8 cubic cent imeters p e r hour
U 3.53 - 1
which d i f fe rs frqm the rate of 15.8 cubic cent imeters p e r hour as measured by a calibrating pipet by 12. 6 percent.
27

Reading -, 5 pa/div t
I
i T I I T
1 i L
CENT OF SPA1 I ' . .- I
f
i i
-.
-.
i !
I I
J
I -'
I
I I ..
i
I
I
i I
I 1. I i t i I i
i
1
1 I I I
I
I
- i L
I
I / !
' I (2"/hr) 1
1
Figure 8. Superposition, Method Data
28
The Superposition Method presented the most problems with regard to accuracy. Even i f the slopes a r e accurate within a few percent, the esti- mation of the unknown leak rate may not be as accurate as with the other methods. Most of the superposition runs evidence little o r no permeation. Hence, the reason for the relatively low accuracy obtained by this method is not obvious. Further study of the method is needed before positive con- clusions about i t s accuracy can be drawn.
INJECTION METHOD
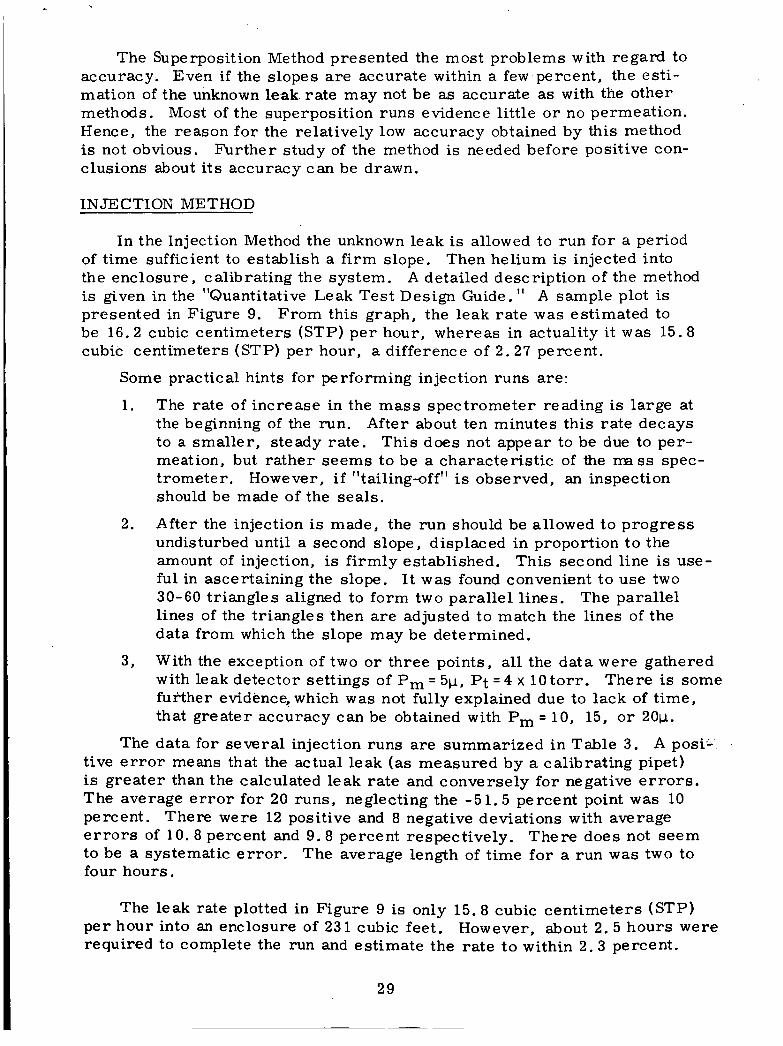
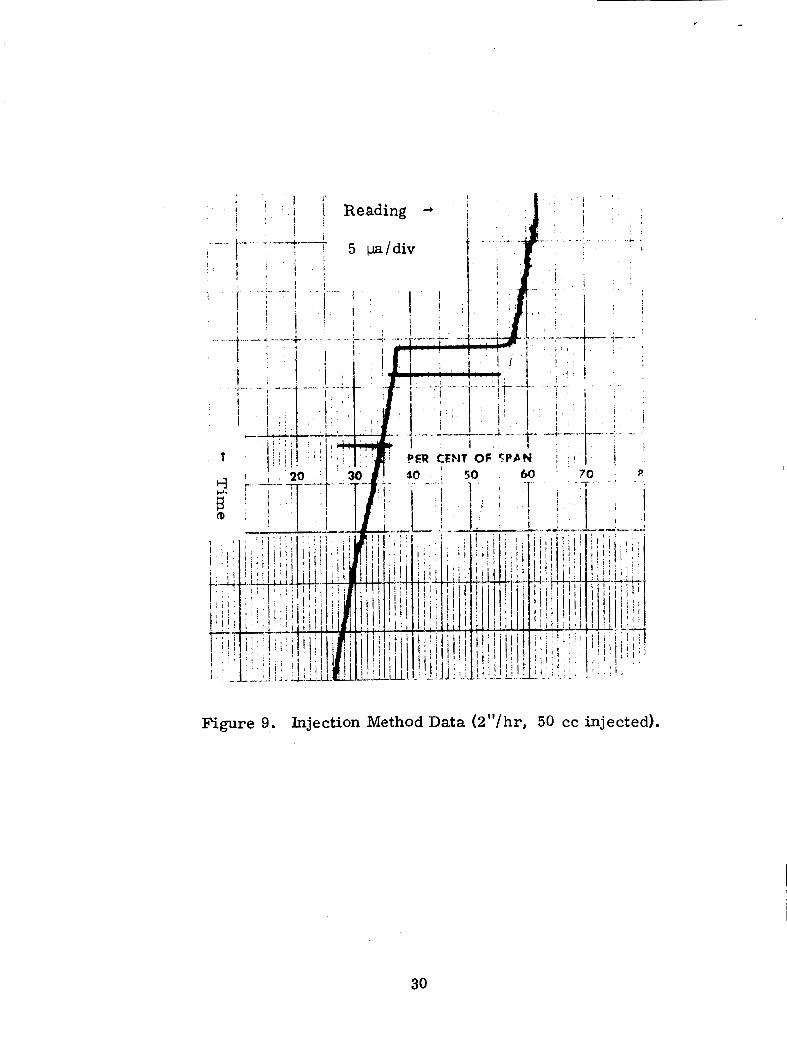
In the Injection Method the unknown leak is allowed to run for a period of time sufficient to establish a f i rm slope. Then helium is injected into the enclosure, calibrating the system. is given in the "Quantitative Leak Test Design Guide. I' A sample plot is presented in Figure 9. From this graph, the leak rate was estimated to be 16.2 cubic centimeters (STP) p e r hour, whereas in actuality it w a s 15.8 cubic centimeters (STP) per hour, a difference of 2 . 2 7 percent.
A detailed description of the method
Some practical hints for performing injection runs a re :
1.
2.
3,
The rate of increase in the mass spectrometer reading is large at the beginning of the run. After about ten minutes this ra te decays to a smaller , steady rate . This does not appear to be due to per- meation, but ra ther seems to be a characterist ic of the mass spec- trometer. should be made of the seals .
After the injection is made, the run should be allowed to progress undisturbed until a second slope, displaced in proportion to the amount of injection, is firmly established. ful in ascertaining the slope. I t w a s found convenient to use two 30-60 triangles aligned to form two parallel lines. The parallel lines of the triangles then a r e adjusted to match the lines of the data f rom which the slope may be determined.
With the exception of two o r three points, al l the data were gathered with leak detector settings of Pm = 5p, P t = 4 x l 0 to r r . There is some further evidence, which was not fully explained due to lack of t ime, that greater accuracy can be obtained with Pm = 10, 15, o r 2 0 ~ .
However, i f "tailing-off" is observed, an inspection
This second line is use-
The data for several injection runs a re summarized in Table 3 . tive e r r o r means that the actual leak (as measured by a calibrating pipet) is greater than the calculated leak rate and conversely for negative e r r o r s . The average e r r o r for 20 runs, neglecting the -51.5 percent point w a s 10 percent. There were 12 positive and 8 negative deviations with average e r r o r s of 10.8 percent and 9.8 percent respectively. There does not seem to be a systematic e r r o r . The average length of time for a run was two to four hours.
A posi-
The leak rate plotted i n Figure 9 is only 15.8 cubic cent imeters (STP) pe r hour into an enclosure of 231 cubic feet. required to complete the run and estimate the ra te t o within 2.3 percent.
However, about 2.5 hours were
29
I i l
Figure 9. Injection Method Data (2"/hr, 50 cc injected).
30
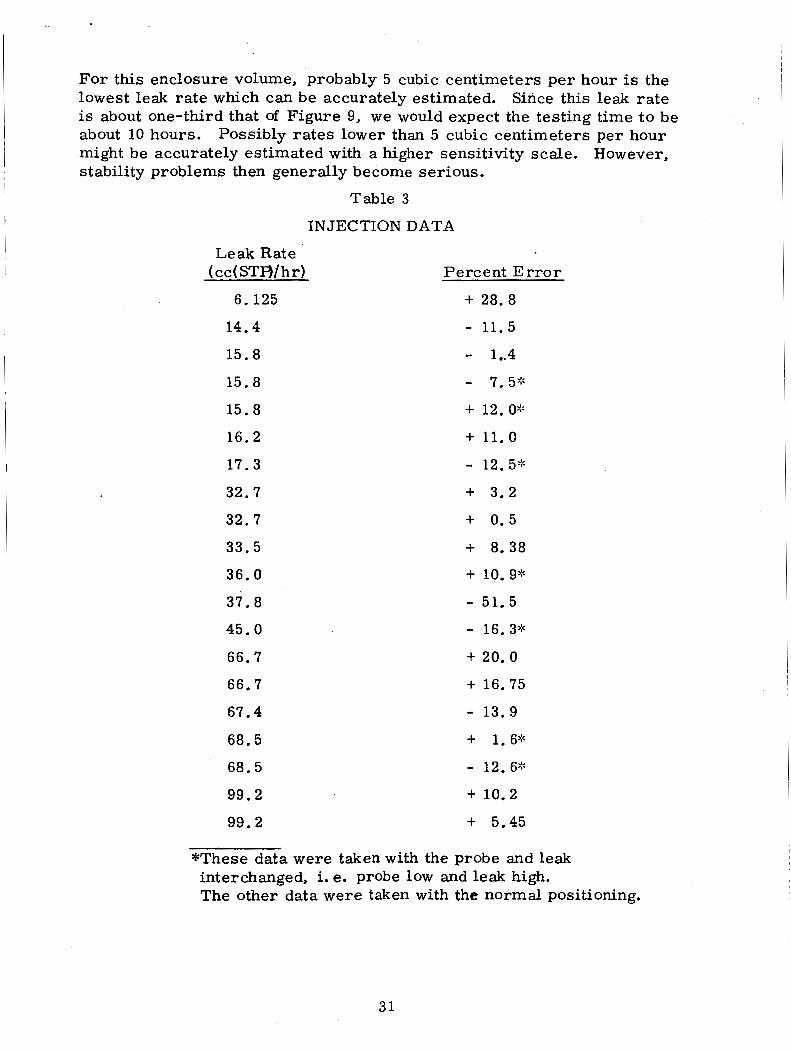
For this enclosure volume, probably 5 cubic centimeters per hour is the lowest leak rate which can be accurately estimated. Since this leak r a t e is about one-third that of Figure 9, we would expect the testing time to be about 10 hours. Possibly ra tes lower than 5 cubic centimeters per hour might be accurately estimated with a higher sensitivity scale. However, stability problems then generally become serious.
Table 3
INJECTION DATA
(cc( STB/ hr) Percent E r r o r Leak Rate
6.125 + 28.8
14.4 - 11.5
15.8 - 1..4
15.8
15.8
16.2
17.3
32.7
32.7
33.5
36.0
37.8
45.0
66.7
66.7
67.4
68.5
68.5
99.2
99.2
- 7.5;:
+ 12. os
+ 11.0
- 12.5;’
+ 3.2
+ 0.5
+ 8.38
+ 10.9;:
- 51.5
- 16.3;‘
+ 20.0
+ 16.75
- 13.9
+ 1. 6’:
- 12.6;’
+ 10.2
+ 5.45
*These data were taken with the probe and leak interchanged, i. e. probe low and leak high. The other data were taken with the normal positioning.
3 1


Section 7
CONCLUSIONS AND RECOMMENDATIONS
TEST EQUIPMENT
1. The calibrator performs a s designed. During the course of a run it should be checked every 30 minutes and adjusted if necessary.
There is negligible' permeation'through the polyvinyl choride bag. However, the seals should be carefully made.
The enclosure may be readily vented after a run either by lifting o r by opening one of the sides.
F o r added convenience, a door could be put in the enclosure which would facilitate venting.
2.
3.
4.
SYSTEM CHARACTERISTICS
1. One household fan in the enclosure is an effective mixer for most systems. fans.
The system exhibits a l inear response over the entire range of helium levels investigated.
Attention should be given the stability of leak detector settings and particularly to the mass spectrometer tube pressure.
The position o f the probe o r leak is not of great importance.
However, large complex systems may require two
2.
3.
4.
EXPERIMENTAL RESULTS
1.
2.
3.
TheComparison Method has the widest range of applications but requires the mos t time.
The Injection Method gives the most rapid results, taking three to four hours with an accuracy of 10 percent. I t is recommended for general use. There is some indication that better accuracies can be obtained by using manifold pressures of 10, 15, o r 20p. This should be further investigated.
In view of the speed of the methods i t would be possible to perform three to four runs on the test object in a 24-hour period. An average value would enhance the accuracy of all the methods.
3 3

PRECEDING PAGE BLANK NOT FILMED.
Appendix I
LEAK DATA
Three leaks spanning the range from to ld2 cubic centimeters atmosphere pe r second, equipped with Millipore 0.221.1 filters and fi l ter
holders w e r e I shipped along with the calibrator. The revised data f o r each of the leaks a r e given in Figure 10. It is this data which should be used for calibrations.
35

10-
- 4 10
10 2 100 2 5 1000 Pressure Drqp Across Leak, p s i
Data fo r Supplied Leaks Figure 10.
36