quantitative investigations of rubber blend compatibility
TRANSCRIPT

Quantitative Investigations of Rubber Blend Compatibility and Transport Phenomena in Rubbers influenced
by the Chemical Structure of the Low Molecular Components
Von der Naturwissenschaftlichen Fakultät der Gottfried Wilhelm Leibniz Universität Hannover
zur Erlangung des Grades
Doktorin der Naturwissenschaften Dr. rer. nat.
genehmigte Dissertation
von
Dipl. Chem. Ing. Cristina Rosca
geboren am 26.04.1976 in Avrig, Rumänien
Hannover 2007

Referent: Prof. Dr. R. H. Schuster
Korreferentin: Prof. Dr. C. Vogt
Tag der Promotion: 08.10.2007

Abstract
Quantitative Investigations of Rubber Blend Compatibility and Transport Phenomena in Rubbers influenced by the Chemical Structure
of the Low Molecular Components
Cristina Rosca, Dissertation, University of Hannover, 2007
Modern rubber products are multicomponent systems. In order to optimise the properties of this system, it is important to characterize each component of the recipe to obtain further knowledge about the effect of additives in rubber. The amount and the type of each component influence the final properties of the compound. In this work the phase morphology of NR-based blends in relation to the polarity of the second blend constituents (NBR, SBR with varying vinyl content, epoxidized NR and SBR) was investigated. The polymers were thermodynamically characterized by their solubility parameter. The phase morphology was determined by employing dynamic-mechanical spectroscopy and transmission-electron-microscopy (TEM). It was shown that the domain size of the minor constituent increases linearly with interfacial tension. The degree of compatibility was classified by the solubility parameter difference and in addition using the Tg shift and the half width of the damping maxima. The phase inversion region is determined from the stepwise increase in the loss modulus. Model processing aids with well-defined molecular structure (alcohols, acids and esters derived from C12- and C18-hydrocarbons) were investigated in SBR for the plasticizing efficiency at low temperatures, the solubility and the viscoelastic properties of the rubber mixes. The influence of the molecular weight and the functional group on solubility in rubber was investigated by means of swelling. It was discussed the influence of additives on plateau modulus G0
N und the reptation
time τrep by viscoelastic analysis. The diffusion process of a homologous series of phthalates (DMP, DEP, DBP, DOP and DDP) in different nitrile rubbers (NBR), hydrogenated nitrile rubber (HNBR) and styrene butadiene rubbers (SBR) was investigated by using two methods based on FT-IR Spectroscopy, namely the macroscopical "time-lag" method and the microscopical "concentration-distance" analysis. Within the homologous series of the phthalates the diffusion coefficient demonstrates significant structure-property relationships concerning (i) the chain length of the alkyl groups of the phthalates, (ii) the content of nitrile groups in the matrix, (iii) the unsaturation of the rubber and (iv) the crosslinking density of the matrix. An automatic permeation apparatus was built in order to measure the permeation rate and the diffusion coefficient in rubber mixes. The influence of the constitution and the type of polymer, the crosslinking density of the rubber matrix, the dispersion and distribution of the filler as well as the effect of the morphology of the rubber blends on permeation and diffusion processes was discussed. Keywords: Compatibility, solubility, phase morphology, plasticizing efficiency, diffusion, permeation

Abstract
Quantitative Untersuchungen zur Verträglichkeit von Kautschukverschnitten und Einfluß der Chemischen Struktur niedermolekularer Komponenten auf
Transportphänomene in Kautschuken
Cristina Rosca, Dissertation, Universität Hannover, 2007
Kautschukmischungen sind komplexe Vielstoffsysteme. Um eine effiziente Eigenschaftsoptimierung vorzunehmen, sind eine möglichst komplette Charakterisierung der einzelnen Komponenten einer Kautschukmischung und eine weitgehende Kenntnis von Auswirkung auf die Additive in Kautschuk die nötige Voraussetzung. Die Menge und Art jede Einzelkomponenten tragen zum gesamten Eigenschaftsbild bei. In dieser Dissertation wurde die Phasenmorphologie von NR Verschnitten in Abhängigkeit von der Polarität der Verschnittkomponenten untersucht. Als Verschnittkomponenten wurden hierbei NBR, SBR-Typen mit unterschiedlichem Vinylgehalt, sowie epoxidierter NR und epoxidierter SBR eingesetzt. Sämtliche Kautschuke wurden thermodynamisch anhand des Löslichkeitsparameters charakterisiert. Die Phasenmorphologie wurde mit Hilfe von dynamisch-mechanischer Spektroskopie und Transmissions-Elektronen-Mikroskopie (TEM) untersucht. Der Grad der Verträglichkeit wurde zusätzlich zur Differenz der Löslichkeitsparameter über die Tg-Verschiebung und die Verbreiterung des Dämpfungssignals beschrieben. Modell-Verarbeitungshilfsmitttel mit definierter molekularer Struktur (Alkohole, Säuren und Ester von C12- und C18-Kohlenwasserstoffen) wurden in SBR auf ihre Weichmacherwirksamkeit, Löslichkeit und viskoelastische Effekte untersucht. Die Löslichkeit der Stoffe wurde bei tiefen Temperaturen thermoanalytisch untersucht. Der Einfluss der Molmasse als auch der funktionellen Gruppe des Verarbeitungshilfsmitttel auf die Löslichkeit wurde mittels Quellungsmessungen durchgeführt. Durch Untersuchung des viskoelastischen Verhaltens wurde der Einfluss der Modell-Verarbeitunghilfsmittel auf den Plateaumodul GN und die charakteristische Relaxationszeit diskutiert. Der Diffusionsprozess einer homologen Reihe von Phthalaten (DMP,DEP, DBP, DOP und DDP) wurde in verschiedenen Nitrilkautschuken (NBR), in hydriertem Nitrilkautschuk (HNBR) und Styrol-Butadienkautschuken (SBR) mit Hilfe von zwei FT-IR-spektroskopischen Methoden untersucht, nämlich mit der makroskopischen "Durchbruch" - Methode und der mikroskopischen "Konzentrations-Weg" Analyse. Durch Untersuchungen der Transportprozesse von Phthalaten wurden die Einflüsse (i) der Länge der Alkylreste (ii) des Gehaltes an Nitrilgruppen in der Kautschukmatrix und (iii) dem Gehalt an Doppelbindungen, sowie (iv) der Vernetzungsdichte der Matrix auf die Diffusionsgeschwindigkeit bestimmt. Ein Schwerpunkt war dabei der Aufbau einer automatisierten Permeationsapparatur zur Bestimmung der Permeationsrate wie auch des Diffusionskoeffizienten. Im Besonderen ist der Einfluss von Polymertyp und dessen Mikrostruktur, der Vernetzung, der Füllstoffe und deren Dispersion und Distribution, sowie die Auswirkungen der Morphologie im Fall von Polymerverschnitten zu untersuchen.
Schlüsselwörter: Verträglichkeit, Löslichkeit, Phasenmorphologie, Weichmacherwirkung, Diffusion, Permeation

This work was done in Deutschen Institut für Kautschuktechnologie e. V. (DIK) under the
supervision of Prof. Dr. R. H. Schuster and Prof. Dr. C. Vogt from May 2002 until April 2006.
I would kindly want to thank to Prof. Dr. R. H. Schuster for the worthwhile discussions, ideas,
criticism and the advices received during this time, which helped me to finish this work.
I truly appreciate and thank to Prof. Dr. C. Vogt from Institute for Inorganic Chemistry for the
acceptance as supervisor of this work.
My thanks go also to Prof. Dr. Eng. G. Poll from Institute for Machine Parts, Construction Design
and Tribology for taking on the supervising of this work.
I would like to express my thanks to Dr. U. Giese for the useful discussion concerning my work
and for the support showed over those years.
Mrs. G. Philipp and Mrs. A. Höft, I thank you for the assistance and the help you gave to me
during the time spent in DIK. My appreciation goes to Mrs. Hanne, who always encouraged me
and supported as being my mother.
I really admire the work done together with my colleagues from elastomer-chemistry and
elastomer-physics laboratories: Mr. G. Körner, Mrs. B. Schwiedland, Mr. F. Boller, Mr. B.
Matschke, Mr. J. Hamann, Mr. A. Heier and Mr. P. Erren. Also I want to give my appreciation to
N. Tricas for the collaboration during my work in DIK.
I would like to address my gratitude to Deutsche Kautschukgesellschaft, Rhein Chemie Rheinau
GmbH for the financial support of this Ph.D. thesis.
My special thanks goes to my family that always supported me and nevertheless to my friend,
Gerd, for the understanding that he showed to me in the last months and for the motivation that
he gave to me in order to complete this work.

For my beloved parents

The following works are part of this thesis and were presented at different conferences:
Posters:
„Impact of Vinyl Groups on the Morphology of NR-SSBR by Dynamic-Mechanical Analysis“
C. Rosca, J. Ziegler, J. Meier, G. N. Bandur, R. H. Schuster
5. Kautschuk-Herbst-Kolloquium, 30.10.-01.11.2002, Hannover, Germany
„Diffusion of accelerators in rubber compounds“,
C. Rosca, U. Giese, T. Früh
South Brazilian Rubber Conference, 28.09.-01.10.2003, Porto Alegre, Brazil
„Diffusion of additives in rubbers“
C. Rosca, U. Giese, R. H. Schuster
International Rubber Conference 2004, 30.06.-03.07.2004, Moscow, Russland
„Diffusion of Dithiophosphates in Rubber Compounds“
C. Rosca, U. Giese, R. H. Schuster, I. Manoviciu, T. Früh
Junior EUROMAT, 06.09.-10.09.2004, Lausanne, Swizerland
„Permeability of elastomers“
C. Rosca, U. Giese, R. H. Schuster, I. Manoviciu
6. Kautschuk-Herbst-Kolloquim, 10.11.-13.11.2004, Hannover, Germany
„Influence of additives on processing properties of elastomers“
C. Rosca, J. Meier, R. H. Schuster, L. Steger
6. Kautschuk-Herbst-Kolloquim, 10.11.-13.11.2004, Hannover, Germany
„Evaluation of permeation behaviour of fluids through polymer membranes“
C. Rosca, U. Giese, R. H. Schuster, I. Manoviciu
X.International Macromolecular Colloquium, 10.04.-13.04.2005, Gramado, Brazil
Oral presentations:
„Diffusion und Verteilung von Dithiophosphaten“
C. Rosca, U. Giese, R. H. Schuster,
DKG-Tagung Rheinland Westfalen, 24.03.-25.03.2004, Bad Neuenahr-Ahrweiler, Germany
„Study of phase morphology in blends of natural rubber“
C. Rosca, T. Rocha, R. H. Schuster
Simposio Latinoamericano de Polimeros 2004, 12.07.-16.07 2004, Valencia, Spanien
„Additives Influence on Elastomers Properties“
C. Rosca, R. H. Schuster
10th International Seminar on Elastomers, 05.04.-08.04 2005, Rio de Janeiro, Brazil
„Permeationsdichtigkeit von Elastomeren“
C. Rosca, U. Giese, R. H. Schuster
DKG Forschungsprojektepräsentation, 20.04.2005, Fulda, Germany
Publications:
„Influence of polymer polarity on phase morphology of NR-blends“
T. Rocha, C. Rosca, J. Ziegler, R. H. Schuster
Kautschuk Gummi Kunststoffe, 1/2, (2005) 22.
„Study of Plasticizing Efficiency and Viscoelastic Effects of Processing aid in S-SBR“
C. Rosca, R. H. Schuster
Kautschuk Gummi Kunststoffe, 12, (2005) 662.
„Investigation of Diffusion of Phthalates in Nitrile Rubber“
C. Rosca, U. Giese, R. H. Schuster
Kautschuk Gummi Kunststoffe, 3 (2006) 86.
Table of contents 1
Table of contents
1 Introduction……………………………………………………………………….. 5
2 Aim of the work…………………………………………………………………... 7
3 Theoretical background………………………………………………………… 9
3.1 Compatibility of rubbers………………………………………………………... 9
3.1.1 Theory of miscibility……………………………………………………………….. 9
3.1.2 The solubility parameter concept………………………………………………… 13
3.1.3 Analysis of blend morphology……………………………………………………. 16
3.1.4 Evaluation of the interphase in rubber blends………………………………….. 20
3.2 Interaction of rubber with additives…………………………………………… 22
3.2.1 The free volume theory……………………………………………………………. 23
3.2.2 Influence of the additive on the glass transition temperature………………… 24
3.2.3 Influence of the additive on the viscoelastic properties………………………. 25
3.3 Transport processes in rubber………………………………………………… 28
3.3.1 Permeation and diffusion processes………………………………………… 28
3.3.1.1 Solutions to the Fick’s differential equation.……………………………………. 31
3.3.1.2 The theories of diffusion…………………………………………………………. 33
3.3.1.3 Concentration-distance analysis………………………………………………… 35
3.3.1.4 Factors affecting the transport processes……………………………………… 36
3.3.2 Determination of the diffusion coefficient and permeation rate……….. 42
3.3.2.1 IR-spectroscopy………………………………………………………………….. 43
3.3.2.2 Concentration-distance analysis……………………………………………….. 43
3.3.2.3 Swelling investigations…………………………………………………………... 44
3.3.2.4 Permeation experiments………………………………………………………. 44

Table of contents 2
4 Results and discussion……………………………………………………… 45
4.1 Polymer compatibility…………………………………………………………. 46
4.1.1 Estimated interfacial tension……………………………………………………. 47
4.1.2 Phase morphology………………………………………………………………. 48
4.1.3 Interphase………………………………………………………………………… 61
4.2 Rubber-additive interaction………………………………………………….. 64
4.2.1 Impact on glass transition………………………………………………………. 67
4.2.2 Solubility of model processing aids……………………………………………. 71
4.2.3 Relationship between swelling and plasticizing efficiency………………….. 74
4.2.4 Viscoelastic properties………………………………………………………….. 75
4.3 Diffusion and Permeation of the low molecular components………… 77
4.3.1 Determination of diffusion coefficient by means of ATR-FT-IR-Spectroscopy 77
4.3.2 Determination of the diffusion coefficient with concentration-distance analysis 88
4.3.3 Determination of the diffusion coefficient by swelling…………………………. 91
4.3.4 Determination of the diffusion coefficient with the two-chamber method……. 103
4.4 Relationship of oil exposition and properties……………………………… 111
4.4.1 General requirements to be met by elastomer material for rotary shaft seals 114
4.4.2 Chemical resistance of the rotary shaft seals with respect to different oils.… 115
4.4.3 Chemical investigation of material damages after dynamic stress………….. 119
4.4.4 Investigation of additives used in lubrificants and their influences………….. 123
5 Conclusions……………………………………………………………………… 125
6 Experimental part……………………………………………………………….. 129
7 Annexes………………………………………………………………………….. 134
8 Literature…………………………………………………………………………. 136
Abbreviations
3
Abbreviations
ACN Nitrile content
aIPH Thickness of the interphase
ATR Attenuated Total Reflectance
ASTM American Society for Testing and Materials
BR Poly (butadiene), (Butadiene Rubber)
D Diffusion coefficient
DIK Deutsches Institut für Kautschuktechnologie e. V.
DMA Dynamical mechanical analysis
DSC Differential scanning calorimetry
ED Activation energy
ENR Epoxidized natural rubber
EpSBR Epoxidized styrene butadiene rubber
FT-IR Fourier-Transform-Infrared spectroscopy
G' Dynamic storage modulus
G” Dynamic loss modulus
GC Gas chromatography
f Frictional force
Fi Molar attraction constant
J Diffusion flux
J0 Mass flow density
Q Swelling degree
M Molar mass
NA Avogadro number
NBR Poly (acryl-nitrile-co-butadiene)
NR Poly (1,4-cis-isopren), (Natural Rubber)
P Permeation rate
phr Parts per hundred parts rubber
gR Average radius of gyration
tan δ Loss factor
TGA Thermo-gravimetrical analysis
S Sorption coefficient
SBR Poly (styrene-co-butadiene), (Styrene Butadiene Rubber)
T Temperature
TEM Transmission electron microscopy
Tg Glass transition temperature

Abbreviations
4
Vf Free volume in the system
V Volume of a sample
V0 Volume occupied by the polymer molecule
∆Evap Energy of vaporisation
∆hM Heat of mixing
∆Hm Mixing enthalpy
∆M/∆t Mass flow
∆Sm Mixing entropy
∆Gm Free mixing enthalpy
α Thermal expansion coefficient
β Distribution coefficient
γ Interfacial tension
δ Solubility parameter (HILDEBRAND-Parameter)
ε Deformation
η Viscosity
ρ Density
σ Tension
τ Time lag
φ Volume fraction
φ IPH Volume fraction of the interphase
χ Flory-Huggins interaction parameter
Sχ Entopic contribution to χ
Hχ Enthalpic contribution to χ
ϖ Mass fraction
ζ Frictional coefficient

Chapter 1. Introduction 5
1. Introduction
Polymer science and technology has undergone a quite impressive expansion over the last
decades, primarily through the diversity in chemical constitution and macrostructure of the raw
polymers [1, 2]. The variety of monomers, their ability to form copolymers and several
polymerisation techniques lead to tailored or modified polymers covering a large range of
physico-chemical as well as mechanical properties.
In addition to the chemical approach the concept of physically (mechanically) blending two or
more existing polymers opened numerous possibilities for producing new materials with
interesting properties and commercial utilization [3]. As a matter of fact only by blending two or
more rubbers to a multiphase polymer system, the sophisticated demands for high performance
and long service life can be satisfied in the field of entropy - elastic material (crosslinked
rubbers). The implementation of this material concept requires different knowledge about the
thermodynamic phase behaviour, rheology and processing, co-crosslinking as well as
reinforcement by nano-scaled fillers.
Compatible blends involve thermodynamic miscibility and are characterized by the presence of
one phase and a single glass transition temperature while uncompatible blends are phase
separated, presenting the glass transition temperatures characteristic to each phase of the
blend [4, 5]. Consequently, the first group of blends demonstrates new physical and mechanical
properties, which are not common to the original blend constituents. Two representative
examples for single phase blends are poly (2,6-dimethyl-1,4-phenylene oxide) PPO /
(polystyrene) PS [6] and poly (acryl-nitrile-co-butadiene) NBR / poly (vinyl chloride) PVC [7]. The
latter group of blends shows mainly the properties of the original blend constituents. Prominent
examples are the combinations of the high abrasion resistance and good grip properties of
modern tire treads archived by blending BR (low Tg) with SBR (high Tg) or the combination of
good ageing resistance from EPDM [8] with the oil resistance of the polar NBR [9]. However, the
overall performance of rubber blends depends on its phase morphology, the interfacial
properties between the blend phases and, nevertheless, on the individual component
properties.
The majority of the investigations on blend morphology highlight the influence of the polymer
constitution and the processing parameters [2]. The morphology was investigated by direct
microscopical approaches (TEM, SEM and AFM) or by exploiting specific physical properties of
the blend constituents such as the thermal expansion coefficient, the heat capacity, the
dielectric permittivity and the mechanical moduli [4]. Theoretical approaches to understand
miscibility and phase behaviour of polymer blends were successfully developed [10]. However,
the experimental exploitation of theoretical prediction to rubber blends was initiated only two

Chapter 1. Introduction 6
decades ago [11]. More specific aspects related to interfacial tension, interfacial thickness and
phase behaviour as a consequence of the polymer constitution were rarely investigated for
rubber blends. Despites the reduced number of studies in this field it was shown that theoretical
predictions are quite well verified for blends of non-polar rubber [12].
In order to process such blends properly and with low energetic expenses, the viscosities of the
blend constituents have to be adjusted by using processing aids [13 -15]. In general, such
ingredients increase the free volume of the mixtures and facilitate cooperative chain movements
as long as the additives are clearly soluble in the polymer phases [16]. Due to the fact that such
additives are complex mixtures of low molecular weight compounds their impact on the
compatibility of blends, the rheology and the crosslinking behaviour etc. are not well understood
at the moment. In addition, the transport mechanism of low molecular components in rubber
blends represents an important issue either for knowing the time to reach an equilibrium
distribution in the discrete polymer phase or for establishing rules achieving homogeneous
systems. This is important especially as far materials with special properties are concerned.
However, data on diffusion and permeation of such substances in different rubber matrices are
lacking. It is important to know how fast the distribution process in a given polymer or a blend
system takes place. The distribution of the additives in multiphase elastomers is controlled by
the compatibility between the components [16 - 19]. The successful choice of an additive has to
be made with regard to the mixing, vulcanisation and processing steps in order to improve the
mixing parameters, e.g. reducing mixing energy and time, increasing filler dispersion and
lowering batch viscosity. On the other hand, it was observed that low molecular weight additives
could improve the filler dispersion and distribution, reduce energy consumption in mixing and
extrusion, and increase scorch safety. Above that, changes in damping behaviour can lead to
improved wet traction without negative influence on rolling resistance [20]. Several
investigations on additives were focused on studying the plasticizing effect, such as the
reduction in viscosity and increase of low temperature flexibility of rubber parts with beneficial
application in automotive industry [21 - 23].
On the other hand permeation of ingredients from lubricants, engine oils, cooling media in air
condition systems through rubber membranes, sealing, tubes etc becomes increasingly more
interest. For example, materials with a high resistance against fuel and oil are nowadays
extensively researched in automotive industry because the regulations concerning the
emissions of these components became more and more stringently enforced, particularly in
developed countries such as USA, Germany and UK.
Chapter 2. Aim of the work
7
2. Aim of the work
As described in the previous section, blends of polymers are often used to meet special targets.
Hereby, the final properties of a product are influenced by the compatibility between the
components and by the distribution of the additives in the rubber phases.
With respect to this, a first goal of this work is to study the compatibility and phase morphology
in blends of polydiene rubbers (non epoxidized and epoxidized rubber blends) by exploiting the
interfacial tension as a thermodynamic ruler for the degree of compatibility. With the help of
transmission electron microscopy (TEM) and dynamic-mechanical spectroscopy, it is intended
to show the effect of polymer polarity on average domain size and the phase inversion region.
Moreover, the study of the phase network connectivity gives the possibility of a quantitative
estimation of the interphase volume fraction, which is responsible for ultimate properties of the
blend under consideration.
However, the rubber performance is determined not only by the right choice of the main
compounding materials used in the formulation but also by the low molecular components that
are present. The transport process of these components between the polymer phases will give
information about the plasticizing efficiency at low temperatures, solubility and viscoelastic
properties of the rubber mixes. In order to accomplish this goal, the influence of well defined
substances, which could be part of the complex mixtures of processing aids used in rubber
technology on the low temperature properties of SBR rubber, will be investigated. Therefore, the
effects of the linear C12 - and C18 - alcohols, acids and esters in the range of small
concentrations will be studied (up to 6 phr). Information about the solubility of technically used
processing aid in SBR rubber will be investigated through turbidity measurements, DSC and
optical microscopy.
Further, considering the structure-property relationships, the transport processes of low
molecular components, such as a homologous series of phthalates in (i) NBR with varying nitrile
content, (ii) styrene butadiene rubber (SBR) with varying the vinyl content and (iii) hydrogenated
nitrile rubber (HNBR) will be studied. The determination of the diffusion coefficient for the
systems under investigation will be undertaken by means of "time-lag" method based on the
ATR-FT-IR spectroscopy and swelling measurements. The following influences on diffusion
coefficient will be evaluated:
1. the chain length of the alkyl groups of the low molecular components;
2. the content of nitrile groups in the matrix;
3. the chemical structure of the rubber (unsaturation / saturation);
4. the crosslinking density of the rubber matrix on diffusion coefficients.

Chapter 2. Aim of the work
8
The determination of the diffusion coefficient in dependency of temperature, which is
comprehensively expressed by the activation energy, will be examined.
An additional goal of this work is the determination of the diffusion coefficient from permeation
experiments as well as the permeation rate of low molecular components in rubber and rubber
blends. In this respect, the following targets will be emphasized:
1. construction and validation of a measuring apparatus (the direct connection of a gas
chromatograph with a permeation unit via an automatic multidirectional valve with
specimen loop);
2. investigations of the parameters influencing permeation:
a) the acrylonitrile content and the crosslinking density of NBR rubber,
b) the filler type and various filler concentrations,
c) surface modification;
3. investigations, by means of swelling and the "time lag" method of the parameters
influencing the diffusion coefficient:
a) the acrylonitrile content and the crosslinking density of NBR rubber,
b) the vinyl content and the crosslinking density of SBR rubber,
c) the NBR/SBR blend's phase morphology.
The last part of the work will discuss the relationship of oil exposition in rubbers and properties.
The investigation will be done on several shaft seals used in industry considering swelling
measurements, the modification of the mechanical properties as well as the damages that
appeared after dynamical stress.
The research work performed in this thesis is schematically presented in the flow chart shown in
Figure 1.
Blends•Morphology•Interphase
Low molecular compounds
Additives Diffusion, PermeationTransport processes
Infulence on phasebehaviour
Distribution in rubber orbetween rubber phases
Rubber processability Resistance to oil, lubricants
Figure 1: Schematically representation of the work

Chapter 3. Theoretical background
9
3. Theoretical background
Corresponding to the main issues of this work the following section will summarize the
theoretical und methodical fundamentals as well as the actual state of knowledge.
3.1 Compatibility of rubbers
3.1.1 Theory of miscibility
Blending two or more polymers was successfully used to obtain compounds with desirable
property combinations as an alternative route to the synthesis of new polymers [10, 15, 24]. The
spectrum of polymers developed is large and by the choice of these materials, the properties
profile of a multi-component system can be predicted. A tire is a representative example of such
a complex system. It should be elastic, hard and soft in order to fulfil some contradictory
properties like good traction on the street and high abrasion resistance. That means, a
compromise should be found with a view of attaining the required demands. The formulations
obtained represent a mix of properties characteristic to each component and describes a
system, which is not compatible overall the whole range. In other words, after the mixing
process the polymers used will be phase separated.
In very general terms, if a polymer blend in question possesses properties analogous to a
single-phase material, the blend will be considered as a miscible one. By definition for a single-
phase material the chemical composition as well as the bulk physical properties (density,
expansion coefficient, mechanical moduli etc) does not change along an imaginary space
coordinate. In case of a polymer blend this requires a dispersion of both constituents at a
molecular scale. Blends of components having a single glass transition are commonly classified
as miscible ones.
However, experience has shown that two-phase (or multiphase) blends exhibiting two (or more)
glass transitions occur more abundantly. For these blends, each polymer or contributions of the
two constituents form discrete domains with specific physical properties, which can be used at
the same time as markers for the number of phases present in a blend system under
consideration.
However, the length scale addressed by the glass transition corresponds to a few polymer coil
dimension or at least to the size of a few chain segments. Miscibility in a thermodynamic sense
is therefore not necessarily satisfied by the glass-transition criterion.
One major question is to define the heterogeneous two-phase system and contrast them from
the single phase ones. Therefore, the main question to be addressed about any polymer blend
system is whether the constituents are miscible or not. By definition, the term miscibility
describes a single phase system over the entire concentration range under isothermal
conditions. Therefore, miscibility is governed by the concentration dependency of the free
energy of mixing (∆Gm). One of the necessary conditions to be fulfilled is that ∆Gm must be

Chapter 3. Theoretical background
10
negative for a system to be thermodynamically stable. In order to distinguish between single-
and two-phase regions in a general phase diagram of a polymer blend (Figure 2) the second
derivate of the free energy of mixing is required [4]:
0<∆ mG Equ. (1)
0/ 222 >∂∂ φmG Equ. (2)
Single phase behaviour can be observed only if the two criteria are fulfilled. This is true for the
two concentration regions in the phase diagram were one of the blend constituents is present in
high concentrations. The region for which 0/ 222 <∂∂ φmG is termed the miscibility gap. Two
boundaries of the miscibility gap are formed by unstable compositions.
With increasing (or decreasing), the temperature the concentration range of the miscibility gaps
may change. At a critical temperature, the system undergoes a transition into the single-phase
region for which Equ.s (1) and (2) are fulfilled for any blend composition.
Binodal
Boundary betweensingle -phase and
two phase region Spinodal
Boundary between
metastable and stable phase separation
Critical Point
Phase
Morphology
? Gm = f( ?2)
Miscibility Gap
Binodal
Boundary betweensingle -phase and
two phase region Spinodal
Boundary between
metastable and stable phase separation
Critical Point
Phase
Morphology
Phase
Morphology
∆ Gm = f( φ2)
Miscibility Gap
∆ Gm
φ2
Binodal
Boundary betweensingle -phase and
two phase region Spinodal
Boundary between
metastable and stable phase separation
Critical Point
Phase
Morphology
Phase
Morphology
? Gm = f( ?2)
Miscibility Gap
Binodal
Boundary betweensingle -phase and
two phase region Spinodal
Boundary between
metastable and stable phase separation
Critical Point
Phase
Morphology
Phase
Morphology
∆ Gm = f( φ2)
Miscibility Gap
∆ Gm
φ2
Figure 2: Phase diagram of a polymer blend: the variation of the free mixing energy ∆Gm as a
function of composition (in the upper part), the miscibility intervals as a function of
composition and temperature (in the lower part). Scheme of corresponding phase
morphology at the right side
The formation of the miscibility gap is a function of the composition as well as the temperature
and represents the region where the systems are miscible (one phase system). Beyond the
boundaries of this region, the phase separation occurs in the system. These boundaries are
determined by the minimum of the free mixing energy as a function of composition.
Chapter 3. Theoretical background
11
The condition expressed in Equ. (1) is generally met if the entropy of mixing (∆Sm) is larger then
the enthalpy of mixing (∆Hm) or if ∆Sm is small but the mixing enthalpy is negative. This requires
strong intermolecular interactions established by polar polymers. For positive values of ∆Hm and
small positive values of ∆Sm, the phase separation is an inevitable consequence. This is the
case for most of the blends of non-polar rubbers. However, miscibility can occur when the
contribution of the mixing enthalpy (∆Hm) is smaller than the contribution of the entropy of
mixing.
The challenge in deriving theoretically an analytical expression for ∆Gm is the modelization of
∆Hm. In order to calculate ∆Sm, Flory and Huggins [26 - 28] used a rigid lattice model. The
combinatorial entropy of mixing was calculated for polymer-solvent system from the number of
arrangements of N2 polymer chains and N1 solvent molecules in the lattice by using the
Boltzmann equation. Taking into account that a polymer segment has at least two adjacent sites
occupied by other polymer segments, the entropy of mixing ∆Sm is given by the equation:
)lnln( 2211 φφ NNkSm +−=∆ Equ. (3)
where Ni is the number of the molecules and iφ is the volume fraction of the constituents.
The enthalpic contribution was considered by introducing interaction parameter between
polymer segments and solvent. This parameter, which can only be experimentally determined
[29], plays a decisive role, when blend systems are evaluated.
By extending the Flory-Hugins theory to polymer mixtures, Scott [30] and Tompa [31] calculated
the free mixing energy on a volume basis, introducing an interacting segment volume. The free
mixing energy of a total volume is determined by the Equ. (4) [30]:
+=∆ ∑ )ln 21121
1
1 φφχφφxV
RTVG
r
m Equ. (4)
where ix is the degree of polymerisation.
It can be seen that the entropy contribution decreases with the degree of polymerization
according to a hyperbolic function. Miscibility can be achieved for high molecular weight non-
polar polymers only if χ is very small or at least zero.
Commercial rubbers are generally high molecular weight polymers with low and medium
polarity. When they are mixed together they form blends that are typically not miscible in the
thermodynamic sense and demonstrate very large miscibility at ambient as well as at the
processing temperatures.
Among the thermodynamically miscible rubber blends the system NR/1,2 BR has to be
mentioned. Due to the similar polarisability of cis 1,4-isoprene units and 1,2-butadiene units as
well as similar thermal expansion coefficients of both polymers the χ parameter of this system
tends to zero [11]. In case of increasing dissimilarity of the chain segments the χ parameter

Chapter 3. Theoretical background
12
increases above a critical value and phase separation cannot be avoided even at intensive
mechanically mixing.
The χ-parameter is an important tool for quantifying the degree of compatibility of polymers.
One very useful application is the estimation of the interfacial tension in phase-separated
blends. In any heterogeneous blend system, an interdiffusion process driven by the enthalpic
and entropic contributions builds up a finite interphase. The interdiffusion process takes place
until the critical χ-parameter is reached.
The interfacial tension, which arises mainly from the difference in polarities of the two polymer
phases, was theoretically shown to be proportional to the square root of the polymer-polymer
interaction parameter χ [32].
N
RRT
g
2
0
χργ = Equ. (5)
where 0ρ is the average segment density, 2
gR is the squared average radius of gyration, N is
the number of the statistical chain segment and χ is the polymer-polymer interaction parameter.
In any heterogeneous blend system a finite interphase will be occurs due to the enthalpic and
entropic contributions. The equilibrium thickness of the interphase IPHa is shown to be inversely
proportional to the interaction parameter χ or to the solubility parameter difference [12]:
χ1
≈IPHa Equ. (6)
Basically, improving the compatibility between the blend constituents increases the thickness of
the interphase [33].
As far as blends of non-polar polymers are concerned it was shown that the χ-parameter
decreases with increasing the occurrence of temperature [34]. In some cases, an upper critical
solution temperature (UCST) was observed [35]. As shown for χ-parameter, the interfacial
tension of non-polar blends systems decreases nearly linearly with temperature. This
temperature dependency certainly affects the phase morphology of rubber blends processed or
stored at different temperatures. Above of the influence of the interfacial tension the phase
morphology of a blend is controlled by the viscosity of the matrix, the viscosity ratio of the
components and the share rate employed during mixing. Especially, the viscosity is responsible
for the formation of the average domain size ( d ) of the dispersed phase during mixing. Thus,
the interfacial tension controls the morphology development. For dispersed phase morphology
the resulting domain sizes can be described as follows [36]:
yxdmm ddVfcd /*)/(*)/( ηηηγ= Equ. (7)
Chapter 3. Theoretical background
13
where γ is the interfacial tension, mη is the viscosity of the matrix, dη is the viscosity of the
dispersal phase and dVx/dy is the share rate.
During the mixing of rubber blends, the dispersed domains are deformed during passage
through the high share regions and will be broke up to small particles. However, these particles
collide and often coalesce to form large dispersed domains [37] and a transient phase boundary
in the system is reached. As a matter of fact, the break-up is closely related to the stress level
exerted on the particle by the flowing matrix and the number of the particles produced upon
break-up is depending on not only on the external forces but also on the relative viscosity of the
components of the system [38]. As the external stress in the blend is vanished, the transient
phase boundary becomes its stability again.
3.1.2 The solubility parameter concept
The difficulties in determining the χ-parameter can be avoided by using the approach introduced
first by Hildebrand. The solubility parameterδ was demonstrated to be a useful quantity for the
characterisation of the strength of interaction of low molecular weight substances [39]. The
extension to polymer-polymer systems was popularised by Bohn [10]. The solubility parameter
is defined as the square root of the energy of vaporisation per unit volume of material (cohesive
energy density). It is given by the following equation [39]:
2
1
∆=
V
EV
δ Equ. (8)
The attractiveness of this concept was its ability to characterize a mixture by using the
component properties only. Consequently, the interaction parameter χ for a blend can be
calculated by the Equ. (9) [39]:
( ) RTV /32 δδχ −= Equ. (9)
Further, a relationship between the solubility parameter and the enthalpic contribution can be
made through the following equation:
( ) 32
2
32 φφδδ −=∆ VH m Equ. (10)
The difference of the solubility parameters is a measure of the interaction that takes place
between the segments of the polymers. The miscibility in the system is reached when χ≅0, that
means the difference of the solubility parameters tends to zero. Thermodynamic similarity of the
blend constituents is a prerequisite for a miscible blend.
Determination of the solubility parameter
The solubility parameter of a polymer cannot be directly determined because the polymers
cannot be vaporized without thermal decomposition. Indirect methods as swelling [40, 41],

Chapter 3. Theoretical background
14
inverse-gas chromatography [42], intrinsic viscosity [43], osmotic pressure [44] as well as
correlation methods as refractive index [45], group contribution methods [46] or theoretical
calculation using the increment method [47], were used to calculate the solubility parameter.
The solubility parameter is represented as the same as that of a solvent in which a polymer is
mixed in different proportion and takes place without heat effect and volume change.
Increment method
The estimation of the solubility parameter by increment method can be calculated from the
structural formula of the substance and its density taking into consideration the molar attraction
constants (F) which are given in tables after Small [43] and Hoy [47]. The molar attraction
constants are additive and are related to the solubility parameter through the following equation:
∑ =i
i
MF
ρδ Equ. (11)
where ρ represents the density, M is the molecular weight.
Equilibrium swelling
The method consists in determining the swelling degree of the slightly crosslinked polymers in
different solvents with known solubility parameters. The solvents have to exhibit chemically
similar structures, such as, homologues. The degree of swelling in the state of equilibrium
swelling is plotted versus the solubility parameters of the solvents used. The point of maximum
swelling can be taken as the solubility parameter of the polymer. The swelling degree, Q, is
defined by equation [40]:
P
SolventP
V
VVQ
+= Equ. (12)
where VP is the polymer volume before swelling and the VSolvent is the volume of the solvent
taken during swelling. Typical results for different solvents are shown in Figure 3.
Sw
elli
ng
deg
ree
ineq
uili
bri
um
δ [J/cm3]1/212 14 16 18 20 22 24
Figure 3: Swelling degree of NR in solvents with different solubility parameters [48]

Chapter 3. Theoretical background
15
Intrinsic viscosity
Another method used for the determination of solubility parameter is the intrinsic viscosity of the
polymer in different solvents, with the condition that the polymer under investigation is soluble in
them. An example using this method for polyisobutene (A) and polystyrene (B) is presented in
Figure 4 where the intrinsic viscosity is plotted over the solubility parameters of various solvents.
δ [J/cm3]1/2
η [1
00∗c
m3/g
m]
14 16 18 20 22
1,0
0,8
0,6
0,4
0,2
Figure 4: Determination of the solubility parameter using the intrinsic viscosity [41]
The intrinsic viscosity is related to the chain expansion coefficient and the polymer molecular
weight [29]. The chain expansion factor is related to the polymer-solvent interaction parameter
in the Flory–Huggins theory. If the chain conformation is most extended in the best solvent the
hydrodynamic volume tends to a maximum value and the intrinsic viscosity will be highest.
Inverse gas chromatography
This method was used by many researchers for determination of the solubility parameter at
infinite dilution [49 - 54]. An advantage of this method is that it allows measurement of the
thermodynamic values since the columns are prepared properly. The polymer represents the
stationary phase in the gas chromatography column. The solubility parameter is related to the
specific retention volume of the solvent in the column. The molar volume (Vi) which can be
determined from the density equation given in literature as well as the enthalpy of vaporization
(∆Hi) that ca be calculated at the experimental temperature, must be know at the temperature of
the column [51].
Through this method, the solubility parameter can be obtained at infinite solution over a
temperature range. This is important for the prediction of phase equilibrium at higher
temperature [55].
Chapter 3. Theoretical background
16
3.1.3 Analysis of blend morphology
It is appropriate to describe the methods used for the characterisation of the blend morphology
considering that for both elastomer-elastomer and elastomer-plastic different methods vary in
their effectiveness, depending on the combination are involved. A first group of these methods
are direct methods like transmission electron microscopy (TEM), scanning electron microscopy
(SEM) and of increasing importance these days atomic force microscopy (AFM). They offer a
direct view of phase structure and domain size distribution. The second group are the indirect
methods which emphasis a physical properties such as the mechanical modulus, the caloric
capacity, the dielectric constant ε’ and the dielectric loss factor ε”. In this group of methods, the
dynamic mechanical analysis (DMA) as well as the calorimetric methods is predominant.
Another group of methods used for the investigation of the blend morphology is represented by
the spectroscopic techniques that examine microstructural aspects of polymers and the chain
involved in the interaction. This includes the infrared spectroscopy (IR), nuclear magnetic
resonance spectroscopy (NMR), ultraviolet spectroscopy. An elegant mode of studying a blend
was done also by using scattering methods such as light scattering method, pulse-induced
critical scattering (PICS), neutron scattering method and X-ray scattering. By these
measurements the irradiation usually results in scattering of part of the incident intensity, so that
the energy and propagation vectors of the scattered waves may differ from those of the incident
radiation. However, the angle dependence of the elastic scattering provides morphological
information. X-ray and neutron scattering all result from heterogeneities in the structure of the
irradiated material.
Direct methods
The presence of two phases in a blend was used as a preliminary indication of the degree of
miscibility in a polymer-polymer system. The most widely method used for polymer-polymer
studies was TEM. By investigated the PVC/NBR system with 40% acrylonitrile by means of
TEM a heterogeneous system was found although only one glass transition was observed [56].
Electron microscopy was also used in studies of gum- and black filled elastomer blends [57, 58].
Elastomer-plastic blends are somewhat easier to identify in electron microscopy than elastomer-
elastomer system as stains like osmium tetroxide can be used for contrast. Different researches
were done on rubber reinforced with polystyrene using this method [59, 60]. In a recent work, by
investigating the phase morphology of i-polypropylene (iPP)/acrylate rubber (ACM) and
polyamide (PA)/ACM systems by means of AFM it was shown that blends of iPP with polar
rubbers should be improved by the use of an “in-situ” generation of compatibilizers, whereas for
PA based blends phase compatibilization does not play an important role but it could be used as
an option for further property optimization [61].

Chapter 3. Theoretical background
17
Indirect methods
The calorimetric methods are used to determine the glass transition of polymers and their
respective blends. The most common instrument is the differential scanning calorimtery (DSC)
which measures the amount of heat required to increase the sample temperature by a value ∆T
over that required to heat a reference material by the same ∆T. Extended studies using this
method were done also by investigating the phase stability in heterogeneous compositions of
NBR [62], or studying polyurethane block polymers [63].
Another method used extensively by various authors was dilatometry when a correlation of
glass transition with chemical structure of the polymer was done [64]. The two-phase behaviour
of a blend of syndiotactic poly(methyl methycrylate) (Tg=120°C) and isotactic poly(methyl
methacrylate) (Tg=45°C) was determined by considering the two discontinuities in the derivate
curve dV/dT corresponding to the Tg’s of the respective phases [65].
Mechanical methods for determination of the transition behaviour of polymer and polymer
blends were cited more frequently than the other techniques. The dynamic-mechanical
spectroscopy performed on crosslinked rubber blends exploits the different mechanical moduli
of the discrete rubber phases. It was considered an indirect measure at least for the number of
polymer phases in the blend and to some extends for the supramolecular periods a detailed
picture of the supramolecular structure of a blend, if one assumes that a sufficient optical
contrast is provided by the chemical nature of the polymers. Assuming that the polymer
domains exceed a critical size the corresponding phase demonstrates a typical glass transition,
which is characterized by a maximum value of the mechanical energy dissipation. This glass
transition process is recorded as a maximum of G'' (damping maximum). Thus, if the
temperature dependency of G'' is considered, it can be evaluated whether or not the blend
contains one or more phases. However, if the temperature difference between the glass
transitions of the blend constituents is small, the assignment becomes uncertain.
There are in principle four distinct cases which can appear when blend morphology is examined
from G’(T) or G”(T)-curves. Figure 5 describes schematically the variation of the modulus with
temperature from the investigations of multi-phase systems by means of DMA taking into
consideration the dependency on the solubility of the polymers.
The diagrams illustrated in Figure 5 indicate four characteristic situations:
a) non-miscible system [7];
b) miscible system [66];
c) partial soluble system [4];
d) meta stable system [67].

Chapter 3. Theoretical background
18
Temperature
a)
A B
c)
b) d)Modu
lus
Temperature
a)a)
A B
c)
b)b) d)Modu
lus
Figure 5: Schematic representation of the phase transition in multi-phase systems [68]
If by mixing of two components, two Tg’s that coincide with those of the pure components
appear, the system is not miscible (Figure 5 a). The presence of a single Tg in a rubber blend is
characteristic for the totally miscible system (Figure 5 b). Two discrete transition levels that can
occur between the range defined by the Tg's of the pure components is characteristic to the partial
soluble system (Figure 5 c) and if only one glass transition occurs but the transition stretches
over a very broad range between the Tg of the pure components, the system is meta stable
system but consists of more phases with different compositions (Figure 5 d).
The electrical properties of polymers are analogous to mechanical properties in that the
dielectric constant ε’ is similar to compliance, the dielectric loss factor ε” is similar to the
mechanical loss and the dielectric strength is analogous to tensile strength. Dielectric relaxation
measurements provide data for characterisation of blends. A wide range of frequencies can be
used. This makes possible the determination of the dielectric constants as a function of
temperature over many frequencies or as a function of frequency at given temperatures. Using
this method studies of blends of cis-BR with NR and SBR [69], blends of PVC/ poly (ethyl vinyl
acetate) EVA were done [70].
Spectroscopic methods
In application of these methods to polymer systems those methods will show that systems with
high miscibility will produce spectra showing strong deviation from an average of the spectra of
the two components. The degree of deviation of miscibility cannot be predicted but these
methods provide information on the specific interaction between polymers and can indicate
possible ways of improving miscibility.
1H NMR spectroscopy on polymers confined to studying the spin-spin and spin-lattice relaxation
process as a function of temperature and composition [71]. The spin-lattice relaxation time is
called T1 while the spin-spin relaxation time is named T2. The advantage of this method consists
on that the signal is independent on the shape and interconnectivity of the phases in a two
phase system. The heterogeneity of filled elastomers [72] or molecular motion in block

Chapter 3. Theoretical background
19
copolymers [73] was researched using this method. In another work was shown that broad line
NMR is a sensitive tool for detection of small amount of soft phase imbedded in a hard matrix.
This is due to the fact that the resonance of protons in the soft phase is relatively sharp
compared with the resonance band of the matrix protons [74].
Infrared spectroscopy was often used in analysis of polymer mixtures such as polyurethane in
polyester or polyethers [75] or sulphur cured SBR/BR blends [76]. Infrared and ultraviolet
spectroscopy on belnds of PS/PPO provided valuable information leaded to the following
conclusions: PPO is loosely packed in the glassy state and the addition of PS reduces the free
volume. The chains of both components are interpenetrating significantly, which means a high
miscibility of the system. The reason is a strong interaction between the phenylene group of the
PPO with the phenyl group of the PS [77].
Scattering methods
Irradiation of matter results in scattering of part of the incident intensity so that the energy and
the propagation vectors of the scattered waves may differ from those of the incident radiation.
The morphological information are provided by the angle dependence of the elastic scattering
while the energy dependence of the scattering is related to dynamic process in the scattering
medium. Light scattering, neutron scattering and X-ray result from heterogeneities in the
structure of the irradiated material.
In a multiphase polymer system, the angle dependence of the scattering reflects the size and
the spatial distribution of the phases and can be used for investigation of the phase morphology
[78]. In a homogeneous system, responsible for the scattering are thermal fluctuations in density
and composition, the extrapolated zero-angle intensity represents a measure of the polymer-
polymer interaction parameter [79].
While light scattering is sensitive to concentration and density fluctuation, X-ray to density
fluctuation, the neutron scattering measures the differential neuron scattering cross section of
small concentrations of protonated polymer dispersed in a matrix of deuterated polymer.
Because of this the conformation of the polymer can be determined with high precision.
Important studies were done in the area of small-angle neutron scattering (SANS) where the
structures investigated were similar to those in small-angle X-ray studies (SAXS). In a PVC /
poly(ε-caprolactone) PCL blend with a PVC concentration range varying from 0 to ~ 60%, X-ray
studies provided information about the repeat period of poly(ε-caprolactone) PCL lamellar
structures, the thickness of the PCL crystalline layer and the thickness of the amorphous layer
which contain both PVC and PCL [80].
In a blend consisting of two polymer components, each with different physical characteristics
like mechanical moduli, glass transition temperatures, expansion coefficient, and the presence
of the phases is described by the occurrence of these characteristics.

Chapter 3. Theoretical background
20
Figure 6: Experimental techniques used to study the blend morphology [4]
The numbers of phases present in the blend, the homogeneity of the polymer blends as well as
the partial solubility of the components can be studied with the help of the methods above
described and are briefly presented in Figure 6. They characterize the compatibility of polymer
blends from micro to macro scales.
3.1.4 Evaluation of the interphase in rubber blends
The number of the polymer phases present in a rubber blend can be investigated by dynamic
mechanical method by recording the damping peaks (G”) along the temperature axis. Careful
analysis of the peaks with one or more shoulders indicates the presence of discrete phases. In
such cases the signal of the minor component can be de-convoluted from G’ or G” trace.
In a multiphase structure, the interphase is situated at the rubber-rubber contact surface and its
formation is determined by the phase boundary and depends on the interaction between
polymer segments. It is known that the interfacial tension between two polymers is correlated to
the free energy that is required for the formation of the interphase between two polymers. Some
studies shown that a linear relationship between the interfacial tension and the difference of the
solubility parameters of the components exists [54, 81].
Based on the quantitative analysis of the loss modulus G” in the glass transition region of the
blend, the structure of the interpenetrating phase networks was described [82]. The volume
fraction of the interphase in rubber blends is an important issue and delivers information about
the miscibility of the components of the blend.
Microscopic methods such as TEM [58], SEM [83], and of increasing importance these days
AFM offer a direct view of the sharpness of the polymer blend interphase [84].
In recent work the prediction of the interphase in polymer blends was done, considering the
quantitative analysis of the loss modulus G'' in the glass transition region of the blend. It was
assumed that with decreasing temperature one phase undergoes a glass transition while the
other remains fluid, then the elastic modulus of the blend is dominated by that of harder glassy

Chapter 3. Theoretical background
21
phase. The results of the investigation done on EPDM/BR and NR/SBR blends demonstrated
that the storage and loss modulus of rubber blends exhibit a critical behaviour with respect to
the blend ratio that can be related to the formation of a phase network [85].
A quantitative estimation of the interphase in rubber blends was done by employing dynamic
mechanical investigations as shown schematically in Figure 7. The experimental loss modulus -
temperature curve is reconstructed by the contributions of the pure polymer phases (A and B)
by using a parameter-modified spline fit function of the single polymers (A, B) [82]. The spline
parameters considered are the amplitude, the broadness and the temperature shift of the
damping maximum in the blend. A fit of the experimental curve of the blend A/B can be
achieved by varying the parameters of the A-phase and B-phase splines for the best-fit
temperature range until the first damping maximum is reached and above the temperatures
where the second damping maximum occurs. The deviation of the fit obtained from the
experimental curve in the region between the two damping maxima indicates excess, which
cannot be predicted from the contributions of the blend constituents. Only assuming an
interaction between the blend constituents that leads to an interphase allows this third
contribution to the blend loss modulus to be explained.
Temperature [ C] °
Los
s m
od
ulu
s G
'' [
Pa
] A
B
AB 2 phase fit
Figure 7: Fitting procedure for an unfilled blend AB. The shaded area between the experimental
data (AB) and two-phase fit is considered as interphase signal
Thus, the excess represents the signal of the interphase with a discrete contribution to the glass
transition and the corresponding damping behaviour not shown for the single polymers A and B.
The method has its limitations as much as the damping maxima at the glass transition of the
blend constituents can be deconvoluted.
With this method, the volume fraction of the interphase φIPH can be evaluated. It was assumed
that the amount of the interphase is proportional to the contact probability of the two phases that
is given by the product of the volume fractions of the rubbers φA and φB. At low concentrations
and high viscosity of one phase, the component represents the dispersed phase with separated

Chapter 3. Theoretical background
22
domains located in the continuous phase. Increasing the concentration and decreasing the
viscosity the neighbouring domains tend to flow together. Above a critical concentration a co-
continuous phase structure occurs and may be seen as an interpenetrating network of the
different phases.
Inte
rph
ase
vo
lum
e fra
ctio
n,
Φ
IPH
ΦA (1- Φ )A
Co-continous morphology
Figure 8: Interphase signal vs. volume fraction of the rubber
The volume fraction of the interphase depends on the degree of compatibility, the tem-perature
and the blend composition. It was shown that the interphase of crosslinked blends is higher than
of uncrosslinked ones. If the blends are compatible the dimension of the interphase is up to 15-
20 nm and if a poor compatibility between the blends components occurs the dimensions of the
interfacial layer is reduced to 1-1.5 nm.
3.2 Interaction of rubber with additives
The rubber processing can be improved by the addition of small quantities of low molecular
weight substances, named additives. As far these components are soluble in the rubber,
respectively in rubber mixtures the free volume in the system can be increased as much that
physical and rheological properties are changed [86 - 90].
Thus, the addition of additives determines the decreasing of the glass transition temperature,
reduces the viscosity of the rubber, and leads to the changes of the frequency dependency of
dynamic mechanical properties of rubber melts as well as their corresponding crosslinked
material. These effects are caused by changes in the intermolecular interaction between the
polymer chains while chain segments undergo energetically beneficial interactions with the
additives molecules.
The decrease of the glass transition is directly correlated with the amount of the soluble low
molecular weight additive present in the mix and an estimation of the Tg evolution can be
predicted from the equation [91]:
2211 )1()1(1 ggg TwTwT += Equ. (13)

Chapter 3. Theoretical background
23
where w ‘s are the mass fractions of component 1 and 2.
Taking into consideration the chemical structure, polarity and molar mass of the additives, the
equilibrium distribution of the additive concentration between the phases of a rubber blend can
be evaluated by means of the solubility parameter concept. It was shown that the addition of
oligomers with defined chain length and chemical constitution to a rubber phase changes the
solubility parameter of entire phase [92, 93]. Consequently, the partition of the additives in both
phases of blends of non-polar rubbers leads to a predictable reduction of the δ-parameter
difference. In such cases the additives exerts a phase compatibility effect.
3.2.1 The free volume theory
The segment movements in a melted polymer can take place if in the system exists sufficient
free volume [94 - 96]. The free volume is supplementary to the hardcore volume of the polymer
the space where the polymers can do rotation and translation movements. A decrease in the
temperature lowers these movements and simultaneous through the free spaces or “holes” the
free volume in the system decreases. The free volume can reach a critical value when the
temperature decreases and leads to its contraction. At this temperature, there is not sufficient
free space to allow large motion of the segments. These considerations represent the
background of the free volume theory.
The temperature where the critical value of the free volume is reached is the glass temperature.
At this temperature, the total volume of the sample Vg is considered to be given by the volume
occupied by the polymer molecules in the glassy state V0 at 0 K, the free volume Vf and the
increased volume, which changed with the temperature (Figure 9).
V0
Tg
Sp
eci
fic v
olu
me
Temperature
V +0 Vf
Vg
(dV /0 dT)g
[d(V + )/0
dT]l
Vf
Figure 9: Schematic representation of the free volume at 0 K
Above the Tg, the distance between the segments increases due to the formation of new holes
in the system. In the melted state, the total volume of the polymer Vl is delivered by the polymer

Chapter 3. Theoretical background
24
volume Vg at the glass transition and the increased volume through the expansion of the glass
and the free volume.
TdT
dVVVV
g
fg
++= 0 Equ. (14)
)()(
1
0
g
f
gl TTdT
VVdVV −
++= Equ. (15)
Simha and Boyer [97] used the relationship between the glass transition temperature and the
difference in expansion coefficients above and below the glass transition
( )( )lgl dTdVV1=α Equ. (16)
( )( )ggg dTdVV1=α Equ. (17)
for the calculation of the free volume fraction in the total volume:
113.0)( ==−= gfgglg VVTf αα Equ. (18)
It was suggested that the free volume fraction is the same for all polymers, i.e. 11.3 per cent of
the total volume in the glassy state.
3.2.2 Influence of the additive on the glass transition temperature
A polymer sample can be made more flexible by lowering its glass transition. This can be
achieved by incorporating low molecular components in the material. A linear decrease of Tg
versus temperature is observed and the slope obtained deliver information about the plasticizing
efficiency (∆Tg/∆c). The plasticizing efficiency is defined as the decrease in Tg provoked by the
concentration unit (in mole). As it was described in reference [98] in more detail, this parameter
is valid for single-phase systems only and should be considered at very small concentrations of
an additive.
DSC-thermograms give valuable information about the variation of the glass transition with
concentration of the additive. Two cases of phase behaviour can be noticed:
1. Miscible systems which show only one glass transition at any concentration;
2. Partially soluble system that demonstrates a linear decrease of the Tg up to a critical
solubility limit. When this limit is reached the glass transition does not depend any more
on concentration. Above this limit, the glass transition remains constant.
Figure 10 gives examples of the two groups of phase behaviour. In Figure 10a a continuous
decrease of the glass transition can be seen, if the concentration of the hydrocarbon increases
and means that the decaline is soluble in EPDM.

Chapter 3. Theoretical background
25
A) B)
Figure 10: Tg-concentration-phase diagrams [99]
Opposite to this case, dodecane decreases the glass transition of EPDM until a critical solution
concentration is reached and the signal of melting enthalpy becomes obvious and increases in
intensity (Figure 10b). Above this critical concentration, the glass transition remains almost
constant.
3.2.3 Influence of the additive on the viscoelastic properties
The viscoelastic materials are materials that respond to external forces in a manner between an
elastic solid and a viscous liquid.
A material is considered ideal elastic if it returns completely to its original dimensions by the
stress removal. Hooke’s law describes this phenomenon by Equ. (19), showing that the strain is
proportional to the stress:
σ = G ε Equ. (19)
where σ is tension, ε is deformation and G is tensile modulus (Young's modulus) if a stress-
strain experiment is considered.
An ideal fluid has no elastic character and it is described by the Newton equation:
•
== γηγησdt
ds Equ. (20)
where η is the viscosity and dγ/dt the applied shear rate.
The linear viscoelastic properties can be predicted by means of different models like: Maxwell,
Voigt, Maxwell-Wiechert and Voigt-Kelvin which are based on a set of characteristic relaxation
times when the chain length and the chemical constitution of a polymer are taken into
consideration [100, 101].
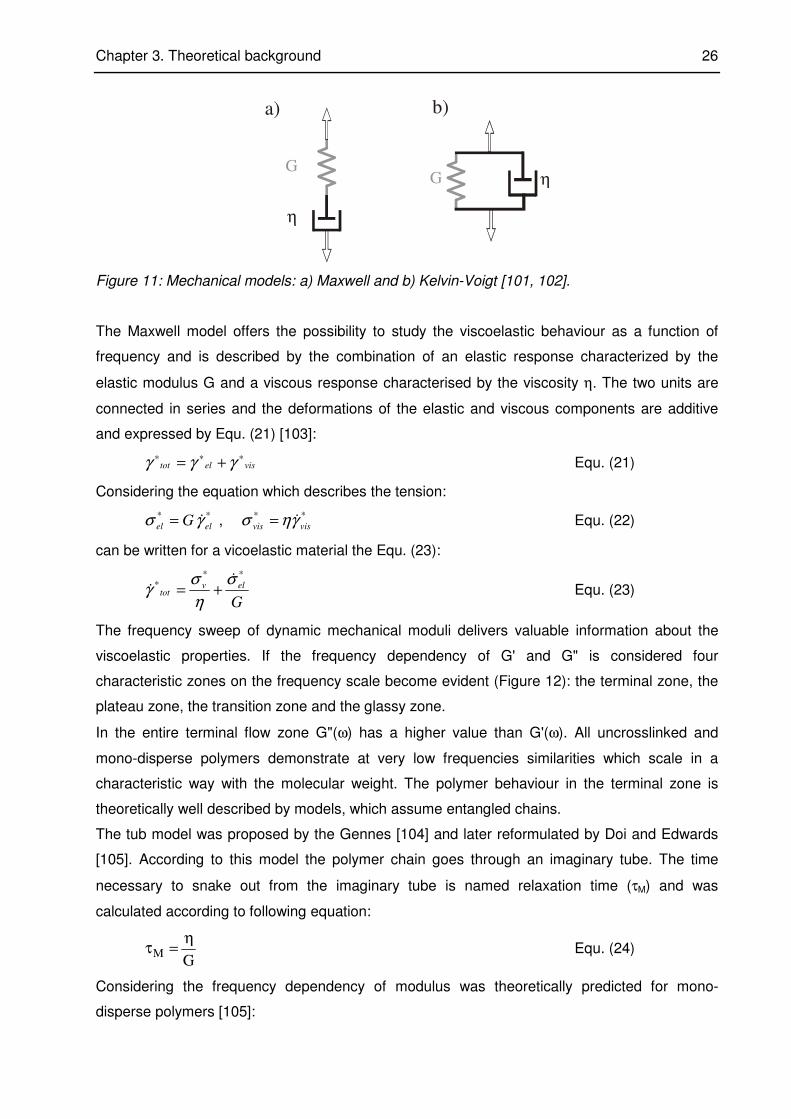
Maxwell's model (Figure 11 a) consists of a single spring attached in series to a damping
cylinder (dashpot) while the Kelvin-Voigt model (Figure 11 b) is based of a parallel arrangement
of spring and dashpot.
Chapter 3. Theoretical background
26
G
η
G η
a) b)
Figure 11: Mechanical models: a) Maxwell and b) Kelvin-Voigt [101, 102].
The Maxwell model offers the possibility to study the viscoelastic behaviour as a function of
frequency and is described by the combination of an elastic response characterized by the
elastic modulus G and a viscous response characterised by the viscosity η. The two units are
connected in series and the deformations of the elastic and viscous components are additive
and expressed by Equ. (21) [103]:
viseltot∗∗∗ += γγγ Equ. (21)
Considering the equation which describes the tension:
**
elel Gγσ &= , **
visvis γησ &= Equ. (22)
can be written for a vicoelastic material the Equ. (23):
G
elvtot
*** σ
ησ
γ&
& += Equ. (23)
The frequency sweep of dynamic mechanical moduli delivers valuable information about the
viscoelastic properties. If the frequency dependency of G' and G" is considered four
characteristic zones on the frequency scale become evident (Figure 12): the terminal zone, the
plateau zone, the transition zone and the glassy zone.
In the entire terminal flow zone G"(ω) has a higher value than G'(ω). All uncrosslinked and
mono-disperse polymers demonstrate at very low frequencies similarities which scale in a
characteristic way with the molecular weight. The polymer behaviour in the terminal zone is
theoretically well described by models, which assume entangled chains.
The tub model was proposed by the Gennes [104] and later reformulated by Doi and Edwards
[105]. According to this model the polymer chain goes through an imaginary tube. The time
necessary to snake out from the imaginary tube is named relaxation time (τM) and was
calculated according to following equation:
GM
η=τ Equ. (24)
Considering the frequency dependency of modulus was theoretically predicted for mono-
disperse polymers [105]:

Chapter 3. Theoretical background
27
M
tp
p
Nwp
GGτ
π
2
5,3,122
0
)(
18−
∞
=∑= Equ. (25)
For very small deformation frequencies,ω→0, and p = 1 the storage modulus become
proportional with ω² whereas the loss modulus is increasing with the frequency ω by the power
of 1.
10
8
6
4
0 5 10-5
G’
G’
G’
G’’G’’
G’’
Terminal
zone
Plateau
zone
Transitionzone
Glassy
zone
Lo
g G
’, L
og
G’’
Log w at 100°C
Figure 12: An idealized stress relaxation master curve [101, 106]
In both functions the plateau modulus 0
NG specifies the molecular weight independent modulus
of the entanglement network in a time scale (or frequency) where entanglements are not
slipping. The plateau modulus is expressed as follows:
e
NM
RTG
5
40 ρ= Equ. (26)
where the ρ is the density of the polymer, Me is the entanglement molar mass (between
neighbouring entanglements), R is constant of the gases and T is the temperature.
The boundary between the terminal zone and the plateau region is clear cut if mono-disperse
polymers are considered and is called crossover point. At frequencies above this point the
maximum of G"(ω) and the G'(ω) changes little with frequency, but G"(ω) passes through a
minimum. This behaviour is explained by the model that entangled chains form a temporary
network. With increasing chain length, the probability to form entanglements increases.
Therefore, the width of the plateau zone is enlarged. With regard to technical polymers with
broad molecular weight distribution, a less flat plateau zone is observed [107]. The height of the
plateau is specified in terms of the molecular weight-independent plateau modulus G 0
N and it
Chapter 3. Theoretical background
28
was found that G 0
N decreases with the amount and the size of chain side groups [108]. In the
transition zone both viscoelastic functions G' and G" strongly increases with the frequency, but
G' is normally higher than G". At very high frequencies, no configuration of the polymer chains
can occur within the period of oscillation but most of the energy is dissipated. This issues
becomes more importance since it is known that this process play a decisive role for tire
traction. In the glassy zone, no configurational rearrangements of chain backbones occur within
a period of oscillation. The stress response for a given small strain is very high.
3.3 Transport processes in rubber
3.3.1 Permeation and diffusion processes
Permeation is understood to be the passage of a gaseous or fluid substance through a
nonporous solid. Permeation is defined as the process in which the components are transported
in rubber than the process leads finally to a state of equilibrium in which concentration becomes
equal in each volume element of the system under isothermal conditions. Further, the
components diffuse to a region of lower concentration where the components can again
evaporate.
The permeation is governed by two independent physical processes: the solubility of the low
molecular component and its diffusion in rubber. The purpose of the permeation studies of low
molecular component is to obtain information about the transport mechanism of those
substances involved in a given system.
However, during the last decades information of this subject was obtained, both experimental
and theoretical [109 - 115], and it became apparent that the determination of the diffusion
coefficient in polymers showed sometimes inaccurate values which could not be explained. As a
mater of fact, many studies should be further done in order to obtain more accurate results, high
performing permeation equipment should be developed in order to acquire results with higher
precision [116,117]. Another reason for development precise permeation measurements
techniques is due to the new restrictive regulations concerning the amount of evaporative
emissions allowed for automobiles [118,119]. From one country to another, the composition of
the fuels used for automobiles varies and is in a continuous evolving process. The
repercussions of permeation are notable, because the addition of some components in fuel may
affect the permeability of various polymers [120], which leads to an increase of the fuel
emissions.
When the material situation for minimizing fuel permeation and the intended application of
corresponding components occurs, a complex spectrum of properties must be taken into
consideration concerning the material requirements such as high media-resistance (minimal
swelling), low diffusion coefficients for the permeates, high temperature stability and adequate

Chapter 3. Theoretical background
29
physical-mechanical properties, e.g. low compression set, high strength and good elasticity. As
measurements were proven, low chain mobility characterized by a high polymer glass transition
temperature, by the nature and high content of fillers and by a high crosslinking density has a
favourable effect on impermeability [121 - 123].
Nevertheless, during the engine development was done a parallel development of the fuels
used to power them [124]. The fuels are mixtures of different components such as sulphur and
aromatic species. Lacks of the firsts minimizes the lubricity of the fuel and reduces the lifetime
of the parts, which are exposed to the fuel. If the aromatics components are in low amount, the
tendency of the fuel to swell the elastomer (like O-ring) is obviously reduced [125,126]. A blend
of synthetic and aromatic fuels is the choice in order to obtain the desired swelling character.
The permeation rate depends on the chemical structure and the morphology of the polymers, on
the temperature and the size of the diffusing molecules. Observations of the physical-chemical
aspects of permeation media through a polymer matrix allow the description of this process by
three distinctive stages [127 - 129] (Figure 13):
1. Absorption of the permeate in the polymer matrix on the side with the higher medium
concentration;
2. Diffusion process through which the substance is transported through the polymer matrix in
the direction of lower concentration;
3. Desorption of permeates from the surface of the polymer matrix on the lower-concentration
side.
Permeation
Adsorption Diffusion
Desorption
Figure 13: Schematically description of the permeation process
The 1st stage makes evident the necessity of low swelling for low permeation. This condition is
met if the chemical compatibility between permeates and polymer matrix is low. This means that
the difference in the solubility parameters of the components involved is sufficiently high and the
Flory-Huggin’s interaction parameter χ has a relatively high value [39, 130, 131]. After swelling
a state of equilibrium is reached, a stationary state with an orientated substance transport

Chapter 3. Theoretical background
30
through the polymer matrix that is attained in the 2nd stage of the permeation process. In the
second stage, the transport process involves diffusion.
Diffusion is a molecular process in which the molecules float because of random thermal motion
from a region with higher concentration to one of lower concentration. The transport of a liquid
into a rubber is a similar process. When a piece of rubber is immersed in a liquid, the surface
layer immediately absorbs the liquid in early stages and with increasing time, the liquid
penetrates further and further into the bulk of the material until equilibrium is reached in which
the liquid is uniform everywhere throughout the rubber. The movement of the liquid obeys the
law of diffusion. The speed of movement is characterized by the diffusion coefficient of the liquid
in rubber.
The presence of liquids in rubber can have a significant influence on physical properties such as
tensile strength, tear strength, and fatigue resistance and abrasion resistance if the
concentration of the liquid is high. It is possible that compounds, which encounter a liquid that
has a high solubility in the rubber matrix, would suffer a high loss in strength properties. For the
design life of some components, this aspect can be negligible because the time taken for a
liquid to penetrate to a significant depth may be very long [132].
As a rule, diffusion in polymers is understood to refer to the transfer processes of molecules in
polymers such as low-molar substances[133, 134]. The theory of free volume and free chain
mobility generally explains the diffusion mechanism in polymers at a temperature above the
glass transition temperature [133 - 136] and is described by the Fick’s law of diffusion. The
diffusion coefficient D is a substance specific variable that can be regarded as constant at low
concentrations, whereas a concentration dependency prevails at high concentrations. The 1st
Fick’s diffusion law says that the flow of the particles J is proportional with the concentration
gradient [137]. For the case when in a diffusion process a direction of current is given:
0/),,( ≠∂∂ xzyxC yzyxC ∂∂ /),,( and 0/),,( =∂∂ zzyxC Equ. (27)
the diffusion results in one dimension:
x
CDJ
∂∂
−= Equ. (28)
The 2nd Fick’s diffusion law for the diffusion process, which was obtained from the mass balance
of a uniaxial diffusing molecule in a unit volume, is given by the relation:
)(x
CD
Ct
C
∂∂
∂∂
=∂∂
Equ. (29)
The Equ. (29) describes the concentration of the diffusing species in each place and time in
polymer matrix. In order to solve this equation a limiting condition set is required corresponding
to the shape and dimension of the specimen as well as an initial condition which gives
information about the concentration distribution at a defined time (i.e. t=0).

Chapter 3. Theoretical background
31
In the 3rd stage of permeation, the permeates follow up the desorption process which is
dependent mainly on the steam pressure of the components involved and rise, in the ideal
situation, to a concentration gradient that comes very close to zero. Thus, always exists a
maximum driving force for the diffusion of the diffusate or permeate [133]. The mass flow
density J0 and the mass flow ∆m/∆t of the permeation process can be described mathematically
by following equation [129]:
d
Dc
t
m
AJ
∗=
∆∆
∗= 0
0
1 Equ. (30)
d
ADc
t
m ∗∗=
∆∆ 0 Equ. (31)
When the sorption coefficient S is taken into account, the permeation coefficient P can be
determined by means of Henry’s law of solubility [129, 138]:
d
ApP
d
ApDS
t
m ∗∗=
∗∗∗=
∆∆
Equ. (32)
DSP ∗= Equ. (33)
Ap
d
t
mP
∗∗
∆∆
= Equ. (34)
where D is the diffusion coefficient, m is the mass of permeate, t is the time of permeation, d is
the thickness of the membrane, A is the permeation area and p is the pressure.
The three processes, adsorption, diffusion and desorption, can influence the permeation
process to a certain extend. Nevertheless, the diffusion process brings a distinct contribution to
the permeation process due to its complexity. The Fick’s law of diffusion provides the
mathematical description of this process and it will be discussed in detail in the following
chapter.
3.3.1.1 Solutions to the Fick’s differential equation
Steady state
If the case of the diffusion process through a plane sheet of thickness l whose surfaces are
maintained at constant concentrations C1 and C2 is considered, the steady state is reached after
a time when the concentration remains constant at all points of the sheet. The diffusion equation
in one dimension will have the form [134]:
02
2
=∂∂
x
C Equ. (35)
where the diffusion coefficient D is constant. By integrating with respect to x it will be given a
constant concentration gradient:
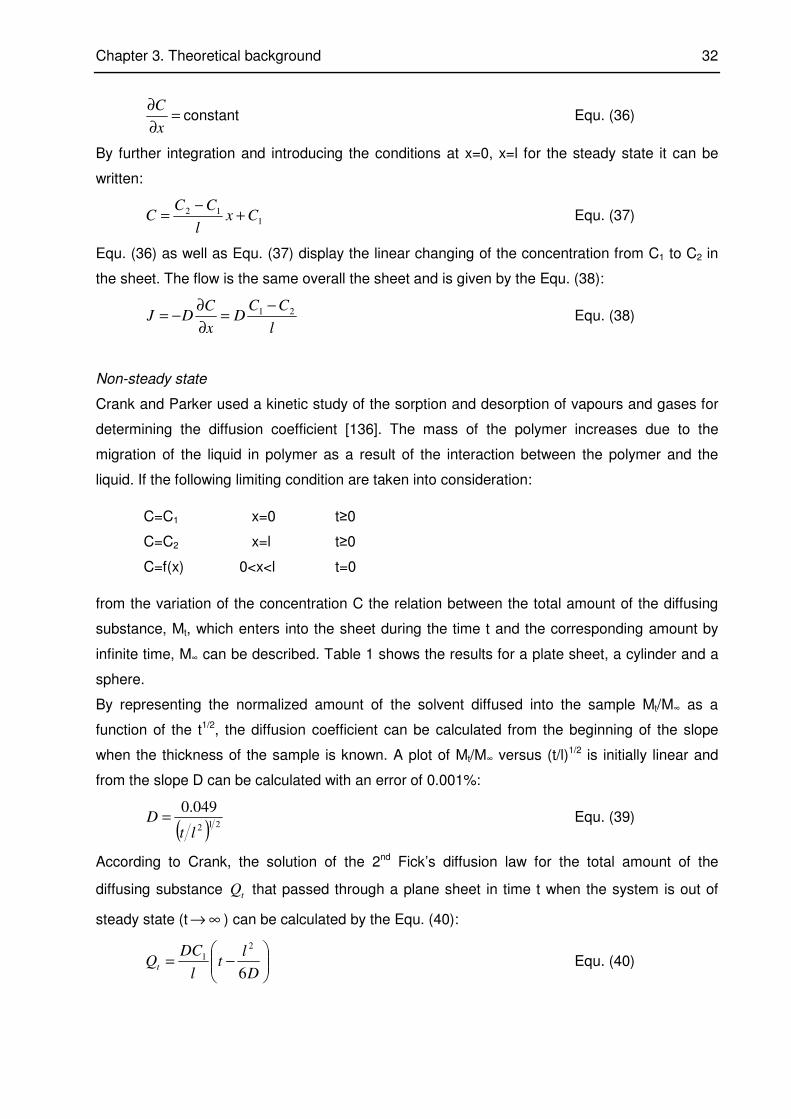
Chapter 3. Theoretical background
32
=∂∂
x
Cconstant Equ. (36)
By further integration and introducing the conditions at x=0, x=l for the steady state it can be
written:
112 Cx
l
CCC +
−= Equ. (37)
Equ. (36) as well as Equ. (37) display the linear changing of the concentration from C1 to C2 in
the sheet. The flow is the same overall the sheet and is given by the Equ. (38):
l
CCD
x
CDJ 21 −
=∂∂
−= Equ. (38)
Non-steady state
Crank and Parker used a kinetic study of the sorption and desorption of vapours and gases for
determining the diffusion coefficient [136]. The mass of the polymer increases due to the
migration of the liquid in polymer as a result of the interaction between the polymer and the
liquid. If the following limiting condition are taken into consideration:
C=C1 x=0 t≥0
C=C2 x=l t≥0
C=f(x) 0<x<l t=0
from the variation of the concentration C the relation between the total amount of the diffusing
substance, Mt, which enters into the sheet during the time t and the corresponding amount by
infinite time, M∞ can be described. Table 1 shows the results for a plate sheet, a cylinder and a
sphere.
By representing the normalized amount of the solvent diffused into the sample Mt/M∞ as a
function of the t1/2, the diffusion coefficient can be calculated from the beginning of the slope
when the thickness of the sample is known. A plot of Mt/M∞ versus (t/l)1/2 is initially linear and
from the slope D can be calculated with an error of 0.001%:
( ) 212
049.0
ltD = Equ. (39)
According to Crank, the solution of the 2nd Fick’s diffusion law for the total amount of the
diffusing substance tQ that passed through a plane sheet in time t when the system is out of
steady state (t ∞→ ) can be calculated by the Equ. (40):
−=
D
lt
l
DCQt
6
2
1 Equ. (40)
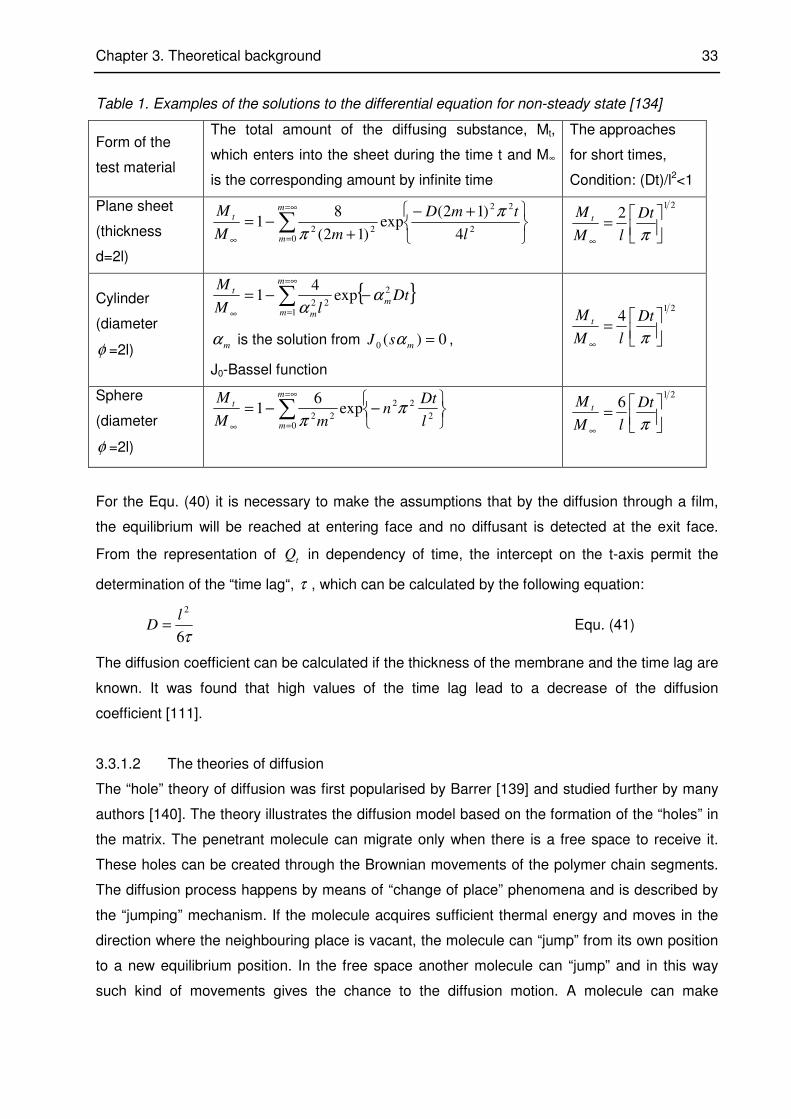
Chapter 3. Theoretical background
33
Table 1. Examples of the solutions to the differential equation for non-steady state [134]
Form of the
test material
The total amount of the diffusing substance, Mt,
which enters into the sheet during the time t and M∞
is the corresponding amount by infinite time
The approaches
for short times,
Condition: (Dt)/l2<1
Plane sheet
(thickness
d=2l)
∑∞=
=∞
+−
+−=
m
m
t
l
tmD
mM
M
02
22
22 4
)12(exp
)12(
81
ππ
212
=∞ π
Dt
lM
M t
Cylinder
(diameter
φ =2l)
{ }∑∞=
=∞
−−=m
m
m
m
t DtlM
M
1
2
22exp
41 α
α
mα is the solution from 0)(0 =msJ α ,
J0-Bassel function
214
=∞ π
Dt
lM
M t
Sphere
(diameter
φ =2l)
∑∞=
=∞
−−=
m
m
t
l
Dtn
mM
M
02
22
22exp
61 π
π
216
=∞ π
Dt
lM
M t
For the Equ. (40) it is necessary to make the assumptions that by the diffusion through a film,
the equilibrium will be reached at entering face and no diffusant is detected at the exit face.
From the representation of tQ in dependency of time, the intercept on the t-axis permit the
determination of the “time lag“, τ , which can be calculated by the following equation:
τ6
2l
D = Equ. (41)
The diffusion coefficient can be calculated if the thickness of the membrane and the time lag are
known. It was found that high values of the time lag lead to a decrease of the diffusion
coefficient [111].
3.3.1.2 The theories of diffusion
The “hole” theory of diffusion was first popularised by Barrer [139] and studied further by many
authors [140]. The theory illustrates the diffusion model based on the formation of the “holes” in
the matrix. The penetrant molecule can migrate only when there is a free space to receive it.
These holes can be created through the Brownian movements of the polymer chain segments.
The diffusion process happens by means of “change of place” phenomena and is described by
the “jumping” mechanism. If the molecule acquires sufficient thermal energy and moves in the
direction where the neighbouring place is vacant, the molecule can “jump” from its own position
to a new equilibrium position. In the free space another molecule can “jump” and in this way
such kind of movements gives the chance to the diffusion motion. A molecule can make

Chapter 3. Theoretical background
34
different jumps in time. The diffusion coefficient is calculated considering the frequency φ and
the jump distance δ :
2
6
1 φδ=D Equ. (42)
In different research works, authors tried to find out the theoretical expressions for the frequency
and the jump distance taking into consideration the nature of the diffusants and the polymers.
For the description of these two parameters, two different approaches were emphasised: the
activation energy and nevertheless the free volume theory.
Glasstone, Laidler and Eyring [140] proposed the theory of the state transition in which they
considered that the activation energy is necessary to form a hole of proper dimensions, and
derived the following equation for the calculation of the diffusion coefficient:
∆=
∗
RT
E
R
S
h
kTeD Dexpexp2λ Equ. (43)
where h is the Plank’s constant, k is Boltzmann‘ constant, λ is the mean free path of the
diffusing molecule in the solid, ∗∆S is the entropy and ED is the activation energy of the diffusion
process.
Another theory that derived the diffusion coefficient based on energy consideration is Barrer’s
zone theory [141]. This theory describes that the diffusing molecule moves to successive
positions of equilibrium if a sufficient amount of activation energy was acquired by the diffusant
and its surrounding. The activation energy is delivered in the system through many degrees of
freedom. The diffusion coefficient is calculated by equation:
( )
−
−′
= ∑′
=
−−
RT
E
fRT
ED
f
f
f
f exp!1
1
2
max
1
11
2 ρδν Equ. (44)
where ν is the thermal vibration frequency of the penetrant molecule, δ is the jump distance, f’
is the number of degrees of freedom, E is the total energy of 1 mole of the activated zones
under consideration and fρ is the probability that f’ will cooperate in a diffusion step. The
complete expression in the square brackets is the probability that the energy E is distributed
over degrees of freedom.
In the works of Meares [142] and Fujita [143] the free volume theory provides valuable
understanding about the segmental motion of the polymer. Useful information about the
diffusion phenomena in polymer systems considering the concept of free volume is comprised in
studies of Buche [144], Frisch [145], DiBenedetto and Paul [146], Kumins and Kwei [147].
These works investigated the diffusion of gases and organic vapours. It was shown that the

Chapter 3. Theoretical background
35
mobility of the polymer segment and the diffusant molecule in a polymer mixture are determined
by the amount of free volume present in the system.
The method developed by Shah [148] is based on a Monte Carlo simulation of polymer
microstructure and permits the estimation of the free volume fraction taking into account the size
of the diffusant. Mauritz und Storey [149] extended the theory of Cohen and Turnbull [150] and
approaches a molecular aspect where it was taken into consideration both the molecular size
and shape of diffused species and the interaction with the polymer. The diffusion coefficient was
calculated by means of Equ. (45):
−
=∗
fV
V
M
RTD
2
1exp
6
δ Equ. (45)
where M is the molecular weight of the diffusing substance, ∗
V is the effective volume of the
diffusing substance and fV is the free volume per polymer unit.
3.3.1.3 Concentration-distance analysis
This approach considers the mass transport of the diffusant from a reservoir domain with a
concentration C1 (reservoir) through a linear border into another domain with the concentration
0. If the mass transport is considered as a function of time the concentration in the reservoir is
decreasing more near the border and less with growing distance from the border. Vice versa,
the domain that receives the diffusant demonstrates the highest concentration at the border and
continuously decreasing concentration with growing distance from the border. Consequently, for
a given time during the process typical concentration-distance profiles are obtained. On this
analysis the processes take place at the border of two joint plates of material - one with and the
other without diffusant leads to the expression of the diffusion coefficient D as follows [147]:
∫−==1
1 02
1 C
cc xdCdc
dx
tD Equ. (46)
were x - position of the initial interface border between the two components.
The concentration-distance curve is plotted for a known time and the diffusion coefficient is
evaluated from the concentration profiles using Equ. (46). The diffusion coefficient DC=C1 is
determined for each increment, C1 is the concentration at the increment x, the dx/dc is the
inverse of the concentration dc/dx and the integral term is the area under the concentration -
distance curve.
Chapter 3. Theoretical background
36
3.3.1.4 Factors affecting the transport processes
The diffusion coefficient and the permeation rate respectively are significantly influenced by
several factors as: the nature of the polymer, concentration, shape and size of the penetrating
molecules [151], temperature [152], filler [153], nature of penetrate [154]. In earlier
investigations, Amerongen showed that synthetic rubbers like butyl and nitrile rubber have
permeability values of hydrogen from one third to one eight of natural rubber (NR) [155].
Besides its reinforcement ability, filler was founded to have a great influence on diffusion and
permeation in polymers. Addition of filler in rubber compound represents a more cost effective
method to reduce the permeability. In a later work, Amerongen investigated the effect of carbon
black (50phr) and mineral filler (20 vol%) on gas permeability on NR and demonstrated that the
addition of the filler reduced permeability of the base polymer [156]. Another study concerning
the transport process through fluoroelastomers indicated that the permeability and diffusivity of
ether through the polymer matrix were lowered by the addition of filler [153]. These findings lead
to the question: does the interphase created by the contact rubber-filler have any influence on
diffusion coefficient? For this study, a model was proposed and discussed later in the work.
The surface modification of a rubber plate by plasma treatment or coating with a given product
offers a new field of application and could give very interesting properties to the material.
Significant changes of the adhesion towards rubber matrix and the surface properties were
described in literature [157,158]. The influence of these surface modifications can also affect the
diffusion and permeation behaviours [159].
A closer understanding of those influences on the transport processes is necessary because the
diffusion experiments can provide valuable information about thermodymanic aspects of
polymer blends.
3.3.1.4.1 Influence of the shape and the size of the diffusant
If a particle has a spherical shape, the Stokes-Einstein equation [160, 161] was used for the
calculation of diffusion coefficients by means of Equ. (47):
ηπr
ktD
6= Equ. (47)
where k is Boltzmann’s constant, T the absolute temperature, r is the radius of the sphere, η is
the viscosity of the solvent.
Another approach employed for the determination of diffusion coefficient was proposed by
Sutherland, who modified the Equ. (48) introducing a sliding friction coefficient β [162]:
( )( )( )rrr
kTD
βηβηπη 31216 ++= Equ. (48)
In conclusion it was noticed that the higher r or β the slower the diffusion process takes place.

Chapter 3. Theoretical background
37
Eyring and Ewell [163] showed that the activation energy for viscous flow is related to the work
required to form a hole in the liquid and they proposed an equation in which the activation
energy Evis is correlated to the heat of vaporization vapE∆ :
n
EE
vap
vis
∆= Equ. (49)
In order to determine the factor n that gives an indication of the size of the hole, the viscosities
(log η ) were plotted versus the temperature (1/T). The results showed that for non-polar
molecules that have spherical or approximately spherical symmetry n is nearer 3 and for polar
molecules or long chain hydrocarbons not having spherical symmetry n is about 4 and n
increases with temperature [164].
The investigation on long chain hydrocarbons made by Kauzmann and Eyring [165] pointed out
the influence of the increasing chain length on the relationship between the activation energy
and heat of vaporization. They admitted that the longer the chain the higher tendency of the
chain to become coiled. Because of this behaviour the heat of vaporization is no longer a
measure of the energy required for the formation of a hole. In consequence it was assumed that
the hydrocarbon chain moved as a single unit and the energy required to form a hole would be
one quarter of the extrapolated heat of vaporization ∆E’vap.
In a later work, Kirkwood showed the correlation of the diffusion coefficient with the size of
molecule by using the Equ. (50) [166]:
( )
−+= ∑∑
=
−
=
A AN
i
ij
N
j
ij
AA
RNN
kTD
0
1
0
16
1 δπη
ρρ
Equ. (50)
where NA is Avogadro’s number, ρ the density of the solution and Rij is the distance between
the polymer segments.
Since the Einstein equation [167] gives the fundamental relationship between the diffusion
process and the frictional force ( f ) of the diffusing molecule, f can be expressed in the form:
1
,1, ,
1
61
−
≠=
+= ∑
n
jiji jiRnnf
ηπζζ (Equ. 51)
where n is unit monomer number and ζ is the frictional coefficient of each individual monomer
unit.

Chapter 3. Theoretical background
38
3.3.1.4.2 Influence of the molecular weight of the diffusant
By increasing the molecular weight of the diffusant, the diffusion coefficient approaches a limit
value. The dependence of the diffusion coefficient on the molecular mass of the diffusing
species in a given polymer matrix is described by a power law [168].
α−= KMD Equ. (52)
when K and α are constants.
For the self diffusion coefficient of poymers an exponent α of 2 was derived from the reptation
theory by DeGennes [104]. Bueche determined in his work a value of 3,5 for this constant [169].
Recent works [170, 171] studied the diffusion process of n-alkane, aliphatic esters with high
molecular weight where it was found that this exponent has a value of 2. For the diffusion
process of substances with an average molecular weight between C6 - C16 less studies exist
concerning the proportionally between the diffusion coefficient and molecular weight.
3.3.1.4.3 Influence of the temperature
The diffusion coefficient is temperature dependent and obeys to a relationship similar to the
Arrhenius equation [172]:
−=RT
EDD Dexp0 Equ. (53)
where D is the diffusion coefficient, D0 is the pre-exponential factor, ED is the activation energy
of diffusion, R is the gas constant and T is the temperature in Kelvin. The activation energy, ED,
is a measure of the energy extended against the cohesive forces of the polymer in forming the
holes (free volume) through which diffusion will take place. The experimental results showed
that the ED is proportional with the diameter of the molecule at square respectively with the
diameter of the hole and the cohesive energy density [135]:
V
D EdE ∆≈ 2 Equ. (54)
Van Amerongen [173] explained that the dependency of the activation energy on temperature
could be interpreted by Eyring theory of rate processes [140] by taking into consideration the
variation of the enthalpy and entropy with temperature.
3.3.1.4.4 Influence of the nature of the rubber
Taking into consideration the “hole” theory of diffusion, the diffusion process depends on the
number and size distribution of holes, which in turn depend on the packing degree of the chains
and is related to the free volume. The diffusion process depends also on the ability of hole
formation which is closely correlated with the segmental chain mobility. These features can
influence to a certain extent the thermal expansion coefficient and the glass transition.
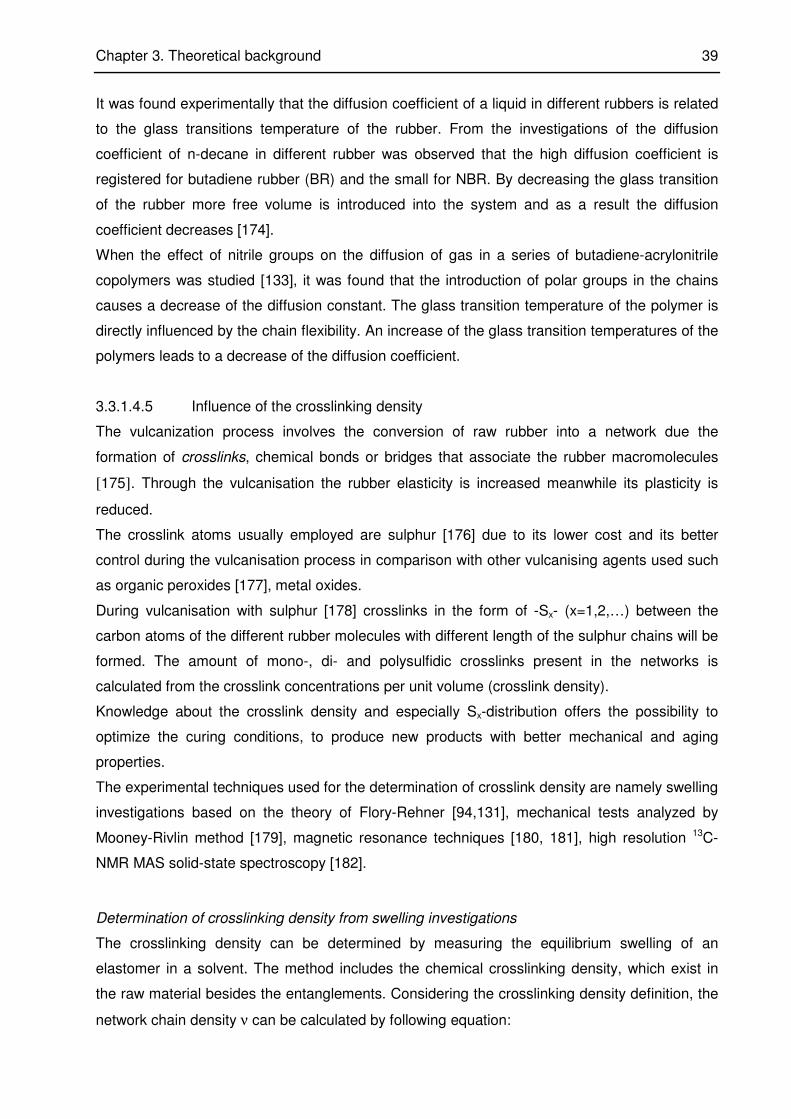
Chapter 3. Theoretical background
39
It was found experimentally that the diffusion coefficient of a liquid in different rubbers is related
to the glass transitions temperature of the rubber. From the investigations of the diffusion
coefficient of n-decane in different rubber was observed that the high diffusion coefficient is
registered for butadiene rubber (BR) and the small for NBR. By decreasing the glass transition
of the rubber more free volume is introduced into the system and as a result the diffusion
coefficient decreases [174].
When the effect of nitrile groups on the diffusion of gas in a series of butadiene-acrylonitrile
copolymers was studied [133], it was found that the introduction of polar groups in the chains
causes a decrease of the diffusion constant. The glass transition temperature of the polymer is
directly influenced by the chain flexibility. An increase of the glass transition temperatures of the
polymers leads to a decrease of the diffusion coefficient.
3.3.1.4.5 Influence of the crosslinking density
The vulcanization process involves the conversion of raw rubber into a network due the
formation of crosslinks, chemical bonds or bridges that associate the rubber macromolecules
[175]. Through the vulcanisation the rubber elasticity is increased meanwhile its plasticity is
reduced.
The crosslink atoms usually employed are sulphur [176] due to its lower cost and its better
control during the vulcanisation process in comparison with other vulcanising agents used such
as organic peroxides [177], metal oxides.
During vulcanisation with sulphur [178] crosslinks in the form of -Sx- (x=1,2,…) between the
carbon atoms of the different rubber molecules with different length of the sulphur chains will be
formed. The amount of mono-, di- and polysulfidic crosslinks present in the networks is
calculated from the crosslink concentrations per unit volume (crosslink density).
Knowledge about the crosslink density and especially Sx-distribution offers the possibility to
optimize the curing conditions, to produce new products with better mechanical and aging
properties.
The experimental techniques used for the determination of crosslink density are namely swelling
investigations based on the theory of Flory-Rehner [94,131], mechanical tests analyzed by
Mooney-Rivlin method [179], magnetic resonance techniques [180, 181], high resolution 13C-
NMR MAS solid-state spectroscopy [182].
Determination of crosslinking density from swelling investigations
The crosslinking density can be determined by measuring the equilibrium swelling of an
elastomer in a solvent. The method includes the chemical crosslinking density, which exist in
the raw material besides the entanglements. Considering the crosslinking density definition, the
network chain density ν can be calculated by following equation:

Chapter 3. Theoretical background
40
CP M/ρν = Equ. (55)
where the ρP is the density of the polymer and Mc is the molecular weight between crosslinks.
The swelling experiment of the elastomer is done in the solvent at constant temperature. The
weight of the sample is recorded in dependence of time until the equilibrium swelling is reached.
The swelling degree of the elastomer is inverse proportional with the crosslinking density. That
means, the shorter the distance between the crosslink is (smaller Mc) the smaller the swelling.
For the calculation of the network, chain density the fundamental equation by Flory and Rehner
is used:
)5.0(/)1(ln 3/1
0
2
rrrrr VVVVVV −++−= χν Equ. (56)
where ν is the chain density in mol/cm3, V0 is the molar volume of the solvent, χ is Huggins′
interaction parameter, Vr is volume of the polymer in gel which is calculated by:
])/(1[/1 QV SPr ρρ+= Equ. (57)
221 /)( mmmQ −= Equ. (58)
where ρS is the density of the solvent, Q is the swelling degree, m1 is the mass of the sample at
the equilibrium swelling and m2 is the mass of the sample in original state.
Determination of crosslinking density from mechanical test
Another method employed for the determination of the network chain density is the mechanical
investigation that studies the stress-strain behaviour of a rubber plate. From the elongation
measurements results, the calculation of ν using the relationship described by Mooney and
Rivlin could be done:
+
+=2
210
12
λλ
λC
CAF Equ. (59)
where F is the force, A0 is the original cross section area, λ is the extension ratio and C1 and C2
are constants.
The values of the constants C1 and C2 can be obtained graphically by plotting stress-strain data
in the form F/[2 A0 (λ-λ2)] as a function of λ-1. For the calculation of network chain density, the
kinetic theory of rubber elasticity gives the following equation:
ν = 2C1 / RT Equ. (60)
The effect of the crosslinking density of the rubber on diffusion was investigated in different
studies [183,184]. It was noticed that the diffusion constants decrease with increasing the
crosslinking density due to the immobility introduced into the chain molecules. The reversed
effect was observed for small amounts of crosslinkings.

Chapter 3. Theoretical background
41
3.3.1.4.6 Influence of the filler
Fillers like silica and carbon black are used to reinforce unfilled polymers. Reinforcement of
elastomers by fillers requires strong physical interactions between polymer chain segments and
filler surfaces [185,186]. The addition of fillers enhances strength properties (G’ modulus,
abrasion resistance, tear, increase) and modifies viscoelastic behaviour, which can be observed
by an increase in the viscosity that can influence the processability of the rubber.
Simultaneously, the heat build up, tanδ and resilience decrease [187].
Carbon black is used in high concentration in tire tread mixes in order to confer traction and
abrasion resistance [188] while the compound reinforced by silica provides better traction [189].
In some cases, the chemical contact between the polymer and the filler surface is improved by
using coupling agents that support the reinforcing effect [190,191]. This makes it possible to
obtain filled silica compounds that meet the performance requirements generally achieved by
the use of carbon black.
By incorporating particulate fillers and by increasing their concentration in the rubber almost all
of the rheological and physical properties are influenced. Both, the loss modulus G'' and the
storage modulus G' are influenced by the filler loading as well as the degree of filler dispersion
obtained during the mixing process. The experimental results showed that extended mixing of
rubber compounds leads to a higher degree of filler dispersion and consequently to a decrease
values of G' and G''.
Einstein described the hydrodynamic effect for the first time by studying the flow behaviour of
spherical particles in Netwon’s solutions. He considered the viscosity of the filled and unfilled
compounds and the volume fraction of filler [192,193]. Later, Smallwood [194] brought into the
concept the modulus G and Guth und Gold [195,196] extended it through a term that is related
to the interaction between the particles. This approach is known as Einstein-Guth-Gold equation
and is expressed by the following form:
)1.145.21( 2
0 φφ ++= GG f Equ. (61)
It was experimentally shown that Equ. (61) was limited for very large particle with spherical
shape and filler concentration with φ smaller than 2.
Another approach was proposed considering the asymmetry of the filler when the volume
fraction φ was corrected by an adjustable shape factors f [197,198]
)62.167.01( 22
0 φφ fGG f ++= Equ. (62)
or by an effective filler volume fraction φeff [199, 200] which substitutes the φ leads to
)1.145.21( 2
0 efff GG φφ ++= Equ. (63)
It was suggested [199] that the rubber could be occluded in the filler aggregates and partly
shielded from an external deformation. Although a part of the rubber is occluded, a good

Chapter 3. Theoretical background
42
interaction between polymer and filler can occur if the effective volume fraction is high enough.
That means that at the filler surface the rubber that is fixed in a layer is reduced and than the
hydrodynamic effect occurs. This effective volume fraction depends on the testing temperature,
the strain deformation and nevertheless on the surface activity of the filler used.
Filler-polymer interaction
The filler-polymer interactions are strongly influenced by the structure and surface of the filler
and its interaction with the polymer. When the filler is dispersed in rubber, the polymer is
partially immobilized in the form of occluded rubber, which behaves like the filler rather than like
the polymer matrix. In this case, their contribution to the elastic behaviour of the matrix is
annulated.
Filler-filler interaction
Through some detailed studies made by Payne it was shown that the filler-filler interaction
affects the strain-dependent contribution to the modulus [201, 202]. This effect considers the
decrease of the storage modulus as a function of the double strain amplitude in logarithmic
scale in a varying amplitude range from zero until a plateau is reached. The Payne effect is
dependent on the type of filler. The effect is stronger for silica than for carbon black due to a
faster destruction of the silica network over a certain level of deformation [203].
3.3.2 Determination of diffusion coefficient and permeation rate
Both because of the rubber technology involvement and for scientific reasons, there is an
increasing interest in efficient measuring methods for characterizing the diffusion behaviour of
low molecular additives in different rubber matrices. A problem with most methods is, on one
hand, the high expense in terms of time and preparation and the application limitation imposed
by the measuring principle. On the other hand, there are, moreover, hardly any methods that
allow a direct, locally resolved analytic determination of the diffusant as a function of time.
Depending on the system under investigation, different methods have been applied for
characterization of transport processes of low molecular substances [204,205] and crosslinking
chemicals in polymer matrices that play an important role in diffusion processes through
polymers [206 - 208]. ATR-FT-IR spectroscopy (ATR-attenuated total reflectance) was used for
the evaluation of additive diffusion in polymer films [209] or the analysis of polymers surface
[204]. Using micro-interferometry, it was shown that considerable change in diffusion coefficient
with curative concentration occurs. It was also demonstrated that the sulphur diffusion between
different polydienes like NR, SBR and BR is quite similar to diffusion in the homopolymer [210].
Another method used for monitoring the amount of diffusing substance across a polymer liquid
interface as a function of time is the equilibrium swelling method [211]. Specifically for the
determination of cases of equilibrium concentration distribution, conventional methods of
analysis are applied, such as extraction and chromatography, or elemental analyses in

Chapter 3. Theoretical background
43
conjunction with special test configurations like sandwich structures consisting of a reservoir
and a matrix where the low molecular components diffuse [212].
Recently measurements of the simultaneous diffusion, surface enhancement and the
evaporation of a plasticizer from a polymer, thin-film matrix by using neutron reflection
techniques were presented [213]. It was pointed out that the volume fraction profiles and the
rate of evaporation of the plasticizer at the substrate interface are both consistent with the
attractions of the surface that governs the bulk attractions between the miscible plasticizer and
the polymer. Another work presents a new approach to (1)H multiple-quantum NMR that gives
quantitatively information on chain ordering, dynamics and heterogeneities in polymer networks.
This method can be used on simple low-filed NMR spectrometers and was employed for
investigation of filler effects in technical elastomers and the swelling process of a model network
[214].
For the study of diffusion of solvents in rubbers various models were proposed and among them
are those based on (a) free volume [215], (b) non-Markovian processes [216], (c) existence of a
stress [217]. The Edwards-Cohen model [218] was modified where the chemical potential of
diffusion through polymeric systems was assumed to be a function of the concentration and the
stress induced by the swelling.
3.3.2.1 IR-Spectroscopy
The “time lag” (τ) taken for the diffusant to penetrate into a polymer thin film with a constant
thickness l was measured by FT-IR-Spectroscopy method. With these two values the diffusion
coefficient was calculated according to the simplified Equ. (41), Chap. 3.3.1.1
3.3.2.2 Concentration-distance analysis
The system used for this study is made up of two separated layers (Table 33, Chap. 7). One
layer contains the rubber and the diffusing substance being considered the reservoir. The other
layer has of the same chemical constitution. During the whole process, the condition of the
conservation of mass had to be satisfied. This required from the experimental design to
measure the concentration along the x-axis from the initial position of the boundary between the
two components.
0
T1
T2
T3
T4
Distance, x
C/C
0
+-
Figure 14: Evaluation of diffusion coefficient from a concentration – distance curve

Chapter 3. Theoretical background
44
The changes in concentration (concentration profiles) were recorded at several times as a
function of the distance using the borderline as origin. The concentration-distance curve was
plotted (Figure 14) for a given time t of observation and the diffusion coefficient D was evaluated
from the concentration profiles using Equ. (46), Chap. 3.3.1.3.
3.3.2.3 Swelling investigations
Equilibrium swelling experiments of crosslinked rubber plates in different test substances were
performed at different temperatures. The weight of the sample was measured before and after
immersing it in solvent. The weight of the swollen samples at different times was determined
after removing the solvent by blotting with filter paper from the surface of the sample. The
swelling degree of several solvents in a plane sheet was determined gravimetrically using the
formula displayed in Table 1, Chap. 3.3.1.1. For the study of the thickness influence on the
transport process, the variation of the swelling degree with the time was investigated
photographically.
3.3.2.4 Permeation experiments
The permeation equipment developed in this work consists of two separate chambers separated
by a polymer membrane of different thickness. The fluid to be permeated is introduced in the
upper chamber under normal pressure conditions (open system). The test fluid permeates from
the upper chamber into the lower chamber and with the help of the carrying gas the diffusing
sample is transported through a small steel duct to the six-way valve. By using a switching
program of the valve (for given intervals of time), the gas flow is conducted to a loop of the valve
so that at each valve switching a constant gas volume is introduced in the column of the gas
chromatograph. The flame ionisation detector (FID) was employed to analyse the sample and
the data will be registered in a chromatogram using a computer.

Chapter 4. Results and discussion 45
4. Results and discussion
This work should contribute to a deeper understanding of the compatibility of polymers as well
as to the solubility and the transport processes of low molecular compounds in polymers. On
one hand, the influence of the chemical constitution and the structure of polymers with low glass
transition temperature on the phase morphology of blends should be examined. Hereby the
focus is on the description of the interfacial tension with the help of the δ-parameter concept as
well as on the estimation of the interphase volume fraction formed by interdiffusion of unlike
polymers. This investigation is made on crosslinked blends by means of the dynamic-
mechanical spectroscopy described in Chap. 3.1.3. As it was shown, there the characteristics
and dimensions of the interphase can be influenced by the method used for evaluation as well
as by the type and degree of crosslinking of the rubber matrix.
On the other hand, the solubility of the chosen low molecular compounds, that represent the
structure analogue model compounds for processing components in the rubber industry, should
be examined in different rubbers. Hereby one focus is the investigation of transport phenomena
of low molecular compounds depending on their chemical structure and in crosslinked polymers.
A comparison of different methods for the determination of the diffusion coefficient and the
permeation rate should highlight the precision and correctness of the employed methods. On
the other side, the transport phenomena will be investigated as a function of the molecular
characteristics of the polymer matrix as well as of the low molecular diffusants as an aspect,
which was not investigated so far by others. Based on these results the influence of nano-
structured fillers is to be examined. Here the contribution of polymer interphase at the filler
surface should be studied in some detail. Last but not least it should be clarified how far the
supra-molecular phase morphology and whether or not the decisive role of the major phase or
co-continuous phase morphology of blends influences the transport phenomenon.
To achieve these targets a number of commercial polymers as well as modified polymers were
used (Table 2).
The chosen selection enables a sufficient variation of the structural parameters to show the
significant changes of the molecular characteristics such as polarizability of the chain segments,
the chain flexibility, the free volume and the glass transition temperature. When using poly
(styrene-co-butadiene) grades this was achieved by a systematic variation of the 1,2-butadiene
units and by substituting double bonds in the main chain under defined conditions by oxirane
rings. The replacement of cis/trans 1,4-butadiene units by 1,2-units reduce the average
polarizability of the polymer and decrease consequently the δ-parameter. Opposite to this, the
epoxidation reaction leads to an increase of the polarizybility and higher value of δ-parameter. In

Chapter 4. Results and discussion 46
the case of poly(acryl-nitrile-co-butadiene) on one hand the concentration of acryl nitrite units
and on the other hand the degree of saturation were varied.
The characterisation of the investigated polymers was done by means of DSC and dynamical
mechanical investigation. The results are shown in Table 2.
Table 2. Characteristics of rubbers used
Chemical composition [wt%]
Sample Trade Name 1,4-cis
isoprene
1,4-cis/trans
butadiene
1,2-
butadiene styrene
acrylo-
nitrile
Epoxid. [mol%]
Tg
[°C]
NR SMR CV50 99.9 - - - - - -62
BR CB 10 - 96.0 - - - - -103
SBR1 Buna VSL 5025-0 - 25 50 25 - - -18
SBR2 Buna VSL 2525-0 - 50 25 25 - - -44
SBR3 Buna VSL 25-0 - 68 8 25 - - -63
SBR4 Krylene 1500 - 62 14,5 23,5 - - -51
ENR ENR50 - - - - - 50 -17
EpSBR - 20 25 25 - 30 -31
NBR1 Perbunan NT 1845 - 67 15 - 18 - -45
NBR2 Perbunan NT 2845 - 64 8 - 28 - -31
NBR3 Perbunan NT 3445 - 59 7 - 34 - -22
NBR4 Perbunan NT 3945 - 56 5 - 39 - -12
HNBR1 Zetpol 2010 - 9 - - 36 - -24
4.1 Polymer Compatibility
Whenever polymer blends are prepared by mechanical or solution mixing, the first and essential
question to be answered is - do the polymers form discrete phases or do they mix intimately on
a molecular scale. The first case of phase-separated blends is observed most frequently. As it
was discussed in Chap. 3.1.1, phase separation is supported by high molecular weight as well
as by unfavourable and weak interactions of unlike chain segments.
Due to the fact that technically used polymers do have high molecular weights (>105g/mol), the
entropy of mixing (∆Sm) delivers only a small negative contribution to the free energy of mixing
(∆Gm). The most important question is therefore the magnitude of the enthalpy of mixing (∆Hm).
In the case of non-polar or slightly polar polymers, this contribution can be estimated by using
the solubility parameter concept [39].
The thermodynamic characterization of the interaction potential of polymers by their solubility
parameter is important for questioning the phase morphology of blends as well as the solubility
of low molecular compounds in these blends. The solubility parameter values used in this work
were determined with the help of inverse-gas-chromatography [55] and equilibrium swelling [40].

Chapter 4. Results and discussion 47
Using the δ-parameter concept the blends consist of at least one polar component were
discussed.
Estimated interfacial tension
For this part NR blends with different types of SBR were studied. The styrene content in SBR
was kept constant while the content of 1,2-butadiene units was varied stepwise. Due to the fact
that cis-1,4-butadiene units are more polarizable than 1,2-butadiene units and 1,2-butadiene
units demonstrates a similar polarizability as cis-1,4-isoprene units the decreasing content of
1,2-butadiene units in SBR 1 to 3 (Table 2) leads to an increase of the average polarizability of
the polymer (Table 3).
Table 3. δ-parameters of rubbers used as determined by IGC
Polymer δ(J/cm³)1/2
NR 16,7
BR 17,2
SBR1 17,4
SBR2 17,6
SBR3 17,7
Thermodynamic similarities in the blend constituents expressed in similar solubility parameters
lead to negligible or no longer detectible interfacial tension. If the interaction between the
components of the system decreases and the δ-parameter difference of the two rubbers (∆δ)
rises, the interfacial tension increases. In this manner, the solubility parameter difference can be
used to estimate the interfacial tension in a rubber blend.
As consequence, the solubility parameters of the corresponding polymers increase in the
sequence SBR1 > SBR2 > SBR3. If the compatibility towards NR is impaired, some sequences
and the interfacial tension expressed by the solubility parameter difference δNR - δSBR are
increasing. From Table 2 one can easily predict that the interfacial tension in the system is
increasing in the sequence
NR/SBR 3 < NR/SBR 2 < NR/SBR 1
Thus, 1,2-butadiene units provide the SBR with a higher thermodynamic similarity with NR.
Contrary to the effect of vinyl groups, the introduction of oxirane rings (epoxy groups) in the
polymer backbones significantly changes the strength of inter- and intermolecular interaction
because it changes the concentration and the distribution of dipoles and induced dipoles along
the polymer chains.

Chapter 4. Results and discussion 48
A considerable increase in the solubility parameter is obtained by introducing 50 wt.% epoxy
groups into NR of about 18,5 (J/cm3)1/2 and by substituting cis- and trans-1,4-butadiene units by
30 wt.% epoxy groups into SBR2 respectively a solubility parameter of about 18,8 (J/cm3)1/2 is
founded (Figure 15).
0
0.5
1
1.5
16 17 18 19 20 21
δ [(J/cm3)1/2
]
Sw
elli
ng
deg
ree
,Q
0
0.5
1
1.5
16 17 18 19 20 21
δ [(J/cm3)1/2]S
we
llin
gd
eg
ree
,Q
a) ENR b) EpSBR
Figure 15: Determination of solubility parameter for epoxidized rubbers by swelling
The estimates obtained from equilibrium swelling measurements indicate a slightly higher δ-
parameter for EpSBR than for ENR. Based on the data obtained, interfacial tension for the
blends with epoxidized rubbers is ENR/EpSBR < ENR/SBR2 < NR/ENR < NR/EpSBR.
Phase morphology
Besides the estimates based on the solubility parameter concept, the blends manufactured
under the same mixing conditions were investigated simultaneously by using DSC, DMA and
TEM.
BR/SBR blends
The influence of the microstructure of SBR on the glass transition temperature in BR/SBR
blends was investigated by DSC using the pure rubbers as reference (Table 4). First of all, the
increasing content of 1,2-butadiene units decrease significantly the chain flexibility and therefore
increases the corresponding Tg. A careful investigation of the thermograms reveals the
existence of two phases in the blend. The Tg-shift of each phase indicates that the blend
constituents demonstrate increasing partial solubility when the content of 1,2-butadiene units in
the SBR increases. The increase of the vinyl content in SBR-phase provokes a shift of Tg to
lower temperatures with 40°C because the higher content of 1,2-butadiene reduce the polarity
imparted by the styrene rings.

Chapter 4. Results and discussion 49
Table 4. DSC investigation of BR/SBR blends
Tg [°C] Blend
100/0 50/50 30/70 0/100
BR/SBR1 -103 - -90 -64 -89 -50 - -21
BR/SBR2 -103 - -95 -81 -90 -65 - -44
BR/SBR3 -103 - -98 -85 -91 -68 - -63
The DSC results were compared with the results obtained from DMA measurements (Figure
16). The characterization of rubber blends with the help of dynamic-mechanical spectroscopy
was focused on the evolution of the loss modulus G“ of the pure components and the blends as
a function of temperature. The DMA measurements of the systems under investigation
confirmed the results obtained by DSC (Figure 16). The damping peaks (G”max) for BR as well
as SBR are considerably shifted towards each other.
-120 -100 -80 -60 -40 -20 0
0
20
40
60
80
100
120
140
160
180
200 BR
SBR 8%-Vinyl
SBR 25%-Vinyl
SBR 50%-Vinyl
G"
[MP
a]
Temperatur [°C]
321
-120 -100 -80 -60 -40 -20 0
0
20
40
60
80
100
120
140
160
180
200 BR
SBR 8%-Vinyl
SBR 25%-Vinyl
SBR 50%-Vinyl
G"
[MP
a]
Temperatur [°C]
321
-120 -100 -80 -60 -40 -20
0
10
20
30
40
50
60
70
80 BR-SBR 8%-Vinyl
BR-SBR 25%-Vinyl
BR-SBR 50%-Vinyl
G"
[MP
a]
Temperatur [°C]
3
21
-120 -100 -80 -60 -40 -20
0
10
20
30
40
50
60
70
80 BR-SBR 8%-Vinyl
BR-SBR 25%-Vinyl
BR-SBR 50%-Vinyl
G"
[MP
a]
Temperatur [°C]
3
21
a) pure rubbers b)BR/SBR blends (30/70 blend ratio)
Figure 16: Dynamic mechanical analysis of pure rubbers and rubber blends
It can be seen that the damping peak becomes broader and shows a shoulder, which is
characteristic for the SBR-phase or BR-phase. This is a clear indication for phase separation
and leads to the statement that the lower the vinyl content the less the compatibility of the
BR/SBR blend. However, for BR/SBR2 such a bimodal peak is not observed. Both Tg’s are
shifted almost equally and result in a very broad damping maximum. To obtain a
complementary view of the influence of the microstructure on the phase morphology TEM
investigations were performed.
a) BR/SBR1 b) BR/SBR2 c) BR/SBR3
Figure 17: TEM micrographs of BR (30/70) blends with: a) SBR1; b) SBR2; c) SBR3

Chapter 4. Results and discussion 50
Figure 17 highlights the differences between the three blends. The bright domains represent the
SBR-phase that is dispersed in the dark BR-phase. Immediately evident is the difference in
shape of the bright domains. They become larger as the amount of vinyl groups in SBR
decrease. In the BR/SBR3, further decreases of the amount of the vinyl groups produce a
significant phase separation. These results confirm the ones obtained by DMA measurements.
NR/SBR blends
In the case of NR/SBR blends, a first characterization was made by dynamic mechanical
investigation of the pure rubbers. By comparing the curves G“ vs (T) for the raw polymers NR,
SBR1, SBR2 and SBR3 it can be seen that the signals for NR and SBR3 are almost overlapping
whereas for SBR2 and SBR1 with a higher content of 1,2-butadiene units the glass transition
occur at considerable higher temperatures (Figure 18). The blend NR/SBR3 exhibits one single
damping peak caused by the rare incidence of the Tg's of the polymers under consideration.
Therefore, it cannot be decided by DMA whether the polymers are incompatible.
Figure 18: Loss modulus vs. temperature for pure components NR, SBR1, SBR2 and SBR3
Similar results conducted on these rubber blends were obtained by DSC measurements. Table
5 shows the presence of one Tg for NR/SBR3 while the NR/SBR2 blend presents two distinctive
Tg characteristics for both rubbers.
Table 5. DSC investigation of NR/SBR blends
Tg [°C] Blend
100/0 50/50 30/70 0/100
NR/SBR2 -63 - -62 -46 -61 -45 - -44
NR/SBR3 -63 - -61 -62 - -63
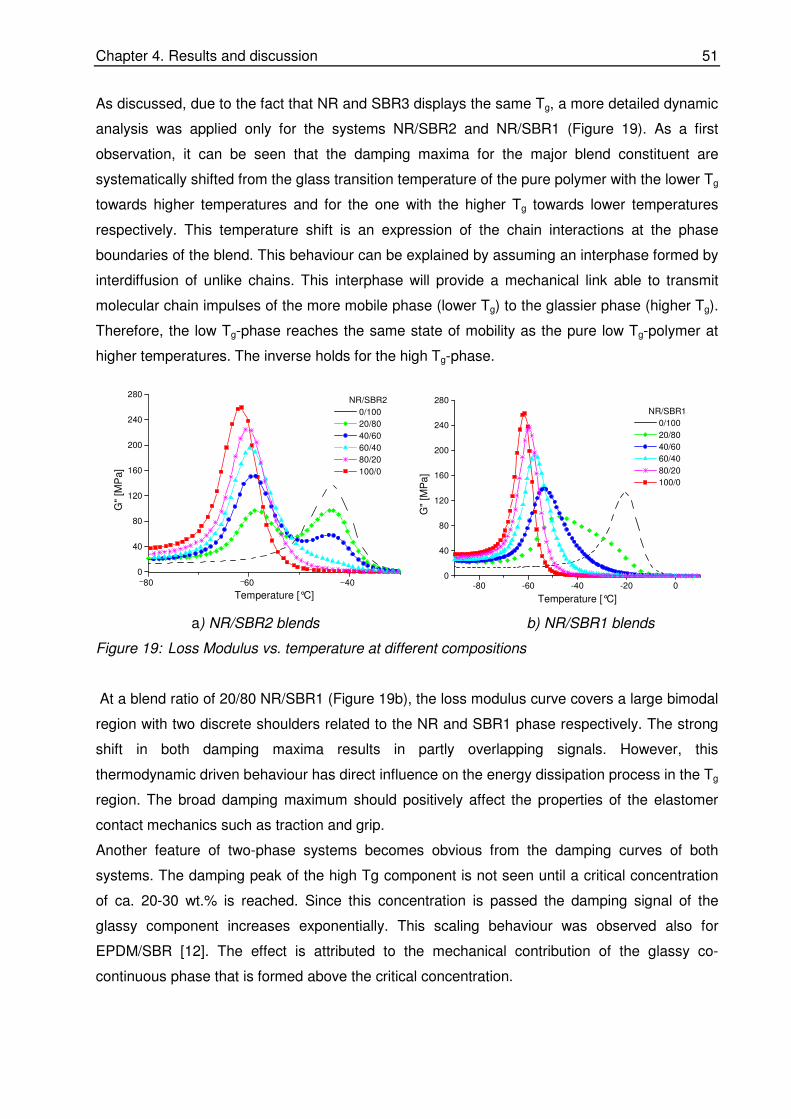
Chapter 4. Results and discussion 51
As discussed, due to the fact that NR and SBR3 displays the same Tg, a more detailed dynamic
analysis was applied only for the systems NR/SBR2 and NR/SBR1 (Figure 19). As a first
observation, it can be seen that the damping maxima for the major blend constituent are
systematically shifted from the glass transition temperature of the pure polymer with the lower Tg
towards higher temperatures and for the one with the higher Tg towards lower temperatures
respectively. This temperature shift is an expression of the chain interactions at the phase
boundaries of the blend. This behaviour can be explained by assuming an interphase formed by
interdiffusion of unlike chains. This interphase will provide a mechanical link able to transmit
molecular chain impulses of the more mobile phase (lower Tg) to the glassier phase (higher Tg).
Therefore, the low Tg-phase reaches the same state of mobility as the pure low Tg-polymer at
higher temperatures. The inverse holds for the high Tg-phase.
80 60 40
0
40
80
120
160
200
240
280 NR/SBR2
0/100
20/80
40/60
60/40
80/20
100/0
G"
[MP
a]
Temperature [°C]-80 -60 -40 -20 0
0
40
80
120
160
200
240
280
NR/SBR1
0/100
20/80
40/60
60/40
80/20
100/0
G"
[MP
a]
Temperature [°C]
a) NR/SBR2 blends b) NR/SBR1 blends
Figure 19: Loss Modulus vs. temperature at different compositions
At a blend ratio of 20/80 NR/SBR1 (Figure 19b), the loss modulus curve covers a large bimodal
region with two discrete shoulders related to the NR and SBR1 phase respectively. The strong
shift in both damping maxima results in partly overlapping signals. However, this
thermodynamic driven behaviour has direct influence on the energy dissipation process in the Tg
region. The broad damping maximum should positively affect the properties of the elastomer
contact mechanics such as traction and grip.
Another feature of two-phase systems becomes obvious from the damping curves of both
systems. The damping peak of the high Tg component is not seen until a critical concentration
of ca. 20-30 wt.% is reached. Since this concentration is passed the damping signal of the
glassy component increases exponentially. This scaling behaviour was observed also for
EPDM/SBR [12]. The effect is attributed to the mechanical contribution of the glassy co-
continuous phase that is formed above the critical concentration.
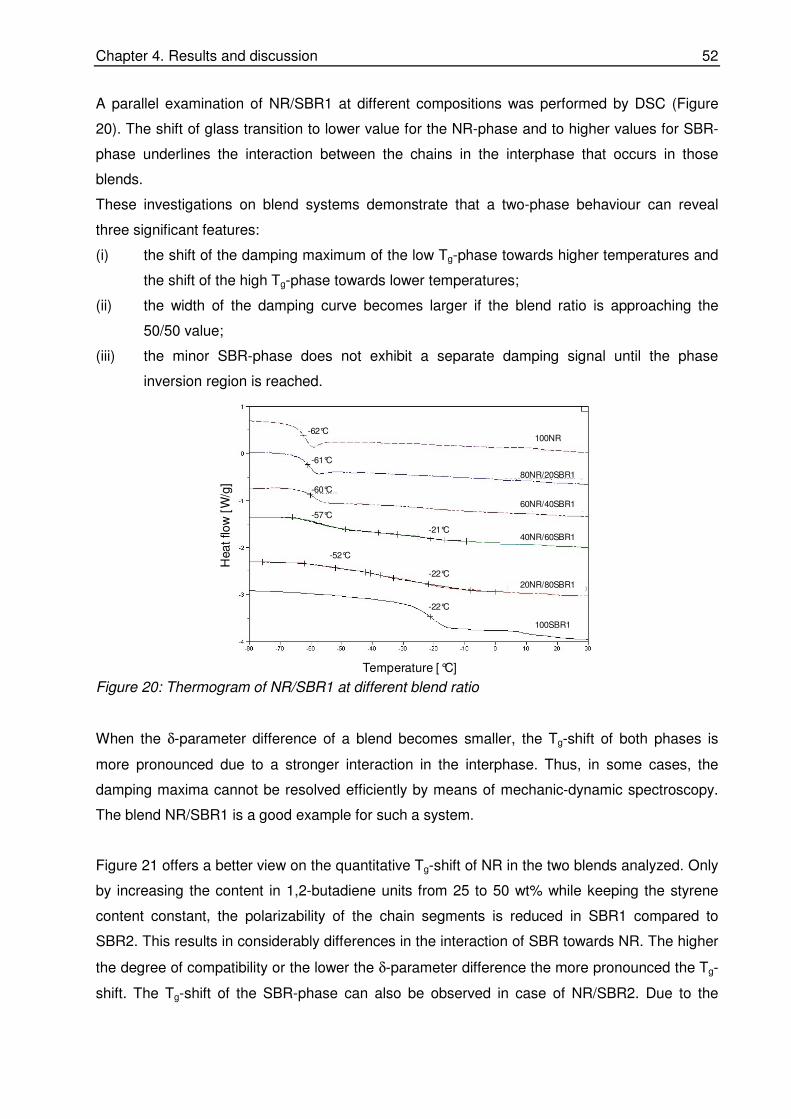
Chapter 4. Results and discussion 52
A parallel examination of NR/SBR1 at different compositions was performed by DSC (Figure
20). The shift of glass transition to lower value for the NR-phase and to higher values for SBR-
phase underlines the interaction between the chains in the interphase that occurs in those
blends.
These investigations on blend systems demonstrate that a two-phase behaviour can reveal
three significant features:
(i) the shift of the damping maximum of the low Tg-phase towards higher temperatures and
the shift of the high Tg-phase towards lower temperatures;
(ii) the width of the damping curve becomes larger if the blend ratio is approaching the
50/50 value;
(iii) the minor SBR-phase does not exhibit a separate damping signal until the phase
inversion region is reached.
Temperature [°C]
Heat flo
w[W
/g]
100NR
80NR/20SBR1
60NR/40SBR1
40NR/60SBR1
20NR/80SBR1
100SBR1
-62°C
-61°C
-60°C
-57°C
-21°C
-52°C
-22°C
-22°C
Figure 20: Thermogram of NR/SBR1 at different blend ratio
When the δ-parameter difference of a blend becomes smaller, the Tg-shift of both phases is
more pronounced due to a stronger interaction in the interphase. Thus, in some cases, the
damping maxima cannot be resolved efficiently by means of mechanic-dynamic spectroscopy.
The blend NR/SBR1 is a good example for such a system.
Figure 21 offers a better view on the quantitative Tg-shift of NR in the two blends analyzed. Only
by increasing the content in 1,2-butadiene units from 25 to 50 wt% while keeping the styrene
content constant, the polarizability of the chain segments is reduced in SBR1 compared to
SBR2. This results in considerably differences in the interaction of SBR towards NR. The higher
the degree of compatibility or the lower the δ-parameter difference the more pronounced the Tg-
shift. The Tg-shift of the SBR-phase can also be observed in case of NR/SBR2. Due to the

Chapter 4. Results and discussion 53
formation of a bimodal damping maximum, it is rather difficult to assess a quantitative value for
this Tg-shift.
Another important indicator by which the compatibility of blends can be expressed is the half
width of the damping peak in the major phase. The analysis of the damping behaviour of the two
blends NR/SBR1 and NR/SBR2 provides information about the changing of the half width in
those blends. In the order in which compatibility increases, the half width likewise increases by a
constant volume fraction of the NR components.
-65
-62
-59
-56
-53
-50
0 0,2 0,4 0,6 0,8 1
φ
Tg [
°C]
NR(NR/SBR2)
NR(NR/SBR1)
Figure 21: Shift of Tg(NR) in NR/SBR2 and NR/SBR1 blends (Blend systems are indicated; φ is
the volume fraction of NR)
However, due to the pronounced Tg-shift of the SBR1-phase signal in NR/SBR1 the damping
peak at a blend ratio of 40/60 demonstrates a bimodal shape. This leads to an overestimation of
the half width in Figure 22.
In conclusion, both, the Tg-shift and the broadness of the damping peaks can be considered as
phenomenological criteria for evaluating polymer compatibility.
8
10
12
14
16
18
20
0 0.25 0.5 0.75 1
φ
HW
(°C
)
NR/SBR1
NR/SBR2
Figure 22: Half width (HW) of the NR damping peaks vs. the volume fraction of NR

Chapter 4. Results and discussion 54
When investigating the G“(T) curves of NR/SBR2 as a function of composition (Figure 19a)
more carefully, it can be observed that G“ for SBR2 is very small until a critical concentration
(ca. φ = 0,35) is reached. The SBR2-phase does participate insignificantly in the entire
mechanical behaviour. Above this critical concentration, an exponential increase in the damping
maximum can be observed. This behaviour is related to the phenomenon of phase inversion.
Below the critical concentration, the minor SBR2-phase is dispersed as more or less glassy
domains in the amorphous and rubbery NR matrix. The mechanical response of such dispersed
glassy domains should correspond to that of hydro-dynamical reinforcing effects. Above the
critical concentration the increase in G“ can be attributed to the formation of a co-continuous
phase morphology in which the predominant mechanical contribution is controlled by the glassy
polymer. However, the limiting value is reached when the glassy polymer becomes the
continuous phase at even higher concentrations. The critical concentration indicates the "phase
inversion" where co-continuous morphology is formed. In the entire system, the formation of the
interconnected rigid branches of the glassy polymer forms plays a major mechanical role [11].
In case of NR/SBR1 with a higher degree of compatibility, this special feature is also observed
(Figure 19b), even if the formation of a broad bimodal damping peak makes it more difficult to
assign the individual mechanical contributions of the blend constituents. Up to a 40%
concentration of SBR1, only the damping maximum of NR is observed. Above this
concentration, the SBR1 phase forms a discrete and exponentially increasing damping
maximum. The mechanically observable critical concentration threshold for the formation of co-
continuous phase morphology is shifted to higher concentrations of SBR. For the less
compatible blend NR/SBR2 the appearance of a discrete SBR-phase signal becomes evident at
much lower concentrations. This can be also understood by the fact that the volume fraction of
SBR-chains involved in an intimate interaction with NR is smaller. The evolution of the damping
maximum of the high Tg-phase as a function of the blend composition is shown for both blend
systems in Figure 23.
0
40
80
120
160
0 0.25 0.5 0.75 1
φ
G"
[MP
a]
NR (NR/SBR2)
NR(NR/SBR1)
Figure 23: Inverse of the damping signal of the SBR-phase in NR/SBR2 and NR/SBR1 blends
(Blend systems are indicated; φ is the volume fraction of SBR)

Chapter 4. Results and discussion 55
Transmission Electron Microscopy gives essential information about the morphology of the
blends. In the micrographs obtained, the NR phase appears as bright domains while the SBR
phase forms the dark ones due to higher electron density. In order to evaluate the influence of
the δ-parameter difference and the interfacial tension the blend ratio of 20/80 was chosen. By
this, the dispersed domains of the minor phase can be determined more precisely, because the
interpenetrating phase network has not yet been formed.
Figure 24 shows the phase morphology at constant mixing time (10 min) for the three blends
under investigation.
b) NR/SBR2a) NR/SBR3 c) NR/SBR1
Figure 24: TEM micrographs of NR blends with: a) SBR3; b) SBR2; c) SBR1 at (20/80)
It can be observed that by increasing the content of 1,2-butadiene units in SBR (from SBR3 to
SBR1), the dispersed NR domains become smaller and their shape is less elongated and more
ellipsoidal or even spherical. In addition, the size distribution becomes narrower. This means
also that the blends become more homogeneous. The improvement of the blend homogeneity
also should lead to better processing behaviour and improved physical properties of the
crosslinked material. Considering the equivalent sphere diameters for the dispersed domains, it
has been found that the average domain size increases linearly with increasing the δ-parameter
difference (Figure 25).
350
375
400
425
0.50 0.70 0.90 1.10
∆δ [J/cm3]
d [
nm
]
Figure 25: The average domain size vs. solubility parameter difference
The observed dependency is confirming the theoretical considerations that require
proportionality between the average domain size of a blend system and the interfacial tension,
which is approximated in this work by the δ-parameter difference.
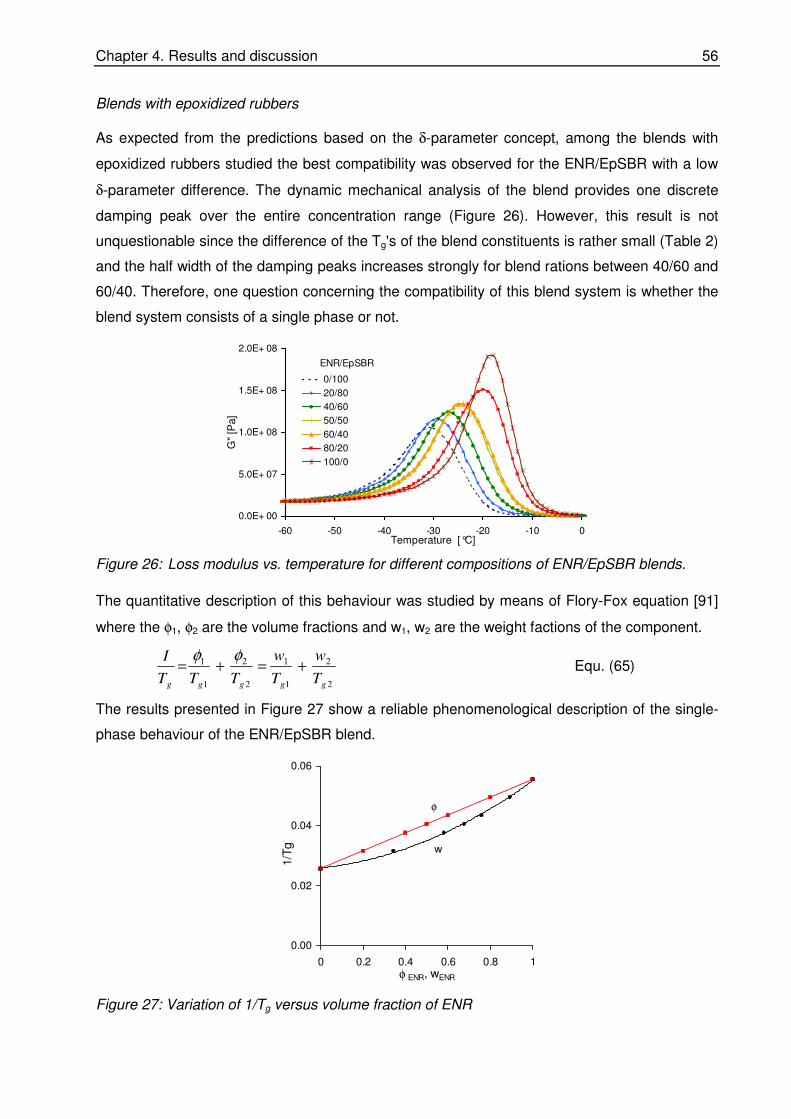
Chapter 4. Results and discussion 56
Blends with epoxidized rubbers
As expected from the predictions based on the δ-parameter concept, among the blends with
epoxidized rubbers studied the best compatibility was observed for the ENR/EpSBR with a low
δ-parameter difference. The dynamic mechanical analysis of the blend provides one discrete
damping peak over the entire concentration range (Figure 26). However, this result is not
unquestionable since the difference of the Tg's of the blend constituents is rather small (Table 2)
and the half width of the damping peaks increases strongly for blend rations between 40/60 and
60/40. Therefore, one question concerning the compatibility of this blend system is whether the
blend system consists of a single phase or not.
0.0E+ 00
5.0E+ 07
1.0E+ 08
1.5E+ 08
2.0E+ 08
-60 -50 -40 -30 -20 -10 0Temperature [°C]
G"
[Pa]
0/100
20/80
40/60
50/50
60/40
80/20
100/00
ENR/EpSBR
Figure 26: Loss modulus vs. temperature for different compositions of ENR/EpSBR blends.
The quantitative description of this behaviour was studied by means of Flory-Fox equation [91]
where the φ1, φ2 are the volume fractions and w1, w2 are the weight factions of the component.
2
2
1
1
2
2
1
1
ggggg T
w
T
w
TTT
I+=+=
φφ Equ. (65)
The results presented in Figure 27 show a reliable phenomenological description of the single-
phase behaviour of the ENR/EpSBR blend.
0.00
0.02
0.04
0.06
0 0.2 0.4 0.6 0.8 1φ ENR, wENR
1/T
g w
φ
Figure 27: Variation of 1/Tg versus volume fraction of ENR

Chapter 4. Results and discussion 57
Due to the limited resolution of the dynamic-mechanical spectroscopy and the observation that
half width of the damping maxima increases significantly the morphology of this blend as well as
the others containing the epoxidated polymers were investigated by ESI-TEM. This method
(Figure 28 delivers valuable information concerning the phase morphology. The presence of two
distinct phases was noticed in all the blends under consideration. The presumed phase
separation for ENR/EpSBR was demonstrated by TEM. The optical contrasting procedure
facilitates a better insight in the material by exploiting different electron densities. The sensitivity
of the TEM method was of advantage for investigation.
∆δ = 2,1 (J/cm3)1/2 ∆δ = 1,8 (J/cm
3)1/2 ∆δ = 0,9 (J/cm
3)1/2
∆δ = 0,3(J/cm3)1/2
c) 20ENR/80SBR2 d) 20ENR/80EpSBRa) 20NR/80EpSBR b) 20NR/80ENR
Figure 28: TEM micrographs of various blend systems
The polarity gap between the blends constituents is higher for NR/EpSBR due to the presence
of both the polar oxirane rings and the styrene segments in the EpSBR (Figure 29a). The phase
separation that occurs in this system was demonstrated also by the dynamic mechanical
investigation (Figure 29 a and b). Considering the non-polar system NR/SBR2 as a reference,
the average size of the bright NR domains is smaller than those shown for ENR/SBR2. The
presence of epoxy groups in polyisoprene chains increases considerably the solubility
parameter and reduces the thermodynamic dissimilarity in the ENR/SBR2 blend.
0.0E+0
7.0E+7
1.4E+8
2.1E+8
-80 -70 -60 -50 -40 -30 -20 -10
Temperature [°C]
G"
[Pa]
100/0
80/20
60/40
50/50
40/60
20/80
0/100
NR/EpSBR
0E+0
5E+7
1E+8
2E+8
2E+8
-60 -50 -40 -30 -20 -10
Temperature [°C]
G"
[Pa
]
100/0
80/20
60/40
50/50
40/60
20/80
0/100
SBR2/ENR
a) NR/EpSBR b) ENR/SBR2
Figure 29: Loss modulus vs. temperature for different compositions of NR/EpSBR and
ENR/SBR2 blends

Chapter 4. Results and discussion 58
Epoxidation of 30% of the butadiene units of SBR leads in NR/EpSBR to even larger NR
domains with a broad size distribution and poor blend homogeneity. Compared to NR/SBR2 the
majority of the NR domains present an elongated shape, preserving to some extent the
influence of the shear field during the mixing process (Figure 29). The elongated shape of the
NR domains can also be observed for NR/ENR, however the NR domain size is slightly smaller
in comparison to those of NR/EpSBR.
Further, the study of the influence of viscosity on the blend morphology of the two systems
consisting of ENR and SBR2 with different blend concentrations is summarized in Figure 30.
ENR/SBR2 80/20
ENR/SBR2 20/80
0
10
20
30
40
0 4 8 12 16
Torq
ue [N
m]
Time [min]
ENR/SBR2 20/80
ENR/SBR2 80/20
Figure 30: Influence of the viscosity on the morphology of ENR/SBR2 blends
The TEM micrograph of 20/80 ENR/SBR2 shows small white NR domains dispersed in the dark
SBR matrix meanwhile when the 80/20 ENR/SBR2 investigated the dark SBR domains are
larger being dispersed in the NR matrix. The size of the larger domains is dependent on the
used mixture energy, which decreases with increasing of the torque that means that the 20/80
ENR/SBR2 has a higher viscosity compared to 80/20 ENR/SBR2.
Blends with nitrile rubbers
If a rubber blend consists of two rubbers with different polarity, i.e. NR and NBR, the δ-
parameter difference is high, leading to strongly phase separated blends. The influence of the
acylonitrile groups on the blend morphology was investigated by using NBR with an increasing
content of acrylonitrile groups (Table 2 and Figure 31).
The comparison of the raw polymers demonstrates that the acrylonitril content has a significant
influence on the glass transition temperature of the rubbers. An increase of the ACN content
results in a shift of the Tg to higher temperatures (Figure 31a). The dynamical mechanical
investigation of all NR/NBR rubber blends shows two discrete glass transitions for both rubber

Chapter 4. Results and discussion 59
phases (Figure 31b). The Tg's of the blend are the same as the Tgs of the rubbers in the pure
state.
-80 -60 -40 -20 00
50
100
150
200
250
300
NR NBR1 NBR2 NBR3
G"[M
Pa]
Temperatur [°C]
3
A)
NR / NBR1 NR / NBR2 NR / NBR3
-80 -60 -40 -20 00
20
40
60
80
100
120
140
160
G"[ M
Pa]
Temp eratur [°C]
B)
Figure 31: Phase morphology investigations of: A) NR and NBR rubbers in pure state; B) the
NR/NBR blends with different ACN content
The large differences in the solubility parameter are responsible for the large domains size
found by TEM investigations. The domains formed by mixing of the two rubbers are very large,
to more extends considering that the magnification used was 1000 nm, when comparing with
NR/SBR. By NR/SBR system the magnification used was 500 nm. This result suggests how
large the domains in NR/NBR are and emphasises the incompatibility of those NR/NBR
systems. The DSC measurements summarized in Table 6 confirm the dynamic mechanical
measurements as well as the TEM investigation.
Table 6: DSC investigation of NR/NBR blends
Tg [°C] Blend
100/0 50/50 30/70 0/100
NR/NBR1 -62 - -63 -47 -62 -46 - -45
NR/NBR2 -62 - -62 -31 -62 -31 - -31
NR/NBR3 -62 - -62 -21 -62 -21 - -22
The findings obtained by the three methods indicated that NR/NBR systems are incompatible in
comparison with NR/SBR and BR/SBR blends. Higher difference between the solubility

Chapter 4. Results and discussion 60
parameters of the rubbers leads to a higher interfacial tension, which is responsible for this
behaviour.
Another example for an incompatible blend is the NBR3/SBR4 blend. The variation of the loss
modulus with temperature is presented in Figure 32.
SBR4
NBR3
20SBR4 / 80NBR3
0
20
40
60
80
100
120
140
-70 -50 -30 -10
Temperature [°C]
G''
[MP
a]
100 / 0
80 / 20
65 / 35
55 / 45
35 / 65
20 / 80
0 / 100
SBR4 /NBR3
Figure 32: Phase morphology analysis of SBR4/NBR3 blends
Two different glass transitions could be observed, for the SBR-phase there is a slight shift of the
glass transition temperature to a small value respectively to higher temperatures for the NBR-
phase as the concentration of the minor component increases. Therefore, a phase separation
occurs in this system and leads to an incompatible system. These findings were observed also
by the thermal characterization displayed in Table 7.
Table 7: DSC investigation of SBR4/NBR3 blends
Blend ratio
SBR4/NBR3 Tg [°C]
100/0 -49 -
80/20 -49 -19
65/35 -49 -20
55/45 -50 -20
35/65 -50 -20
20/80 -51 -23
0/100 - -23
This second example, SBR4/NBR3 underlines again that a higher difference in the solubility of
the two rubbers plays a major role in the compatibility of the rubber blends. The higher the
difference in the solubility parameter the less compatible blends is obtained. However, an even
small interaction leads to small Tg-shifts in the phase inversion phase.

Chapter 4. Results and discussion 61
Interphase
For an estimation of the interphase volume fraction in rubber, blends the information derived
from dynamical mechanical investigations can be exploited. From universal considerations of
energy conservation it becomes evident that in a composite system each phase contributes to
the mechanical modulus (G' or G“) with a value that is proportional to both the local deformation
of the phase under consideration and the volume fraction of the phase. Because the
micromechanics of polymer blends are not well known and the local deformation of particular
phases is difficult to be measured, the evaluation of the interphase was performed by a fitting
procedure [11, 13]. It was assumed that the experimentally measured loss modulus of the blend
components comprises the sum of the relaxations of all phases present in the blend. The
contribution of the interphase formed by interdiffusion of unlike chains should demonstrate its
mechanical response in the temperature range between the two glass transition temperatures of
the blend constituents. Further on, the fitting procedure [11] was performed so that the curves
G“ vs. T of the original (pure) polymers were fitted for the blend ratio under consideration and
adjusted for a temperature shift. After these operations the curves were summed up by taking
into consideration that the sum should result exactly in the front and rear profile of the
experimental curve G“(T) below the lower and above the upper damping maximum.
Examining several rubber blends and considering the variation of the vinyl amount in styrene
butadiene rubber or by introducing epoxy rings interesting results about the study of interphase
were encompassed.
BR/SBR blends
The fitting procedure used to describe the loss modulus as a function of the temperature has
been applied by modifying the three spline fit parameters (the amplitude, the temperature shift
and the width of the damping maxima) of the two components of the blend for the best fit to the
experimental curves. As a result, the calculated curve fits very well the area below the low Tg-
peak and above the high Tg-peak, but does not fit the curve in the temperature range between
the two damping maxima. The difference of the blends signal and the two-phase fit is
considered as the mechanical damping signal of the interphase. Irrespective of the local
deformations of the interphase present in the blend, the amplitude or more accurately the area
of the interphase signal corresponds to the volume fraction of the interphase.
A first blend investigated was BR/SBR where it was intended to see the influence of
microstructure of SBR on the interphase. The SBR1, SBR2 to SBR3 were used. A convenient
and compact way of comparing systems is by plotting the interphase loss modulus signal
against the temperature. From such a diagram, it could be observed which system leads to a
higher interphase (Figure 33a). The interphase area obtained was standardized to the area of
BR/SBR3 and is plotted as a function of the vinyl content.
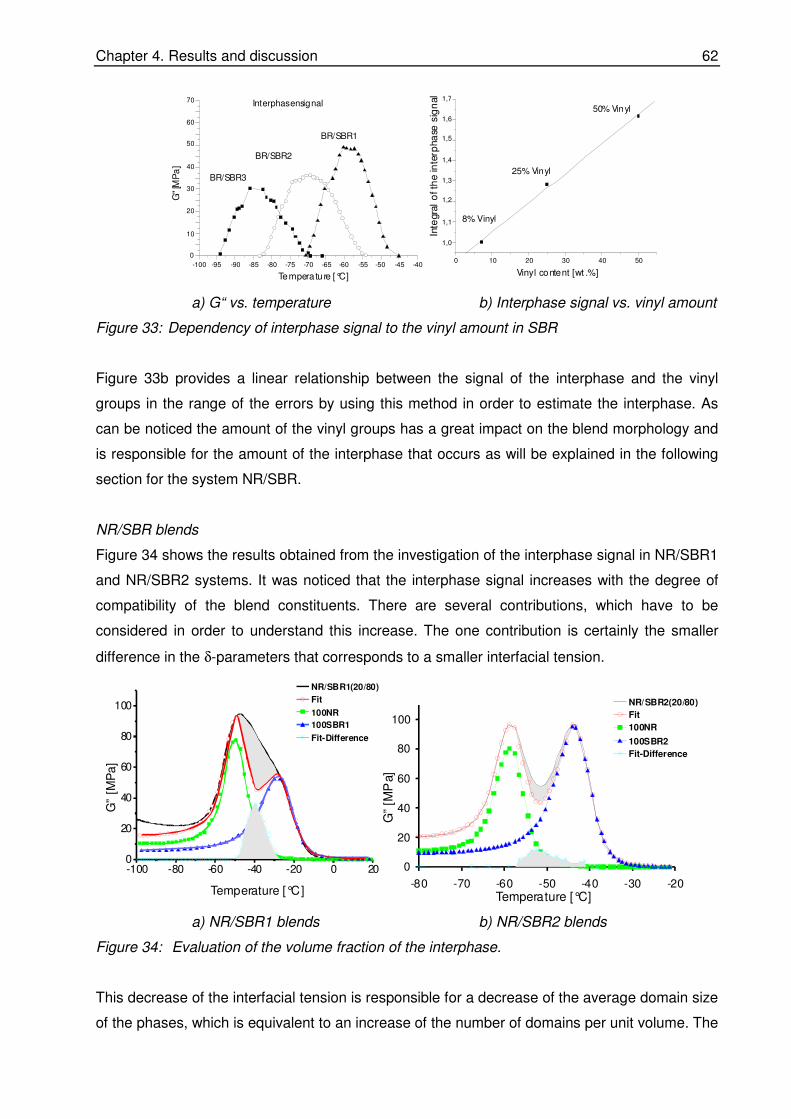
Chapter 4. Results and discussion 62
-100 -95 -90 -85 -80 -75 -70 -65 -60 -55 -50 -45 -40
0
10
20
30
40
50
60
70 Interphasensignal
BR/SBR1
BR/SBR2
BR/SBR3G
"[M
Pa
]
Temperature [°C]
0 10 20 30 40 50
1,0
1,1
1,2
1,3
1,4
1,5
1,6
1,7
50% Vinyl
25% Vinyl
8% Vinyl
Vinyl content [wt .%]
Inte
gra
l o
f th
e in
terp
ha
se s
ign
al
a) G“ vs. temperature b) Interphase signal vs. vinyl amount
Figure 33: Dependency of interphase signal to the vinyl amount in SBR
Figure 33b provides a linear relationship between the signal of the interphase and the vinyl
groups in the range of the errors by using this method in order to estimate the interphase. As
can be noticed the amount of the vinyl groups has a great impact on the blend morphology and
is responsible for the amount of the interphase that occurs as will be explained in the following
section for the system NR/SBR.
NR/SBR blends
Figure 34 shows the results obtained from the investigation of the interphase signal in NR/SBR1
and NR/SBR2 systems. It was noticed that the interphase signal increases with the degree of
compatibility of the blend constituents. There are several contributions, which have to be
considered in order to understand this increase. The one contribution is certainly the smaller
difference in the δ-parameters that corresponds to a smaller interfacial tension.
-100 -80 -60 -40 -20 0 200
20
40
60
80
100
Temperature [°C]
G”
[MP
a]
NR/SBR1(20/80)
Fit
100NR
100SBR1
Fit-Difference
0
20
40
60
80
100
-80 -70 -60 -50 -40 -30 -20
NR/SBR2(20/80)
Fit
100NR
100SBR2
Fit-Difference
G”
[MP
a]
Temperature [°C]
a) NR/SBR1 blends b) NR/SBR2 blends
Figure 34: Evaluation of the volume fraction of the interphase.
This decrease of the interfacial tension is responsible for a decrease of the average domain size
of the phases, which is equivalent to an increase of the number of domains per unit volume. The

Chapter 4. Results and discussion 63
other contribution originates also in the interfacial tension but affects the thickness of the
interphase that increases inverse proportional to the interfacial tension.
The amount of interphase in NR/SBR blends with different content in 1,2-butadiene units was
measured at different blend ratios (Figure 35).
0.0 0.2 0.4 0.6 0.8 1.00.0
0.1
0.2
0.3
0.4
NR/SBR1
NR/SBR2
Volu
me F
ractio
n Inte
rphase
φi
φ SBR
Figure 35: Volume fraction of the interphase as a function of blend composition for NR/SBR
blends
It can be noticed that due to the rather high degree of compatibility in the case of NR/SBR1
blend, the volume fraction of the interphase reaches high values of 0,4. If the interfacial
thickness in this blend is calculated by applying a simple geometrical core-shell model taking
the equivalent shear diameter of the domains into account, a surprisingly high value of ca. 30 -
35 nm is found. It can be concluded that the mechanical method applied to a crosslinked system
overestimates the thickness of the interphase and the volume fraction as well. The entire curve
has a symmetrical aspect; the maximum value of the interphase signal is achieved at φSBR ≈ 0,5.
The less compatible NR/SBR2 blend demonstrates only a volume fraction of the interphase of
0,28 at a SBR concentration of φSBR ≈ 0,75. The observed asymmetry of the curve was found for
other blend systems as well (see below). The shape of the curve can be explained by taking into
consideration the interaction potentials of the discrete chain segments in SBR and NR. The
polarizability of cis-1,4-isoprene units is equal or very similar to that of 1,2-butadiene units.
Therefore, the mutual interaction of these two unlike chain segments is providing the highest
energy exchange in intermolecular interactions. In comparison, the interaction between cis-1,4-
isoprene units and cis-1,4-butadiene units is less favourable. Assuming that the interacting SBR
chains present in the interphase can change their coil conformation to some extend, it can be
assumed that by effecting such conformational changes more 1,2-butadiene units are placed in
the interphase. Thus, they can interact with the cis-1,4-isoprene of the NR chains units placed in
the interphase. By increasing the volume fraction of SBR2 (smaller content in 1,2 butadiene

Chapter 4. Results and discussion 64
units), the probability that such conformational changes lead to energetically favourable
interactions increases. Only at an excess of SBR2 the energetic inside the interphase seems to
be similar to those in the NR/SBR1 (50/50) blend.
Blends with epoxidized rubbers
For blend systems containing epoxidized rubber, the volume fraction of the interphase was
determined by using the same procedure.
φ
, φIP
H
0,00
0,05
0,10
0,15
0,20
0,25
0,30
0,0 0,2 0,4 0,6 0,8 1,0
NR / ENR
NR / EpSBR
Inte
rph
ase
vo
lum
efr
actio
n
NRNR
ENREpSBR
0,00
0,05
0,10
0,15
0,20
0,25
0,30
0,0 0,2 0,4 0,6 0,8 1,0
NR / ENR
NR / EpSBR
Inte
rph
ase
vo
lum
efr
actio
n
NRNR
ENREpSBR
NR / EpSBR
NR / ENR
0,00
0,05
0,10
0,15
0,20
0,25
0,30
0,0 0,2 0,4 0,6 0,8 1,0
SBR2 / ENR
SBR2 / EpSBR
Inte
rph
ase
vo
lum
efr
actio
n
SBRSBR
EpSBRENR
0,00
0,05
0,10
0,15
0,20
0,25
0,30
0,0 0,2 0,4 0,6 0,8 1,0
φ
SBR2 / ENR
SBR2 / EpSBR
Inte
rph
ase
olu
me
fracti
n, φ
IPH
SBRSBR
EpSBRENR
a) NR with different rubbers b) SBR with different rubbers
Figure 36: Interphase signal vs. SBR-volume fraction for different rubber blends
The NR blends with ENR and EpSBR display a similar but lower value of the interphase volume
fraction than the one of NR/SBR2 taken as a reference.
In Figure 36 b it can be noticed that the maximum of the interphase volume fraction varies 0,07
for the EpSBR/SBR2 blend to 0,05 respectively for the ENR/SBR2 blend. These different
maxima of the interphase volume fraction occur because of the interaction between the rubber
chains due to the polarity of the epoxidised rubber.
4.2 Rubber-additive interaction
Low molecular substances, most of them undefined mixtures, are being employed to improve
processing of compounds containing rubber blends. The effects of these mixes, often named as
additives, is reaching from lowering the viscosity of polymer blends over modification of low
temperature properties to phase compatibilization. Depending upon processing and content of
these additives lower energy consumption in the production of raw rubber compounds or a
higher level of quality assurance in respect to specified product properties can be achieved by
the use of these substances. As raw materials easily accessible substances with a heat of
evaporation as low as possible (which means having a high molecular weight) and with a
melting point above room temperature, preferably as solid materials, are being employed.
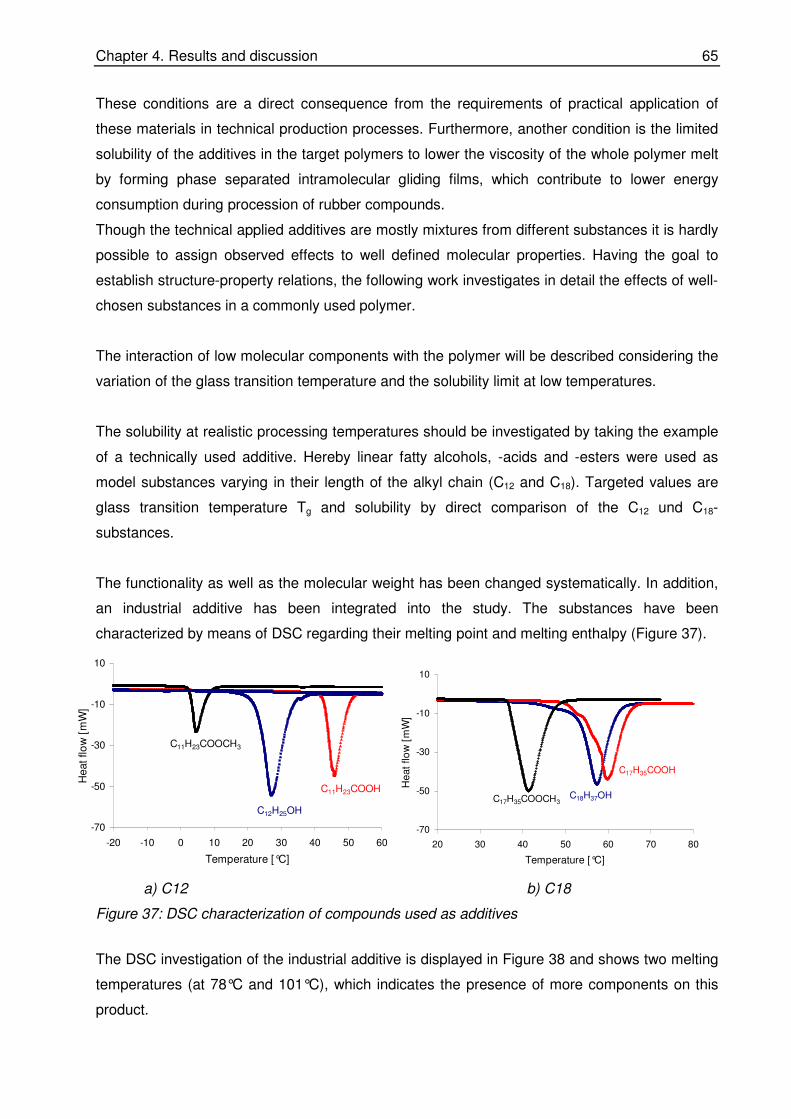
Chapter 4. Results and discussion 65
These conditions are a direct consequence from the requirements of practical application of
these materials in technical production processes. Furthermore, another condition is the limited
solubility of the additives in the target polymers to lower the viscosity of the whole polymer melt
by forming phase separated intramolecular gliding films, which contribute to lower energy
consumption during procession of rubber compounds.
Though the technical applied additives are mostly mixtures from different substances it is hardly
possible to assign observed effects to well defined molecular properties. Having the goal to
establish structure-property relations, the following work investigates in detail the effects of well-
chosen substances in a commonly used polymer.
The interaction of low molecular components with the polymer will be described considering the
variation of the glass transition temperature and the solubility limit at low temperatures.
The solubility at realistic processing temperatures should be investigated by taking the example
of a technically used additive. Hereby linear fatty alcohols, -acids and -esters were used as
model substances varying in their length of the alkyl chain (C12 and C18). Targeted values are
glass transition temperature Tg and solubility by direct comparison of the C12 und C18-
substances.
The functionality as well as the molecular weight has been changed systematically. In addition,
an industrial additive has been integrated into the study. The substances have been
characterized by means of DSC regarding their melting point and melting enthalpy (Figure 37).
-70
-50
-30
-10
10
-20 -10 0 10 20 30 40 50 60
Temperature [°C]
He
at
flo
w [
mW
]
C11H23COOH
C12H25OH
C11H23COOCH3
-70
-50
-30
-10
10
20 30 40 50 60 70 80
Temperature [°C]
He
at
flo
w [
mW
]
C18H37OH
C17H35COOH
C17H35COOCH3
a) C12 b) C18
Figure 37: DSC characterization of compounds used as additives
The DSC investigation of the industrial additive is displayed in Figure 38 and shows two melting
temperatures (at 78°C and 101°C), which indicates the presence of more components on this
product.

Chapter 4. Results and discussion 66
-16
-12
-8
-4
0
40 60 80 100 120
Temperature [°C]
Hea
t flo
w [
mW
]
Figure 38: DSC characterization of the industrial additive
To obtain more information about the chemical composition of the industrial additive ATR-FT-IR
spectroscopy investigation was done. The results are comprised in Figure 39.
In the spectrum occur the characteristic bands of the symmetric C-H oscillation (2849 cm-1) and
the asymmetric C-H oscillation (2921 cm-1), the band for zinc-stearate to 1538 cm-1, the band for
CH2-group at 1400 cm-1 and 1465 cm-1. The doublet that appears at 722 cm-1 is characteristic
for CH2-groups, which are present in a long chain. The interpretation of the relatively simple IR-
spectrum leads to the conclusion that the industrial additive is a zinc salt based on fatty acid,
mixture of the C16 and C18 saturated and unsaturated chains.
Figure 39: IR-spectra of the industrial additive
The thermal characterization of the model additives and the industrial additive is summarized in
Table 8. A comparison of the results obtained with the data delivered by the literature is done.

Chapter 4. Results and discussion 67
Table 8. Compounds used as additives
Processing aids System Tm [°C] (Literature)
Tm [°C] ± 0,1
∆Hm [J/g] ± 0,36
C12H25 OH A 26 27 188
C11H23 COOH B 44 45 207
C11H23COOCH3 C 4,8 5 47 C18H37 OH D 61 57 192
C17H35 COOH E 68 60 248
C17H35 COOCH3 F 38 41 217 Industrial additive G - 78 101 17 52
It can be noticed that the experimental values obtained for the melting temperatures are in
agreement with the ones shown in literature considering small errors, which can be due to the
measuring method employed. The C12-ester shows a lower Tm comparing with the data given in
literature probably due to the fact that the additive used in this case has a less purity. Generally,
the same behaviour considering the melting temperature as well as the melting enthalpy was
observed.
The investigations were done on unvulcanisated samples using till 6 phr model additive. This
concentration range is relevant for technical application.
The sample abbreviation used combines the functionality, the number of C-atoms as displayed
in Table 8, and the concentration of the additive as indicated in Table 9. For example A1
represents the mixture of SBR4 with 1,5 phr n-dodecanol.
For the vulcanisation of the samples, sulphur and dithiophosphat (SDT) as accelerator were
used.
Table 9. Test recipes used
System [phr] Materials
0 1 2 3 4 5 6
SBR4 100,0 100,0 100,0 100,0 100,0 100,0 100,0 Processing aids - 1,5 3,0 4,5 6,0 30,0 - ZnO - - - - - - 4,0
Stearic acid - - - - - - 3,0
Rhenofit SASD (SDT)
- - - - - - 5,6
Sulphur - - - - - - 2,0
4.2.1 Impact on glass transition
By the addition of a low molecular component to a polymer, the free volume in the overall
system increases. Through this, the translational movements of the polymer chains are
favoured and this is expressed by a decrease of the glass transition temperature.
In order to gain more detailed information about the effect of the functional groups and the chain
length of the model additives on the low temperature mobility of rubber chains, the systems
were investigated by differential scanning calorimetry. As a result it was shown, that even at low

Chapter 4. Results and discussion 68
concentrations the additives lead to a decrease of the glass transition temperature (Tg) until the
phase separation is reached. The plasticizing efficiency (∆Tg/∆c), which is defined as the
decrease in Tg provoked by the concentration unit (in mole %) of a given additive was used for a
reliable comparison between the systems under consideration. Above of the concentration
where phase separation takes place the Tg of the polymer-additive mix tends to reach a
constant value within the frame of the experimental errors.
By employing pure substances as model additives the phase separation is additionally
supported by their crystallization tendency. Therefore, the appearance of an endothermic
melting peak indicates phase separation. The area of the peak corresponds to the melting
enthalpy of the share of phase separated model. This is exemplarily shown for the system
SBR4/C18 H37 OH in Figure 40. A discrete phase is formed even at 1,5 phr of the fatty alcohol
additive. By further increasing the additive concentration, the melting enthalpy and the melting
temperature increase. This indicates that the amount but also the size of the phase-separated
crystallites is increasing. As a result both values, the melting temperature and the melting
enthalpy, tend to reach the value of the pure additive while the Tg of the rubber remains
constant.
-0.1
-0.3
-0.7
-0.5
-30 -10 10 30 50 70
-24.2°C
-25.0°C
-25.3°C
-25.2°C
-25.0°C
0
D1
D2
D3
D4
Tg
42.6°C
48.7°C
50.7°C
36.6°C
39.3 J/g
32.3 J/g
23.3 J/g
30.2 J/g
Tm ∆Hm,blend
Temperature [°C]
Heat F
low
[W/g
]
Figure 40: Tg-concentration phase diagrams for SBR4/C18H37OH
Despite its long hydrocarbon chain the fatty alcohol is practically not soluble at low temperatures
in SBR4. A pronounced melting peak of the additive becomes obvious even at concentration of
5 mmole% indicates, that the electrostatic H-bonding interactions of the OH-groups govern the
phase separation. The opposite is the case for the methyl ester of the C12 and C18 fatty acids.
Figure 41 shows the case where phase separation of the C12-methylester does not occur in the
concentration range considered. The linear decrease of the glass transition temperature
indicates a good solubility of the ester in the polymer based on a good interaction. The Tg-shift
of 10 °C for 6 phr of the model additive indicates that by reducing the intermolecular interactions

Chapter 4. Results and discussion 69
of the additive to the level of dipole-dipole interactions the tendency for a crystallization driven
phase separation is not pronounced, the increase in free volume is higher than for the
corresponding alcohol the increase of the low temperature flexibility of the polymer.
-0.3
Temperature [°C]
C4
C3
C2
C1
0-0.1
-24.2°C
-27.8°C
-30.5°C
-32.5°C
-34.4°C
-0.2
-0.5
-0.4
-80 -60 -40 -20 0 20
Tg
Heat F
low
[W/g
]
Figure 41: Tg-concentration phase diagrams for SBR4/C11H23COOCH3
When comparing the plasticizing efficiency at very small additive concentrations it becomes
obvious that both the functional groups as well as the length of the hydrocarbon moiety of the
model additive are affecting this parameter (Figure 42 a and b). Irrespective of the molecular
weight (C-number) of the additive the methyl-ester demonstrates the highest plasticizing
efficiency, whereas the effects exerted by the alcohol and the acid respectively are similarly
graded. For the C12-additive series, the relatively short chain length of fatty alcohol and fatty
acid can bring sufficient solubility in order to give the plasticizing effect. The difference in the
plasticizing efficiency of the fatty acid ester is not so pronounced as in the C18-additive series.
Beside to the strongly reduced tendency to self-associations, the ester group is able for positive
interact with the phenyl groups of SBR. Both causes contribute to the observed shape of the
curve. The reduced plasticizing effects as well as the small solubility of the fatty alcohols and
the fatty acids can be attributed to the formation of intermolecular clusters based on strong
hydrogen bonds. The self-association of the molecules involved in the clustering process
reduces the translation movement as well as the rotation of the single molecule. Therefore,
clustering contributes to a reduction of the free volume of the additive if compared with the ones
not involved in such a self-organizing process.
By comparing the plasticizing efficiency for the C12- and C18-model additives it is shown that at
the same concentration (mmole %) small size molecules systematically exert a higher influence.
On one hand by reducing the chain length, the radius of gyration decreases and the free
rotation of the molecule as well as its relative free volume increases.
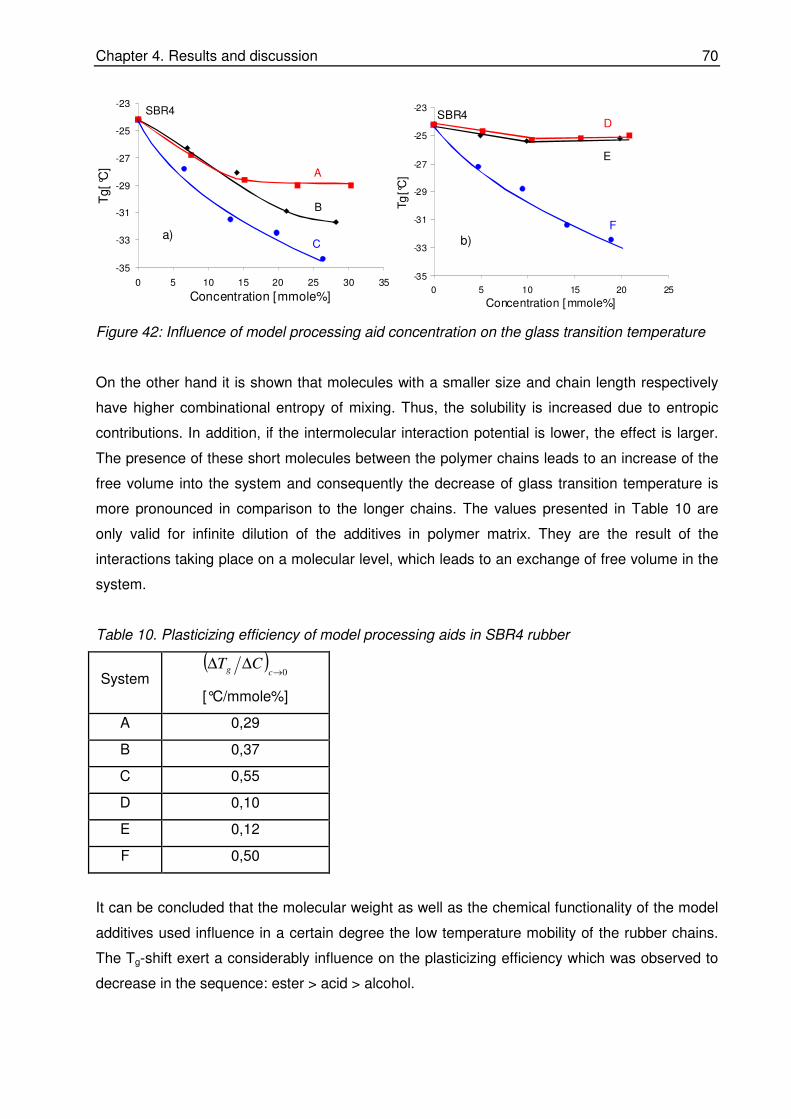
Chapter 4. Results and discussion 70
-35
-33
-31
-29
-27
-25
-23
0 5 10 15 20 25 30 35
Concentration [mmole%]
Tg[°
C]
SBR4
A
B
Ca)
-35
-33
-31
-29
-27
-25
-23
0 5 10 15 20 25
Concentration [mmole%]
Tg
[°C
]
SBR4D
E
F
b)
Figure 42: Influence of model processing aid concentration on the glass transition temperature
On the other hand it is shown that molecules with a smaller size and chain length respectively
have higher combinational entropy of mixing. Thus, the solubility is increased due to entropic
contributions. In addition, if the intermolecular interaction potential is lower, the effect is larger.
The presence of these short molecules between the polymer chains leads to an increase of the
free volume into the system and consequently the decrease of glass transition temperature is
more pronounced in comparison to the longer chains. The values presented in Table 10 are
only valid for infinite dilution of the additives in polymer matrix. They are the result of the
interactions taking place on a molecular level, which leads to an exchange of free volume in the
system.
Table 10. Plasticizing efficiency of model processing aids in SBR4 rubber
System ( )
0→∆∆
cg CT
[°C/mmole%]
A 0,29
B 0,37
C 0,55
D 0,10
E 0,12
F 0,50
It can be concluded that the molecular weight as well as the chemical functionality of the model
additives used influence in a certain degree the low temperature mobility of the rubber chains.
The Tg-shift exert a considerably influence on the plasticizing efficiency which was observed to
decrease in the sequence: ester > acid > alcohol.

Chapter 4. Results and discussion 71
4.2.2 Solubility of model processing aids
Direct information about the low temperature solubility is obtained from the Tg-concentration
diagrams. The concentration at which the Tg is no more decreasing but remains constant can be
considered as the solubility limit at low temperatures. The higher solubility of the C12-model
additives than that of the C18-ones can be explained by the contribution of two factors. One is
the larger increase of the mixing entropy for smaller molecules. The other is the lower melting
temperature of the smaller molecules.
At constant C-number of the additive, the chemical nature of the functional group governs the
solubility. The best solubility is shown for the methyl-ester, while the acid and the alcohol both
with stronger intermolecular interactions between molecules of the same kind, show phase
separation at quite low concentrations.
Information about the fraction of phase separated additive in the rubber was derived by using
the melting enthalpy ∆Hm of the additive as a molecular probe. By normalizing the measured
melting enthalpy of the additive in the mixture, ∆Hm blend, to the melting enthalpy of the pure
additive, ∆Hm pure, the fraction of phase separated additive in the system is obtained ∆Hm
blend/∆Hm pure. In the case of complete phase separation, the normalized melting enthalpy is equal
to 1. For the opposite case of total solubility, the normalized enthalpy is equal to 0. Any value
between these two extremes indicates the fraction of phase separated additive. The evolution of
the insoluble fraction is shown to be exemplarily for the systems A and B, where low
temperature phase separation occurs (Figure 43).
0 5 10 15 20 25 30 350.00
0.25
0.50
0.75
1.00 B
A
∆Hm
ble
nd / ∆
Hm
pure
Concentration [mmole%]
Figure 43: Insoluble fractions for system A and B in SBR4
The results show that the C12-acid (System B) is dissolved in the rubber matrix by a higher
amount than the corresponding alcohol (System A). Increasing the concentration of additive the
total amount of un-dissolved additive is increased. The limiting values at 6 phr additive are of ca.
0,85 for A and 0,77 for B. The entire evolution proves that the lower solubility of the alcohol can
be compared to the acid.
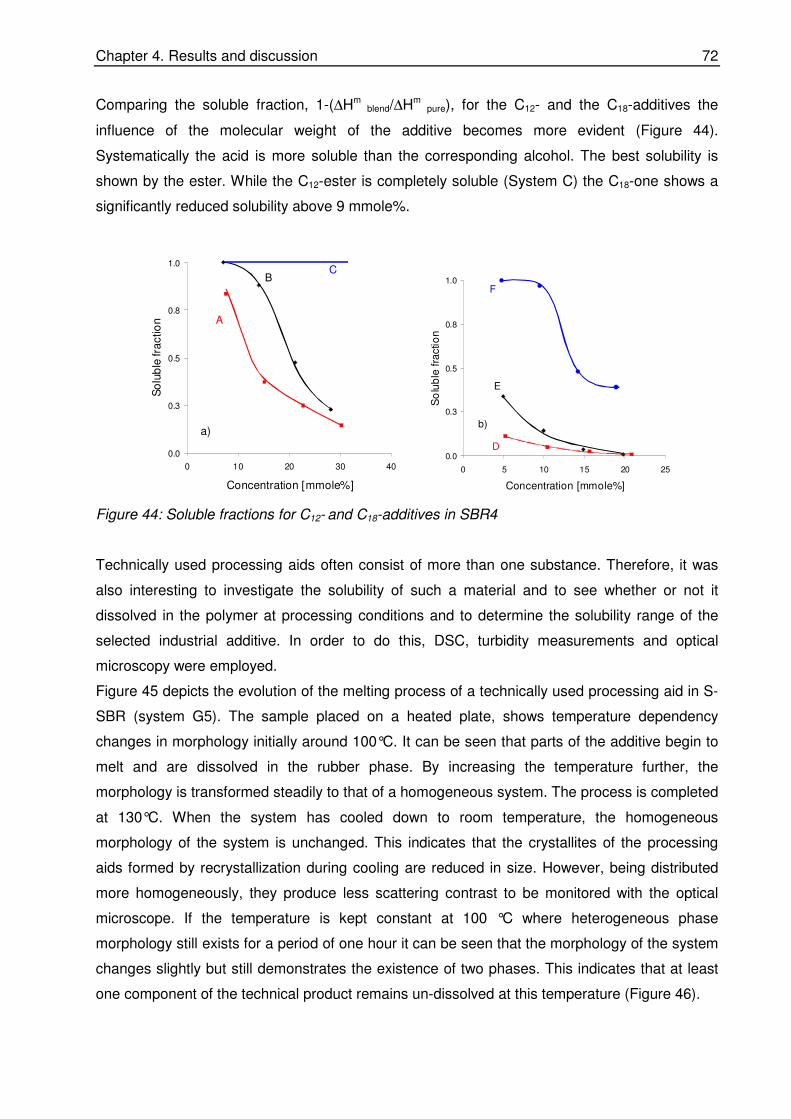
Chapter 4. Results and discussion 72
Comparing the soluble fraction, 1-(∆Hm blend/∆Hm
pure), for the C12- and the C18-additives the
influence of the molecular weight of the additive becomes more evident (Figure 44).
Systematically the acid is more soluble than the corresponding alcohol. The best solubility is
shown by the ester. While the C12-ester is completely soluble (System C) the C18-one shows a
significantly reduced solubility above 9 mmole%.
0.0
0.3
0.5
0.8
1.0
0 10 20 30 40
Concentration [mmole%]
So
lub
lefr
actio
n A
B
a)
C
0.0
0.3
0.5
0.8
1.0
0 5 10 15 20 25
Concentration [mmole%]
So
lub
lefr
actio
nD
E
F
b)
Figure 44: Soluble fractions for C12- and C18-additives in SBR4
Technically used processing aids often consist of more than one substance. Therefore, it was
also interesting to investigate the solubility of such a material and to see whether or not it
dissolved in the polymer at processing conditions and to determine the solubility range of the
selected industrial additive. In order to do this, DSC, turbidity measurements and optical
microscopy were employed.
Figure 45 depicts the evolution of the melting process of a technically used processing aid in S-
SBR (system G5). The sample placed on a heated plate, shows temperature dependency
changes in morphology initially around 100°C. It can be seen that parts of the additive begin to
melt and are dissolved in the rubber phase. By increasing the temperature further, the
morphology is transformed steadily to that of a homogeneous system. The process is completed
at 130°C. When the system has cooled down to room temperature, the homogeneous
morphology of the system is unchanged. This indicates that the crystallites of the processing
aids formed by recrystallization during cooling are reduced in size. However, being distributed
more homogeneously, they produce less scattering contrast to be monitored with the optical
microscope. If the temperature is kept constant at 100 °C where heterogeneous phase
morphology still exists for a period of one hour it can be seen that the morphology of the system
changes slightly but still demonstrates the existence of two phases. This indicates that at least
one component of the technical product remains un-dissolved at this temperature (Figure 46).

Chapter 4. Results and discussion 73
70°C
130°C
100°C
70°C
130°C
100°C
Figure 45: Light microscopy pictures of SBR4/industrial processing aid
The turbidity analysis performed on this system offers additional information about the solid-
liquid phase separation. From Figure 47 it can be seen that with an increase in temperature the
relative intensity of the transmitted light (I/I0) increases in a first step ranging from ca. 80 to 102
°C and in a second step, which ends at 120 °C.
0 min 19 min7 min 13 min 60 min0 min 19 min7 min 13 min 60 min
Figure 46: Influence of storing time on morphology of industrial additive in SBR4 at 100°C
Above 130 °C the relative intensity I/I0 remains constant. During cooling the relative light
intensity is decreasing more than in the heating cycle. The higher opacity is attributed to the
formation of a high number of randomly distributed small crystallites. It was proven that the
additional heating and the cooling cycles follow the same turbidity-temperature curve as for the
cooling cycle indicated in Figure 47. This indicates that once the technical processing aid is
completely dissolved into the rubber it becomes well distributed and remains in this state.
0.5
0.6
0.7
0.8
0.9
80 86 92 98 104 120 140
Temperature [°C]
I/Io
Cooling
Heating
0.5
0.6
0.7
0.8
0.9
80 86 92 98 104 120 140
Temperature [°C]
I/Io
Cooling
Heating
Figure 47: I/IO vs. temperature for SBR4/industrial additive from turbidity analysis
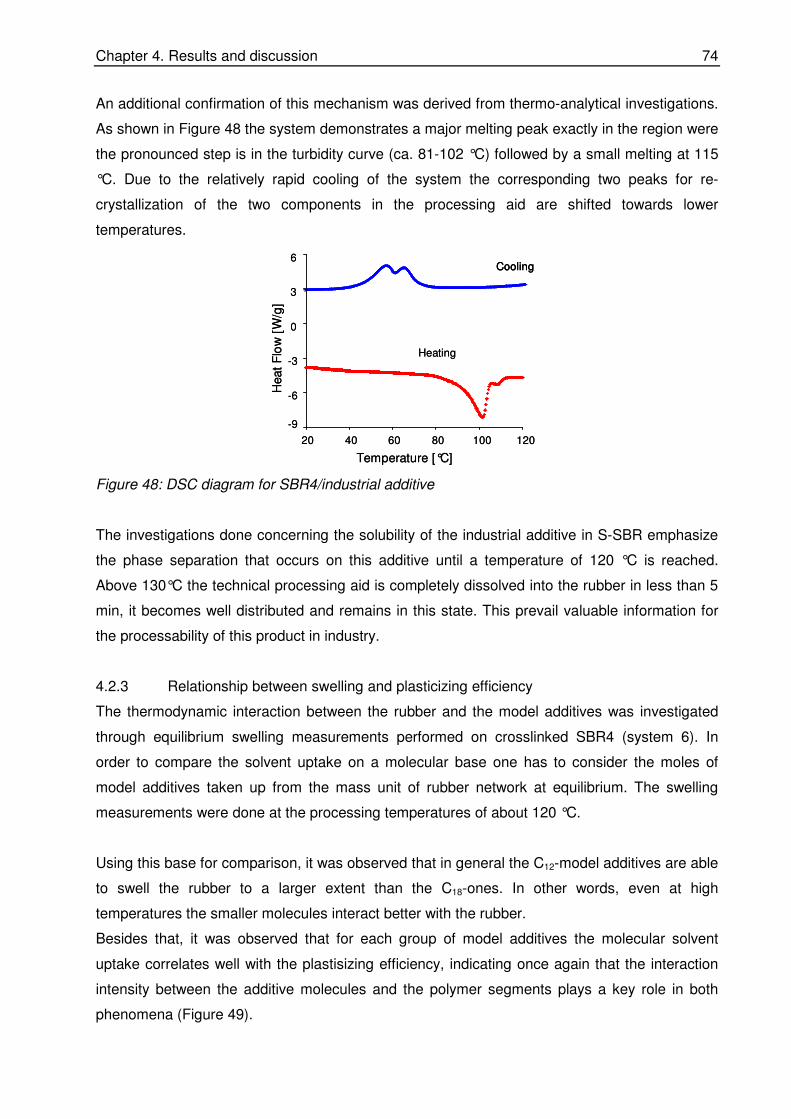
Chapter 4. Results and discussion 74
An additional confirmation of this mechanism was derived from thermo-analytical investigations.
As shown in Figure 48 the system demonstrates a major melting peak exactly in the region were
the pronounced step is in the turbidity curve (ca. 81-102 °C) followed by a small melting at 115
°C. Due to the relatively rapid cooling of the system the corresponding two peaks for re-
crystallization of the two components in the processing aid are shifted towards lower
temperatures.
Cooling
-9
-6
-3
0
3
6
20 40 60 80 100 120
Temperature [°C]
Heat
Flo
w [
W/g
]
Heating
CoolingCooling
-9
-6
-3
0
3
6
20 40 60 80 100 120
Temperature [°C]
Heat
Flo
w [
W/g
]
Heating
Figure 48: DSC diagram for SBR4/industrial additive
The investigations done concerning the solubility of the industrial additive in S-SBR emphasize
the phase separation that occurs on this additive until a temperature of 120 °C is reached.
Above 130°C the technical processing aid is completely dissolved into the rubber in less than 5
min, it becomes well distributed and remains in this state. This prevail valuable information for
the processability of this product in industry.
4.2.3 Relationship between swelling and plasticizing efficiency
The thermodynamic interaction between the rubber and the model additives was investigated
through equilibrium swelling measurements performed on crosslinked SBR4 (system 6). In
order to compare the solvent uptake on a molecular base one has to consider the moles of
model additives taken up from the mass unit of rubber network at equilibrium. The swelling
measurements were done at the processing temperatures of about 120 °C.
Using this base for comparison, it was observed that in general the C12-model additives are able
to swell the rubber to a larger extent than the C18-ones. In other words, even at high
temperatures the smaller molecules interact better with the rubber.
Besides that, it was observed that for each group of model additives the molecular solvent
uptake correlates well with the plastisizing efficiency, indicating once again that the interaction
intensity between the additive molecules and the polymer segments plays a key role in both
phenomena (Figure 49).

Chapter 4. Results and discussion 75
0.00
0.01
0.01
0.02
0.02
0 0.2 0.4 0.6
∆Tg/∆C [°C/mmole%]
mo
l/g
F
C
A
B
E
D
S-S
BR
Ad
Figure 49: Relationship between the swelling degree (at 120 °C) and plasticizing efficiency
The result underlines also the effect of functional groups. That both esters are showing the
largest effect might be related to the ability of the polar ester group to establish dipole-dipole
interactions with the styrene units of S-SBR.
4.2.4 Viscoelastic properties
Valuable information about the viscolelastic properties ranging from constrained flow (terminal
zone) to the transition zone into the dynamical glass state was obtained by applying the
frequency-temperature superposition principle to construct mastercurves. G'(T) and G''(T)
curves were recorded in a plate-plate configuration in the frequency range permitted by the
testing instrument. Figure 50 shows exemplarily the obtained master-curves for SBR4 as a
reference and for system F4. The frequency dependency of the G' and G'' of both systems
deviates from the scaling behaviour demanded theoretically by the tube model derived for melts
of monodisperse polymers (log G'∼2 logω and log G''∼logω) [101].
1E+ 4
1E+ 5
1E+ 6
1E-3 1E-1 1E+ 1 1E+ 3 1E+ 5Frequency [Hz]
G',
G''
[Pa]
SBR4
F4
Figure 50: Dynamical moduli as a function of frequency for SBR4 and F4

Chapter 4. Results and discussion 76
According to the relatively broad molecular weight distribution the observed slopes are 0,72 for
log G' and 0,53 for log G''. The deviations from the theoretical predictions can be traced back to
the disproportional effect of short polymer chains [101] and the softening effect exerted by the
model processing aid. They indicate non-linear viscoelastic behaviour. The major effect of the
processing aid is observed in both the shift of the crossover of the G'(ω) and G''(ω)curves and
the shift of the frequency at which the G''(ω) curve passes through a maximum. For simplicity
the reptation time, τrep, was calculated from the frequency at the maximum of G''. By comparing
the changes in reptation time for all model additives, significant but system specific decrease is
observed (Figure 51). Additionally, the industrial product was also investigated and it was
observed that the reptation time is decreasing and is higher comparing with the model additives
used. This indicates a better chain mobility by its incorporation on SBR4, a better plasticizing
efficiency when used in formulation with SBR4.
0.00
0.05
0.10
0.15
τrep[s
]
SBR4 F4 E4 D4 G4
Figure 51: Influence of the functionality group on the reptation time (τrep) for SBR4, C18-model
processing aids and industrial additive (G4)
Therefore, the processing aid contributes, at ambient temperatures, to a decrease of the
entanglement density and acts as an internal lubricant. At frequencies where G'' passes a
minimum the plateau zone is reached.
0.4
0.5
0.6
GN [
MP
a]
SBR4 F4 E4 D4G4
Figure 52: GN.plotted for SBR4, C18-model processing aids and industrial additive (G4)
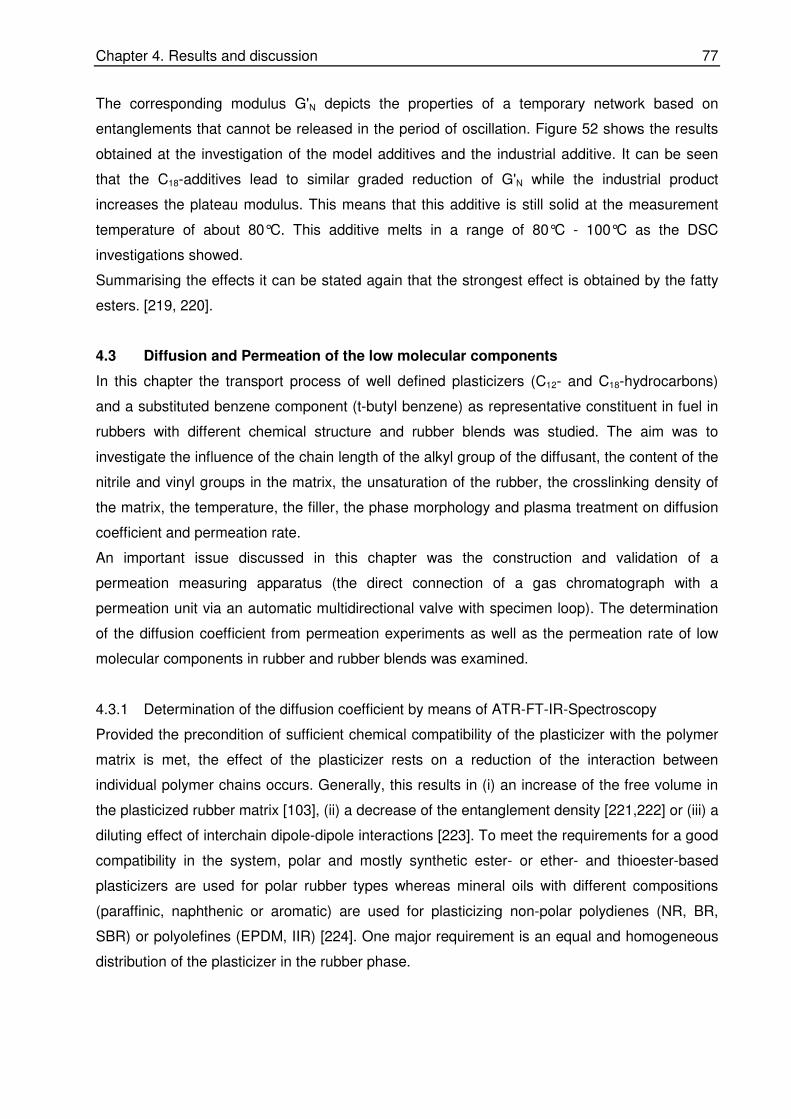
Chapter 4. Results and discussion 77
The corresponding modulus G'N depicts the properties of a temporary network based on
entanglements that cannot be released in the period of oscillation. Figure 52 shows the results
obtained at the investigation of the model additives and the industrial additive. It can be seen
that the C18-additives lead to similar graded reduction of G'N while the industrial product
increases the plateau modulus. This means that this additive is still solid at the measurement
temperature of about 80°C. This additive melts in a range of 80°C - 100°C as the DSC
investigations showed.
Summarising the effects it can be stated again that the strongest effect is obtained by the fatty
esters. [219, 220].
4.3 Diffusion and Permeation of the low molecular components
In this chapter the transport process of well defined plasticizers (C12- and C18-hydrocarbons)
and a substituted benzene component (t-butyl benzene) as representative constituent in fuel in
rubbers with different chemical structure and rubber blends was studied. The aim was to
investigate the influence of the chain length of the alkyl group of the diffusant, the content of the
nitrile and vinyl groups in the matrix, the unsaturation of the rubber, the crosslinking density of
the matrix, the temperature, the filler, the phase morphology and plasma treatment on diffusion
coefficient and permeation rate.
An important issue discussed in this chapter was the construction and validation of a
permeation measuring apparatus (the direct connection of a gas chromatograph with a
permeation unit via an automatic multidirectional valve with specimen loop). The determination
of the diffusion coefficient from permeation experiments as well as the permeation rate of low
molecular components in rubber and rubber blends was examined.
4.3.1 Determination of the diffusion coefficient by means of ATR-FT-IR-Spectroscopy
Provided the precondition of sufficient chemical compatibility of the plasticizer with the polymer
matrix is met, the effect of the plasticizer rests on a reduction of the interaction between
individual polymer chains occurs. Generally, this results in (i) an increase of the free volume in
the plasticized rubber matrix [103], (ii) a decrease of the entanglement density [221,222] or (iii) a
diluting effect of interchain dipole-dipole interactions [223]. To meet the requirements for a good
compatibility in the system, polar and mostly synthetic ester- or ether- and thioester-based
plasticizers are used for polar rubber types whereas mineral oils with different compositions
(paraffinic, naphthenic or aromatic) are used for plasticizing non-polar polydienes (NR, BR,
SBR) or polyolefines (EPDM, IIR) [224]. One major requirement is an equal and homogeneous
distribution of the plasticizer in the rubber phase.

Chapter 4. Results and discussion 78
The objective of this chapter is focused on the structure-property relationships regarding the
diffusion process of a homologous series of phthalates and t-butyl benzene (t-BuPh) in NBR,
SBR and HNBR. The influence of the ACN and vinyl content as well as the saturation and the
crosslink of the rubber matrix on diffusion coefficient are emphasized.
The analytical determination of the diffusion coefficient was pursued for all systems by using the
“time-lag” method based on the ATR-FT-IR spectroscopy technique (see Chap. 3.3.2.1). For the
system DOP/NBR4 and DOP/HNBR1 the “concentration-distance” method that consists of a
special microscopy-FT-IR-spectroscopy coupling was employed in this study.
4.3.1.1 Plasticizers
The work in this chapter was concentrated on the determination of the diffusion constants of
phthalates with increasing chain length in rubbers (Table 11).
The calculation of the diffusion coefficient by means of ATR-FT-IR-spectroscopy requires the
evaluation of the time lag (τ). The time from covering the one face of the elastomer film with the
phthalate until the phthalate penetrates the film is considered as „time-lag” and is recorded on
the other face by means of the characteristic IR-absorption band of the ester group (1726 cm-1).
Table 11. Plasticizers used
Sample Abbreviation Chemical formula Molecular weight
[g/mol]
Di-methyl phthalate DMP C6H4[COOCH3]2 224
Di-ethyl phthalate DEP C6H4[COOCH2CH3]2 250
Di- butyl phthalate DBP C6H4[COO(CH2)3CH3]2 284
Di-octylphthalate* DOP C6H4[COO(CH2)7CH3]2 344
Di-decyl phthalate DDP C6H4[COO(CH2)9CH3]2 464
*Common abbreviation for di-ethylhexyl-phthalate “DEHP”
An example of the time-dependent evolution of this band is shown in Figure 53 for DBP/NBR2.
It can be observed that for a period of more than 100 minutes there is no signal recorded. After
the signal appears the intensity increases linearly in time because of a continuous increase in
DBP concentration in the NBR film at the margin of the Ge-crystal.
It was observed that the diffusion coefficient of the phthalate, it was taken into account that
during the diffusion process the concentration of NBR on the surface of the Ge-crystal is
decreasing while the concentration of the phthalate is increasing.

Chapter 4. Results and discussion 79
0.04
0.03
0.02
0.01
0.00
1900
1800
1700
100
150
200
250
Time [min]
Wavelength [cm
]-1
Abso
rban
ce
Figure 53: Variation of the ester band absorbance as a function of time for DBP in NBR2 by RT
Therefore, the absorbance of the ester group was normalized to the absorbance of the nitrile
group stretching vibration band (2237cm-1). The relative absorbance (Arel =A1726/A2237) plotted vs.
time delivers typical plots from which the “time-lag” is determined from the intersection of initial
Arel with the linearly increasing Arel (Figure 54).
As a matter of fact, the slope (dArel/dt) of the linear time dependence of Arel is also directly
related to the diffusion constant. A higher slope should indicate a higher diffusion coefficient.
τdArel / dt
0 50 100 150 200 250
0
5
10
15
20
25
Are
l
Time [min]
0 50 100 150 200 250
0
5
10
15
20
25
Are
l
Time [min]
Figure 54: Determination of time-lag of DBP in dependency on time in NBR2
Measurements on films with different thickness were carried out. The investigation revealed a
linear proportionality between the time of penetration (τ) and the square of the film thickness (l2)
which is presented in Figure 55.

Chapter 4. Results and discussion 80
y = 2E+ 07x
R2 = 0.9978
0
2000
4000
6000
0.E+ 00 1.E-04 2.E-04 3.E-04
Thickness of the film, l2 [cm2]
Tim
e o
f p
enetr
atio
n,
τ [s
ec]
[s]
Figure 55: Influence of the film thickness on the penetration time of DBP in NBR1
This result represents an experimental proof that the diffusion coefficient does not depend on
the sample geometry. The average diffusion coefficient of DBP in NBR1 derived from the data
given in Figure 55 is 8,3*10-9 cm2/s.
Influence of the alkyl chain length and acrylonitrile (ACN) content in NBR
The experimental results of spectroscopic measurements are shown in Table 12. The data
presented indicate the influence of the alkyl chain length of the phthalates and the ACN content
in NBR rubbers on the time lag and dArel/dt.
The mass transport of the diffusant through a polymer (uncrosslinked or crosslinked) is
connected with the size and the volume requirement of the moving species. If a homologous
series of molecular species is used, the radicals with increasing bulkiness trigger the changes in
the mass transport. However, it has to be taken into account that the precision for the
determination of the “time-lag” decreases if the molecular weight of the diffusants increases.
Table 12. The “time-lag” (τ ) and the slope ( dtdArel ) for the diffusion of phthalates in NBR
rubbers (Film thickness 85 ± 10 µm)
NBR1 NBR2 NBR4 Phthalate τ [min] dtdArel τ [min] dtdArel τ [min] dtdArel
DMP 9 2,00 17 1,200 46 0,6000
DEP 11 1,50 35 0,730 123 0,4000
DBP 32 0,26 117 0,090 248 0,0090 DOP 65 0,11 190 0,003 1787 0,0004 DDP 94 0,02 638 0,001 2160 0,00009
For the phthalates under consideration a quasi-hyperbolic decrease of the diffusion coefficient
with increasing alkyl chain was observed. This is shown exemplarily for NBR1 in Figure 56. The
diffusion coefficient D decreases from 2,2*10-8 cm2/s for DMP to 2,1*10-9 cm2/s for DDP. The

Chapter 4. Results and discussion 81
decrease of D with the bulkiness of the diffusant is in accordance with the theoretical
expectations. However, the effect of alkyl chains is less pronounced when the chain length
increases.
0
0.5
1
1.5
2
2.5
1 2 4 8 10
Number of C
D [
10
-8*cm
2/s
]
Figure 56: Influence of the alkyl chain length of phthalate on D in NBR1
The explanation for this evolution is related to the changes in the configuration of the alkyl
chain. With an increasing number of C-atoms the alkyl chains tend to adopt a coil-like
configuration. Therefore, the radius of gyration of the diffusant molecule increases nearly with
the square root of the number of C-atoms and consequently D is non-linearly decreasing with
the alkyl chain length of the phthalates.
At constant nitrile content of the rubber a characteristic power law (Equ. (52), Chap. 3.3.1.4.2)
describes the relation between the diffusion coefficient and the molecular weight of the
phthalate. From the slope and the intercept of the linear relationship log D vs. log M the two
constants K and α were determined. The results are given for the NBR1, NBR2 and NBR4 in
Table 13.
Table 13. Influence of the ACN content on the exponent α and log K
ACN content
[wt.%] α log K
18 3,4 0,5
28 4,0 1,4
39 5,2 3,7
By fitting the two constants vs. the ACN content by a polynomial function, the dependency of the
diffusion coefficient D can be expressed by a general equation with the acrylonitrile content and
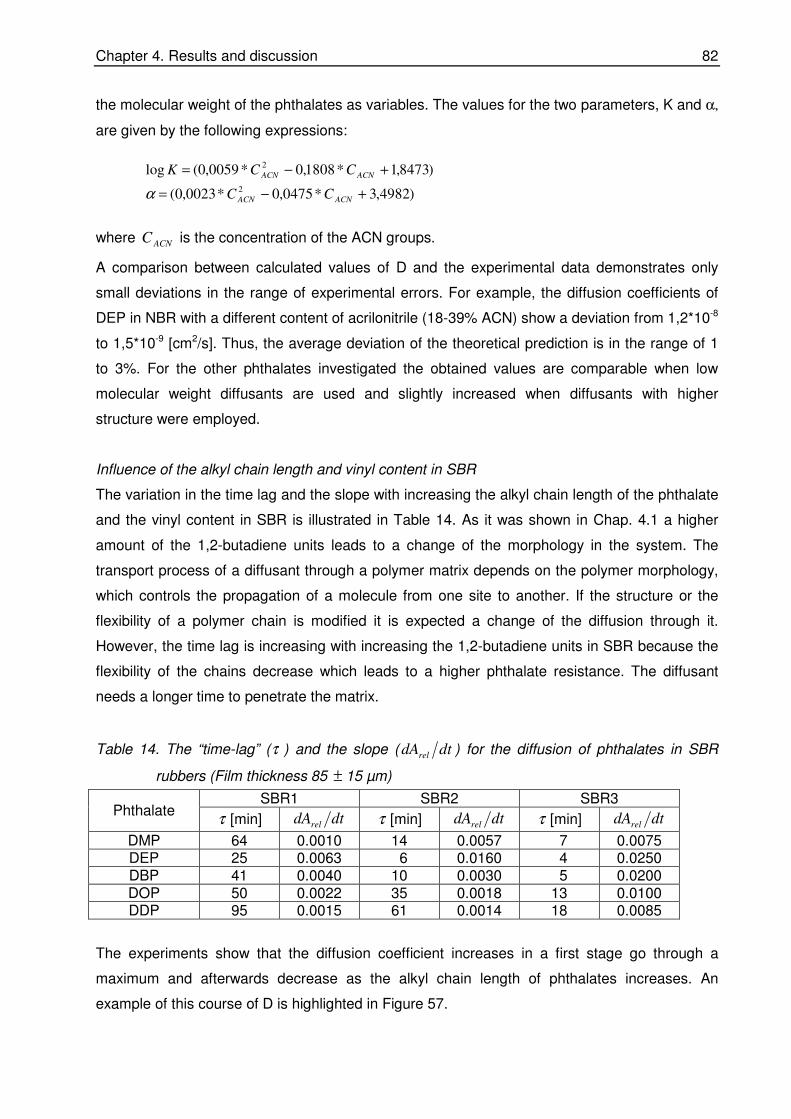
Chapter 4. Results and discussion 82
the molecular weight of the phthalates as variables. The values for the two parameters, K and α,
are given by the following expressions:
)4982,3*0475,0*0023,0(
)8473,1*1808,0*0059,0(log
2
2
+−=
+−=
ACNACN
ACNACN
CC
CCK
α
where ACNC is the concentration of the ACN groups.
A comparison between calculated values of D and the experimental data demonstrates only
small deviations in the range of experimental errors. For example, the diffusion coefficients of
DEP in NBR with a different content of acrilonitrile (18-39% ACN) show a deviation from 1,2*10-8
to 1,5*10-9 [cm2/s]. Thus, the average deviation of the theoretical prediction is in the range of 1
to 3%. For the other phthalates investigated the obtained values are comparable when low
molecular weight diffusants are used and slightly increased when diffusants with higher
structure were employed.
Influence of the alkyl chain length and vinyl content in SBR
The variation in the time lag and the slope with increasing the alkyl chain length of the phthalate
and the vinyl content in SBR is illustrated in Table 14. As it was shown in Chap. 4.1 a higher
amount of the 1,2-butadiene units leads to a change of the morphology in the system. The
transport process of a diffusant through a polymer matrix depends on the polymer morphology,
which controls the propagation of a molecule from one site to another. If the structure or the
flexibility of a polymer chain is modified it is expected a change of the diffusion through it.
However, the time lag is increasing with increasing the 1,2-butadiene units in SBR because the
flexibility of the chains decrease which leads to a higher phthalate resistance. The diffusant
needs a longer time to penetrate the matrix.
Table 14. The “time-lag” (τ ) and the slope ( dtdArel ) for the diffusion of phthalates in SBR
rubbers (Film thickness 85 ± 15 µm)
SBR1 SBR2 SBR3 Phthalate τ [min] dtdArel τ [min] dtdArel τ [min] dtdArel
DMP 64 0.0010 14 0.0057 7 0.0075 DEP 25 0.0063 6 0.0160 4 0.0250 DBP 41 0.0040 10 0.0030 5 0.0200 DOP 50 0.0022 35 0.0018 13 0.0100 DDP 95 0.0015 61 0.0014 18 0.0085
The experiments show that the diffusion coefficient increases in a first stage go through a
maximum and afterwards decrease as the alkyl chain length of phthalates increases. An
example of this course of D is highlighted in Figure 57.

Chapter 4. Results and discussion 83
0
2
4
6
1 2 4 8 10
Number of C
D [
10
-8*cm
2/s
]
Figure 57: Influence of the alkyl chain length of phthalate on D in SBR3
On one hand, the increase of the diffusion coefficient when using DEP may be due to a better
interaction between SBR with phthalate that is supported by the unpolar units introduced into
the system. Further, the diffusion coefficient of DBP in SBR3 decreases, but still has a higher
value compared with DMP and as the chain length of the phthalate increases, the diffusion
coefficient drops significantly.
On the other hand, this behaviour can be explained by considering the viscosity of the diffusant
molecules. The viscosity reflects the effective radius of the molecule. The lower the viscosity the
higher the swelling and this effect can explain the correlation between the diffusion coefficient
and the liquid viscosity (Figure 58).
-8,5
-8
-7,5
-7
-6,5
0,5 1 1,5 2 2,5
Log η [mPa*s]
Log
D [cm
2/s
]
DMP
DEP
DBP
DOPDDPDOP
Figure 58: The variation of D with viscosity (at 20°C) of plasticizers with different alkyl chain
length in SBR3
This behaviour was also observed by Tinker and co-workers [222] who investigated the diffusion
of several plasticizers through which DMP, DEP, DBP, DOP in natural rubber and epoxidised

Chapter 4. Results and discussion 84
rubber. They showed a similar trend of D with increase the alkyl chain length of the phthalates.
The diffusion coefficient increases first and then decreases continuously.
A similar correlation between the D and viscosity was also noticed by Southern and Thomas
[225] in their work by studying the diffusion of a wide range of liquids in natural rubber.
In NBR the nitrile groups exert strong intra- and inter-chain interactions, which lead to a
reduction of the chain mobility and the free volume. This is expressed by an increase in the
glass transition temperature as well as the characteristic chain relaxation time. As a direct
consequence, the diffusion process is affected by the ACN content. From the data listed in
Table 12 it becomes obvious that increasing the nitrile content reduces the diffusion coefficient
of each particular phthalate. It points out that the diffusant mobility is steadily hindered by the
increasing amount of the CN-CN interactions (Figure 59a).
The influence of the nitrile content is reflected quantitatively in a reduction of both values the
exponent α and especially the pre-exponential factor K in Equ. (52), Chap. 3.3.1.4.2. From
Table 13 it can be seen that α and K increase when the ACN content increases. A general
description of the entire diffusion process of phthalates in NBR is available, because the
dependency of both values α and K from the ACN-content of the matrix is now determined.
The influence of the vinyl content in SBR and the alkyl chain length of the phthalate on the
diffusion coefficient are presented in Figure 59b.
20
25
30
35
24
6
8
10
1E-10
1E-9
1E-8
D [
cm
2/s
ec]
ACN [wt.%
]Number of C
210
225
240
255
24
6
8
10
1E-9
1E-8
1E-7
Tg [K]
D [
cm
2 /s]
Number of C
a) b)
Figure 59: Influence of the alkyl chain length of phthalate, the nitrile content of the NBR (a) and
the vinyl content of SBR (b) on the diffusion coefficients
The vinyl content in SBR influences the diffusion coefficient in the same manner as the
acylonitrile content in NBR. An increase of the vinyl content leads to a reduction of the chain

Chapter 4. Results and discussion 85
mobility, which is reflected in higher values of the glass transition. Therefore, the diffusion
constants decrease.
However, these results indicate that the diffusion process of phthalates in NBR and SBR follows
a different mechanism than that of linear aliphatic esters with CH2-units between 13-98 in Poly-
(ethylene) [118].
Influence of the crosslinking density
The results concerning the influence of crosslinking density on diffusion transport processes of
DMP through SBR2 and NBR3 rubber on 85 ± 11 µm film thickness are presented in Figure 60.
It can be noticed that a linear behaviour of D as a function of the crosslinking density was
obtained. An increase of the crosslinking density results in a reduction of the diffusion coefficient
due to lowering the mobility of network chains and of the crosslinks which are restricted regions
for the transport process of the low molecular weight substances.
0
0.5
1
1.5
2
2.5
0 4 8 12 16 20
νe [10-5*mol/cm3]
D [
10
-8*cm
2/s
]
SBR 2-1
SBR 2-3
SBR 2-2
NBR 3-1
NBR 3-2
NBR 3-3
Figure 60: Influence of the crosslinking density on the diffusion coefficient of DMP
Tinker demonstrated in his work the influence of crosslinking density on partition coefficients of
DMP between different rubbers [226]. The higher the crosslinking density formed in the system
the lower the diffusion process respectively the partition coefficients. In another work [227], by
investigating the volume fraction of NBR in the toluene-swollen gel with varying the acrylonitrile
and increasing systematically the network chain concentration (peroxide vulcanization) was
demonstrated that the diffusion process is slower.
Figure 60 presents a general trend of the low molecular component diffusion in favour of the
rubber is close in solubility parameter to that of the plasticizer. DMP has a solubility parameter
δ around 21,9 (J/cm³)1/2, NBR3 has δ around 20 (J/cm³)1/2 and SBR2 has δ around 17,6
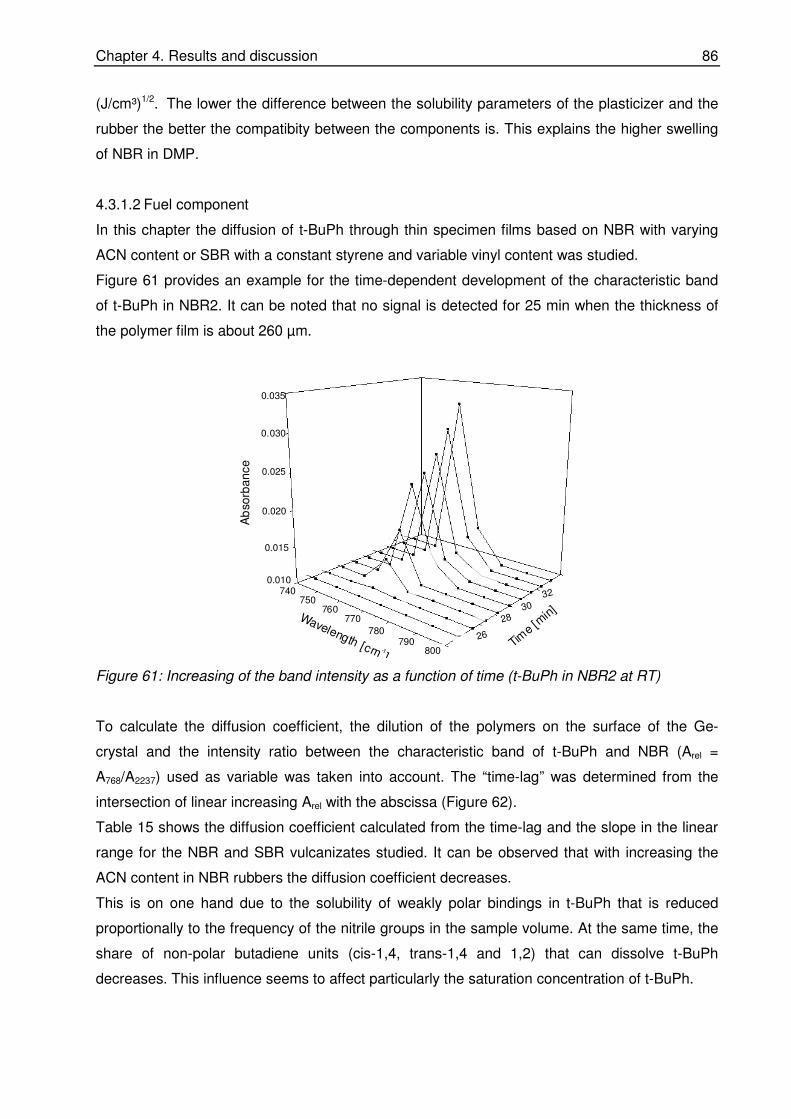
Chapter 4. Results and discussion 86
(J/cm³)1/2. The lower the difference between the solubility parameters of the plasticizer and the
rubber the better the compatibity between the components is. This explains the higher swelling
of NBR in DMP.
4.3.1.2 Fuel component
In this chapter the diffusion of t-BuPh through thin specimen films based on NBR with varying
ACN content or SBR with a constant styrene and variable vinyl content was studied.
Figure 61 provides an example for the time-dependent development of the characteristic band
of t-BuPh in NBR2. It can be noted that no signal is detected for 25 min when the thickness of
the polymer film is about 260 µm.
0.035
0.030
0.025
0.020
0.010740
750760
32
26
2830
Time
[min
]Wavelength [cm
]-1
Ab
sorb
an
ce
0.015
770
780790
800
Figure 61: Increasing of the band intensity as a function of time (t-BuPh in NBR2 at RT)
To calculate the diffusion coefficient, the dilution of the polymers on the surface of the Ge-
crystal and the intensity ratio between the characteristic band of t-BuPh and NBR (Arel =
A768/A2237) used as variable was taken into account. The “time-lag” was determined from the
intersection of linear increasing Arel with the abscissa (Figure 62).
Table 15 shows the diffusion coefficient calculated from the time-lag and the slope in the linear
range for the NBR and SBR vulcanizates studied. It can be observed that with increasing the
ACN content in NBR rubbers the diffusion coefficient decreases.
This is on one hand due to the solubility of weakly polar bindings in t-BuPh that is reduced
proportionally to the frequency of the nitrile groups in the sample volume. At the same time, the
share of non-polar butadiene units (cis-1,4, trans-1,4 and 1,2) that can dissolve t-BuPh
decreases. This influence seems to affect particularly the saturation concentration of t-BuPh.

Chapter 4. Results and discussion 87
20 24 28 32 360
2
4
6
Are
l
Time [min]
Figure 62: Determination of the time-lag for t-BuPh in NBR2 by RT
On the other hand, through strong inter- and intramolecular dipol-dipol interactions, nitrile
groups form a physical crosslinkage superimposed over the chemically crosslinkage. Its density,
in turn, increases proportionally to the ACN concentration.
Table 15. The time-lag (τ) and the slope ( dtdArel ) for the diffusion of t-BuPh in NBR und SBR
vulcanizates (film thickness: 270 ± 40 µm)
The free volume in the whole system is reduced by the thermo-reversible physical crosslinkage
whereby the transport process of a low molecular compound is restricted. The increase in the
glass transition temperature occurs with increasing the ACN content or the characteristic
relaxation time in case of a non-crosslinked melting sample can be traced back by the same
cause (Figure 63).
In the SBR vulcanizates group, the diffusion coefficient of t-BuPh is reduced by the presence of
the vinyl groups. Due to the better solubility of t-BuPh in SBR, the diffusion coefficient of this
compound is higher in SBR than in NBR.
System τ [min] dtdArel
D
[10-8*cm2/s]
NBR1 7 1,060 20,0 ± 2,51
NBR3 27 0,510 6,50 ± 0,55
NBR4 157 0,380 2,10 ± 0,29
SBR3 8 0,048 23,4 ± 3,19
SBR2 12 0,030 18,8 ± 6,78
SBR1 14 0,012 15,2 ± 1,89

Chapter 4. Results and discussion 88
0
10
20
30
200 220 240 260
Tg [K]
D [
10
-8*cm
2/s
]
NBR1
NBR3
NBR4
SBR1
SBR2
SBR3
Figure 63: Influence of the polymer constitution
In both vulcanizate groups, D decreases in different ways with the glass transition temperature,
i.e. with the free volume. The solubility of t-BuPh in SBR decreases slightly with increasing the
vinyl content because of the minor polarizability of these groups. In case of NBR, the decrease
in solubility is much more pronounced and specific.
4.3.2 Determination of the diffusion coefficient with the concentration-distance analysis
In order to gain more information about the diffusion process on a microscopic length-scale, the
systems DOP/NBR4 and DOP/HNBR1 were investigated by means of the “concentration-
distance” analysis. A special arrangement of two layers was prepared. One layer contained the
rubber and the diffusant, the second was prepared in the same way without containing the
diffusant. The two layers are placed in contact with each other taking care to avoid trapping air
bubbles. At different time intervals thin samples (10 µm) were cut and investigated with FT-IR
microscope at various distances (25, 50, 100, 150, 200 µm) from the borderline between the two
layers that is shown in Figure 64.
Layer 2Layer 1
100 mµ
Figure 64: Test specimen used for the “concentration-distance” analysis (layer 2 contains DOP)
Using the procedure described in the experimental part the diffusion coefficients were calculated
according to Equ. (46), Chap. 3.3.1.3. Different concentration profiles versus distance were
obtained. For the reproducibility of the method three measurements of each sample were done.
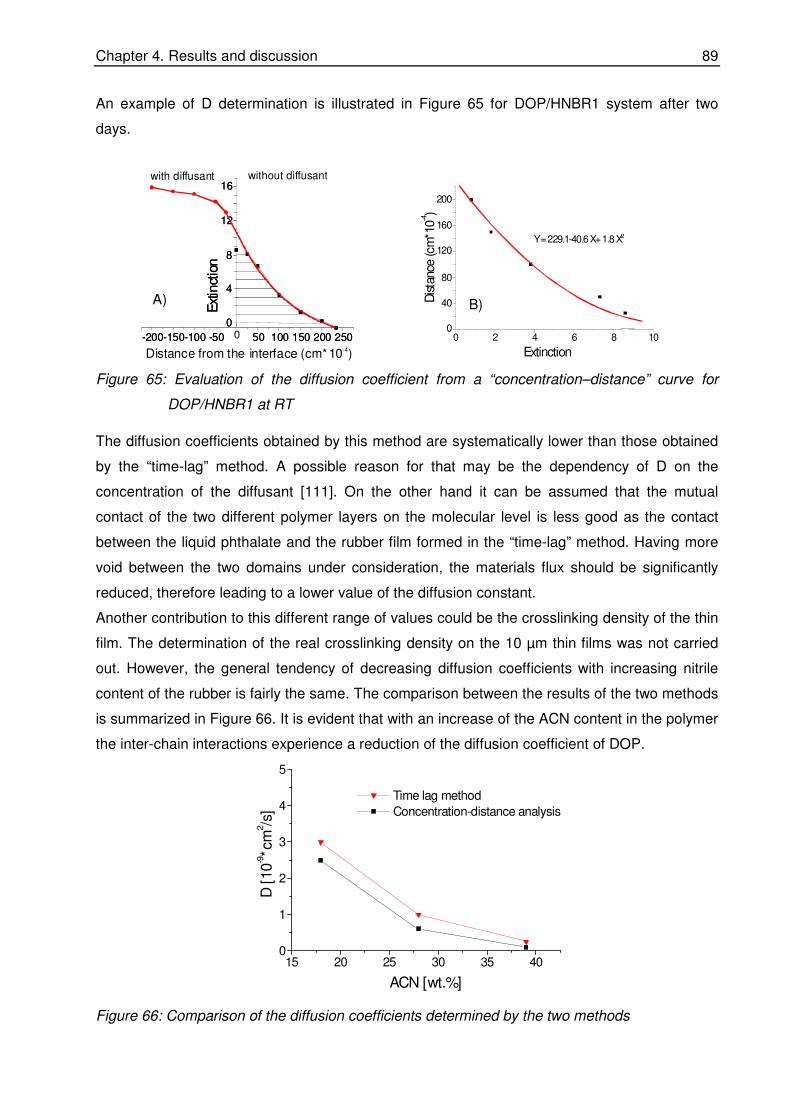
Chapter 4. Results and discussion 89
An example of D determination is illustrated in Figure 65 for DOP/HNBR1 system after two
days.
0 2 4 6 8 100
40
80
120
160
200
Y=229.1-40.6X+1.8X2
Dis
tanc
e(c
m*1
0-4)
Extinction-200-150-100 -50 0 50 100 150 200 250
0
4
8
12
16
Ext
inct
ion
-200-150-100 -50 50 100 150 200 250
0
4
8
12
16with diffusant without diffusant
Ext
inct
ion
Distance from the interface (cm* 10 )-4
A) B)
Figure 65: Evaluation of the diffusion coefficient from a “concentration–distance” curve for
DOP/HNBR1 at RT
The diffusion coefficients obtained by this method are systematically lower than those obtained
by the “time-lag” method. A possible reason for that may be the dependency of D on the
concentration of the diffusant [111]. On the other hand it can be assumed that the mutual
contact of the two different polymer layers on the molecular level is less good as the contact
between the liquid phthalate and the rubber film formed in the “time-lag” method. Having more
void between the two domains under consideration, the materials flux should be significantly
reduced, therefore leading to a lower value of the diffusion constant.
Another contribution to this different range of values could be the crosslinking density of the thin
film. The determination of the real crosslinking density on the 10 µm thin films was not carried
out. However, the general tendency of decreasing diffusion coefficients with increasing nitrile
content of the rubber is fairly the same. The comparison between the results of the two methods
is summarized in Figure 66. It is evident that with an increase of the ACN content in the polymer
the inter-chain interactions experience a reduction of the diffusion coefficient of DOP.
15 20 25 30 35 400
1
2
3
4
5
Time lag method
Concentration-distance analysis
D [
10
-9*c
m2/s
]
ACN [wt.%]
Figure 66: Comparison of the diffusion coefficients determined by the two methods

Chapter 4. Results and discussion 90
In conclusion, it can be summarized that the diffusion profiles acquired allowed a determination
of the diffusion coefficients. These profiles showed that a significant amount of the diffusant
readily migrated across the rubber interface. As expected, the change in diffusant concentration
increases with increasing the storage time and the temperature and decreases with increasing
the distance from the interface.
The analogy with the time-lag method underlined that even between the two methods small
differences occur, the concentration-distance analysis employing the preparation method
proposed could be used for the evaluation of the diffusion coefficient.
Influence of unsaturation and temperature
The temperature dependency of diffusion coefficients of DOP in NBR4 and HNBR1 was
investigated at different temperatures.
If comparing the diffusion coefficient for DOP in the two polar rubbers it becomes obvious that
the mass transport of DOP is systematically more rapid in HNBR1 than in NBR4 (Figure 67).
This striking result seems to be generated by two contributions. On one hand, HNBR1 contains
a smaller amount of ACN groups per volume unit than NBR4. This generates a weaker diffusion
barrier in HNBR1 if compared to NBR4. On the other hand, a different cure efficiency of the
CBS/S system in HNBR1 and NBR4 could also contribute to the higher diffusion rate in HNBR1.
Different degrees of unsaturation of the rubbers under study could affect the diffusion. The
residual bonds by HNBR are less than 9 wt.% while by NBR the double bounds in the main
chain is 56 wt.%.
0
5
10
15
20
25
D [
10
-9*cm
2/s
] HNBR1
NBR4
70 40 24
Temperature [°C]
Figure 67: D of DOP in NBR 4 and HNBR1 at different temperatures
By investigating the influence of the polymer structure on diffusion using a radioactivity counting
method based on tagging with carbon-14, Auerbach showed that the extent of unsaturation in
the polymer backbone which is lowered by hydrogenation leads to a decreases of diffusion. He
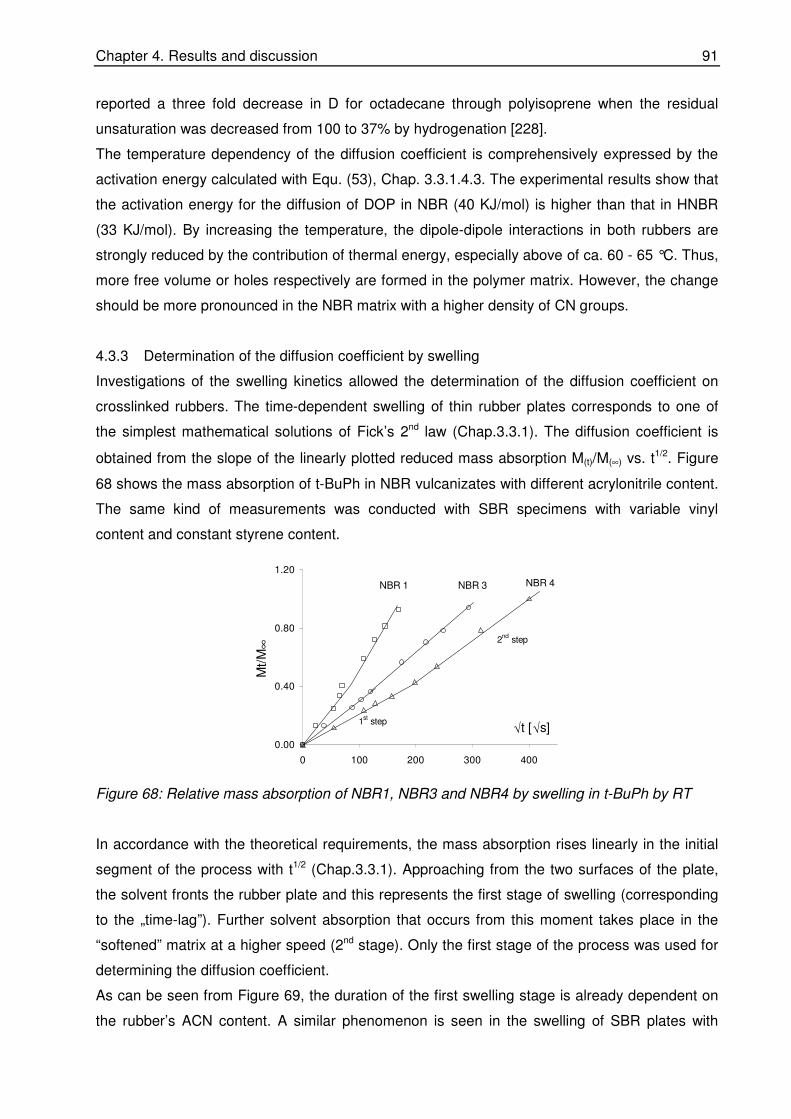
Chapter 4. Results and discussion 91
reported a three fold decrease in D for octadecane through polyisoprene when the residual
unsaturation was decreased from 100 to 37% by hydrogenation [228].
The temperature dependency of the diffusion coefficient is comprehensively expressed by the
activation energy calculated with Equ. (53), Chap. 3.3.1.4.3. The experimental results show that
the activation energy for the diffusion of DOP in NBR (40 KJ/mol) is higher than that in HNBR
(33 KJ/mol). By increasing the temperature, the dipole-dipole interactions in both rubbers are
strongly reduced by the contribution of thermal energy, especially above of ca. 60 - 65 °C. Thus,
more free volume or holes respectively are formed in the polymer matrix. However, the change
should be more pronounced in the NBR matrix with a higher density of CN groups.
4.3.3 Determination of the diffusion coefficient by swelling
Investigations of the swelling kinetics allowed the determination of the diffusion coefficient on
crosslinked rubbers. The time-dependent swelling of thin rubber plates corresponds to one of
the simplest mathematical solutions of Fick’s 2nd law (Chap.3.3.1). The diffusion coefficient is
obtained from the slope of the linearly plotted reduced mass absorption M(t)/M(∞) vs. t1/2. Figure
68 shows the mass absorption of t-BuPh in NBR vulcanizates with different acrylonitrile content.
The same kind of measurements was conducted with SBR specimens with variable vinyl
content and constant styrene content.
0.00
0.40
0.80
1.20
0 100 200 300 400
Mt/
M∞
NBR 1 NBR 3 NBR 4
1st step
2nd
step
√t [√s]
Figure 68: Relative mass absorption of NBR1, NBR3 and NBR4 by swelling in t-BuPh by RT
In accordance with the theoretical requirements, the mass absorption rises linearly in the initial
segment of the process with t1/2 (Chap.3.3.1). Approaching from the two surfaces of the plate,
the solvent fronts the rubber plate and this represents the first stage of swelling (corresponding
to the „time-lag”). Further solvent absorption that occurs from this moment takes place in the
“softened” matrix at a higher speed (2nd stage). Only the first stage of the process was used for
determining the diffusion coefficient.
As can be seen from Figure 69, the duration of the first swelling stage is already dependent on
the rubber’s ACN content. A similar phenomenon is seen in the swelling of SBR plates with

Chapter 4. Results and discussion 92
constant styrene content and a variable share of 1,2-butadiene units. With increasing 1,2-unit
content, the gradient of the mass absorption is decreasing.
Due to the swelling of rubber, the proportion of the specimens changes as a function of time. In
order to obtain reliable results, a correction of the dimensional change was done which consist
of an additional multiplicative factor taking into consideration the geometrical changes during
swelling (Q1/3, Q is the degree of volume swelling) [111]. Figure 69 shows an example of the
relative mass absorption of NBR1.
0.00
0.40
0.80
1.20
0 2000 4000 6000
Mt/
M∞
NBR 1
(√t/l0)*Q1/3
Figure 69: Relative mass absorption of NBR1 in t-BuPh with correction
A linear dependence results from the graphical representation of the reduced mass absorption
versus the product of t1/2 and Q1/3 results which deliver the diffusion coefficients that numerically
correspond to the values obtained from the first stage of the uncorrected curves. The
determination of diffusion coefficient by means of swelling investigation takes in consideration
this correction.
Influence of the polymer constitution
The values of diffusion coefficients of t-BuPh for NBR, HNBR and SBR rubbers are given in
Table 16. It was observed that an increase of the ACN groups in NBR and the 1,2-butadiene
units in SBR provoke a decrease of the diffusion coefficient. The chain mobility of the rubber
matrix is hindered by the increasing concentration of CN-CN interactions, which lead to an
additional physical crosslink in the matrix that determinates the decreasing of the diffusion
constant. A similar behaviour is observed for SBR due to the presence of the vinyl groups in a
higher amount that restrict the penetration of t-BuPh. The solubility of the diffusant can influence
in a large extend the value of the diffusion coefficient. This effect can be seen if comparing the
diffusion constants of t-BuPh in SBR and NBR. T-BuPh is an aromatic hydrocarbon substance
with a high solubility in non-polar rubbers. This can explain the higher values of D when
diffusion of t-BuPh through SBR takes place.

Chapter 4. Results and discussion 93
From Table 16 it was also noticed that the diffusion coefficient increases if the unsaturation in
the main chain is reduced. The HNBR1 shows a higher D in comparison with NBR3, both
rubbers having fast similar ACN content but different unsaturation grades and crosslinking
densities.
Table 16: Diffusion coefficients of t-BuPh in polymers
For both crosslinked polymers a comparison of D values obtained in swelling measurements
with those determined by IR-spectroscopy (Figure 63 and Figure 70) shows that the diffusion
coefficients obtained in swelling investigation are slightly higher than the values obtained by
spectroscopic experiments by means of “time-lag method”.
0
10
20
30
200 220 240 260
Tg [K]
D [
10
-8*cm
2/s
]
NBR1
NBR3
NBR4
SBR1
SBR2
SBR3
HNBR1
Figure 70: Influence of the polymer constitution
These negligible differences can have theirs roots on one hand on the different crosslinking
density of the polymer thin film and membrane and on the other hand on the different
preparative methods used for the calculation of the diffusion coefficient.
System D
[10-8*cm2/s]
NBR1 22,0 ± 1,38
NBR3 7,78 ± 0,48
NBR4 3,08 ± 0,83
HNBR1 11,4 ± 1,23
SBR3 25,0 ± 2,56
SBR2 19,2 ± 6,78
SBR1 16,1 ± 3,89
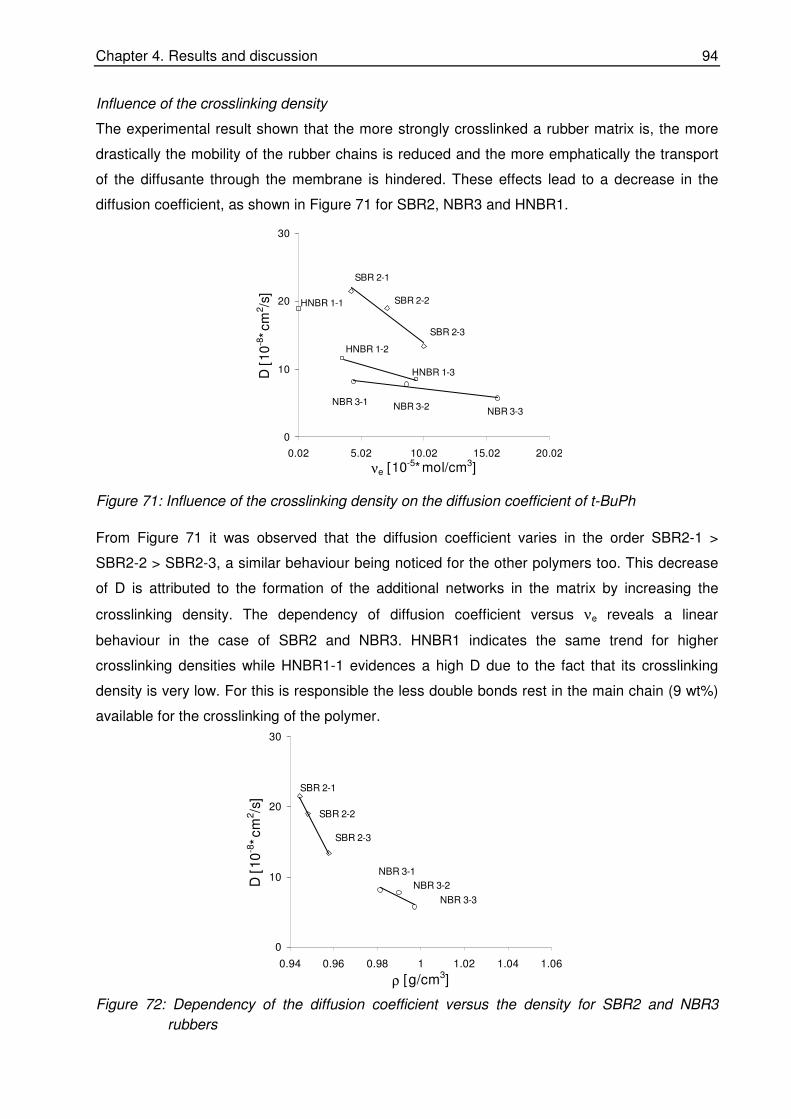
Chapter 4. Results and discussion 94
Influence of the crosslinking density
The experimental result shown that the more strongly crosslinked a rubber matrix is, the more
drastically the mobility of the rubber chains is reduced and the more emphatically the transport
of the diffusante through the membrane is hindered. These effects lead to a decrease in the
diffusion coefficient, as shown in Figure 71 for SBR2, NBR3 and HNBR1.
0
10
20
30
0.02 5.02 10.02 15.02 20.02
νe [10-5*mol/cm3]
D [
10
-8*cm
2/s
]
NBR 3-1NBR 3-2
NBR 3-3
HNBR 1-3
SBR 2-1
SBR 2-3
SBR 2-2
HNBR 1-2
HNBR 1-1
Figure 71: Influence of the crosslinking density on the diffusion coefficient of t-BuPh
From Figure 71 it was observed that the diffusion coefficient varies in the order SBR2-1 >
SBR2-2 > SBR2-3, a similar behaviour being noticed for the other polymers too. This decrease
of D is attributed to the formation of the additional networks in the matrix by increasing the
crosslinking density. The dependency of diffusion coefficient versus νe reveals a linear
behaviour in the case of SBR2 and NBR3. HNBR1 indicates the same trend for higher
crosslinking densities while HNBR1-1 evidences a high D due to the fact that its crosslinking
density is very low. For this is responsible the less double bonds rest in the main chain (9 wt%)
available for the crosslinking of the polymer.
0
10
20
30
0.94 0.96 0.98 1 1.02 1.04 1.06
ρ [g/cm3]
D [
10
-8*cm
2/s
]
NBR 3-1
NBR 3-2
NBR 3-3
SBR 2-1
SBR 2-3
SBR 2-2
Figure 72: Dependency of the diffusion coefficient versus the density for SBR2 and NBR3
rubbers

Chapter 4. Results and discussion 95
The crosslinking density is related to the density. An increase in the crosslink networks causes
an increase in the density of the material. In order to evaluate the influence of the density on
diffusion process, a correlation between D and density was done (Figure 72).
The results demonstrate a linear relationship between diffusion coefficient and density for SBR2
as well as for NBR3. The rubber with the higher density gives a lower diffusion coefficient. This
effect was also observed in a study of diffusion of several gases on different rubbers [229], this
effect depending on the strength of the molecular interaction forces.
In conclusion, it can be remarked that the investigation of the transport phenomena of two
diffusants with different solubility such as t-BuPh and DMP in SBR2 and NBR3 polymers with
the same crosslinking densities (see Figure 60 and Figure 71) demonstrated that the solubility is
an important factor that influence the values of the diffusion coefficient. The better solubility in
the rubber the higher diffusion constants are reached.
Influence of the filler
The transport process in filled polymers depends on the nature of the filler and its compatibility
with the rubber matrix. For the case when the filler strongly interact with the matrix, the filler will
reduce the free volume within the polymer matrix and create a barrier for the transport of the
diffusant [230].
The fillers used in this study were precipitated silica (7000GR) and carbon black (N326) that
were mixed with NBR3 and SBR4 respectively. Carbon black N375 was used for comparison
with N326 using the same rubber formulation. The recipes used are enclosed on Table 17.
Table 17. Test recipe
A B C D E F G H I J K L Materials
phr
SBR4 100.0 100.0 100.0 100.0 0.0 0.0 0.0 0.0 0.0 0.0
0.0 0.0
NBR3 0.0 0.0 0.0 0.0 100.0 100.0 100.0 100.0 100.0 100.0 100.0 0.0
HNBR1 0.0 0.0 0.0 0.0 0.0 0.0 0.0 0.0 0.0 0.0 0.0 100.0
Ultrasil 7000 GR
0.0 10.0 20.0 50.0 0.0 10.0 20.0 50.0 0.0 0.0 0.0 0.0
N 326 0.0 0.0 0.0 0.0 0.0 0.0 0.0 0.0 10.0 20.0 50.0 0.0
Stearic acid 2.0 2.0 2.0 2.0 2.0 2.0 2.0 2.0 2.0 2.0 2.0 2.0
Sulphur 1.5 1.5 1.5 1.5 1.5 1.5 1.5 1.5 1.5 1.5 1.5 0.0
CBS 1.5 1.5 1.5 1.5 1.5 1.5 1.5 1.5 1.5 1.5 1.5 0.0
DCP 0.0 0.0 0.0 0.0 0.0 0.0 0.0 0.0 0.0 0.0 0.0 1.0
DPG 0.0 0.25 0.5 1.25 0.0 0.25 0.5 1.25 0.0 0.0 0.0 0.0
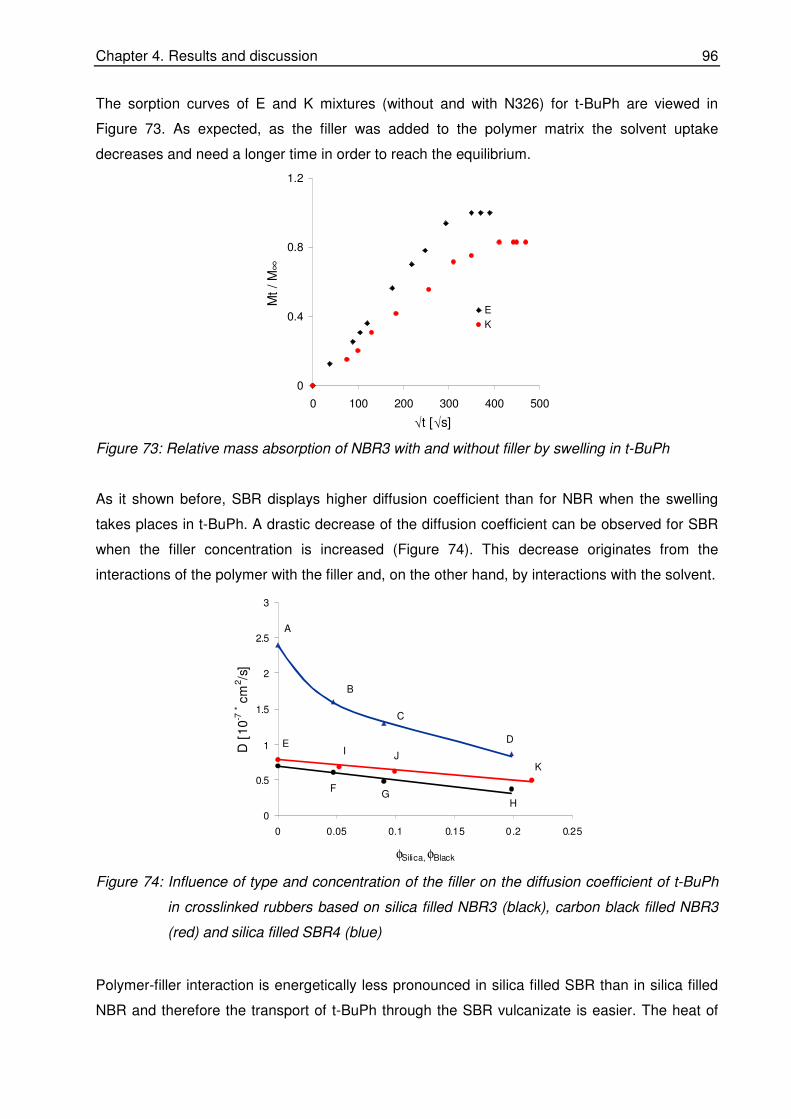
Chapter 4. Results and discussion 96
The sorption curves of E and K mixtures (without and with N326) for t-BuPh are viewed in
Figure 73. As expected, as the filler was added to the polymer matrix the solvent uptake
decreases and need a longer time in order to reach the equilibrium.
0
0.4
0.8
1.2
0 100 200 300 400 500
Mt
/ M
∞
E
K
√t [√s]
Figure 73: Relative mass absorption of NBR3 with and without filler by swelling in t-BuPh
As it shown before, SBR displays higher diffusion coefficient than for NBR when the swelling
takes places in t-BuPh. A drastic decrease of the diffusion coefficient can be observed for SBR
when the filler concentration is increased (Figure 74). This decrease originates from the
interactions of the polymer with the filler and, on the other hand, by interactions with the solvent.
0
0.5
1
1.5
2
2.5
3
0 0.05 0.1 0.15 0.2 0.25
φSilica, φBlack
D[1
0-7
*cm
2/s
]
E
GH
F
I J
A
B
C
D
K
Figure 74: Influence of type and concentration of the filler on the diffusion coefficient of t-BuPh
in crosslinked rubbers based on silica filled NBR3 (black), carbon black filled NBR3
(red) and silica filled SBR4 (blue)
Polymer-filler interaction is energetically less pronounced in silica filled SBR than in silica filled
NBR and therefore the transport of t-BuPh through the SBR vulcanizate is easier. The heat of
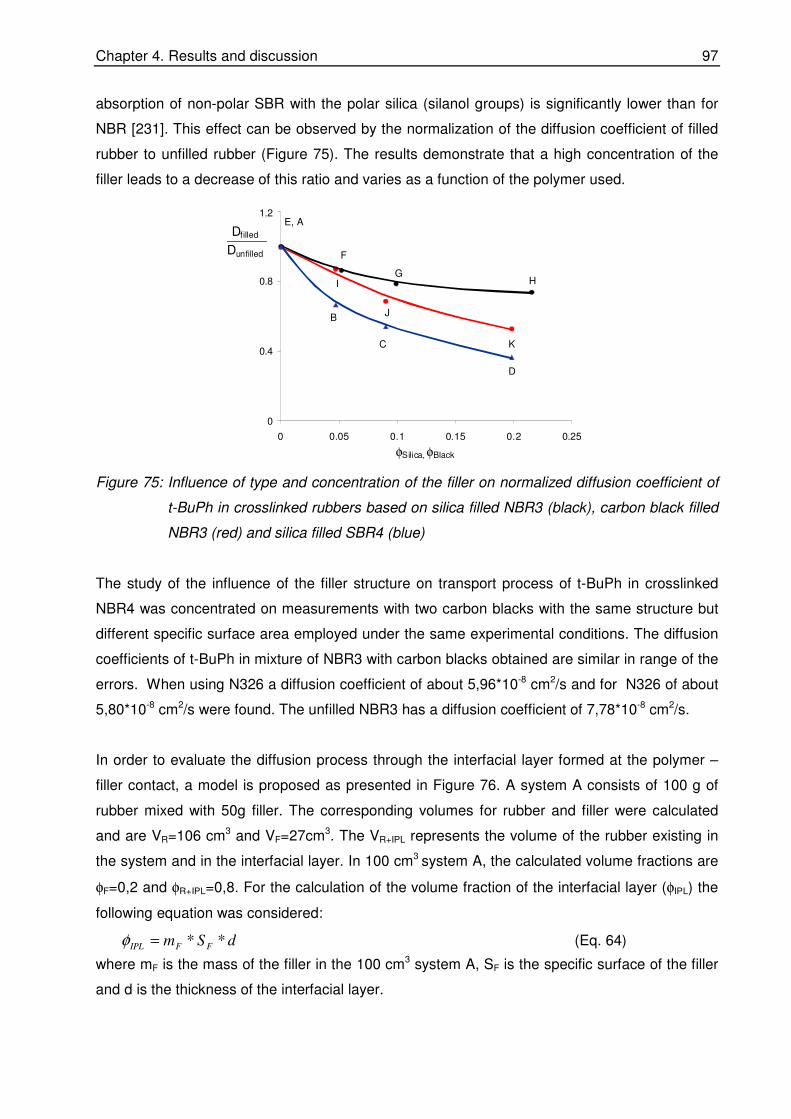
Chapter 4. Results and discussion 97
absorption of non-polar SBR with the polar silica (silanol groups) is significantly lower than for
NBR [231]. This effect can be observed by the normalization of the diffusion coefficient of filled
rubber to unfilled rubber (Figure 75). The results demonstrate that a high concentration of the
filler leads to a decrease of this ratio and varies as a function of the polymer used.
0
0.4
0.8
1.2
0 0.05 0.1 0.15 0.2 0.25
φSilica, φBlack
Dfilled
Dunfilled
GH
F
I
J
E, A
B
C
D
K
Figure 75: Influence of type and concentration of the filler on normalized diffusion coefficient of
t-BuPh in crosslinked rubbers based on silica filled NBR3 (black), carbon black filled
NBR3 (red) and silica filled SBR4 (blue)
The study of the influence of the filler structure on transport process of t-BuPh in crosslinked
NBR4 was concentrated on measurements with two carbon blacks with the same structure but
different specific surface area employed under the same experimental conditions. The diffusion
coefficients of t-BuPh in mixture of NBR3 with carbon blacks obtained are similar in range of the
errors. When using N326 a diffusion coefficient of about 5,96*10-8 cm2/s and for N326 of about
5,80*10-8 cm2/s were found. The unfilled NBR3 has a diffusion coefficient of 7,78*10-8 cm2/s.
In order to evaluate the diffusion process through the interfacial layer formed at the polymer –
filler contact, a model is proposed as presented in Figure 76. A system A consists of 100 g of
rubber mixed with 50g filler. The corresponding volumes for rubber and filler were calculated
and are VR=106 cm3 and VF=27cm3. The VR+IPL represents the volume of the rubber existing in
the system and in the interfacial layer. In 100 cm3 system A, the calculated volume fractions are
φF=0,2 and φR+IPL=0,8. For the calculation of the volume fraction of the interfacial layer (φIPL) the
following equation was considered:
dSm FFIPL **=φ (Eq. 64)
where mF is the mass of the filler in the 100 cm3 system A, SF is the specific surface of the filler
and d is the thickness of the interfacial layer.
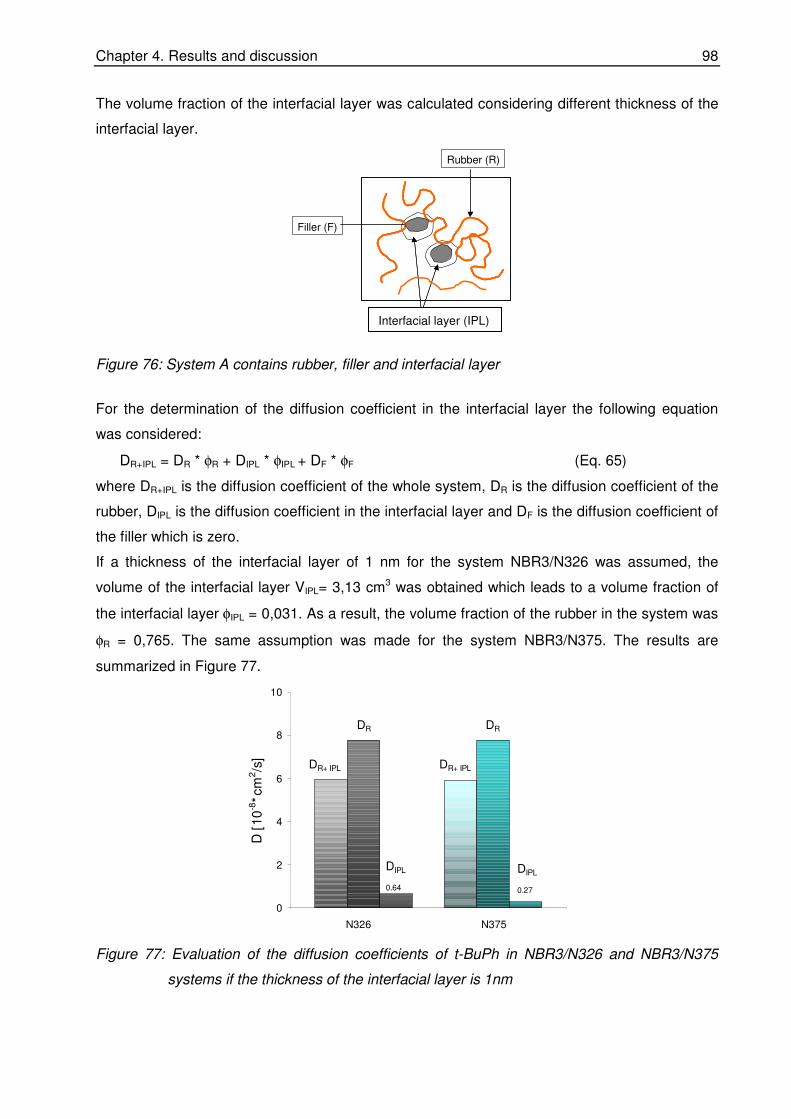
Chapter 4. Results and discussion 98
The volume fraction of the interfacial layer was calculated considering different thickness of the
interfacial layer.
Interphase (IPH)
Rubber (R)
Filler (F)
Interphase layer (IPH)Interphase layer (IPH)Interfacial layer (IPL)
Figure 76: System A contains rubber, filler and interfacial layer
For the determination of the diffusion coefficient in the interfacial layer the following equation
was considered:
DR+IPL = DR * φR + DIPL * φIPL + DF * φF (Eq. 65)
where DR+IPL is the diffusion coefficient of the whole system, DR is the diffusion coefficient of the
rubber, DIPL is the diffusion coefficient in the interfacial layer and DF is the diffusion coefficient of
the filler which is zero.
If a thickness of the interfacial layer of 1 nm for the system NBR3/N326 was assumed, the
volume of the interfacial layer VIPL= 3,13 cm3 was obtained which leads to a volume fraction of
the interfacial layer φIPL = 0,031. As a result, the volume fraction of the rubber in the system was
φR = 0,765. The same assumption was made for the system NBR3/N375. The results are
summarized in Figure 77.
0
2
4
6
8
10
D [
10
-8*cm
2/s
]
N326 N375
DR+ IPL
DR
DIPL
0.64
DR+ IPL
DR
DIPL
0.27
Figure 77: Evaluation of the diffusion coefficients of t-BuPh in NBR3/N326 and NBR3/N375
systems if the thickness of the interfacial layer is 1nm

Chapter 4. Results and discussion 99
It was observed for both systems that the diffusion coefficients in the interfacial layer were
significantly smaller compared to the diffusion coefficients in the whole system and of the rubber
respectively. This result sustained that the diffusion process in the interfacial layer influences to
a certain extent the diffusion process of a fluid through a filled rubber. For t-BuPh in NBR/N326
system a DIPL of 0,64 cm2/s and in NBR/N375 system a DIPL of 0,27 cm2/s were obtained.
A correlation of the diffusion coefficient with the density was shown in Figure 72. From this
diagram the densities corresponding to the diffusion coefficients in the interfacial layer can be
evaluated. Relatively similar values were obtained, for NBR/N326 system a density of about
1,036 g/cm3 and for NBR/N375 system a density of about 1,041 g/cm3. These findings suggest
that the thin interfacial layer behave as a glassy one. A comparison of its density with several
plastic materials supports this assumption (Table 18).
Table 18: Density and diffusion coefficients of N2 in plastic materials
Plastic material Density [g/cm3]
Diffusion of N2 [10-8*cm2/s]
PS (Poly styrene) 1,050 9,60
PET (Poly ethylene terephthalate) 1,370 0,14
PVC (Poly vinyl chloride) 1,520 0,38
When the thickness of the interfacial layer was varied it was noticed that the diffusion coefficient
in the interfacial layer increases due to a higher amount of rubber located in the interfacial layer
and as a consequence the total amount of rubber in the system decreases (Figure 78).
0
0.2
0.4
0.6
0.8
Thickness of interphase [nm]
0.1
4.1
8.1
φR
φIPL
φR,
φIP
L
D IP
L [10
-9*cm
2/s]
1 2
6
3
Figure 78: Variation of DIPH of t-BuPh in NBR/N326 in dependency of the thickness of the
interfacial layer
Influence of the phase morphology
The transport processes through rubber polymer blends depend upon the compatibility,
composition and phase morphology of the blend phases. However, most polymer blends

Chapter 4. Results and discussion 100
constitute from components with different polarity forming two-phase heterogeneous systems.
Consequently, the effect of diffusion is very dependent on the degree of compatibility of the
system. This leads to the question how the phase morphology influences the transport process
of the low molecular compounds?
In Figure 79 shows schematically the swelling process through a NBR/SBR blend. It can be
seen that at a blend ratio NBR/SBR (20/80) the NBR phase is dispersed in the continuous SBR
matrix and at a blend ratio NBR/SBR (80/20) SBR is dispersed in the continuous NBR matrix. At
the same blend ratio both NBR and SBR form continuous phase which lead to a co-continuous
morphology. By increasing the concentration of SBR from 20 to 80 wt.%, the domains size of
SBR increases and it forms the continuous phase. The diffusion process takes place through
SBR phase that leads to a high swelling in NBR/SBR (50/50) blend and NBR/SBR (20/80) blend
respectively.
NBR / SBR 0 / 100
NBR / SBR 20 / 80
NBR / SBR 50 / 50
NBR / SBR 80 / 20
NBR / SBR 100 / 0
After swelling
Solvent
Continuous SBR matrix
After swelling
After swelling
After swelling
After swelling
Solvent
Continuos SBR matrix
Dispersed NBR phase
Continuous NBR matrix
Continuous SBR phase
Continuous NBR matrix
Dispersed SBR phase
Continuous NBR matrix
Figure 79: Representation of swelling process in NBR/SBR (different blend ratio)
The influence on the transport process of t-BuPh was analyzed using various blend ratio of
SBR/NBR system. Methyl-ethyl-ketone (MEK) was chosen for studying the influence of the

Chapter 4. Results and discussion 101
diffusant polarity on diffusion transport in blends. The results are summarized in Figures 80 –
82.
5
10
15
20
25
0.00 0.20 0.40 0.60 0.80 1.00
φSBR
D[1
0-8
*cm
2 /s]
Figure 80: Diffusions coefficients of t-BuPh as a function of volume fraction of SBR for different
blend ration of SBR4/NBR3 at RT
The variation of the diffusion coefficient of t-BuPh as a function of the blend composition
corresponds to a step function. In the region in which NBR3 forms the continuous phase and
SBR4 represents the dispersed phase, the diffusion coefficient only increases slightly. In the
phase reversal region the values increase to a level typical for SBR4. In the segment in which
only SBR4 forms the continuous phase the diffusion coefficient approaches the typical critical
value for pure SBR with a small slope of the curve. TEM pictures, as shown in Figure 81, enable
an assignment of values to the corresponding phase morphologies.
20/80 (NBR3/SBR4) 45/55(NBR3/SBR4) 55/45 (NBR3/SBR4) 80/20 (NBR3/SBR4)
1000nm 1000nm 1000nm 1000nm
20/80 (NBR3/SBR4) 45/55(NBR3/SBR4) 55/45 (NBR3/SBR4) 80/20 (NBR3/SBR4)
1000nm1000nm 1000nm1000nm 1000nm1000nm 1000nm1000nm
Figure 81: TEM pictures of NBR3/SBR4 blends
The influence of phase morphology on diffusion process was shown in different works
[232,233]. The study of the transport process of alkyl benzene in NR/NBR blends demonstrated
that increasing the NBR content in blend the diffusion coefficient decreases due to the inherent
solvent resistance behaviour of NBR [234].
The behaviour for the diffusion coefficient of MEK in the same blend provides a further
indication for the influence of phase morphology (Figure 82).
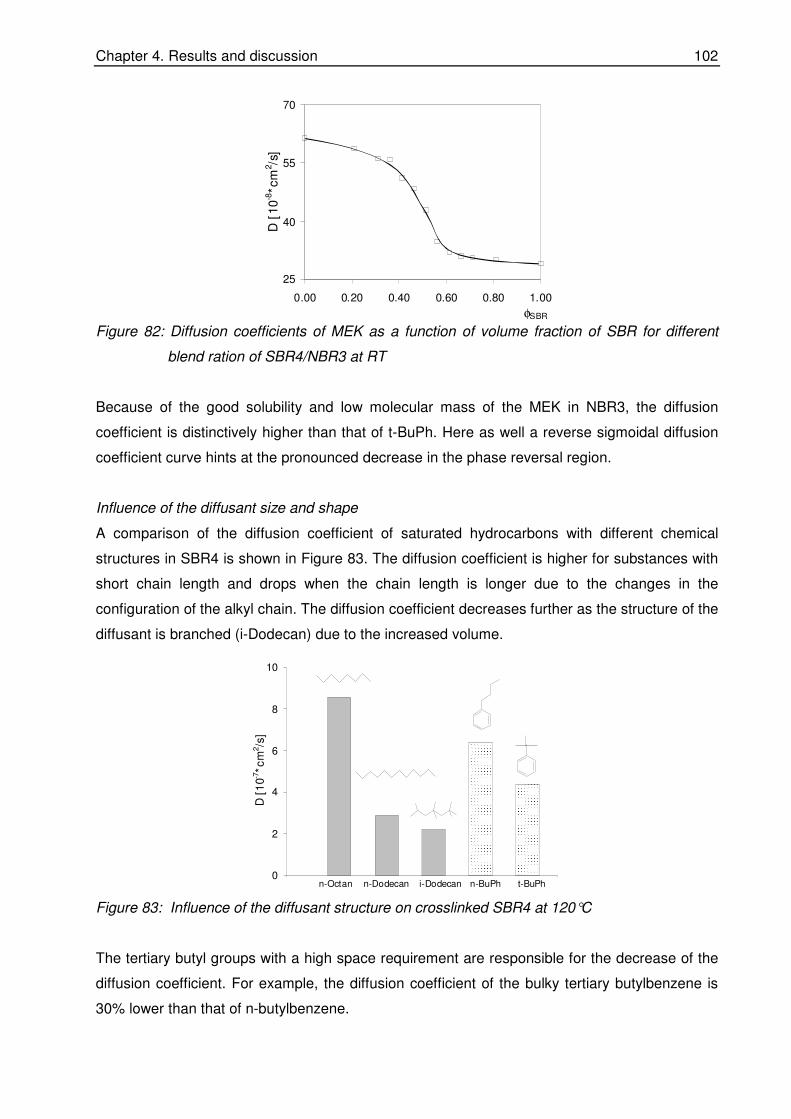
Chapter 4. Results and discussion 102
25
40
55
70
0.00 0.20 0.40 0.60 0.80 1.00
φSBR
D[1
0-8
*cm
2/s
]
Figure 82: Diffusion coefficients of MEK as a function of volume fraction of SBR for different
blend ration of SBR4/NBR3 at RT
Because of the good solubility and low molecular mass of the MEK in NBR3, the diffusion
coefficient is distinctively higher than that of t-BuPh. Here as well a reverse sigmoidal diffusion
coefficient curve hints at the pronounced decrease in the phase reversal region.
Influence of the diffusant size and shape
A comparison of the diffusion coefficient of saturated hydrocarbons with different chemical
structures in SBR4 is shown in Figure 83. The diffusion coefficient is higher for substances with
short chain length and drops when the chain length is longer due to the changes in the
configuration of the alkyl chain. The diffusion coefficient decreases further as the structure of the
diffusant is branched (i-Dodecan) due to the increased volume.
0
2
4
6
8
10
D[1
0-7*cm
2/s
]
n-BuPh t-BuPhn-Dodecan i-Dodecann-Octan
Figure 83: Influence of the diffusant structure on crosslinked SBR4 at 120°C
The tertiary butyl groups with a high space requirement are responsible for the decrease of the
diffusion coefficient. For example, the diffusion coefficient of the bulky tertiary butylbenzene is
30% lower than that of n-butylbenzene.

Chapter 4. Results and discussion 103
A decrease in the diffusion coefficient with increase of the size and shape of the penetrant was
observed by many investigators [235 - 237]. For instance, the flattened or elongated molecules
have a higher diffusion coefficient than spherical molecules of equal molecular volume [238].
This is the case when n-BuPh is compared with t-BuPh. The n-BuPh has an elongated form
while the t-BuPh is more spherical.
4.3.4 Determination of the diffusion coefficient with the two-chamber method
A focal point was the setup and validation of an automatic permeation apparatus (two-chamber
method) for determining the permeation rate as well as the diffusion coefficient employing the
„time-lag” method.
A schematical representation of this equipment is given in Figure 84. The two chambers (1) and
(2) have the same volume (80 ml) and are separated by a metal lattice where the polymer
membrane is placed. The carrier gas (nitrogen) is introduced with constant flow into the lower
chamber through three positions so that after introducing the test fluid, which permeates through
the membrane (starts the isobar measurements), the mass flow reaches the six-way valve
across a transfer connection (d=1/16").
5
1
2
5
3
4
7
6
8 9
5
1
2
5
3
4
7
6
8 9
1. Upper chamber
2. Lower chamber
3. Rubber membrane
4. Metal lattice
5. Carrier gas (nitrogen)
6. Six-way valve („online“ sampling
connection)
7. Carrier gas (helium)
8. Gas chromatograph
9. Evaluation (computer)
Figure 84: Presentation of the apparatus developed for the permeation analysis
The volume of the sample loop is 0.01µl. Further, using an automatic program for given
intervals of time the mass flow is injected into the gas chromatograph. The principle of the six-
way valve is presented in Figure 85.
During the whole experiment the transfer connection was heated at 60°C and maintained at this
temperature in order to reduce the losses that can occur in this part of the apparatus. The gas
sample was introduced through a hot injector (250°C) in the tempered (80°C) capillary column
(30mHP5) of a gas chromatograph (HRGC 5300 Mega Series) in order to facilitate the analysing
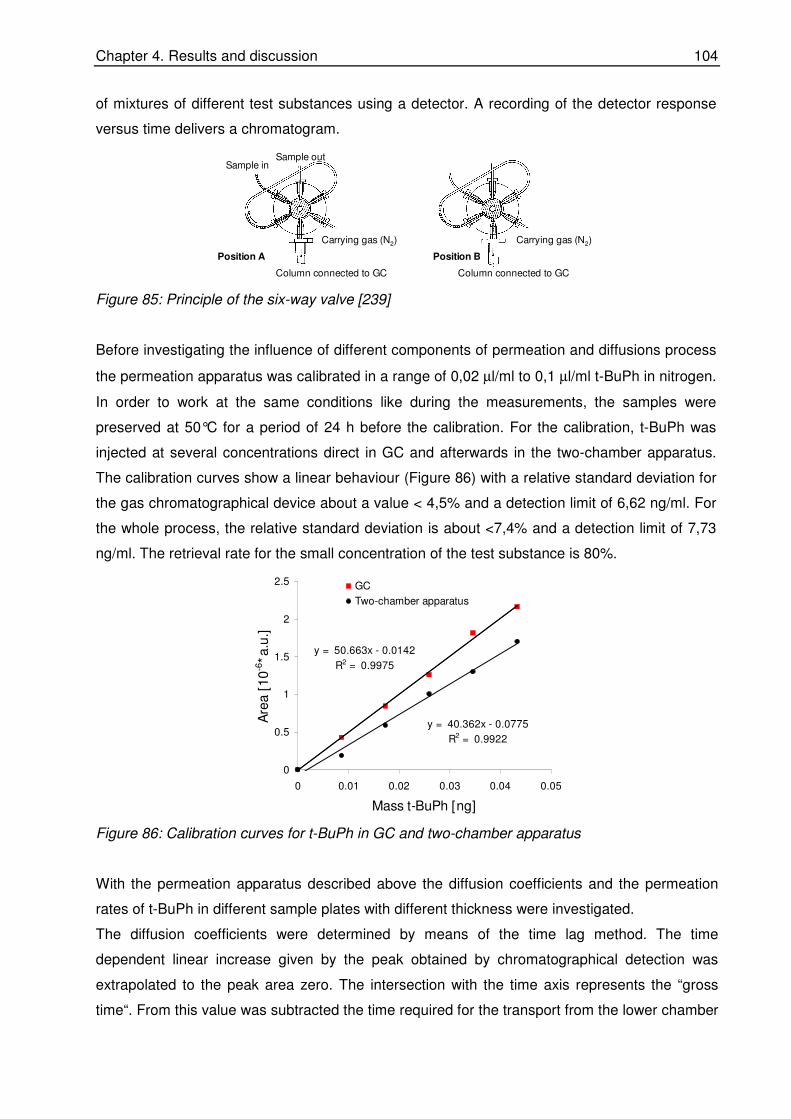
Chapter 4. Results and discussion 104
of mixtures of different test substances using a detector. A recording of the detector response
versus time delivers a chromatogram.
Column connected to GC
Sample in Sample out
Carrying gas (N2)
Position A Position B
Carrying gas (N2)
Column connected to GC
Figure 85: Principle of the six-way valve [239]
Before investigating the influence of different components of permeation and diffusions process
the permeation apparatus was calibrated in a range of 0,02 µl/ml to 0,1 µl/ml t-BuPh in nitrogen.
In order to work at the same conditions like during the measurements, the samples were
preserved at 50°C for a period of 24 h before the calibration. For the calibration, t-BuPh was
injected at several concentrations direct in GC and afterwards in the two-chamber apparatus.
The calibration curves show a linear behaviour (Figure 86) with a relative standard deviation for
the gas chromatographical device about a value < 4,5% and a detection limit of 6,62 ng/ml. For
the whole process, the relative standard deviation is about <7,4% and a detection limit of 7,73
ng/ml. The retrieval rate for the small concentration of the test substance is 80%.
y = 40.362x - 0.0775
R2 = 0.9922
y = 50.663x - 0.0142
R2 = 0.9975
0
0.5
1
1.5
2
2.5
0 0.01 0.02 0.03 0.04 0.05
Mass t-BuPh [ng]
Are
a [
10
-6*a.u
.]
GC
Two-chamber apparatus
Figure 86: Calibration curves for t-BuPh in GC and two-chamber apparatus
With the permeation apparatus described above the diffusion coefficients and the permeation
rates of t-BuPh in different sample plates with different thickness were investigated.
The diffusion coefficients were determined by means of the time lag method. The time
dependent linear increase given by the peak obtained by chromatographical detection was
extrapolated to the peak area zero. The intersection with the time axis represents the “gross
time“. From this value was subtracted the time required for the transport from the lower chamber

Chapter 4. Results and discussion 105
to the detector and this was called the “net time lag“ which was used for the calculation of the
diffusion coefficient using Equ. (41), Chap. 3.3.1.1. The permeation rates were obtained using
the Equ. (34) described in Chap. 3.3.1.
Influence of the polymer constitution
A direct comparison of the penetrating amount of the t-BuPh in time through the plate (2mm)
was conducted on NBR vulcanizates with an increasing ACN content (NBR1, NBR3 and NBR4)
(Figure 87). Significant differences are evident. These can be related to the constitution of the
rubber. The time-lags raise with increasing the ACN content, while the saturation concentration
which corresponds to the stationary permeation state decreases.
0.E+ 00
1.E+ 05
2.E+ 05
3.E+ 05
0 2500 5000 7500 10000 12500
Time [min]
Co
ncentr
atio
n [
rel. u
nit]
NBR1
NBR3
NBR4
Figure 87: Penetrating amount of t-BuPh in NBR1, NBR3, NBR4
Taking into consideration the pronounced differences noticed in the curve characteristics, any
influence from the slight variation in crosslinking density could be ignored. What is mainly
reflected here is the influence of the polar nitrile groups. The influence of the ACN units already
discussed with high consistency confirms the influence of these groups on the transport process
of t-BuPh through NBR rubber. For the transport processes treated here, this influence was
expressed by means of an increase in the time-lags and the concentration gradients (dC/dT). It
could be observed in all three cases that the time required for attainment of the stationary state
increases with the nitrile content (22 h for NBR1; 86 h for NBR3 and 183 h for NBR4).
Table 19: The net time-lag (τ ), concentration gradient, D and P of t-BuPh in NBR crosslinked
systems determined from permeation experiments (plate thickness 2mm ± 0.45)
Systeme τ [min] dC/dt D
[10-8*cm2/s]
P
[10-7*g/cm2*s]
NBR1 506 0.0090 19.5 1.170
NBR3 3608 0.0015 5.5 0.217
NBR4 8238 0.0001 1.7 0.014

Chapter 4. Results and discussion 106
The permeation rate for the stationary state was determined having the unit [g/cm2s]. Table 19
summarizes the values obtained for net time-lags, diffusion coefficient, concentration gradient
and permeation rate.
The results demonstrated that the diffusion coefficient and the permeation rate do not decrease
in linear proportion to the ACN content. With a high degree of accuracy, a dependency of the
permeability rate on the ACN content is determined (Figure 88).
0.01
0.51
1.01
1.51
16 21 26 31 36 41
ACN [wt.%]
P [
10
-7*g
/cm
2*sec]
NBR1
NBR3
NBR4
P [10
-7*g
/cm
2*s
]
Figure 88: Influence of the ACN content from NBR on the permeation rate of t-BuPh at RT
This form of dependency exhibits a certain similarity to the decrease in the swelling degree of
the ACN content of NBR crosslinked systems (Figure 89).
50
150
250
350
16 21 26 31 36 41
ACN [wt.%]
Q [
wt.
%]
NBR1
NBR3
NBR4
Figure 89: Reception of t-BuPh through NBR crosslinked systems with increasing ACN
Since the swelling degree of a crosslinked system qualitatively expresses the magnitude of the
polymer solvent interaction, it can be assumed that the sorption of the hydrocarbon has a crucial
influence on the decrease of the permeation rate. Furthermore, this is confirmed by the linear
relationship between P and D (Figure 90), referencing the fact that the permeation process
consists of the three stages: a) sorption, b) diffusion and c) desorption.

Chapter 4. Results and discussion 107
0
0.4
0.8
1.2
1.6
0 5 10 15 20 25
D [10-8* cm2/s]
P [
10
-7*g
/cm
2*s]
Figure 90: Permeation rate of t-BuPh in NBR depending on the diffusion coefficient
The sensitivity and reproducibility of the methods employed for the study of the diffusion
coefficient represent an important issue that must be taken into consideration. A comparison
between the values obtained for the diffusion of t-BuPh in NBR with different acrylonitrile
content was done and outlined in Figure 91.
0
1
2
3
10 20 30 40
ACN [wt.%]
D [
10
-7*cm
2/s
]
Swelling
IR-spectroscopy
PermeationNBR1
NBR3
NBR4
Figure 91: Determination of the diffusion coefficient of t-BuPh in NBR by means of swelling
investigation, IR-spectroscopy and permeation measurements
The diffusion coefficients using these three methods are roughly the same, the values acquired
by swelling measurements are slightly higher than those obtained by the IR-spectroscopy
method respectively by permeation. For that behaviour, several reasons can be mentioned:
different quality of sample preparations or varying crosslinking densities of the specimens. The
relative precision of the methods used is for IR-spectroscopic measurements about 1.6%, for
swelling investigations about 2.7% and for the permeation investigations about 7.7%.
Nevertheless, the general trend is similar for all three cases and shows that an increase of the
ACN content in NBR leads to a reduction of the diffusion coefficient of t-BuPh.

Chapter 4. Results and discussion 108
Influence of the crosslinking density
Because of the chemical crosslinking the glass transition temperature of elastomers is shifted to
higher values. The concomitant decrease in free volume and chain mobility is reflected in the
permeation measurements taken on NBR vulcanizates with increasing crosslinking density
(Table 20). In accordance with the explanatory remarks from above, an increase in crosslinking
density leads to a decrease in the diffusion coefficient values and permeation rates.
Table 20: Influence of the crosslinking density on the net time-lag (τ ) and the diffusion
coefficients of t-BuPh in NBR (plate thickness 2mm ± 0.15)
From this example it is evident that crosslinking density has less impact than the ACN content.
An increase of crosslinking density with factor 3 leads to a decrease of the permeation rate to a
factor of 20.
Influence of the filler
The incorporation of a volume share of solid particles into the elastomer matrix influences the
permeation process being studied for that. The mass transport of permeate cannot take place in
a specimen volume proportional to the filler share. Moreover, it can be expected that the filler
dispersion and the formation of a polymer layer firmly adsorbed on the filler surface that is a
typical phenomenon for active fillers may affect this process.
1.E-07
1.E-06
1.E-05
0 0.05 0.1 0.15 0.2 0.25
φSilica, φCarbon black
P[g
/cm
2 *s]
E
G
H
F
K
JI
Figure 92: The influence of the filler type and concentration on the permeation rate of NBR3
(silica filled crosslinked F =10phr, G = 20phr and H = 50 phr; black filled vulcanizate
I=10phr, J=20phr und K=50phr; plate thickness 1mm)
System XLD
[10-5 mol cm-3 ] τ [min] dC/dt
D
[10-8*cm2/s]
P
[10-7 g*cm2/s]
NBR 3-1 4.5 2604 0.0120 6.9 1.420
NBR 3-2 8.6 3608 0.0015 5.5 0.217
NBR 3-3 15.9 5031 0.0006 3.4 0.068

Chapter 4. Results and discussion 109
For a better understanding of these influences, comparative permeation and swelling tests were
carried out on NBR3 or SBR4 vulcanizates filled with silica 7000 GR respectively carbon black
N326, employing different filler concentrations of 10phr, 20phr and 50phr. The results are
presented in Figure 92.
As can be seen from the half logarithmic representation, the permeation rate decreases
significantly as the filler volume fraction rises. The fact that the permeation rates of t-BuPh in
NBR2 vulcanizates containing silica are lower than those in NBR2 vulcanizates containing
carbon black is due to a better polymer/filler interaction, which causes a pronounced sorption of
the NBR chains on the surface of the silica. This interaction was proven by IR-spectroscopy by
the occurrence of a new band as well as a higher bound rubber share and also a large increase
of the loss modulus in the glass transition range.
Influence of the plasma treatment
The influence of thin layers on the specimen surface during the permeation process was
investigated in order to verify the sensitivity of the permeation method.
A thin film was applied to a 1 mm NBR3 plate by means of plasma coating with
decafluoropentane as precursor. In other coating trials, the composition of the film was analyzed
by means of XPS spectroscopy and a layer thickness of 20-50 nm was determined [240].
Assuming a similar magnitude here as well, Figure 93 illustrates the effectiveness of a layer of
this nature as barrier for permeation. In literature, it was shown that the film produced by means
of this technique can exhibit a high consistency and crosslinking density is increased [241].
0.E+ 00
2.E+ 06
4.E+ 06
6.E+ 06
1000 1500 2000 2500 3000
Time [min]
Co
ncentr
atio
n [
rel. u
nit]
untreated NBR3
treated NBR3
Figure 93: Penetrating amount of t-BuPh in untreated and treated NBR3
The thin layer that hardly changes the thickness of the specimen increases the net time-lag and
lowers the permeation rate drastically. The stationary state is attained earlier in case of the
untreated reference than in case of the treated specimen. The permeation rate of t-BuPh is

Chapter 4. Results and discussion 110
significantly reduced due to the density and probably also due to the fluorine content of the layer
applied. This is a proof for the sensitivity of the measuring method by characterizing the
permeation barriers.
The evaluation of the fluorine on the sample surface applied through the plasma treatment was
done by AFM, SEM, FT-IR-Spectroscopy and XPS measurements.
By means of AFM investigations, in case of the treated specimen higher homogeneity and less
surface roughness (4,798 µm) were determined than for the untreated rubber (5,740 µm). The
SEM measurements confirmed the AFM results (Figure 94).
a) b)
Figure 94: SEM pictures of untreated NBR3 (a) and treated NBR3 (b)
By characterizing the surface with ATR-FT-IR spectroscopy, mainly the oxidative changes of the
NBR surface were observed. These changes showed that the coating process with
decafluoropentane was done in the presence of air (Figure 95). In the spectrum, the
characteristic bands for the carbonyl group in esters (1712 cm-1) and amides (1640 cm-1) occur.
It is not completely clear whether the band at 1194 cm-1 corresponds to a C-O vibration or a C-F
vibration. The oxidation processes are also indicated by the characteristic O-H bands at ~3400
cm-1. In correspondence to these bands, the bands of the symmetric C-H oscillation (2849 cm-1)
and the asymmetric C-H oscillation (2921 cm-1) decrease.
O-H
C-H symmetric
C-H asymmetric
C=O (-CO-NH)C=O
C-O
C-F
Extin
ction
Wavelength [cm-1]
O-H
C-H symmetric
C-H asymmetric
C=O (-CO-NH)C=O
C-O
C-F
Extin
ction
Wavelength [cm-1]
Figure 95: ATR-FT-IR investigation of untreated NBR3 (red line) and treated NBR3 (blue line)

Chapter 4. Results and discussion 111
With the XPS investigation of the treated sample several elements were detected and 3,18%
fluorine was found (Table 21). These results emphasized that the absorption band at 1712 cm-1
obtained by FT-IR-Spectroscopy measurements point out the presence of fluorine at the surface
of the sample.
Table 21. XPS results for untreated and treated NBR3
Element Untreated NBR3
[atom%] Treated NBR3
[atom%]
O (1s) 21,58 15,80
N (1s) 1,49 2,38
C (1s) 57,07 69,13
F (1s) - 3,18
Rest 19,86 9,51
The surface polarity due to the presence of the oxygen groups, the effects of C-F groups as well
as the crosslinking density of the matrix could limit the permeation of t-BuPh.
4.4 Relationship of oil exposition and properties
Elastomers have special characteristics, for example, they are flexible, elastic, to some extent
impermeable to both water and air. They are classified in two classes: oil-resistance elastomers
(nitrile rubber, ethylene-acrylate elastomer, fluorocarbon elastomers) and non oil-resistance
elastomers (ethylene-propylene-diene and ethylene-propylene rubbers, natural rubber, butyl
rubber, styrene-butadiene rubber).
A correlation between the heat resistance and oil resistance of various elastomers is presented
in Figure 96.
Oil)
Figure 96: Heat and oil resistance of different elastomers [242]
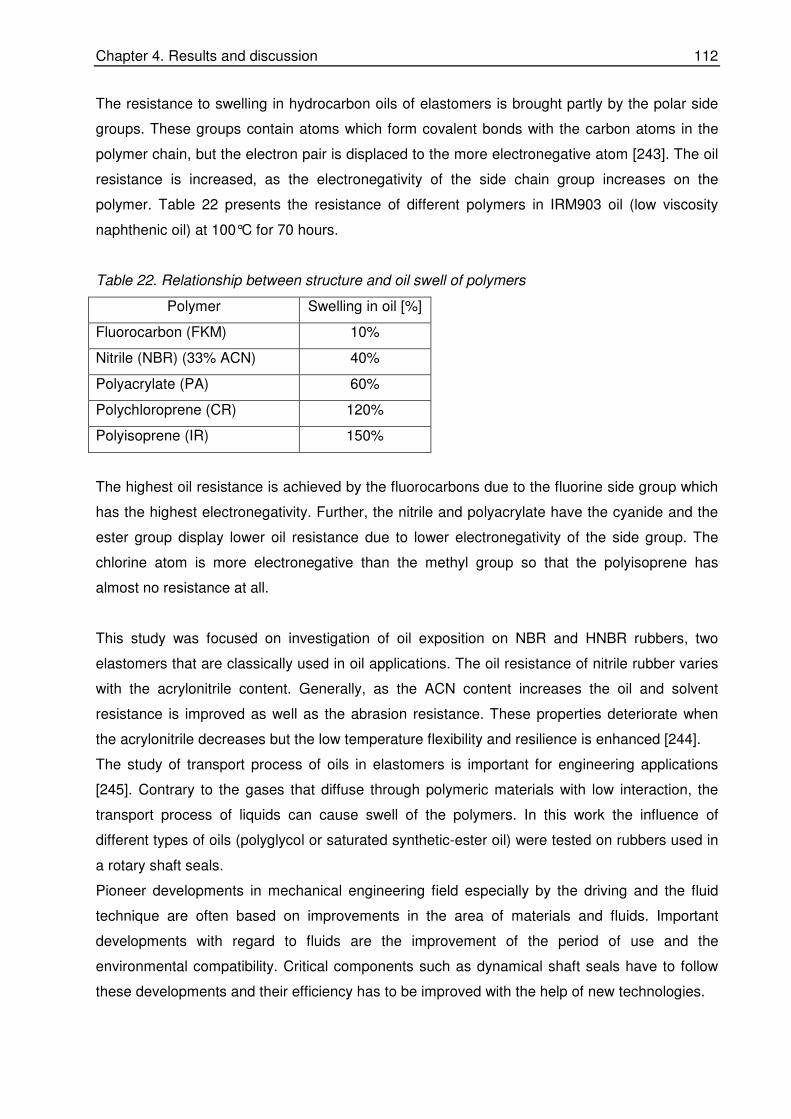
Chapter 4. Results and discussion 112
The resistance to swelling in hydrocarbon oils of elastomers is brought partly by the polar side
groups. These groups contain atoms which form covalent bonds with the carbon atoms in the
polymer chain, but the electron pair is displaced to the more electronegative atom [243]. The oil
resistance is increased, as the electronegativity of the side chain group increases on the
polymer. Table 22 presents the resistance of different polymers in IRM903 oil (low viscosity
naphthenic oil) at 100°C for 70 hours.
Table 22. Relationship between structure and oil swell of polymers
Polymer Swelling in oil [%]
Fluorocarbon (FKM) 10%
Nitrile (NBR) (33% ACN) 40%
Polyacrylate (PA) 60%
Polychloroprene (CR) 120%
Polyisoprene (IR) 150%
The highest oil resistance is achieved by the fluorocarbons due to the fluorine side group which
has the highest electronegativity. Further, the nitrile and polyacrylate have the cyanide and the
ester group display lower oil resistance due to lower electronegativity of the side group. The
chlorine atom is more electronegative than the methyl group so that the polyisoprene has
almost no resistance at all.
This study was focused on investigation of oil exposition on NBR and HNBR rubbers, two
elastomers that are classically used in oil applications. The oil resistance of nitrile rubber varies
with the acrylonitrile content. Generally, as the ACN content increases the oil and solvent
resistance is improved as well as the abrasion resistance. These properties deteriorate when
the acrylonitrile decreases but the low temperature flexibility and resilience is enhanced [244].
The study of transport process of oils in elastomers is important for engineering applications
[245]. Contrary to the gases that diffuse through polymeric materials with low interaction, the
transport process of liquids can cause swell of the polymers. In this work the influence of
different types of oils (polyglycol or saturated synthetic-ester oil) were tested on rubbers used in
a rotary shaft seals.
Pioneer developments in mechanical engineering field especially by the driving and the fluid
technique are often based on improvements in the area of materials and fluids. Important
developments with regard to fluids are the improvement of the period of use and the
environmental compatibility. Critical components such as dynamical shaft seals have to follow
these developments and their efficiency has to be improved with the help of new technologies.

Chapter 4. Results and discussion 113
In case of mechanical engineering, especially at stationary and mobile hydraulic aggregates as
well as at engines and gear units used in automotive or industrial environment sealing are
necessary and are modified to the respect of the working conditions.
A proper sealing over a longer period of time may just be secured by a sufficient chemical
resistance against lubricants, their additives and high temperatures, mostly independent from
mechanical stress.
The aim of this chapter was to study the influence of oil exposition on rubbers considering the
swelling measurements at different temperatures. The effects of those lubricants on mechanical
properties were evaluated as well as the damages of the final product that appeared during the
dynamical stress. The investigations were done on shafts seals used in industry. In this study
the crosslinking density, microstructure of the rubber, the type and the concentration of the filler
used in these formulations were considered on the interpretation of the results.
The rubbers used for this investigation were NBR2 vulcanized by a sulphur system and HNBR1
cured with a peroxide system. The formulations contain the other components employed in a
rubber compound (fillers, processing aids, antioxidants) used for a rotary shaft seal. For the
matrix containing NBR2 the system will be noted with NBR-M1 and for the matrix with HNBR1 it
will be used HNBR-M2. For the comparison with the mixtures used in industry, reference
mixtures were prepared where the rubbers NBR2 and HNBR1 were vulcanized with the
corresponding cured system. The oils used for this study were characterized by means of FT-
IR-spectroscopy and gas chromatography; the results are presented in Table 23 and Figure 97.
Table 23. Chemical characterisation of the oils
Oil
Matrix Additive Others
Polyglycol 1 (PG1)
Polypropylene glycol, MW = 4000 g/mol
Octane acid methyl ester, Decane acid methyl ester, ODPA, “Irganox 1035”, BHT, PPD (Remark: components contain nitrogen, Mm = 369)
Heptane, Toluene, Ethylbenzene, Xylene, Trimethylbenzene, DBP, DEHP
Polyglycol 2 (PG2)
Polyethylene propylene glycol, MW = 3300 g/mol
„Irganox 1035“, ODPA, BHT, PPD
Heptane, Toluene, Ethyl-benzene, Xylene, Benz-aldehyde, Trimethyl-benzene, DBP, DEHP
Saturated complex ester synthetic oil (CE)
Ester, (Comparison of IR Spectra epoxidized Soja oil), MW = 4700 g/mol
Octane acid methyl ester, Decane acid methyl ester, (Remark: components contain nitrogen)
Heptane, 2-Methyl-1-butanole, Toluene, Ethyl-benzene, Xylene, Trimethyl-benzene, DBP, DEHP
Irganox 1035: 2,2’-Thiodiethylen-bis-(3,3’(3,5-di tert. butyl-4-hydroxyphenyl)-propionate) ODPA: Octyl. Diphenylamine DBP: Dibutylphthalate DEHP: Di-(2-ethylhexyl)-phthalate, technical also Dioctylphthalate (DOP) BHT: 2,6-Di-tert.butyl-4-methyl-phenole Mm: Molar mass PPD: Paraphenylenediamine
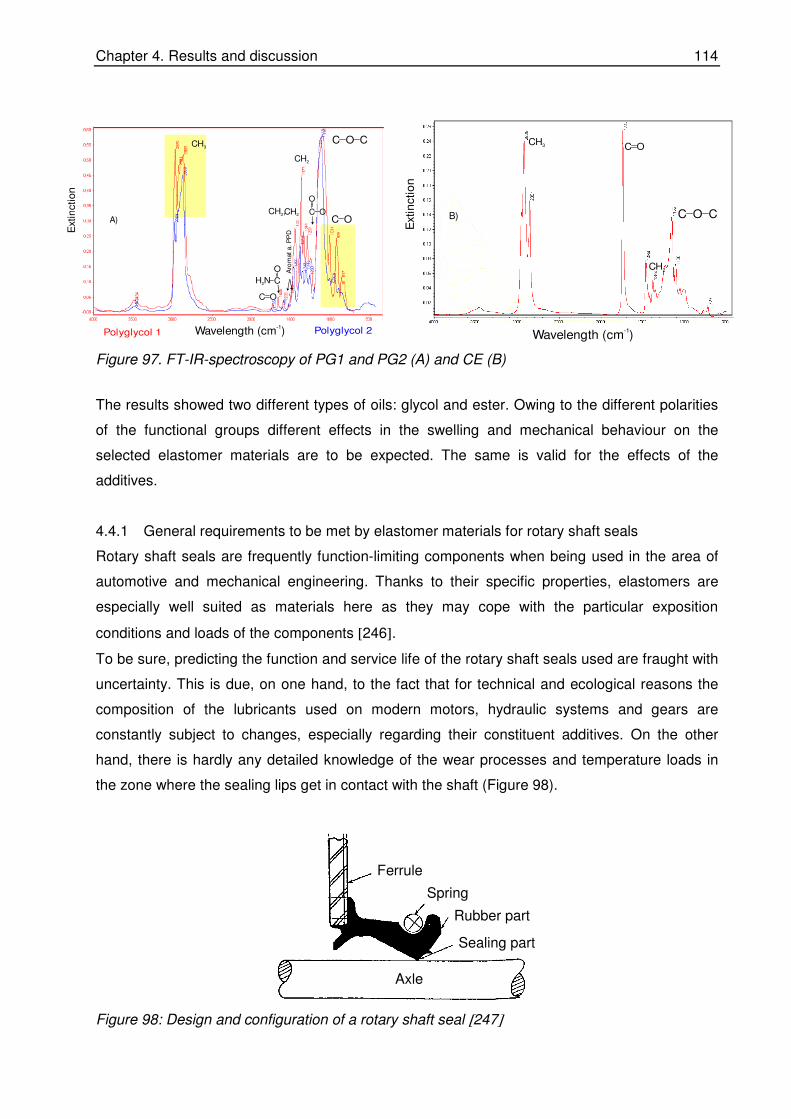
Chapter 4. Results and discussion 114
Wavelength (cm )-1
Extinction
C O C
C OCH2CH ,3 C O
O
CH2
CH3
C O
C
O
H N2
Aro
mat a. P
PD
Polyglycol 1 Polyglycol 2
A)
Wavelength (cm )-1
Extin
ctio
n
CH3 C O
CH2
C O CB)
Figure 97. FT-IR-spectroscopy of PG1 and PG2 (A) and CE (B)
The results showed two different types of oils: glycol and ester. Owing to the different polarities
of the functional groups different effects in the swelling and mechanical behaviour on the
selected elastomer materials are to be expected. The same is valid for the effects of the
additives.
4.4.1 General requirements to be met by elastomer materials for rotary shaft seals
Rotary shaft seals are frequently function-limiting components when being used in the area of
automotive and mechanical engineering. Thanks to their specific properties, elastomers are
especially well suited as materials here as they may cope with the particular exposition
conditions and loads of the components [246].
To be sure, predicting the function and service life of the rotary shaft seals used are fraught with
uncertainty. This is due, on one hand, to the fact that for technical and ecological reasons the
composition of the lubricants used on modern motors, hydraulic systems and gears are
constantly subject to changes, especially regarding their constituent additives. On the other
hand, there is hardly any detailed knowledge of the wear processes and temperature loads in
the zone where the sealing lips get in contact with the shaft (Figure 98).
Ferrule
Spring
Rubber part
Sealing part
Axle
Ferrule
Spring
Rubber part
Sealing part
Axle
Figure 98: Design and configuration of a rotary shaft seal [247]

Chapter 4. Results and discussion 115
This situation is underscored by failures, which may lead to technical and economic
consequences in actual practice. When rotary shaft seals suffer a loss of function this usually
happens in the form of a leak or the loss of fluids (lubricant) in the adjacent system chamber
[246]. To predict the resistance and functional reliability of selected materials for rotary shaft
seals, it is thus of the utmost interest – from a chemical perspective as well – to arrive at a
comprehensive understanding of aging processes in the elastomer of rotary shaft seals and of
the interactions between lubricant, additives and elastomer materials as well as the related
consequences for the property profile of the seal.
When used in gears and engines, rotary shaft seals are subject to radically changing operating
conditions, such as starting operations, occasional standstill as well as pressure and
temperature fluctuations. Rotary shaft seals must provide sufficient resistance over a longer
period of use to be able to follow/respond to the radial deviation of the shaft and construction
tolerance. In specific cases, this results in high requirements on the materials used. On one
hand, these requirements have a mechanical component in form of friction, static compression
or dynamic stress. On the other hand, they also encompass physical and chemical factors of
influence, such as exposition to lubricants and their additives and the atmospheric oxygen and
temperatures in the vicinity of the sealing lip exceeding 140°C, in combination with the sump
temperatures of around 80 -100 °C. The high temperatures mostly are due to high peripheral
speeds. Besides, a high level of mechanical properties in terms of wear, a compressive set and
elasticity, a high resistance to aging and lubricants is thus also required [247]. In actual practice,
this complex requirements profile results in the preponderant use of high quality special purpose
elastomers on the basis of acrylonitrile rubber (NBR), hydrogenated acrylonitrile rubber (HNBR),
fluororubber (FKM) and acrylate rubber (ACM) as well as polyurethanes. Apart from the
polymers used, the type of crosslinking and the choice of further compound components such
as fillers may have a crucial impact, in chemical terms, on the functional reliability of rotary shaft
seals.
4.4.2 Chemical resistance of the rotary shaft seals with respect to different oils
Chemical exposition is of particular significance when it comes to material selection, because
physico-chemical interactions between oils and sealing material may lead to swelling, shrinkage
and exchange reactions among ingredients, with high temperatures generally favoring these
processes. As a rule, the consequence is a drop in the mechanical value level as the elastomer
network is brought under tension by swelling processes and secondary reactions leading to
premature aging processes because of the elution of anti-aging agents that generally trigger
embrittlement of the material with a tendency to cracking. For that reason, the sealing material-
lubricant match-ups are to be optimized to achieve the lowest possible physico-chemical
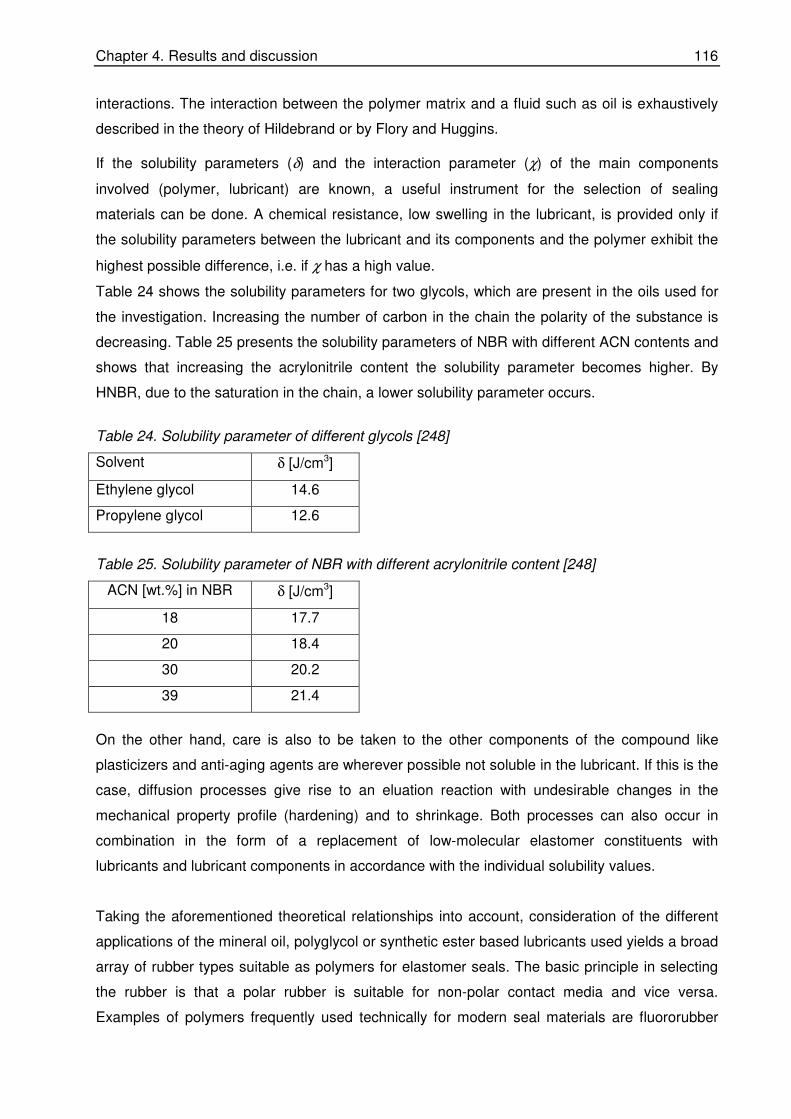
Chapter 4. Results and discussion 116
interactions. The interaction between the polymer matrix and a fluid such as oil is exhaustively
described in the theory of Hildebrand or by Flory and Huggins.
If the solubility parameters (δ) and the interaction parameter (χ) of the main components
involved (polymer, lubricant) are known, a useful instrument for the selection of sealing
materials can be done. A chemical resistance, low swelling in the lubricant, is provided only if
the solubility parameters between the lubricant and its components and the polymer exhibit the
highest possible difference, i.e. if χ has a high value.
Table 24 shows the solubility parameters for two glycols, which are present in the oils used for
the investigation. Increasing the number of carbon in the chain the polarity of the substance is
decreasing. Table 25 presents the solubility parameters of NBR with different ACN contents and
shows that increasing the acrylonitrile content the solubility parameter becomes higher. By
HNBR, due to the saturation in the chain, a lower solubility parameter occurs.
Table 24. Solubility parameter of different glycols [248]
Solvent δ [J/cm3]
Ethylene glycol 14.6
Propylene glycol 12.6
Table 25. Solubility parameter of NBR with different acrylonitrile content [248]
ACN [wt.%] in NBR δ [J/cm3]
18 17.7
20 18.4
30 20.2
39 21.4
On the other hand, care is also to be taken to the other components of the compound like
plasticizers and anti-aging agents are wherever possible not soluble in the lubricant. If this is the
case, diffusion processes give rise to an eluation reaction with undesirable changes in the
mechanical property profile (hardening) and to shrinkage. Both processes can also occur in
combination in the form of a replacement of low-molecular elastomer constituents with
lubricants and lubricant components in accordance with the individual solubility values.
Taking the aforementioned theoretical relationships into account, consideration of the different
applications of the mineral oil, polyglycol or synthetic ester based lubricants used yields a broad
array of rubber types suitable as polymers for elastomer seals. The basic principle in selecting
the rubber is that a polar rubber is suitable for non-polar contact media and vice versa.
Examples of polymers frequently used technically for modern seal materials are fluororubber

Chapter 4. Results and discussion 117
(FKM), nitrile rubber (NBR, HNBR), acrylate rubber (ACM) and ethylene-propylenediene rubber
(EPDM) [249, 250].
Alongside the basic polymer and compound ingredients with a determining influence on the
properties like plasticizers and anti-aging agents, crosslink type or crosslinking density is
another variable that must be taken into consideration from the chemical perspective.
Crosslinking density has a major influence on the degree of swelling attainable in the case of an
interaction between contact medium and material (polymers, filler), with crosslink type (e.g.
sulphur, peroxide) determining the stability of the crosslink network. As A. Ismat et al. has
shown, using fluoro rubber and machine oil [251] that the chemical exposition to certain
lubricant additives leads to a reduction of crosslinking density. A dithiocarbamate has been
identified here as harmful additive.
4.4.2.1 Swelling investigations
Swelling in polyglycols
The first measurements were done in polyglycols at 24°C, 60°C and 100°C. At 24°C and 60°C
the NBR-M1 showed lower swelling values for both investigated lubricants (Figure 99a). It could
be observed that by swelling in PG2 at 100 °C a swelling degree of about 3,5% was reached. In
comparison with HNBR-M2, the mass uptake at all three temperatures was noted to be higher
(Figure 99b). With a temperature of about 100 °C the swelling degree varied from 3 wt.% for
PG2 to 4,5 wt.% for PG1. This behaviour could be explained on one hand by the differences on
the formulations employed, for example the NBR-M1 mix had higher amount of filler (50 wt.%)
compared to HNBR which had 40 wt.%, different vulcanisation system like for NBR-M1 a
sulphur vulcanisation system was employed while for HNBR-M2 a peroxide system was used.
On the other hand, a higher amount of ACN in HNBR-M2 (36%) than in NBR-M1 (28%) leads to
different solubility of these rubbers in polyglycol oils. HNBR-M2 had a better solubility in
polyglycols and in consequence, the HNBR-M2 swelled at different temperatures in both
polyglycols in higher amount than NBR-M1.
0
1.5
3
4.5
6
20 40 60 80 100 120Temperature [°C]
Sw
elli
ng
deg
ree [
wt.%
] PG1
PG2
0
1.5
3
4.5
6
20 40 60 80 100 120Temperature [°C]
Sw
elli
ng
deg
ree [
wt.%
] PG1
PG2
a) NBR-M1 b) HNBR-M2
Figure 99: Temperature dependence on the swelling degree

Chapter 4. Results and discussion 118
It can be concluded that NBR-M1 and HNBR-M2 showed a relatively slight swelling in PG2.
Remarkable was the high temperature dependence of PG1 swelling in HNBR-M2.
Swelling in saturated complex ester synthetic oil (CE)
Saturated complex synthetic ester lubricant was examined more closely. The following figure
showed the results of the swelling of NBR-M1 and HNBR-M2 for 40 days at 140 °C. It was
noticed that HNBR-M2 had after 40 days higher swelling degree (of about 25%) than NBR-M1
0
10
20
30
0 20 40 60
Time [days]
Sw
elli
ng
deg
ree
[wt.
%]
NBR-M1
HNBR-M2
Figure 100: Swelling degrees depending on the swelling time for NBR-M1 and HNBR-M2 in
complex ester lubricant at 140 °C
As the lubricant was a saturated complex ester, the small polarity differences between the
HNBR rubber and the esters might be explained. That means the smaller the difference in the
solubility parameter of the polymer and the oil, the larger the oil swell. For the same reason a
similar swelling behaviour should be expected for the relatively polar NBR which, however, was
by far not reached with a swelling degree of approx. 6%. A possible reason for this different
behaviour was probably due to a higher crosslinking density as well as contribution of the filler
content in NBR matrix. Theoretically the tighter the crosslinking density the lower the swell
degree.
4.4.2.2 Physical-mechanical measurements
The results obtained from the physical-mechanical characterisation of the materials after
swelling in lubricants offered valuable information about the tensile strength and the elongation
at break.
With increasing swelling degree the tensile strength decreases for both rubbers as expected
whereas the highest effect for HNBR-M2 material was observed (Figure 101).
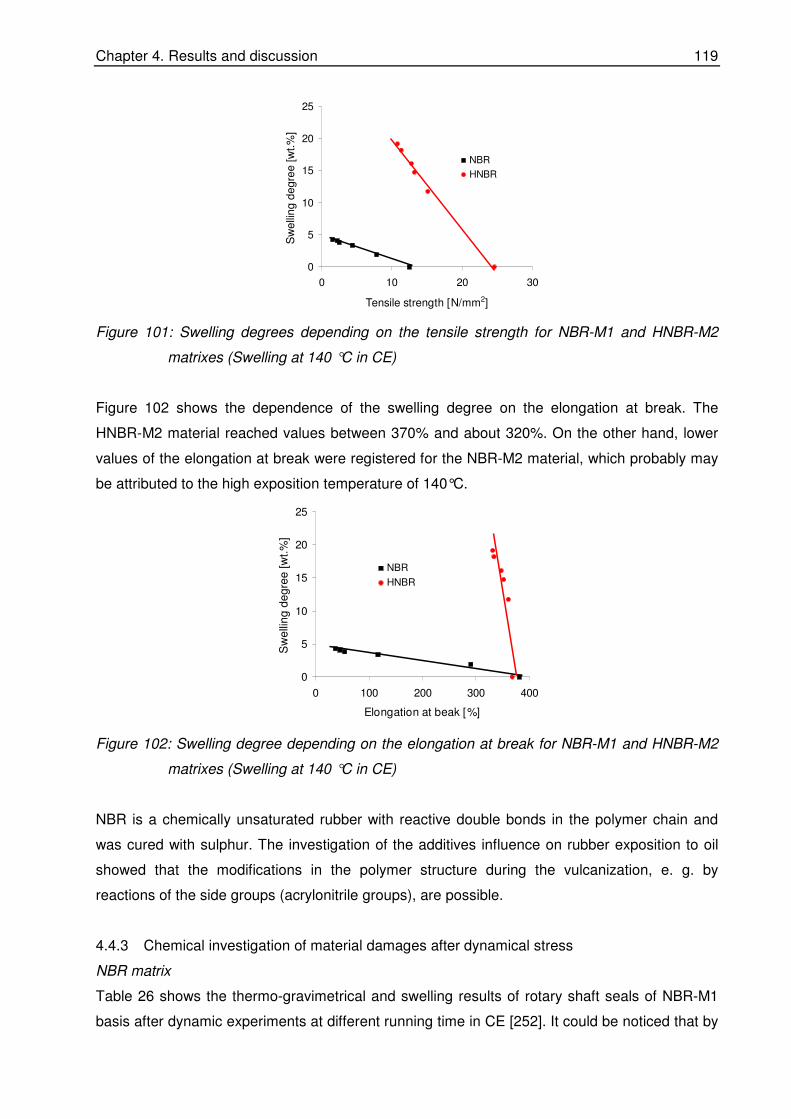
Chapter 4. Results and discussion 119
0
5
10
15
20
25
0 10 20 30
Tensile strength [N/mm2]S
we
llin
g d
eg
ree
[w
t.%
]
NBR
HNBR
Figure 101: Swelling degrees depending on the tensile strength for NBR-M1 and HNBR-M2
matrixes (Swelling at 140 °C in CE)
Figure 102 shows the dependence of the swelling degree on the elongation at break. The
HNBR-M2 material reached values between 370% and about 320%. On the other hand, lower
values of the elongation at break were registered for the NBR-M2 material, which probably may
be attributed to the high exposition temperature of 140°C.
0
5
10
15
20
25
0 100 200 300 400
Elongation at beak [%]
Sw
elli
ng
de
gre
e [
wt.
%]
NBR
HNBR
Figure 102: Swelling degree depending on the elongation at break for NBR-M1 and HNBR-M2
matrixes (Swelling at 140 °C in CE)
NBR is a chemically unsaturated rubber with reactive double bonds in the polymer chain and
was cured with sulphur. The investigation of the additives influence on rubber exposition to oil
showed that the modifications in the polymer structure during the vulcanization, e. g. by
reactions of the side groups (acrylonitrile groups), are possible.
4.4.3 Chemical investigation of material damages after dynamical stress
NBR matrix
Table 26 shows the thermo-gravimetrical and swelling results of rotary shaft seals of NBR-M1
basis after dynamic experiments at different running time in CE [252]. It could be noticed that by

Chapter 4. Results and discussion 120
increasing the running time the glass transition was shifted to higher values, especially after
1500 hours a shift of about + 5°C was emphasised. A positive Tg shift first of all means a
reduction of the chain mobility of the polymer which was connected with a decrease of elasticity.
The Tg shifts correlates well with the results of the crosslinking density evaluated by swelling. A
low swelling degree means an increase in the crosslinking density. In conclusion, the
combination of NBR with the complex ester under the chosen experimental conditions was
shown that the ageing process leads to a hardening of the material and an increase in the
crosslinking density by an oxidative attack in the area of the double bonds of the rubber via
peroxo-radicals with formation of cyclic structures or additional crosslink bridges by recombining
macro radicals [253 - 256]. NBR was sulphur-vulcanized and additional modifications in the area
of sulphur bridges, such as the transfer from flexible polysulphide crosslink knots to more stable
and stiff monosulphide crosslink knots, have to be expected.
Table 26. DSC, swelling and extraction investigation on NBR-M1
Sample Tg
after extraction [°C]
Swelling
[wt.%]
Extr. Amount
[wt.%]
NBR-M1 (damage) ∼200h run in CE, sample 1
-29 91 7,7
NBR-M1 (not damage)
∼1500h run in CE, sample 2 -24 78 7,4
NBR – reference in CE -30 89 2,6
The TGA measurements confirmed these results. Figure 103 did not show that by extraction
investigation any material modification regarding elution processes or polymer reduction occurs.
It was just noted a minimal swelling degree of about 5 wt.% lubricant components if compared
with the reference.
Temperature [°C]
NBR-M1 (not damage)
NBR-M1 (damage)
100
80
60
40
20
0 200 400 600 800
46.5%
47.3%
45%
44.5%
8%
8.2%
Weig
ht
[%]
Figure 103: Measuring curves of TGA at damaged and not damaged material

Chapter 4. Results and discussion 121
The ATR-FT-IR spectroscopic analysis of the rotary shaft seals NBR-M1 (damaged) and NBR-
M1 (not damaged) after extraction shows a carbonyl band (C=O) at a wave length of 1729 cm-1
(Figure 104) which explains the oxidation process, which occurs during the exposition in oil.
Wavelength [cm -1]
NBR-M1 (sample 1)
NBR-M1 (sample 2)
CNCN C=OC=O
Extin
ction
Wavelength [cm -1]
NBR-M1 (sample 1)
NBR-M1 (sample 2)
CNCN C=OC=O
Extin
ction
Figure 104: Comparison of the ATR-FT-IR spectrums of extracted NBR-M1 rotary shaft seals
after exposition in CE
The band at 2240 cm-1 is typical for the nitrile group of NBR rubber. Due to the analysis and
preparation technique quantitative examinations at the ATR-FT-IR spectra were not successful.
The following figures showed the results of the light-microscopic analyses of the sealing lips of
the rotary shaft seals NBR-M1 (damaged) and NBR-M1 (not damaged):
a) NBR-M1 (sample 1) b) NBR-M1 (sample 2)
Figure 105: Light-microscopic shots of the sealing lips surfaces of the NBR-M1 rings after
dynamical stress in combination with CE
The sealing lip surface of the tight NBR (Figure 105a) shows no cracks, in contrast to the ring
run 1500 h turned out to be not tight (Figure 105b). The presence of the damage correlates with
the DSC and swelling experimental results. An increase of the crosslinking density leads to the
embrittlement of the material, which can favour the formation of the cracks at the sealing
surface.

Chapter 4. Results and discussion 122
HNBR matrix
The results obtained after the investigation of the shaft seals of basis HNBR show small
differences and are presented in Table 27. For all systems investigated the same glass
transition and similar swelling degree after exposition in oil were obtained. The hardening of the
HNBR-M2 material for both samples was not observed which suggest that an increase in the
crosslinking density did not occur.
Table 27. DSC, swelling and extraction investigation on HNBR-M1
Sample Tg
after extraction [°C]
Swelling
[wt.%]
Extr. Amount
[wt.%]
HNBR-M2 (not damage)
∼200h run in CE, sample 1 -28 118 11,5
HNBR-M2 (not damage)
∼200h run in CE, sample 2 -29 112 11,2
HNBR - reference in CE -28 107 2,6
In contrast to the NBR, the HNBR contained a saturated main chain with low content of double
bonds (less than 9%). The TGA results proved the high chemical stability with a constant
proportion between polymer and filler considering the methods error margins. It might be noted
from the extraction results that by the combination HNBR with the ester-containing lubricant a
higher extractable amount which explains the higher swelling degree.
The light-microscopy pictures of the sealing lips of the above mentioned HNBR-M2 radial rotary
shaft seals (Figure 106) did not show any cracks.
a) HNBR-M2 (sample 1) b) HNBR-M2 (sample 2)
Figure 106: Light-microscopic shots of the sealing lips surfaces of the HNBR-M2 rings after
dynamical stress in combination with complex ester
These findings correlated with the results of the above mentioned analyses: DSC, TGA and
swelling measurements.

Chapter 4. Results and discussion 123
4.4.4 Investigation of additives used in lubricants and their influences
There was a long standing commercial desire for elastomers with a high resistance to oil. The
chemical composition of the oils used in automobile industry is very complex; various additives
are used as antioxidants. Bhattacharjee and co-workers described the mechanism of oxidation
of nitrile rubber where they suggested that the nitrile group is affected during the oxidation
process and may be converted to −C−C=NH as shown in the mechanism described in Figure
107 [214].
Figure 107: Vulcanisation mechanism proposed by Bhattacharjee [214]
The vulcanisation process can occur after this mechanism when the basic additive react with
the nitrile group that leads to a brittle material due to additional crosslinks formed.
Additive influence of the lubricants PG1 and PG2 on the NBR-M1 material
The investigation of the swelling behaviour of the NBR-M1 material as well as of a model
vulcanizate as reference shows tendentiously comparable results to the lubricants PG1 and
PG2 with and without additive. However, the swelling degree in presence of additives which are
different fatty acid esters, an IRGANOX 1035, 2,6-Bis(tert-butyl)-4-methylphenol (BHT) and an
octylated diphenylamine (ODPA) is lower than without additives (Figures 108 a and b).
0
30
60
90
120
150
0 10 20 30Time [days]
Sw
ellin
gd
eg
ree
[wt.
%]
PG2 with Ad
PG1 with Ad
PG2 without Ad
PG1 without Ad
0
10
20
30
40
0 10 20 30Time [days]
Sw
elli
ng
de
gre
e[w
t.%
]
PG1 with Ad
PG2 with Ad
PG2 without Ad
PG1 without Ad
a) NBR-M1 reference b) NBR-M1
Figure 108: Swelling degrees depending on the swelling time of the reference on the basis NBR
in PG1 and PG2 with and without additives at 140°C

Chapter 4. Results and discussion 124
Generally, the increase in swelling degree of the model vulcanizate due to missing fillers and
differences in the crosslinking density is much higher than in case of the original material NBR-
M1, but the effect of the additives is the same. The reason for the lower swelling degree in
presence of additives may on one hand result from the lower chemical tolerability of the
additive/lubricant as multi-component mixture compared to the additive-free one in contrast to
the NBR-M1 material. On the other hand chemical reactions set off by additive components or
thermal-caused aging processes may also lead to an increase in the crosslinking density which
again results in a lower swelling degree.
In conclusion, because of its crosslink type and unsaturation, NBR is less temperature resistant
than the other examined elastomer. During the vulcanisation process with sulphur S-S and S-C
bonds will form. The bond energy of S-S (270 KJ/mol) and S-C (272 KJ/mol) are relative low
and this lead to a lower temperature stability of this material. However, the predominant attack
of oxygen is on the double bonds with the generation of hydroperoxide-radicals making this
rubber less stabile over a temperature of about 100°C.
Additive influence of the lubricants PG1 and PG2 on the HNBR-M2 material
A comparison of the swelling degrees of HNBR-M2 model vulcanisate and original material
without additives in PG1 and PG2 shows analogously to the NBR material. Higher swelling
degrees for the model vulcanizate were noticed because above all the fillers are missing.
0
10
20
30
40
0 10 20 30 40 50
Time [days]
Sw
ellin
gd
eg
ree
[wt.%
]
PG2 with Ad
PG1 with Ad
PG2 without Ad
PG1 without Ad
0
10
20
30
40
0 10 20 30 40 50
Time [days]
Sw
ellin
gd
eg
ree
[wt.%
]
PG2 without Ad
PG1 without Ad
a) HNBR-M1 reference b) HNBR-M1
Figure 109: Swelling degrees depending on the swelling time of the reference on the basis
HNBR in PG1 and PG2 with and without additives at 140°C
The study of the exposition against oil of several shaft seals based on NBR and HNBR
compounds used in industry demonstrated that the polyglycols and saturated complex ester
synthetic oil swell both rubbers to different extent. The experiments showed that there is overall
correlation between swelling degree and solubility and that the swelling degree and solubility of
nitrile rubbers in the oils investigated increase with increasing polarity.

Chapter 5. Conclusions
125
5. Conclusions
This work brings a contribution to the study of the rubber blend compatibility, diffusion and
permeation mechanism of the low molecular components in rubber and rubber blends taking
into consideration the influence of polymer structure, the crosslinking density, the chain length of
the diffusant, the temperature and the nature of filler.
For the characterisation of the phase morphology, dynamic mechanical spectroscopy and
transmission electron microscopy were employed. Both the Tg shift and the broadness of the
damping peaks were considered as dynamic-mechanical criteria for the study of the
compatibility. Based on the experimental results, it could be established that the presence of
vinyl and epoxy groups plays an important role on the influence of phase morphology.
Increasing the amount of vinyl groups of SBR phase, a higher compatibility in blend with NR is
achieved because the interaction between the vinyl and isoprene units is favoured. By TEM
investigation, it was seen that by increasing the vinyl amount in SBR the size of the dispersed
NR domains becomes smaller and the shape of the domains appears less elongated. This leads
to a better homogeneity of the blend. A linear relationship between the average domain size and
the solubility parameter difference was achieved for a series of NR/SBR blends.
By chemical modification of one phase by means of introducing epoxy groups, for example in
SBR phase of a rubber blend with NR it was observed that poor blend homogeneity of
NR/EpSBR occurs due to the formation of large NR domains with a broad size distribution. On
the other hand, if the epoxidation was done in NR phase, the solubility parameter was very
much increased which has the effect of reducing the thermodynamic dissimilarity in ENR/SBR.
The modification of both phases leads to a considerable improvement in the compatibility of
both epoxidized rubber phases (ENR/EpSBR blend).
It was demonstrated that by mixing of two rubbers with different polarity, i.e. NR and NBR or
SBR and NBR the δ-parameter difference is high, leading to strongly phase separated blends,
an incompatible system being obtained.
The volume fraction of the interphase in different rubber blends was estimated quantitatively
from dynamic mechanical analysis when the impact of the blend ratio on the G” (T) in the glass
transition region of unfilled blend systems was studied. The determination of the interphase of
non epoxidized and epoxidized rubber blends was estimated. Among the systems studied, the
best compatibility was observed for the ENR/EpSBR blend.
The efficiency of additives (processing aids) in rubber is strongly related to the constitution of
the molecules. It was noticed that at low temperatures, the investigated esters are soluble in
SBR matrices at higher concentrations compared to the other additives (alcohols and acids)
Chapter 5. Conclusions
126
studied. The higher plasticizing efficiency was shown by the methyl-ester meanwhile the effects
demonstrated by the alcohol and the acid respectively are similarly graded.
It was observed that the molar mass (C12 and C18) and the chemical functionality (alcohols,
acids and ester) have a high influence on Tg shift, which influences the plasticizing efficiency
considerably.
The investigation of the solubility and the behaviour of a technical product designed to improve
processability in rubber demonstrated (through DSC, turbidity measurements and optical
microscopy) that more than one component exist in this product and that at 100 °C at least one
component of the technical product remains undissolved.
The viscoelastic analysis demonstrated that by incorporation of the model processing aids the
plateau modulus G0N is not strongly affected but the reptation time τrep is significantly decreased.
For the study of the transport processes of the low molecular components in rubber and rubber
blends four different methods in order to determine the diffusion coefficients were employed.
Two FT-IR spectroscopic methods were used such as macroscopic "time lag" method and the
"concentration-distance analysis" that has the advantage of the direct determination of the
diffusion process at a microscopic scale. By the time dependent swelling measurements a
correction after Crank that takes into consideration the geometrical change of the sample during
swelling was considered. The time lag method considering the permeation measurements (two
chamber method) was used also for the determination of the diffusion coefficient.
The diffusion process of phthalates in NBR, HNBR and SBR was investigated by employing the
first two methods. The results showed that the chemical constitutions of the polymer (ACN and
vinyl content) as well as the state of crosslinking of the matrix exert a determinant contribution
on the value of the diffusion coefficient. It was demonstrated that by increasing the ACN and
vinyl content in NBR and SBR respectively the diffusion coefficient was significant lowered. The
influence of these parameters was described by a simple empirical model.
The investigation of the influence of the molecular weight of the diffusant on the diffusion
coefficients showed that the diffusion coefficient decreases from 2,2*10-8 cm2/sec for DMP to
2,1*10-9 cm2/sec for DDP.
The influence of unsaturation of the polymer and temperature on diffusion process was
examined in NBR and HNBR. The results indicated that the diffusion of DOP is faster in HNBR
than in NBR. The temperature, which is expressed in terms of the activation energy,
demonstrated higher activation energy for the diffusion of DOP in NBR (40 KJ/mol) than in
HNBR (33 KJ/mol).

Chapter 5. Conclusions
127
It was shown that the diffusion coefficients obtained by using the "time-lag" method and the
"concentration-distance" analysis are not identical. The differences result from the quality of the
sample preparation and from the concentration dependency of diffusion coefficient.
For determination of the diffusion coefficients of t-BuPh in NBR, HNBR and SNBR the time lag
method using the ATR-FT-IR spectroscopy, swelling kinetics and permeation measurements
were carried out.
The study of the transport processes of t-BuPh in NBR, SBR specimens covering the same Tg
range were compared applying the ATR-IR spectroscopic time-lag method. The comparison
showed that the influence exerted by the free volume of the rubber matrix as well as the
solubility of the low molecular compound in the rubber matrix has a crucial influence on the
diffusion coefficient. Both influences are determined by the constitution and the chemical
structure of the polymers.
The influence of the filler on transport processes was described on the basis of a comparison of
swelling measurements:
1) the diffusion coefficient and the permeation rate decrease with filler content;
2) differences in the rubber/filler interaction are reflected on diffusion coefficients values for
a constant filler volume fraction;
3) the influence of the interfacial layer in filled rubber on diffusion process was evaluated
considering a proposed model and it was demonstrated that a higher volume fraction of
the interfacial layer leads to a higher diffusion coefficient through the interfacial layer.
The influence of the diffusant structure on diffusion process was studied by means of swelling
investigation. At the same molecular weight of the diffusant but different isomers a significant
reduction of the diffusion coefficient was noticed, i.e. the bulky tertiary butyl benzene showed a
decrease of D with 30% if compared with n-butylbenzene.
An atmospheric-pressure plasma apparatus was used for the surface treatment of a rubber
plate using decafluoropentane as precursor. After the treatment the diffusion coefficient as well
as the permeation rate was reduced by more than 50%.
In the case of rubber blends, the transport process was clearly shown to be dependent on the
phase morphology. In each case the continuous phase determines the value level of the
diffusion coefficient.
Chapter 5. Conclusions
128
A permeation apparatus (two-chamber method) was set up and involved the tracing over the
time the transport of low-molecular compounds through a rubber plate (with a thickness of 0.3-
3mm) that separates a chamber where the solvent is placed from a chamber where a carrier
gas with a stationary stream passes. The low molecular component was quantified by means of
gas chromatography. The gas chromatographic system allows for a separation of the solvent
mixes into single components, so that selective permeation processes can be traced.
The function of the apparatus was tested and validated on unfilled NBR vulcanizates with t-
BuPh as the test substance. Comparison of the diffusion coefficients results, which were carried
out on NBR specimens with the help of three methods (time lag method, swelling and
permeation), pointed out a good agreement of the results.
The tests carried out on NBR with t-BuPh using the permeation apparatus showed that:
1) increasing the ACN content leads to a significant increase in time lag and to a lower
diffusion coefficient as well as a lower permeation rate;
2) the effect of crosslinking density shows the same influence as the ACN content but is
much less significant.
In the last part of the work, the study of the exposition against oil of several shaft seals based on
NBR and HNBR compounds used in industry was shown that the polyglycols and saturated
complex ester synthetic oil swell both rubbers to different extent. The experiments showed that
there is overall correlation between swelling degree and solubility and that the swelling degree
and solubility of nitrile rubbers in the oils investigated increase with increasing polarity.
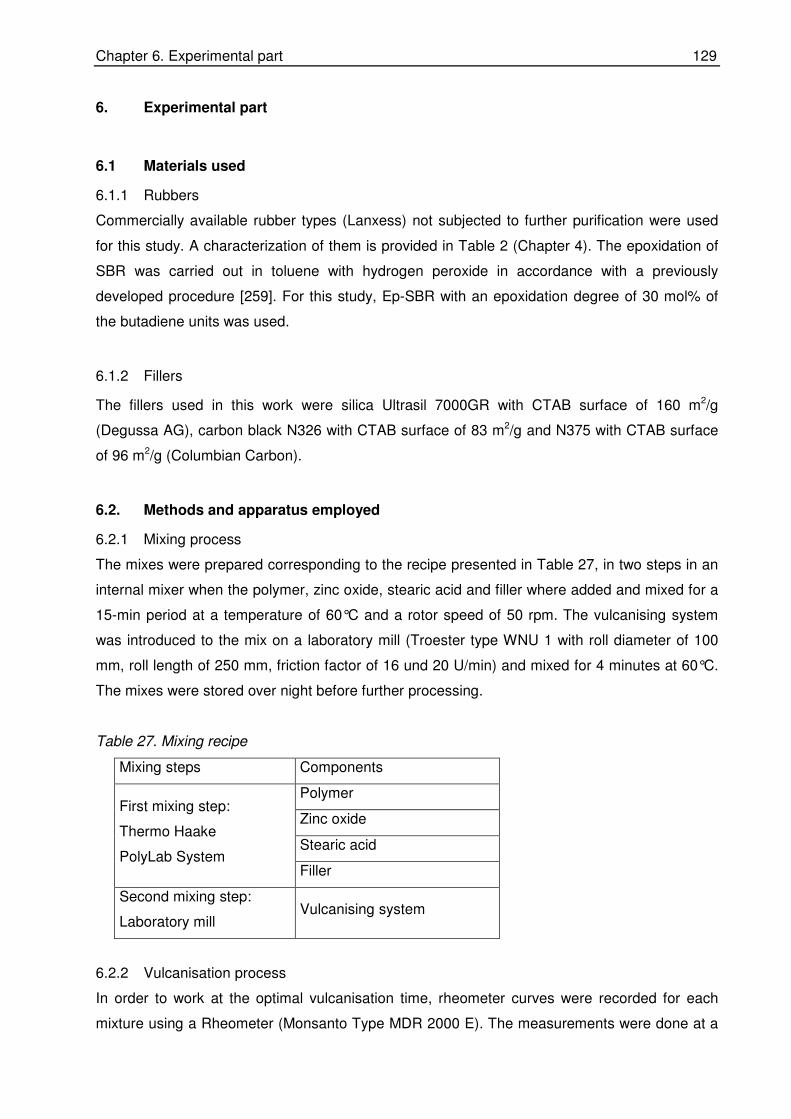
Chapter 6. Experimental part 129
6. Experimental part
6.1 Materials used
6.1.1 Rubbers
Commercially available rubber types (Lanxess) not subjected to further purification were used
for this study. A characterization of them is provided in Table 2 (Chapter 4). The epoxidation of
SBR was carried out in toluene with hydrogen peroxide in accordance with a previously
developed procedure [259]. For this study, Ep-SBR with an epoxidation degree of 30 mol% of
the butadiene units was used.
6.1.2 Fillers
The fillers used in this work were silica Ultrasil 7000GR with CTAB surface of 160 m2/g
(Degussa AG), carbon black N326 with CTAB surface of 83 m2/g and N375 with CTAB surface
of 96 m2/g (Columbian Carbon).
6.2. Methods and apparatus employed
6.2.1 Mixing process
The mixes were prepared corresponding to the recipe presented in Table 27, in two steps in an
internal mixer when the polymer, zinc oxide, stearic acid and filler where added and mixed for a
15-min period at a temperature of 60°C and a rotor speed of 50 rpm. The vulcanising system
was introduced to the mix on a laboratory mill (Troester type WNU 1 with roll diameter of 100
mm, roll length of 250 mm, friction factor of 16 und 20 U/min) and mixed for 4 minutes at 60°C.
The mixes were stored over night before further processing.
Table 27. Mixing recipe
Mixing steps Components
Polymer
Zinc oxide
Stearic acid
First mixing step:
Thermo Haake
PolyLab System Filler
Second mixing step:
Laboratory mill Vulcanising system
6.2.2 Vulcanisation process
In order to work at the optimal vulcanisation time, rheometer curves were recorded for each
mixture using a Rheometer (Monsanto Type MDR 2000 E). The measurements were done at a

Chapter 6. Experimental part 130
temperature of 160°C, a frequency of 1,67 Hz and amplitude of +/- 0,5 % in accordance with
DIN 53 529. To minimize the outside effects, the sample was placed between two foil layers of
polyamide und polyethylene terephthalate. The vulcanisation time represents the time t95
(maximum of the torque).
The vulcanisation process of the rubbers was done by 200 MPa in a press (J. Wickert & Söhne
Type WLP 63/3,5/3). The enclosed air was removed through different ventilation.
For IR spectroscopy measurements, vulcanised thin plates using a heatable mould (Specac L.
O. T. Oriel) under 40KN were prepared.
6.2.3 Differential scanning calorimetry (DSC)
The glass transition temperatures and the low temperature solubility limit of the mixtures were
determined by DSC measurements (TA-Instruments DSC 2920CE Modulated DSC equipment)
at a heating rate of 10°C/min. Tg was taken as the maximum of the first derivative of the heat
flux as a function of the temperature.
6.2.4 Thermogravimetry (TGA)
The thermogravimetrical measurements were done with equipment High Resolution TGA 2950
(TA Instruments Corp). During the measurement, a heating rate of 10 K/min was used, starting
the measurement at room temperature. In the chamber where the sample was analysed
constant nitrogen flow of 60 ml/min was used. After a period of time it was switched over to
550°C using synthetic air. That means, the burning destruction of the matrix was made under
nitrogen, meanwhile the oxidative destruction took placed under oxygen.
6.2.5 Dynamic mechanical analysis (DMA)
The DMA was employed for the analysis of the phase morphology, the temperature dependency
of the loss modulus, G'', of the blends was recorded over the entire concentration range. Test
specimens were deformed in torsion on a dynamic analyzer (ARES 3A5 Rheometrics Scientific)
at 1 Hz and 1% strain amplitude and a heating rate of 1°C/min.
For the investigation of the additives influence on viscoelastic properties, the dependency of the
storage modulus G' and the loss modulus G'' with the deformation frequency was measured at a
constant strain amplitude of 0,5 % in the temperature range from 10 to 140°C using a plate-
plate configuration (D/H = 30 mm/2 mm) with a Rheometrics Dynamic Analyser RDA II. By
employing the temperature frequency superposition principle [101] a master curve was
established.

Chapter 6. Experimental part 131
6.2.6 Transmission Electron microscopy (TEM)
Ultra thin cuts (70nm) obtained on an Ultra Cut FC4 (Reichert-Jung) microtome were
investigated by using electron spectroscopy imaging (ESI) on a transmission electron
microscope (Zeiss EM 902). Contrast was obtained without chemically staining procedures, but
merely by simply out-blending the inelastically scattered electrons using energy filters. With this
procedure, the phase with the higher electron and carbon density appears as the dark one. The
domain size distribution was measured by a computer-aided imaging system, taking into
account the equivalent circles of the detected domains.
6.2.7 Equilibrium swelling
Equilibrium swelling experiments of crosslinked rubber in selected solvents or additives were
performed at different temperatures. After the sample reached the equilibrium the solvent
uptake was measured gravimetrically.
6.2.8 ATR-FT-IR-spectroscopy
The experimental set up is depicted in Figure 106. The prepared thin films were placed on the
horizontal surface of the Ge-crystal at room temperature of 24°C. A reservoir containing the
pure diffusant was placed in an open tube on the top of the rubber film.
(1)
(5)
(3)
(2)
(4)
(2)
Figure 110: Principle of FT-IR ATR diffusion measurements with (1) reservoir (pure diffusant),
(2) sealing rings, (3) rubber film, (4) IR-beam, (5) ATR-crystal
The diffusion process starts when contact between rubber and diffusant is engaged. The time
dependent change of concentration of the diffusant at the surface of the Ge-crystal was
determined by using the absorbance signal intensity of the diffusant. The measurements were
carried out at a temperature of 24°C by means of FT-IR Nicolet 60 Nexus equipped with a
horizontal 45° germanium crystal ATR device. For the reproducibility of these measurements
three samples were investigated.
6.2.9 Concentration-distance analysis
The system used for this study is made up of two separated layers. One layer contained the
rubber and the diffusing substance and was considered the reservoir. The other layer was

Chapter 6. Experimental part 132
vulcanized rubber of the same chemical constitution. An inorganic dye was incorporated for
increasing the optical contrast between the two layers. By this, the borderline between the two
layers could be observed more precisely. The two layers were pressed together at a
temperature of 24°C and at a pressure of 100 bar, for different periods of time. Microtome cuts
(10 µm) were made perpendicular to the boundary plane of the "sandwich" samples on an Ultra
Cut (FC4 Reichert-Jung) microtome. The analysis was carried out by means of an IR-
microscope (type: Nicolet Continuum) in the transmission mode coupled to Fourier-Transform-
Infrared spectrometer (type: FT-IR Nicolet 60 Nexus).
During the whole process, the condition of the conservation of mass had to be satisfied. This
required from the experimental design to measure the concentration along the x-axis from the
initial position of the boundary between the two components at the relative precision about
± 0,8 %. The changes in concentration (concentration profiles) were recorded at several times
as a function of the distance using the borderline as origin. The concentration-distance curve
was plotted for a given time t of observation and the diffusion coefficient D was evaluated from
the concentration profiles using Equ. (46), Chap. 3.3.1.3.
6.2.10 Turbidity measurements
The transmission of a laser light beam through a thin film cast from a methylene-chloride
solution was recorded as a function of increasing or decreasing temperature. The sample was
placed on a horizontal sample carrier inside of a metal block thermostat heated with a precision
of ± 1°C. Changes in light transmission (Tr = I/I0) caused by phase transitions where observed
from changes of the intensity of the transmitted light. Reduced light transmission indicates a
phase separated system.
6.2.11 Optical microscopy
To investigate the morphology within thin films an optical microscope (Zeiss-Universal) at a
magnification of 125 was used. The samples were placed into a heating chamber (Linkam,
THMS 600) and were heated with a rate of 10°C/min up to 150°C. Cooling of the sample was
performed at a rate of 1°C/min.
6.2.12 Plasma treatment
In a plasma apparatus, PFW20, Plasmatreat, NBR2 plate was treated using as precursor
Dekafluorpentan in thin layer under atmosphere pressure. The precursor which is needed for
the coating was introduced at the lower part of the plasma zone (Down-Stream Process). The
treated sample and the untreated sample were analysed by means of Raster electron
microscope (MicroProf) in contact mode in order to study the surface roughness.

Chapter 6. Experimental part 133
6.2.13 Determination of the crosslinking density
The crosslinking density was determined by means of tension-strain measurements using
Mooney-Rivlin theory (Equ. (60), Chap. 3.3.1.4.5). The measurements were done in accordance
with DIN 53 504 by a deformation speed of 200 mm/min at 23°C in a universal test apparatus
(Zwick 1445), equipped with an optical measuring way. The average of five measurements for
each sample was taken into consideration and the results for HNBR1, NBR2 und SBR2 with 2
mm thickness of the test sample are presented in Table 34.
6.2.14 Dispersion measurements
The amount of the filler agglomerates that are not dispersed (macro-dispersion) can be
determined by means of Hellfeld-Vertical reflections measurements on vulcanised sliced
sample. Dark region dispersed on bright ground define the form and size of the filler
agglomerates. The filler dispersion and the surface of the agglomerate (≥ 6 µm) are calculated
using a picture evaluation program.
6.2.15 Scanning electron microscopy
The sample was covered with a thin sheet of gold in order to minimize the electron beam
reflection. The SEM investigations were done on Philips-FEI-apparatus, type XL 30, with a
wolfram-hairpin cathode and using a distance of 10 mm.
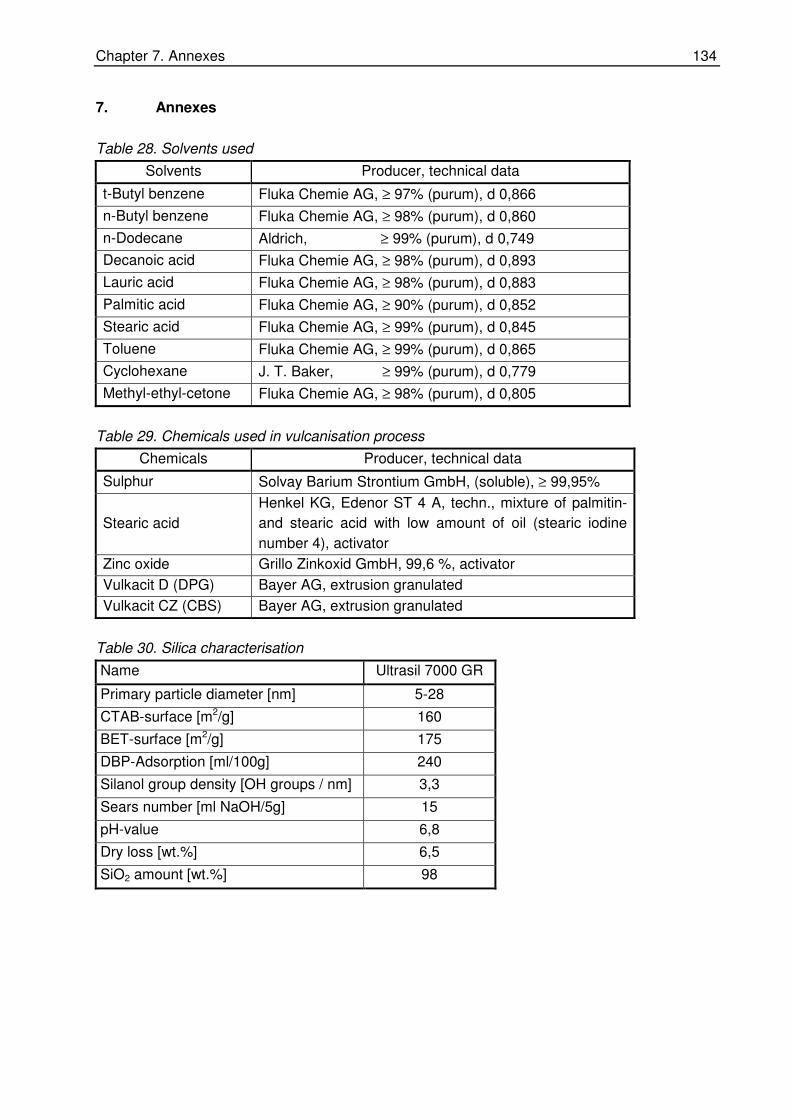
Chapter 7. Annexes 134
7. Annexes
Table 28. Solvents used
Solvents Producer, technical data
t-Butyl benzene Fluka Chemie AG, ≥ 97% (purum), d 0,866
n-Butyl benzene Fluka Chemie AG, ≥ 98% (purum), d 0,860
n-Dodecane Aldrich, ≥ 99% (purum), d 0,749
Decanoic acid Fluka Chemie AG, ≥ 98% (purum), d 0,893
Lauric acid Fluka Chemie AG, ≥ 98% (purum), d 0,883
Palmitic acid Fluka Chemie AG, ≥ 90% (purum), d 0,852
Stearic acid Fluka Chemie AG, ≥ 99% (purum), d 0,845
Toluene Fluka Chemie AG, ≥ 99% (purum), d 0,865
Cyclohexane J. T. Baker, ≥ 99% (purum), d 0,779
Methyl-ethyl-cetone Fluka Chemie AG, ≥ 98% (purum), d 0,805
Table 29. Chemicals used in vulcanisation process
Chemicals Producer, technical data
Sulphur Solvay Barium Strontium GmbH, (soluble), ≥ 99,95%
Stearic acid
Henkel KG, Edenor ST 4 A, techn., mixture of palmitin-
and stearic acid with low amount of oil (stearic iodine
number 4), activator
Zinc oxide Grillo Zinkoxid GmbH, 99,6 %, activator
Vulkacit D (DPG) Bayer AG, extrusion granulated
Vulkacit CZ (CBS) Bayer AG, extrusion granulated
Table 30. Silica characterisation
Name Ultrasil 7000 GR
Primary particle diameter [nm] 5-28
CTAB-surface [m2/g] 160
BET-surface [m2/g] 175
DBP-Adsorption [ml/100g] 240
Silanol group density [OH groups / nm] 3,3
Sears number [ml NaOH/5g] 15
pH-value 6,8
Dry loss [wt.%] 6,5
SiO2 amount [wt.%] 98

Chapter 7. Annexes 135
Table 31. Test recipes (mixes used in chapter 4.1)
Materials System
[phr]
Polymer* 100,0 ZnO 4,0
Stearic acid 3,0
CBS 2,5
Sulphur 1,6
*NR, SBR, ENR, EpSBR, NBR
Table 32. Test recipes (mixtures used in chapter 4.3.1)
Materials System
[phr]
Polymer* 100,0 Stearic acid 3,0
ZnO 4,0
CBS 1,5 TMTD 2,0
Sulphur 2,0
*NBR1, NBR2, NBR4
Table 33. Test recipes (mixtures used in chapter 4.3.1.2)
Materials Layer 1
[phr] Layer 2
[phr]
Polymer* 100,0 100,0 Stearic acid 3,0 3,0 ZnO 4,0 4,0
CBS 1,5 5,0 TMTD 2,0 2,0
Sulphur 2,0 2,0 DOP - 10,0
*NBR4, HNBR1
Table 34. Crosslinking density for different rubbers
Sample Vulcanization
system Amount
[phr] νe
[10-5*mol/cm3]
NBR 3-1 S/CBS 1,0/1,0 4,5 ± 0,13 NBR 3-2 S/CBS 1,5/1,5 8,6 ± 0,3
NBR 3-3 S/CBS 2,5/2,5 15,9 ± 0,1
HNBR 1-1 DCP 0,5 0,041 ± 0,003 HNBR 1-2 DCP 1,0 0,77 ± 0,07 HNBR 1-3 DCP 2,0 9,4 ± 0,51
SBR 2-1 S/CBS 1,0/1,0 4,2 ± 0,6
SBR 2-2 S/CBS 1,5/1,5 7,0 ± 0,3
SBR 2-3 S/CBS 2,5/2,5 9,9 ± 0,41

Chapter 8. Literature 136
8. Literature
[1] L. A. Utracki, “Polymer Alloys and Blends“, Hanser, New York, (1989).
[2] D. R. Paul, S. Newman, “Polymer Blends“, Academic Press, New York, (1978).
[3] F. M. Sweeney, “Polymer Blends and Alloys: Guide to Commercial Products“,
Technomic, Lancaster, PA, (1988).
[4] Olabisi, L. M. Robeson and M. T. Shaw, “Polymer-Polymer Miscibility”, Academy Press,
New York, (1979).
[5] K. Solc, “Polymer Compatibility and Incompatibility Principles and Practice“, Harwood
Academic, New York, (1982).
[6] J. Stoelting, F. E. Karasz, W. MacKnight, Polym. Eng. Sci., 10 (1970) 133.
[7] G. A. Zabrzewski, Polymer, 14 (1973) 347.
[8] B. Ohm, R. Annicelli, T. Jablonowski, R. Mazzero, Rubber World, 8 (2002) 33.
[9] A. O. Patil, T. S. Coolbaugh, Rubber Chem. and Technol., 78 (2005) 516.
[10] L. Bohn, Rubber Chem. Technol., 41 (1968) 495.
[11] C. M. Roland, Rubber Chem. Technol, 62 (1989) 456.
[12] M. Klüppel, R. H. Schuster, J. Schaper, Rubber Chem. Technol., 72 (1999) 91.
[13] W. Hofmann,H. Gupta, Handbuch der Kautschuktechnologie, (2001), Ch. 9.
[14] B. G. Crowther, 128th ACS-Rubber Division Meeting Cleveland (OH), Oct. 1985.
[15] L. Steger, Kautschuk Gummi Kunststoffe, 43 (1991) 197.
[16] G. Thielen, Kautschuk Gummi Kunststoffe, 44 (1991) 232.
[17] B. L. Lee, Polym. Eng. Sci. 21 (1981) 294.
[18] S. A. Groves and A. J. Tinker, J. of Natural Rubber Res., 11 (1996) 125.
[19] E. Földes, J. Lohmeijer, Journal of Applied Polymer Science, 65 (1997) 761.
[20] H. Schulz and L. Steger, Kautschuk Gummi Kunststoffe, 6 (1998) 402.
[21] R. H. Schuster, H. Geisler, G. Scholz, Kautschuk Gummi Kunststoffe, 55 (2002) 653.
[22] W. Keberle, W. Gobel, U. S. Patent 3,637,553 (1972) (assigned to Farbenfabriken
Bayer).
[23] R. P. Kane, J. Elast. Plast., 9 (1977) 416.
[24] R. H. Schuster, Angew. Makromol. Chemie, 202/203 (1992) 159.
[25] P. J. Corish, Rubber Chem. Technol., 40 (1965) 156.
[26] P. J. Flory, J. Chem. Phys., 9 (1941) 660.
[27] M. L. Huggins, Ann. N. Y. Acad. Sci., 43, 1 (1942).
[28] M. L. Huggins, J. Chem. Phys., 9 (1941) 440.
[29] P. J. Flory, “Principles of Polymer Chemistry”, Cornell Univ. Press., Ithaca, New York
(1953).
[30] R. L. Scott, J. Chem. Phys., 17 (1949) 279.

Chapter 8. Literature 137
[31] H. Tompa, Tran. Faraday Soc., 45 (1949) 1142.
[32] E. Helfand and Y. Tagami; J. Chem. Phys., 56 (1971) 2591.
[33] S. Wu, Polymer, 28 (1987) 1144.
[34] R. H. Schuster, J. Schaper and M. L. Hallensleben, 151st Meeting of ACS-Rubber
Division, Anaheim (CA), May 1997, paper XII.
[35] R. Koningsveld, L. A. Kleintjens, Pure Appl. Chem. 39 (1974) 197.
[36] W. Berger, H.W. Kammer and C. Kummerlöwe, Makromol. Chem. Suppl., 8 (1984) 101.
[37] N. Tokita, Rubber Chem. Technol., 50 (1977) 708.
[38] H. P. Grace, Chem. Eng. Comm., 14 (1982) 225.
[39] J. H. Hildebrand and R. L. Scott, “The Solubility of Non-Electrolytes”, New York (1964).
[40] M. B. Huglin, D. J. Pass, J. Appl. Polym. Sci., 12 (1968) 473.
[41] L. H. Sperling, “Introduction to physical polymer science”, 2nd edition, J. Willey & Sons,
(1992).
[42] O. Smidsrod, J. E. Guillet, Macromolecules, 2 (1968) 272.
[43] P. A. Small, J. Appl. Chem., 3 (1953) 71.
[44] R. F. Fedors, Polym. Eng. Sci., 14 (1974) 147, 472.
[45] D. M. Koenhen, C. A. Smolders, J. Appl. Polym. Sci., 19 (1975) 1163.
[46] D. W. Krevelen, P. J. Hoftyzer, J. Appl. Polym. Sci., 11 (1967) 2189.
[47] K. L. Hoy, J. Paint. Technol., 42 (1979) 76.
[48] H. Mark, A. V. Tobolsky, “Physical Chemistry of High Polymeric System“, Willey
(Interscience), New York, (1950).
[49] G. DiPaola-Baranayi, J. E. Guillet, J. Klein H. –E. Jeberien, J. Chromatogr., 166 (1978)
349.
[50] G. DiPaola-Baranayi, Macromolecules, 15 (1982) 622.
[51] J. E. G. Lipson, J. E. Guillet, J. Coating Technol., 54 (1982) 90.
[52] M. Magat, J. Chem. Phys., 46 (1949) 344.
[53] W. Merk, R. N. Lichtenthaler, J. M. Prausnitz, J. Phys. Chem., 84 (1980)1694.
[54] H-M. Issel; “Thermodynamische und rheologische Steuerung der Materialeigenschaften
von Elastomersytemen durch trans-Poly(octenylen)“, PhD. Thesis, Universität Hannover
(1993).
[55] R. H. Schuster, H. M. Issel, V. Peterseim, Rubber Chem. Technol., 69 (1996) 769.
[56] M. Matsuo, C. Nozaki, Y. Jyo, Polym. Eng. Sci., 9 (1969) 197.
[57] J. E. Lewis , H. N. Mercer, M. L. Deviney, L. Hughes, J. E. Jewell, Rubber Chem.
Techno., 44 (1971) 855.
[58] J. Callan, W. Hess, C. Scott, Rubber Chem. Technol., 44 (1971) 814.
[59] J. D. Moore, Polymer, 12 (1971) 478.

Chapter 8. Literature 138
[60] H. Keskkula, P. A. Traylor, J. Appl. Polym. Sci., 11 (1967) 2361.
[61] M. Blume, C. Rosin, R. H. Schuster, 162nd ACS-Rubber Division Meeting Pittsburgh,
(Pennsylvania), Oct. 8th-11th, (2002).
[62] V. R. Landi, Rubber Chem. Technol., 45 (1972) 22.
[63] R. W. Seymour, S. L. Cooper, J. Polym. Sci. B, 9 (1971) 689.
[64] R. F. Boyer, Rubber Chem. Technol., 36 (1963) 1303.
[65] S. Krause, J. Polym. Sci. A, 3 (1965) 1631.
[66] M. T. Shaw, J. Appl. Polym. Sci., 18 (1974) 449.
[67] D. R. Paul, J. O. Altamirano, Adv. Chem. Ser., 142 (1975) 371.
[68] U. Eisele, “Introduction to Polymer Physics”, Springer, Berlin, (1990).
[69] K. Fujimoto, N. Yoshimiya, Rubber Chem. Technol., 41 (1968) 669.
[70] D. Feldman, M. Rusu, Eur. Polym., 10 (1974) 41.
[71] D. W. McCall, Acc. Chem. Res. 4 (1971) 223.
[72] K. Fujimoto, J. Soc. Rubber Ind. Jpn, 43 (1970) 54.
[73] D. G. Legrand, Trans. Soc. Rheol., 15 (1971) 541.
[74] C. Elmqvist, S. E. Svanson, Eur. Polym. J., 11 (1975) 789.
[75] C. S. P. Sung, N. S. Schneider, Macromolecules, 8 (1975) 68.
[76] J. K. Clark, R. A. Scott, Rubber Chem. Technol., 43 (1970) 1332.
[77] S. T. Wellinghoft, J. L. Koenig, E. Baer, Jr., J. Polym. Sci., Polym. Phys. Ed., 15 (1977)
1913.
[78] J. S. Higgins, “Polymer Blends and Mixtures”, Martinus Nijhoff, Dordrecht, (1985).
[79] C. T. Murray, J. W. Gilmer, R. S. Stein, Macromolecules, 18 (1985) 996.
[80] D. R. Buchanan, J. Polym. Sci. A, 9 (1971) 645.
[81] V. Peterseim; “Quantitative Betrachtung der Verträglichkeit von Kautschuken und
Untersuchungen zur Rußdistribution und –dispersion”, PhD. Thesis, Universität
Hannover (1995).
[82] R. H. Schuster, J. Meier and M. Klüppel; Kautschuk Gummi Kunststoffe; 11 (2000) 663.
[83] R. S. Raghava, R. W. Smith, J. Polym. Sci. B, 27 (1989) 2525.
[84] T. Reichmann, F. Sommer, T. M. Duc, Kautschuk Gummi Kunststoffe, 5 (2004) 252.
[85] R. H. Schuster, M. Müller, M. Klüppel and J. Ziegler, 159th Meeting of ACS-Rubber
Division, Providence, April (2001).
[86] G. R. Hamed, Rubber Chem. Technol., 54 (1981) 576.
[87] G.R. Dimeler, ACS-Rubber Division Ed. Symp., No. 9 (1982).
[88] J. Nieberle, G. Paulus, H. Queins, H. Schoeppl, Kautschuk Gummi Kunststoffe, 39
(1986) 108.
Chapter 8. Literature 139
[89] A. J. Tinker, A. B. Ahmad and D. W. Aubrey, Journal of Natural Rubber Research, 9 (1)
(1994) 1.
[90] A. M. Grazia, A. Sanguineti, Journal of Polymer Science, Part B: Polymer Physics, 42
(2004) 1987.
[91] T. G. Fox and P. J. Flory, J. Phys. Chem., 55 (1951) 221.
[92] J. Le Bras, Rubber Chem. Technol., 35 (1962) 1308.
[93] J. B. Class, S. G. Chu, J. Appl. Polym. Sci., 30 (1985) 805, 815, 825.
[94] P. J. Flory, J. Chem. Phys. 18 (1950) 108.
[95] Y. S. Lipatov, “Advanced in Polymer Science”, Springer, Berlin, 26 (1978) 63.
[96] G. Zachmann, “Kunststoff Handbuch”, vol.1, Carl Hanser, München, (1975).
[97] R. Simha, R. F. Boyer, J. Chem. Phys., 37 (1962) 1003.
[98] R. H. Schuster, H. M. Issel, H. Geisler, 160th ACS-Rubber Division Meeting Cleveland,
(OH), Oct. 16th-18th, (2001).
[99] H. Geisler, “Einfluß der Struktur niedermolekularer Komponenten auf physikalische
Eigenschaften von EPDM / Lösungsmittel – Systemen”, PhD. Thesis, Universität
Hannover, (1988).
[100] J. J. Aklonis e W. J. MacKnight; “Introduction to polymer viscoelasticity”, John Wiley &
Sons 2nd Ed. (1983).
[101] Ferry, J. D., “Viscoelastic Properties of Polymers”, 3rd ed. New York: Wiley (1980).
[102] F. Bueche, “Physical properties of polymers”, John Wiley & Sons, New York (1962).
[103] P. Hiemenz, Polymer Chemistry, Marcel Dekker, Inc., (1984).
[104] P. G. DeGennes, J. Chem. Phys., 55 (1971) 572.
[105] M. Doi and S. F. Edwards, J. Chem. Soc. Faraday Trans II, 74 (1978) 1789 .
[106] I. M. Ward, “Mechanical Properties of Solid Polymers“, New York, (1971).
[107] S. H. Wasserman and W. W. Graesley, J. Rheol. 36 (1992) 543.
[108] B. B. Boonstra and A. I. Medalia, Rubber Age, N.Y. 92 (1963) 892.
[109] J. Deiters, J. Weick, R. H. Schuster, M. L. Hallensleben, Platic Rubber and Composites,
(1993).
[110] A. J. Tinker, A. B. Ahmad and D. W. Aubrey, Journal of Natural Rubber Research 10 (1)
(1994) 1.
[111] J. Crank, “The Mathematics of Diffusion“, Clarendon Press, Oxford, (1956).
[112] L.G.F. Stuck, Journal of Polymer Science, 28 (1990) 127.
[113] R. E. Kesting and A.K. Fritzsche, “Polymeric gas separation membranes”, John Wiley,
New York, (1993).
[114] W. Beckmann, Kautschuk Gummi Kunststoffe, 4 (1991) 323.

Chapter 8. Literature 140
[115] J. M. Veranaud: "Liquid Transport Processes in polymeric Materials" Prentice Hall. New
York, (1991).
[116] G. Adam, J. Jung, C. Babilas, Kautschuk Gummi Kunststoffe 43 (1990) 1067.
[117] K. Beck, R. Kreiselmaier, V. Peterseim, E. Osen, Kautschuk Gummi Kunststoffe, 56
(2003) 657.
[118] California Environmental Protection Agency Press Release 98-69, 5th November (1998).
[119] M. Geier, W. Thiel, ATZ Automobiltechnische Zeitschrift, 98 (1996) 12.
[120] M. Nulma, A. Olejnik, M. Samuel, E. Fead, G. Rossi, Society of Automotive Engineers,
Technical series, no. 981360, (1998).
[121] K. Azaar, R. Grang, I. D. Rosca, J. M. Vernaud, Gummi Fasern Kunststoffe, 54 (2001),
236.
[122] J. Schaube, R. H. Schuster: Vortrag “Determination of Gas Permeability with New
Testing Methods”, International Rubber Conference Nürnberg 7/2003.
[123] J. Schaube, „Modeluntersuchungen zur Phasenanbindung in Polymerblends“, Ph.D.
Thesis, Universität Hannover (1993).
[124] J. L. Graham, R. C. Striebich, K. J. Myers, D. K. Minus, W. E. Harrison, Energy & Fuels,
20 (2006) 759.
[125] J. Bacha, F. Barnes, M. Franklin, L. Gibbs, G. Hemighaus, N. Hogue, D. Lesnini, J. Jind,
J. Maybury, J. Morris, Aviation Fuels Technical Review, Houston, (2000).
[126] C. Moses, P. Roets, Status Report on Semi-Synthetic Jet Fuel and the Development of
Syntethic Jet Fuel. Presented at CRC Alexandria, April 30, (2003).
[127] K. Beck, R. Kreiselmaier, V. Peterseim, E. Osen, Kautschuk Gummi Kunststoffe, 56
(2003) 657.
[128] J. M. Veranaud: "Liquid Transport Processes in polymeric Materials" Prentice Hall, New
York, (1991).
[129] G. P. Streit, M. Achenbach, Gummi Fasern Kunststoffe (GAK), 54 (2001), 816.
[130] K. Azaar, R. Grang, I. D. Rosca, J. M. Vernaud, Gummi Fasern Kunststoffe (GAK),
Jahrgang 54 ,4 (2001), 236.
[131] P. J. Flory, J. Rehner, J. Chem. Phys. 11 (1945) 52.
[132] K. Muniandy, E. Southern, A.G. Thomas, “Diffusion of liquids and solids in rubber”
(1978).
[133] G. J. Van Amerongen, Rubber Chem. Technol., 37 (1964) 1065.
[134] J. Crank, “The Mathematics of Diffusion”, 2nd ed., Clarendon Press, Oxford (1975).
[135] P. Meares, J. Polym. Sci., 27 (1958) 391.
[136] H. Fujita, A. Kishimoto, K. Matsumoto, Trans. Faraday Soc., 56 (1960) 424.
[137] A. Fick, Ann. Phys. Lpz., 170 (1855) 59.

Chapter 8. Literature 141
[138] DIN 53536, Bestimmung der Gasdurchlässigkeit.
[139] R. M. Barrer, “Diffusion in and through Solids”, Cambridge University Press, London,
(1951).
[140] S. Glasstone, K. J. Laidler, H. Eyring, “The Theory of Rate Process”, McGraw-Hill, New
York, (1941).
[141] R. M. Barrer, J. Phys. Chem., Wash., 61 (1957) 178.
[142] P Meares, J. Polym. Sci., 27 (1958) 391.
[143] H. Fujita, A. Kishimoto, K. Matsumoto, Trans. Faraday Soc., 56 (1960) 424.
[144] F. Bueche, J. Chem. Phys., 21 (1953) 1850.
[145] H. L. Frisch, J. Polym. Sci., 3 (1965) 13.
[146] A. T. DiBenedetto and D. R. Paul, J. Polym. Sci., A, 2 (1964) 1001.
[147] J. Crank, G. S.Park, “Diffusion in Polymers“, Academic Press, London, (1968).
[148] V. M. Shah, S. A. Stern, P. J. Ludovice, Macromoleules, 22 (1989) 4660.
[149] K. A. Mauritz, R. F. Storey, Macromolecules, 22 (1990) 2033.
[150] M. H. Cohen, D. Turnbull, J. Chem. Phys., 31 (1959) 1164.
[151] A. Aitken and R. M. Barrer, Trans. Faraday Soc., 51 (1955) 116.
[152] M. Sallem, A.F. A. Asfour and D. Dekee, J. Appl. Polym. Sci., 37 (1989) 617.
[153] G. A. Maria, A. Sanguineti, Journal of Polymer Science, 42 (2004) 1987.
[154] L. B. Georgoulis, J. Appl. Polym. Sci., 97 (2005) 775.
[155] G. J. Armerogen, Rubber Chem. Technol., 20 (1947) 494.
[156] G. J. Armerogen, Rubber Chem. Technol., 29 (1955) 821.
[157] I. Hidec, M. Jasso, M. Cernak, Kautschuk Gummi Kunststoffe ,10 (2005) 525.
[158] P. Chevallier, M. Castonguay, S. Turgeon, N. Dubrulle, D. Mantovani, P. H. McBreen, J.
C. Wittmann, G. Laroche, J. Chem. Phys., 105 (2001) 12490.
[159] R. Dahlmann, IKV – Berichte aus der Kunststoffverarbeitung, 124, Aachen, Mainz
Verlag, 124 (2002) 1.
[160] H. Eyring, J. Chem. Phys., 4 (1936) 283.
[161] H. S. Taylor, J. Chem. Phys., 6 (1938) 331.
[162] W. Sutherland, Philos. Mag., 9 (1905) 78.
[163] H. Eyring, R. H. Ewell, J. Chem. Phys., 5 (1937) 726.
[164] F. Eirich, R. Simha, J. Chem. Phys., 7 (1939) 116.
[165] W. Kauzmann, H. Eyring, J. Am. Chem. Soc., 62 (1940) 3113.
[166] J. G. Kirkwood, J. Polym. Sci., 12 (1954) 1.
[167] S. Glasstone, “Textbook of Physical Chemistry“, New York, (1940), 253.
[168] G. J. Van Amerongen, J. Appl. Phys. 17 (1946) 972.
[169] F. Bueche, J. Chem. Phys., 20 (1952) 1959.

Chapter 8. Literature 142
[170] A. N. Gent, L. Ginger, J. Polym. Sci, Part B: Polym. Phys., 29 (1991).
[171] T. Ito, K. Aizawa, J. Seta, Colloid Polym. Sci., 262 (1991) 1224.
[172] R. M. Barrer, Nature, Lond., 140 (1937) 106.
[173] G. J. Van Amerongen, J. Polym. Sci., 5 (1950) 307.
[174] A. D. Roberts, Natural Rubber Science and Technology, Oxford University Press (1988).
[175] A. Y. Coran, Rubber Chem. Technol., 68 (1995) 351.
[176] J. L. Koenig, Rubber Chem. Technol., 73 (2000) 385.
[177] J. B. Class, Processing at Meeting of the Rubber Division (1997).
[178] A. V. Chapman, M. Porter; “Sulphur Vulcanization Chemistry”, in: A. D. Roberts, “Natural
Rubber Science and Technology”, Oxford Science Publications, Oxford, (1988) 511.
[179] J. M. G. Cowie, “Chemie und Physik der synthetischen Polymeren“, Verlag Vieweg –
Wiesbaden, (1997).
[180] W. Gronski, U. Hoffmann, G. Simon, A. Wutzler, E. Straube, Rubber Chem. Technol., 63
(1992) 65.
[181] F. Grinberg, F. Grinberg, N, Nestle, W. Kuhn, J. Polym. Sci., 39 (2001) 2207.
[182] G. Simon, H. Schneider, K.-G. Haeusler, Prog. Colloid Polym. Sci., 78 (1988) 30.
[183] R. M. Barrer, Trans. Faraday Sco., 36 (1940) 644.
[184] A. Aitken, R. M. Barrer, Trans. Faraday. Soc., 51 (1955) 116.
[185] J. B. Donnet, R. C. Bansal, M. J. Wang, “Carbon Black Science and Technology”, Marcel
Dekker, New York, (1993) 289.
[186] G. Kraus, “Reinforcement of elastomers”, Wiley-Interscience, New York, (1965).
[187] R. H. Schuster; “Füllstoffe“, in W. Hofmann and H. Gupta “Handbuch der
Kautschuktechnologie”, Gupta Verlag, (2001) 1.
[188] H. M. Hess, P. C. Vegvari, R. A. Swor, Rubber Chem. Technol., 58 (1985) 350.
[189] M. P. Wagner, Rubber Chem. Technol., 49 (1976) 703.
[190] U. Görl, A. Hunsche, A. Müeller, H. G. Koban, Rubber Chem. Technol., 70 (1997) 608.
[191] J. Fröhlich, H. D. Luginsland, Rubber World, 28 (2001) 244.
[192] A. Einstein, Ann. Phys., 17, (1905), 549.
[193] A. Einstein, Ann. Phys., 34, (1911), 591.
[194] H. M. Smallwood, J. Appl. Phys., 15, (1944) 758.
[195] E. Guth and O. Gold, Phys. Rev., 53 (1938) 322.
[196] E. Guth, O. Gold, J. Appl. Phys., 16, (1945) 20.
[197] S. Wolff and J.-B. Donnet, Rubber Chem. Technol., 63 (1990) 32.
[198] M. J. Wang, S. Wolff, E. H. Tan, Rubber Chem. Technol., 66, (1993) 178.
[199] A. I. Medalia, J. Colloid Interface Sci., 24 (1967) 393.
[200] W. M. Hess, G. C. McDonald, E. Urban, Rubber Chem. Technol., 46, (1973) 204.
Chapter 8. Literature 143
[201] A. R. Payne, J. Polymer Sci., 6 (1962) 57.
[202] A. R. Payne, R. E. Wittaker, Rubber Chem. Technol., 44, (1971) 440.
[203] A. R. Payne, J. Polymer Sci., 7 (1963) 873.
[204] H. Ishida, Rubber Chem. Technol., 60 (1980) 497.
[205] R. H. Doremus, “Diffusion of reactive molecules in solids and metals“, A Wiley-
Interscience Publication, (2002).
[206] A. J. Tinker, Rubber Chem. Technol., 68 (1995) 461.
[207] J. B. Gardiner, Rubber Chem. Technol., 41 (1968) 1312.
[208] A. V. Chapman, A. J. Tinker, Kautschuk Gummi Kunststoffe, 56 (2003) 533.
[209] C. A. Gagliardi, L. B. Muire, D. E. Hirt, Ann. Techn. Conf. – Society of Plastic Engineers,
2 (1999) 2502.
[210] J. B. Gardiner, Rubber Chem. Technol., 42 (1968) 1058.
[211] M. E. Glicksman, “Diffusion in Solids”, John Wiley&Sons Inc., (2000).
[212] D. A. Lederer, K. E. Kear and G. H. Kuhls, Rubber Chem. Technol., 55 (1982) 1482.
[213] C. B. Skidmore, J. Polym. Sci., Part B: Polymer Physics, 42 (2004) 3258.
[214] K. Saalwächter, F. Kleinschmidt, Verhandl. Deutsch. Physikal. Gesellsch., 40 (2005)
120.
[215] J. L. Duda, J. S. Vrentas, S. T. Ju, H. T. Liu, AIChE J., 28 (1982) 279.
[216] J. Stastna, D. D. Kee, ”Transport Properties in Polymers”, Technomic, Lancaster, USA,
(1995).
[217] D. A. Edwards, D. S. Cohen, AIChE J., 41 (1995) 2345.
[218] C. F. Fong, Y. Li, D. D. Kee, J. Bovenkamp, Rubber Chem. Technol., 71 (1998) 285.
[219] M. Doi and S. F. Edwards, J. Chem. Soc. Faraday Trans. II, 74 (1978) 1789.
[220] J. Meier, M. Klüppel, R. H. Schuster and E. Giebeler, Kautsch. Gummi Kunstst., 56
(2003) 465.
[221] J. Guja, M. Bravar and J. Jelencic, Kautschuk Gummi Kunststoffe, 38 (1985) 28.
[222] A. B. Ahmad, D. W. Aubrey, A. J. Tinker, J. Nat. Rubb. Res., 9 (1994) 1.
[223] R. Schmidt, G. Pampus, R.H. Schuster, H. Abendroth, H. Umland, Kautschuk Gummi
Kunststoffe, 42 (1989) 582.
[224] R. Wommelsdorff, Kautschuk Gummi Kunststoffe, 41 (1988) 248.
[225] E. Southern, A. G. Thomas, Trans. Faraday Soc., 63 (1967) 1913.
[226] A. B. Ahmad, D. W. Aubrey, A. J. Tinker, J. Nat. Rubb. Res., 10 (1995) 1.
[227] A. Neppel, Rubber Chem. Technol., 59 (1986) 47.
[228] J. Auerbach, W. Miller, W. Kuryla, S. Gehman, J. Polym. Sci., 28 (1958) 129.
[229] I. Auerbach, S. D. Gehman, Rubber Chem. and Technol., 27 (1954) 772.
[230] G. Kraus, R.L. Collins, Rubber World, 139 (1958) 219.
Chapter 8. Literature 144
[231] E. Killmann, R. Eckart, Makrolol. Chem., 144 (1971) 45.
[232] S. George, K. Varughese, S. Thomas, Polymer, 41 (2000) 579.
[233] S. George, K. Ninan, G. Groeninckx, S. Thomas, J. Appl. Polym. Sci., 78 (2000) 280.
[234] A. E. Mathai, R. P. Singh, S. Thomas, J. Membr. Sci., 202 (2002) 35.
[235] N. Sombatsompop, K. Christodoulou, J. Polym. & Polym. Compos. 5 (1997) 377.
[236] T. Johnson, S. Thomas, J. Macromol. Sci., 36 (1997) 401.
[237] S. C. George, S. Thomas, Prog. Polym. Sci., 26 (2001) 985.
[238] A. Berens, H. Hopfenberg, J. Membr. Sci., 10 (1982) 283.
[239] H. J. Hübschmann, “Handbuch der GC/MS“, VCH publishing, New York, (1996).
[240] A. Wildberger, DIK Internal report (2006).
[241] H. Krump, M. Jasso, I. Hudec, M. Bafrnec, J. Sustek, L. Jurica, Kautschuk Gummi
Kunststoffe, 11 (2005) 557.
[242] ASTM D2000 Standard Classification.
[243] F. Ohm, “Introduction to the Structure and Properties of Rubber“, in Vanderbilt Rubber
Handbook, 13th Edition, (1990) 2.
[244] M. Morton, “Rubber Technology”, 3rd Edition, Van Nostrand Reinhold Company Inc.
(1987).
[245] B. G. Corman, Rubber Chem. and Technol., 44 (1971) 278.
[246] W. Steinhilper und St. Britz, Kautschuk Gummi Kunststoffe 46 (1993) 978.
[247] B. N. Dinzburg, R. W. Keller, R. Bond, Gummi Asbest Kunstsoffe, 8 (1988) 398.
[248] J. Brandrup, E. H. Immergut, E. A. Grulke, “Polymer Handbook“, Willey-Interscience
Publication, New York, 1999.
[249] P. Fernandez und S. Bowers: The Standard Fluoroelastomer for Automotive Fuel
Systems., Kautschuk Gummi Kunststoffe 52 (1999) 429.
[250] B. Dinzburg. Influence of Oil Aeration on Dynamic Rotary shaft seals Under Laboratory
and Field Conditions. SAE Paper Nr. 930535. SAE, Detroit (1993).
[251] A. Ismat Abu-Isa und H. E. Trexeler: Mechanism of Degradation of Fluorocarbon
Elastomers in Engine Oil. Rubber Chem. Technol. 58 (1985) 326.
[252] C. Debler, “Bestimmung und Vorhersage des Verschleißes für die Auslegung von
Dichtungen”, Ph.D Thesis, Universität Hannover, (2005).
[253] H. Bender, E. Campomizzi, Rubber Chem. and Technol., 1 (2001) 14.
[254] S. Bhattacharjee, A. K. Bhowmick, B. N. Avasthi, Polymer Degradation and Stability, 31
(1991) 71.
[255] K. C. Smith, B. S. Tripathy, Rubber World, 217 (1998) 28.
[256] G. Ivan, M. Giurginca, S. Basuc, Revue Roumanine de Chemie, 43 (1998) 231.

Chapter 8. Literature 145
[259] T. L. A. C. Rocha, "Influência da Modificação Química de Polidienos sobre suas
Propriedades Finais", Ph.D. Thesis, University Federal of Rio Grande do Sul.

Chapter 8. Literature 146
Curriculum vitae
Personal data:
Name: Rosca
First name: Cristina
Date of birthday: 26.04.1976
Place of birthday: Avrig, Romania
Status: Single
Nationality: Romanian
Educational background:
09/1990-06/1994 High school in Sibiu, Romania School-leaving examination. Focus area: Chemistry, Biology, English
10/1994-07/1999 Study of Chemical Engineering (Dipl.-Chem. Ing.) at University Politehnica Timisoara, Romania
10/1999-07/2000 Advanced course of Rubber Technology at University Politehnica Timisoara, Romania, with practical work in Deutschen Institut für Kautschuktechnologie e.V., Hannover
Work experience:
11/2000-03/2002 Responsible for the environmental protection department at Continental Automotive Products SRL Timisoara, Romania
05/2002-04/2006 Dissertation study at University of Hannover, Institute for
inorganic chemistry. The experimental work was done in
Deutsches Institut für Kautschuktechnologie e.V. in Hannover,
based on research projects financed by the industry.
05/2006-till today Chemist at Rhein Chemie Rheinau GmbH in Applications
Technology/Rubber Division/ Automotive Department.
Hannover, 08.10.2007
Cristina Rosca