quantitative impurity profiling by principal component analysis of high-performance liquid...
TRANSCRIPT

Journal of Chromatography A, 1108 (2006) 50–67
Quantitative impurity profiling by principal component analysis ofhigh-performance liquid chromatography–diode
array detection data
Kent Wiberg∗AstraZeneca R&D Sodertalje, Analytical Development, SE-151 85 Sodertalje, Sweden
Received 12 April 2005; received in revised form 21 December 2005; accepted 27 December 2005Available online 20 January 2006
Abstract
Related organic impurities generally have approximately similar molar absorption coefficients (ε) due to their structural similarities. On theassumption that all peaks in an impurity profiling chromatogram have approximately the same maximum molar absorption coefficients (εmax) andthe chromatogram contains one major peak and several much smaller ones, all of which are completely separated, integration of the summeds detection( re of PCA,t e secondP ible to takea purities thana results arep ling. Ther rents values. Ther approach toi ks withoutk©
K
1
difittalo
ster”ceu-areanic
texthro-aim
com-alsonter-ritiesbycon-the
0d
core vectors from the principal component analysis (PCA) decomposition of high-performance liquid chromatography–diode arrayHPLC–DAD) data will give areas that are quantitatively proportional to the actual content of the compounds. Due to the sequential natuhe first principal component (PC) will primarily be related to the main compound and all peaks showing a similar spectrum, while thC will be related to the impurities with a spectrum different from the main peak. Summing the two score vectors thus makes it possccount of different spectra in the score chromatogram, which make the method proposed give better quantitative estimates of the imny single wavelength chromatogram. Multivariate curve resolution alternating least squares (MCR-ALS) is used for comparison. Theresented for two examples of simulated HPLC–DAD data as well as for three examples of real HPLC–DAD data from impurity profiesults show that integration of the score chromatograms can handle differences in the unknownεmax of the peaks and take account of the diffepectra of the impurity peaks, giving quantitative estimates of the content of the impurities that closely correspond to the referenceesults obtained are also better than integration with the best possible separate wavelength. The method could be a straightforwardmpurity profiling in order to obtain a good estimate of the content or relative response factors of small chromatographic impurity peanowledge of their molar absorption coefficients and without any precalibration.2006 Elsevier B.V. All rights reserved.
eywords: Quantitative impurity profiling; Related organic impurities; HPLC–DAD; PCA; MCR-ALS
. Introduction
An impurity profile is defined in the ICH Guidelines as “aescription of the identified and unidentified impurities present
n a medicinal product”[1]. Gorog has described impurity pro-ling as “the common name of analytical activities aimed athe detection, identification/structure elucidation and quantita-ive determination of related organic and inorganic impuritiesnd residual solvents in bulk drugs and pharmaceutical formu-
ations” [2]. Impurity profiling has recently been identified asne of the bottlenecks to be tackled in the course of reaching the
∗ Tel.: +46 8 553 247 97; fax: +46 8 553 259 84.E-mail address: [email protected].
goal summarized by the slogan “New Safe Medicines Fa[3] and is therefore of the utmost importance in the pharmatical industry. Other synonyms of organic impurity profilinganalysis of chromatographic purity or analysis of related orgsubstances.
The most commonly used analytical methods in this conare separation techniques like high-performance liquid cmatography (HPLC) or capillary electrophoresis (CE), theof the analysis being to separate impurities from the mainponent and then, if possible, to identify and ultimatelyquantify them. These impurities may consist of synthesis imediates, degradation products, packaging-related impuetc. Generally, an impurity profiling analysis is conductedmeans of detection at a single wavelength, and usually thetent of the main component is much larger than that of
021-9673/$ – see front matter © 2006 Elsevier B.V. All rights reserved.oi:10.1016/j.chroma.2005.12.077

K. Wiberg / J. Chromatogr. A 1108 (2006) 50–67 51
impurities. As a rule, standards of all impurities are generallyneeded for the quantification, and if this is not the case, the quan-tity of the impurities is expressed as the main component[3].This usually involves calculating peak areas relative to the maincompound, assuming that the relative detector response for theimpurities is the same as for the main compound[4]. Conse-quently, in the resulting chromatogram or electropherogram ofthe analysis, the relative ratios of the area of each peak are com-pared with the area of the major peak (or the summed area ofall integrated peaks), i.e. 100× (areaimpurity/areamain peak). Thearea% values thus obtained are then used as relative measuresof the content of the impurities.
The size of a particular peak in a chromatogram at a specificwavelength depends on the concentration and molar absorptioncoefficient according to the Beer–Lambert law:
A = εcl (1)
whereA is the absorbance;ε, the molar absorption coefficient;c, the concentration andl, the absorption path length. In the last10–15 years the detection employed in HPLC has changed fromsingle wavelength detection to multiple wavelength detectionthrough the use of diode array detection (DAD). Since the pathlength is generally constant in HPLC–DAD, the peak sizes in achromatogram are controlled by the concentration and the molarabsorption coefficients according to the Beer–Lambert law. Ina onale y leve ccurt teriss asc avel undc tw d fot ndeot of ac eforb o bes hicht lengc rativH hicht e.gc
rin-c uidc crib[ tionr PCd ouldb
om-p tivec gradt rally
have molar absorption coefficients in the same range due to themolecular similarities. This paper shows how PCA can be usedin order to decompose HPLC–DAD data from analysis of relatedorganic impurity profiling and from the first two principal com-ponents (PCs) calculate on the basis of the score vectors obtaineda ‘score chromatogram’. This score chromatogram to a largeextent takes account of the different spectra in the HPLC–DADdata since the first PC will be related to the main peak and allpeaks that have a similar spectrum, while the second PC willexplain impurity peaks with different spectra. On the assump-tion that the maximum molar absorption coefficients,εmax, inthe spectra of the peaks in the chromatogram are approximatelythe same and that the chromatogram analysed contains onemajor peak and several much smaller peaks, all of which arecompletely separated, a calculation of the relative area ratios,i.e. 100× (areaimpurity/areamain peak), in this score chromatogramgives a ratio that is directly proportional to the actual content ofthe compounds. Comparisons are made with multivariate curveresolution alternating least squares (MCR-ALS).
The method proposed could serve as a new approach to quan-titative impurity profiling, giving better estimates of the contentof the impurities in a chromatogram than using a single wave-length. The method can be applied without any precalibrationor knowledge of the molar absorption coefficients.
2. Theory
pu-r ibedi tt‘
2
f thed les( ationa ence,t t, butr n asl
ame,n ondst ths, iti riable,a tof cribea sion(a tentv spec-t ner-a d thea bothm d theq
UV spectrum of a compound, the vibrational and rotatinergy levels are superimposed on the electronic energls and, since many transitions with different energy can o
he bands are broadened. This is the cause of the charachape of the UV spectrum of a particular compound and,onsequence, the molar absorption coefficients vary with wength. In fact, the shape of the UV spectrum of a compoan be seen as a consequence of differentε values at differenavelengths. As a result, different peak sizes are obtaine
he same compound at different wavelengths and serious ur overestimates of the impurities may thus occur[3]. In order
o correctly determine the true content of the impuritieshromatogram, the molar absorption coefficients must there known. This generally means that all impurities have tynthesized and purified in order to obtain standards from whe response factor of each compound at the chosen wavean be determined. A possible alternative is to use prepaPLC for this issue or to apply another type of detector in w
he response is directly proportional to the molar content,hemiluminescent nitrogen-specific HPLC detectors[5].
Previously, a method for peak purity determination with pipal component analysis (PCA) of high-performance liqhromatography–diode array detection data has been des6]. It was shown how examination of the relative observaesiduals (spectral residuals), scores and loadings from theecomposition of DAD data over a chromatographic peak ce used to determine peak purity.
Related organic impurities of an active pharmaceutical cound generally show structural similarities with the acompound since they are synthesis intermediates and deion products. Structurally related organic molecules gene
-,tica-
rr-
e
the
.
ed
A
a-
In this study, two chemometric methods of quantitative imity profiling are tested, PCA and MCR-ALS and are descrn the following two sections. Bold capital italics (X) represenwo-way matrices, and bold lower-case italics (t) vectors androw vectors.
.1. PCA approach
Spectroscopic data generally suffer from the problem oata beingcollinear (non orthogonal), i.e. the spectral variabwavelengths) contain to a great extent the same informnd there is a high correlation between the variables. H
he collinear spectral variables are not linearly independenather linearly dependent and the variables can be writteinear combinations of the other variables[7].
When all spectral variables (wavelengths) express the samely that a relative change in the concentration corresp
o the same relative change in absorbance at all wavelengs then possible to express all wavelengths as one latent vascore vector. By combining the collinear spectral variables
orm one latent variable, it is thus possible to accurately desll the systematic information. Principal component regresPCR) [7–9] and partial least squares regression (PLS)[7,8]re two methods for multivariate calibration that utilize laariables (scores and loadings) for regression of collinearroscopic data. In multivariate calibration, the data are gelly arranged with the spectra of the samples in rows anbsorbance at different wavelengths in columns, and inethods the quantitative information lies in the scores anualitative information in the loadings.
52 K. Wiberg / J. Chromatogr. A 1108 (2006) 50–67
PCR can be described as first performing PCA on the datamatrix and then multiple linear regression (MLR) using the scorevectors (ta) obtained from PCA asx variables and regressingthem against the dependenty variables[7]. The quantitativeinformation from the spectra are thus first captured in the scoresand then regressed against the concentration of the calibrationsamples (y). Since the concentration of the calibration samplesis known, the molar absorption coefficients are built into thecalibration model in the regression coefficients. This makes itpossible to accurately predict the content of new unknown sam-ples from their spectra.
Principal components are orthogonal (linearly independent),which means that the problem with collinear data is solved. Gen-erally, in PCR and PLS, as many latent variables are used asthere are chemical compounds. For a two-compound calibra-tion model, two principal components (PCs) are needed and thesystematic variation is thus described with two linear connec-tions on account of the additive nature of the response of eachcompound.
PCA is a well-known chemometric method for the decom-position of two-way matrices[7,8,10,11]. The variance in thedata matrixX is decomposed by successively estimating PCsthat capture the variance in the data in scores (t) and loadings(p). Each calculated PC consists of a score vector and a loadingvector. The score vector is related to the observations in the datamatrixX and the loading vector is related to the variables. Whent vari-a
X
A e cal-c cen al tot inedv
X
A CAt Thisc twos solut ctiono coc olaa , 0.10t s wibtP sulti ft give1 tio ot anti-t thes iabl
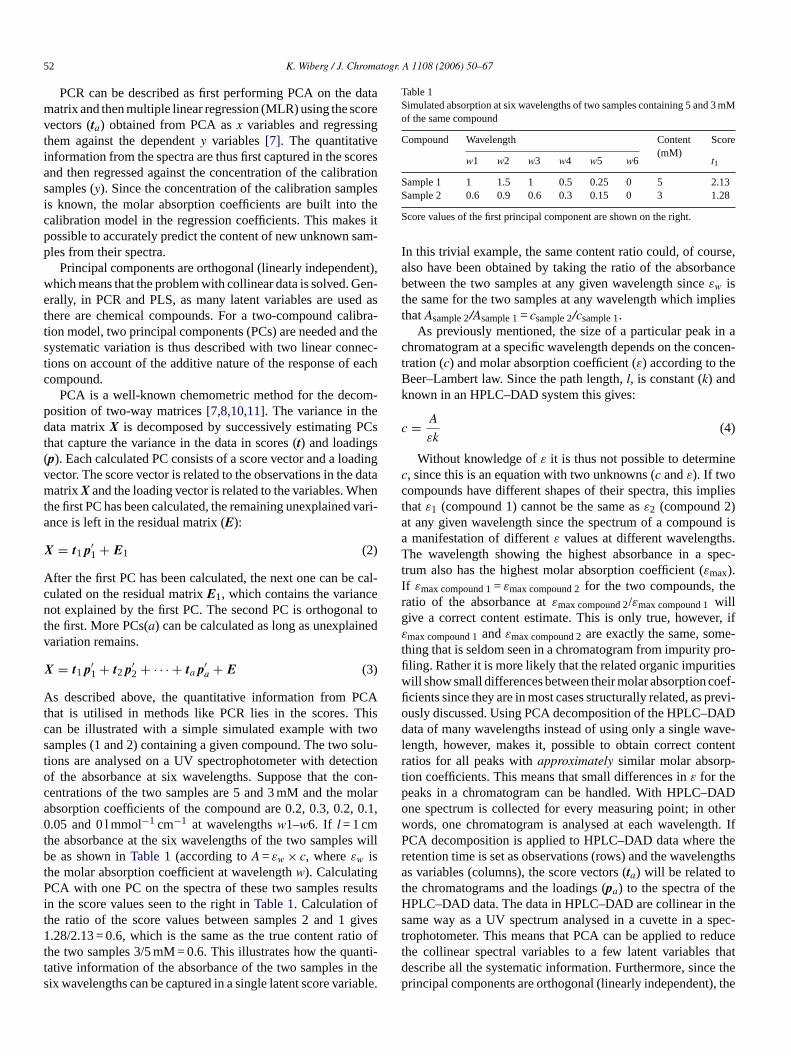
Table 1Simulated absorption at six wavelengths of two samples containing 5 and 3 mMof the same compound
Compound Wavelength Content(mM)
Score
w1 w2 w3 w4 w5 w6 t1
Sample 1 1 1.5 1 0.5 0.25 0 5 2.13Sample 2 0.6 0.9 0.6 0.3 0.15 0 3 1.28
Score values of the first principal component are shown on the right.
In this trivial example, the same content ratio could, of course,also have been obtained by taking the ratio of the absorbancebetween the two samples at any given wavelength sinceεw isthe same for the two samples at any wavelength which impliesthatAsample 2/Asample 1= csample 2/csample 1.
As previously mentioned, the size of a particular peak in achromatogram at a specific wavelength depends on the concen-tration (c) and molar absorption coefficient (ε) according to theBeer–Lambert law. Since the path length,l, is constant (k) andknown in an HPLC–DAD system this gives:
c = A
εk(4)
Without knowledge ofε it is thus not possible to determinec, since this is an equation with two unknowns (c andε). If twocompounds have different shapes of their spectra, this impliesthat ε1 (compound 1) cannot be the same asε2 (compound 2)at any given wavelength since the spectrum of a compound isa manifestation of differentε values at different wavelengths.The wavelength showing the highest absorbance in a spec-trum also has the highest molar absorption coefficient (εmax).If εmax compound 1= εmax compound 2for the two compounds, theratio of the absorbance atεmax compound 2/εmax compound 1willgive a correct content estimate. This is only true, however, ifεmax compound 1andεmax compound 2are exactly the same, some-thing that is seldom seen in a chromatogram from impurity pro-fi tiesw oef-fi previ-o ADd ave-l ntentr -tp ADo therw th. IfP ther ngthsat eH thes spec-t ducet thatd e thep ), the
he first PC has been calculated, the remaining unexplainednce is left in the residual matrix (E):
= t1p′1 + E1 (2)
fter the first PC has been calculated, the next one can bulated on the residual matrixE1, which contains the varianot explained by the first PC. The second PC is orthogon
he first. More PCs(a) can be calculated as long as unexplaariation remains.
= t1p′1 + t2p
′2 + · · · + tap
′a + E (3)
s described above, the quantitative information from Phat is utilised in methods like PCR lies in the scores.an be illustrated with a simple simulated example withamples (1 and 2) containing a given compound. The twoions are analysed on a UV spectrophotometer with detef the absorbance at six wavelengths. Suppose that theentrations of the two samples are 5 and 3 mM and the mbsorption coefficients of the compound are 0.2, 0.3, 0.2.05 and 0 l mmol−1 cm−1 at wavelengthsw1–w6. If l = 1 cm
he absorbance at the six wavelengths of the two samplee as shown inTable 1(according toA = εw × c, whereεw is
he molar absorption coefficient at wavelengthw). CalculatingCA with one PC on the spectra of these two samples re
n the score values seen to the right inTable 1. Calculation ohe ratio of the score values between samples 2 and 1.28/2.13 = 0.6, which is the same as the true content ra
he two samples 3/5 mM = 0.6. This illustrates how the quative information of the absorbance of the two samples inix wavelengths can be captured in a single latent score var
-
n-r,
ll
s
sf
e.
ling. Rather it is more likely that the related organic impuriill show small differences between their molar absorption ccients since they are in most cases structurally related, asusly discussed. Using PCA decomposition of the HPLC–Data of many wavelengths instead of using only a single w
ength, however, makes it, possible to obtain correct coatios for all peaks withapproximately similar molar absorpion coefficients. This means that small differences inε for theeaks in a chromatogram can be handled. With HPLC–Dne spectrum is collected for every measuring point; in oords, one chromatogram is analysed at each wavelengCA decomposition is applied to HPLC–DAD data where
etention time is set as observations (rows) and the waveles variables (columns), the score vectors (ta) will be related to
he chromatograms and the loadings (pa) to the spectra of thPLC–DAD data. The data in HPLC–DAD are collinear iname way as a UV spectrum analysed in a cuvette in arophotometer. This means that PCA can be applied to rehe collinear spectral variables to a few latent variablesescribe all the systematic information. Furthermore, sincrincipal components are orthogonal (linearly independent

K. Wiberg / J. Chromatogr. A 1108 (2006) 50–67 53
scores will contain quantitative information in the same way asin PCR, and this fact can be utilised for impurity profiling. On theassumption thatε is approximately the same at the absorbancemaximum in the spectra of the peaks in a chromatogram, itis possible to obtain quantitative estimates by integration ofa score chromatogram obtained with PCA decomposition ofHPLC–DAD data. The general assumption in the method pro-posed, therefore, is that the highest values ofε, although beingunknown, are approximately the same for all compounds in thechromatogram, i.e. the highest molar absorption coefficients,εmax (at the wavelength of each compound giving the highestabsorbance), are approximately the same. The explanation forthis assumption is that the PCA decomposition is made withoutany knowledge ofε and the highest absorbance values of eachpeak in the HPLC–DAD data will also have the largest influ-ence in the PCA decomposition. PCA is a maximum variancemethod that captures the variance in a data matrix in PCs in asequential manner, meaning that it successively estimates PCs,always looking for the largest variance left in the data matrixanalysed. The first PC will describe the largest variation in thedata and the second PC the second largest variation left in theinitial data matrix when the largest variation (PC1) has beensubtracted from it (E1 = X–t1p′
1).Since the largest variance (absorbance) in HPLC–DAD data
is seen around theεmax of each peak, this absorbance will havethe largest influence on the score chromatograms and conse-q howe h)s liedt tivea s, tha lyt po-n eaksi ctormc samε tioso nd,s nlesε usew
2
lemo ith ac tablep cann rnali andt l profi canb onalf ity,w andc thod
for multivariate curve resolution has been developed[14]. Byutilising information on the number of compounds, their reten-tion time windows and constraints such as the non-negativityconstraint, MCR-ALS makes it possible by means of a proce-dure of alternating and constrained least squares optimisation toestimate iteratively pure spectra and chromatograms. The aimof MCR-ALS is to extract the number of compounds, the con-centration profiles and pure component spectra of an analyticalsignal with as few assumptions as possible. From the raw datamatrix (X), the concentration profiles (C) and pure componentspectra matrix (S) are determined, together with a residual matrix(E) containing the variation not explained byC andS:
X = CS + E (5)
Generally, MCR-ALS needs an initial guess of the number ofcompounds present, together with an initial estimate of eitherC or S, and this is information that can be gained by methodslike evolving factor analysis (EFA)[15]. In addition to the initialguess, the results obtained depend on the constraints applied. InHPLC useful constraints are non-negativity of chromatogramsand spectra. The details of MCR-ALS have been thoroughlydescribed elsewhere[14].
It should be noted that there are generally ambiguities inthe concentration profile of both the PCA method proposedand MCR-ALS since neither of the methods can give exactc eingp n thism e am chro-m
2
s fori e-l ed int ata( atao wave-l ,t milarε ectraa differ( 20%d
intsa peak,t houta onem mM,r idedb atai inorp ave-l sixw
uently also on the area ratios. The PCA decomposition,ver, cannot determine theεmax (or ε at any other wavelengtince it is a maximum variance decomposition merely appo the HPLC–DAD data. Therefore, in order to give quantitarea ratios from the integration of the score chromatogramssumption must be made that theεmaxvalues are approximate
he same for all peaks analysed. Different principal coments will be related to different types of spectra of the p
n the chromatogram, for which reason adding the score veakes it possible to take account ofdifferent spectra in the score
hromatogram. On the assumption of approximately themax, this makes it possible to obtain quantitative area raf impurities with spectra different from the main compouomething that not is possible using a single wavelength (uis exactly the same or known for both compounds at theavelengths).
.2. MCR-ALS approach
When using PCA, it is important to be aware of the probf rotational freedom. The application of PCA to matrices whemical rank larger than one does not give directly interprerofiles like chromatograms or spectra since pure profilesot be found in spectral bilinear decomposition without exte
nformation. The scores and loadings are orthogonal in PCAherefore become linear combinations of the true analyticales. This implies that the sign of the score and loadingse changed without changing the fit of the model (rotati
reedom)[12,13]. As a consequence of the rotational ambiguhich implies that PCA cannot obtain pure profiles (spectrahromatograms) of unresolved chromatographic peaks, me
-
e
s
e
sd
-
-
s
oncentration estimations without any calibration sample bresent. Both methods, however, as shown in the results ianuscript, are useful in impurity profiling since they givore accurate answer than using any single wavelengthatogram.
.3. Simulated HPLC–DAD data
The results of using the two chemometric approachempurity profiling on the HPLC–DAD data of many wavengths compared to single wavelength detection is illustrathe following two examples using simulated HPLC–DAD dFigs. 1 and 2). Each example contains the HPLC–DAD df two separated compounds and their absorbance at six
engths (as in the example shown inTable 1). In the first examplehe two compounds have similarly shaped spectra and sivalues, while in the second example the shape of the spnd consequently also the molar absorption coefficientsthe εmax values are approximately the same, with aboutifference).
For reasons of simplicity, only five spectra at five time pore shown with zero absorbance before and after each
he two chromatographic peaks thus being illustrated witny band broadening. Each HPLC data matrix containsajor and one minor peak with concentrations of 5 and 2
espectively. The correct content ratio of compound 2 divy compound 1 is thus 2/5 mM = 0.4. The HPLC–DAD d
s shown together with ratio calculations (absorbance of meak divided by absorbance of major peak) at separate w
engths and also with molar absorption coefficients at theavelengths.

54 K. Wiberg / J. Chromatogr. A 1108 (2006) 50–67
Fig. 1. Simulated UV spectra and HPLC–DAD file of two compounds withsimilar spectra andε: (a) spectrum of compound 1; (b) spectrum of compound 2; (c)HPLC–DAD file with the absorbance at six wavelengths and five time points, absorbance ratios (compound 2/1) at all wavelengths andε for compounds 1 and 2 atwavelengthsw1–w6.
Fig. 1shows the spectra and simulated HPLC–DAD data ofthe first example withsimilar spectra andε of the two com-pounds. The absorbance ratios (compound 2/1) as well as theε values for the two compounds are shown at each wavelength.As can be seen, all the absorbance ratios at single wavelengthsgive the correct content ratio, as would have been expected,
sinceAcompound 2/Acompound 1= ccompound 2/ccompoumd 1as in theexample shown inTable 1.
Fig. 2shows spectra and simulated HPLC–DAD data of thesecond example withdifferent spectra andε value for the twocompounds. The absorbance ratios (compound 2/1) as well as theε values of the two compounds are shown at each wavelength. As
F hferent ; (c)H ints, atw
ig. 2. Simulated UV spectra and HPLC–DAD file of two compounds witdifPLC–DAD file with the absorbance at six wavelengths and five time poavelengthsw1–w6.
spectra andε: (a) spectrum of compound 1; (b) spectrum of compound 2absorbance ratios (compound 2/1) at all wavelengths andε for compound 1 and 2

K. Wiberg / J. Chromatogr. A 1108 (2006) 50–67 55
can be seen, none of the absorbance ratios at single wavelengthsgive correct content ratios sinceε1 �= ε2 at all single wavelengths.Furthermore, the absorbance ratio atεmax (at w2 for compound1 andw4 for compound 2) is 0.5/1.5 = 0.3, which is also incor-rect (correct content ratio, 2/5 mM = 0.4). This illustrates thatfor two compounds with different spectra and a small differencein εmax (0.3 for compound 1 atw2 and 0.25 for compound 2 atw5) single wavelength detection cannot give a correct contentratio.
2.4. PCA results on simulated data
In Figs. 3 and 4, the results of applying PCA to the simulatedHPLC–DAD data are shown.
Fig. 3 shows the results of applying PCA to the first exam-ple of simulated HPLC–DAD data (with similar spectra andε
values). As can be seen,t1 (Fig. 3a) resembles a chromatogramwith two peaks andp1 (Fig. 3b) resembles the spectra of the twocompounds. The second score vectort2 (Fig. 3c) has very lowvalues since all the variation is described by the first PC, whilep2 shows a shape similar top1. The score values are shown inthe table inFig. 3e, and as can be seen, the score chromatogram(t1 + t2) gives a score ratio of compound 2/1 that correspondswith the true content.
Fig. 4shows the results of applying PCA to the second exam-ple of simulated HPLC–DAD data with different spectra andε
values. As can be seen,t1 (Fig. 4a) resembles a chromatogramwith two peaks. The peak of the second compound is, however,smaller compared tot1 in the first example (Fig. 3) since thefirst principal component inFig. 4is more related to compound1, something that can also be seen inp1 (Fig. 4b, a shape sim-ilar to the spectrum of compound 1). The second score vectort2 (Fig. 4c) shows no peak for compound 1 (since it has alreadybeen described by the first PC), although a peak of compound2 is, however, present. The corresponding loading,p2 (Fig. 4d)shows that the second PC clearly is related to compound 2 witha peak inp2 at w4. The score values are shown in the table inFig. 4e, and as can be seen, the score chromatogram (t1 + t2) alsoin this example gives a score ratio of compound 2/1 that corre-sponds with the true content (0.4). This illustrates that applyingPCA to the simulated HPLC–DAD data with two compoundswith different spectra but approximately the sameεmaxgives thetrue content ratio, something that not is possible to obtain usinga single wavelength.
It should be noted that the correctness of the score ratiosobtained with the PCA approach is dependent on the fact thatthe spectrum of the minor peak shows absorbance at all or atleast some of the wavelengths at which the major peak absorbs
Fl
ig. 3. Scores and loadings of the PCA decomposition of the HPLC–DAD daFoading (p2); (e) scorest1, t2 andt1 + t2 together with the ratio of compound 2/1.
ta inig. 1 (similar spectra andε): (a) score (t1); (b) loading (p1); (c) score (t2); (d)
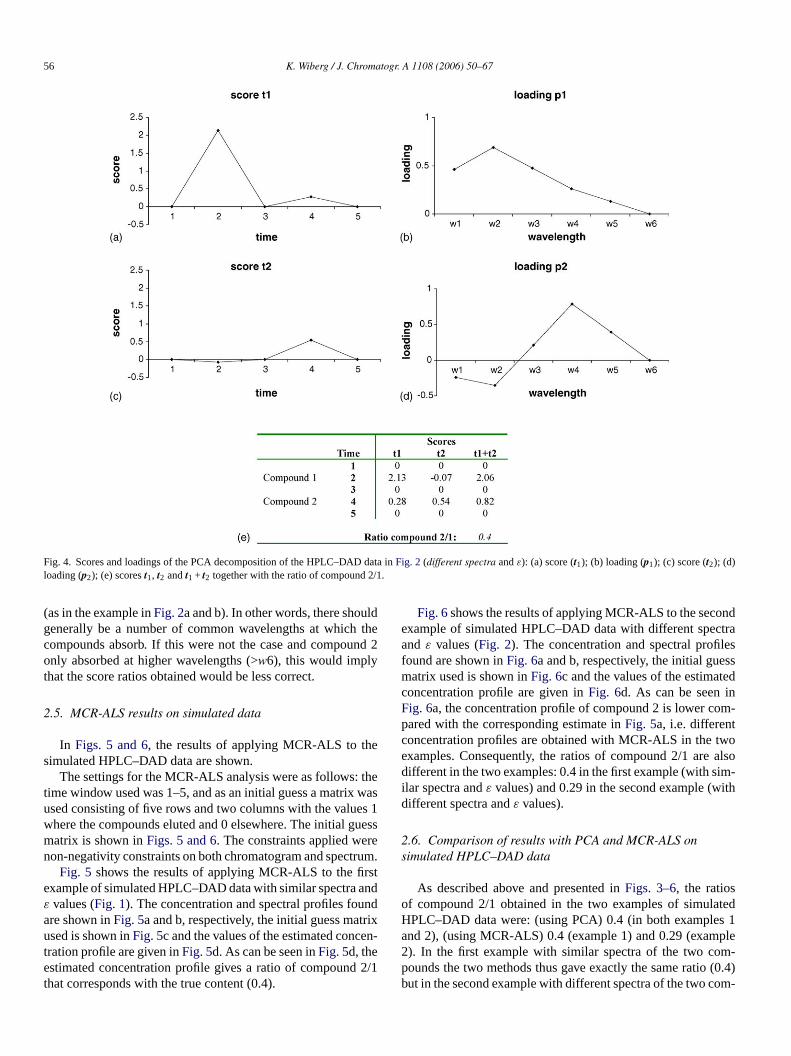
56 K. Wiberg / J. Chromatogr. A 1108 (2006) 50–67
Fig. 4. Scores and loadings of the PCA decomposition of the HPLC–DAD data inFig. 2 (different spectra andε): (a) score (t1); (b) loading (p1); (c) score (t2); (d)loading (p2); (e) scorest1, t2 andt1 + t2 together with the ratio of compound 2/1.
(as in the example inFig. 2a and b). In other words, there shouldgenerally be a number of common wavelengths at which thecompounds absorb. If this were not the case and compound 2only absorbed at higher wavelengths (>w6), this would implythat the score ratios obtained would be less correct.
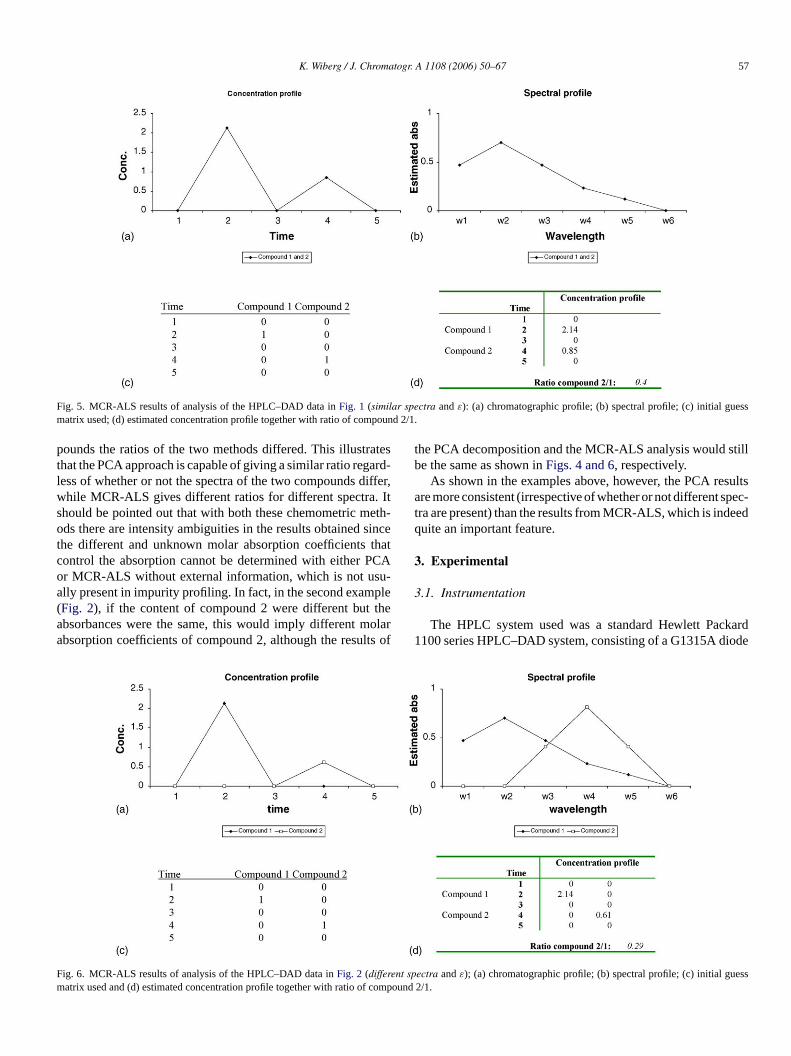
2.5. MCR-ALS results on simulated data
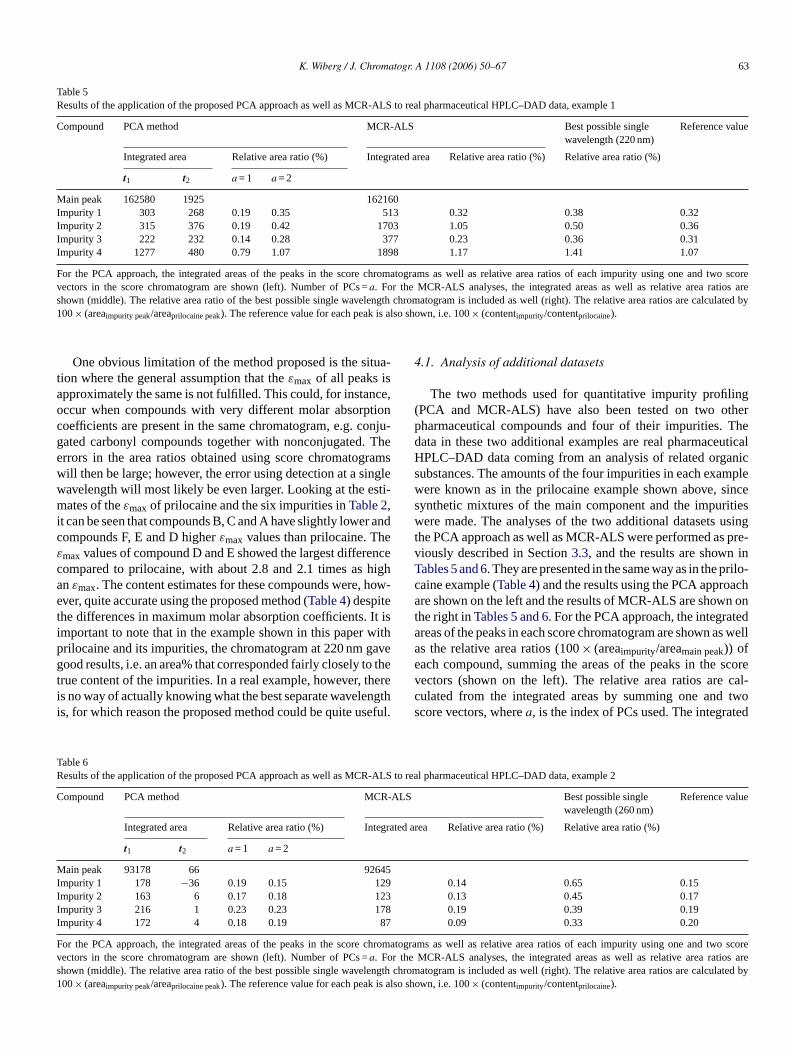
In Figs. 5 and 6, the results of applying MCR-ALS to thesimulated HPLC–DAD data are shown.
The settings for the MCR-ALS analysis were as follows: thetime window used was 1–5, and as an initial guess a matrix wasused consisting of five rows and two columns with the values 1where the compounds eluted and 0 elsewhere. The initial guessmatrix is shown inFigs. 5 and 6. The constraints applied werenon-negativity constraints on both chromatogram and spectrum.
Fig. 5 shows the results of applying MCR-ALS to the firstexample of simulated HPLC–DAD data with similar spectra andε values (Fig. 1). The concentration and spectral profiles foundare shown inFig. 5a and b, respectively, the initial guess matrixused is shown inFig. 5c and the values of the estimated concen-tration profile are given inFig. 5d. As can be seen inFig. 5d, theestimated concentration profile gives a ratio of compound 2/1that corresponds with the true content (0.4).
Fig. 6shows the results of applying MCR-ALS to the secondexample of simulated HPLC–DAD data with different spectraandε values (Fig. 2). The concentration and spectral profilesfound are shown inFig. 6a and b, respectively, the initial guessmatrix used is shown inFig. 6c and the values of the estimatedconcentration profile are given inFig. 6d. As can be seen inFig. 6a, the concentration profile of compound 2 is lower com-pared with the corresponding estimate inFig. 5a, i.e. differentconcentration profiles are obtained with MCR-ALS in the twoexamples. Consequently, the ratios of compound 2/1 are alsodifferent in the two examples: 0.4 in the first example (with sim-ilar spectra andε values) and 0.29 in the second example (withdifferent spectra andε values).
2.6. Comparison of results with PCA and MCR-ALS onsimulated HPLC–DAD data
As described above and presented inFigs. 3–6, the ratiosof compound 2/1 obtained in the two examples of simulatedHPLC–DAD data were: (using PCA) 0.4 (in both examples 1and 2), (using MCR-ALS) 0.4 (example 1) and 0.29 (example2). In the first example with similar spectra of the two com-pounds the two methods thus gave exactly the same ratio (0.4)but in the second example with different spectra of the two com-
K. Wiberg / J. Chromatogr. A 1108 (2006) 50–67 57
Fig. 5. MCR-ALS results of analysis of the HPLC–DAD data inFig. 1 (similar spectra andε): (a) chromatographic profile; (b) spectral profile; (c) initial guessmatrix used; (d) estimated concentration profile together with ratio of compound 2/1.
pounds the ratios of the two methods differed. This illustratesthat the PCA approach is capable of giving a similar ratio regard-less of whether or not the spectra of the two compounds differ,while MCR-ALS gives different ratios for different spectra. Itshould be pointed out that with both these chemometric meth-ods there are intensity ambiguities in the results obtained sincethe different and unknown molar absorption coefficients thatcontrol the absorption cannot be determined with either PCAor MCR-ALS without external information, which is not usu-ally present in impurity profiling. In fact, in the second example(Fig. 2), if the content of compound 2 were different but theabsorbances were the same, this would imply different molarabsorption coefficients of compound 2, although the results of
the PCA decomposition and the MCR-ALS analysis would stillbe the same as shown inFigs. 4 and 6, respectively.
As shown in the examples above, however, the PCA resultsare more consistent (irrespective of whether or not different spec-tra are present) than the results from MCR-ALS, which is indeedquite an important feature.
3. Experimental
3.1. Instrumentation
The HPLC system used was a standard Hewlett Packard1100 series HPLC–DAD system, consisting of a G1315A diode
F nt sp essm comp
ig. 6. MCR-ALS results of analysis of the HPLC–DAD data inFig. 2 (differeatrix used and (d) estimated concentration profile together with ratio of
ectra andε); (a) chromatographic profile; (b) spectral profile; (c) initial guound 2/1.

58 K. Wiberg / J. Chromatogr. A 1108 (2006) 50–67
array detector, a G1329A sample injector and a G1312 binarypump. Chromeleon version 6.11 was used as the chromato-graphic data system. The chromatographic column used was aZorbaxExtend (150 mm× 4.6 mm, 5.0�m particles). The flowwas 1.0 ml min−1 and the mobile phase contained 20 mM ammo-nium acetate buffer (pH 8.5) and acetonitrile in the ratio 75/25.The data collection rate for the DAD was 1.3 Hz, the wavelengthused was 220–380 nm and the runtime of the chromatogram was35 min. This means that the HPLC–DAD data file contained2623× 160 data points. PCA calculations were made in Simca-P 10.0.2 (Umetrics) and MCR-ALS calculations were made inMatlab version 6.5 (Mathworks) using the MCR function in thePLS toolbox version 2.0. All integrations of peaks were done inMatlab using the “trapz” function.
3.2. Reagents
A Millipore Milli-Q filtration/purification system was usedto produce the water used in the study. The mobile phase wasprepared with water, ammonium acetate (analysis grade) andacetonitrile (gradient grade). The structure and UV spectra ofprilocaine and its six related organic impurities[16] are shownin Fig. 7. As can be seen inFig. 7, the UV–vis spectra of prilo-caine and the six impurities can be divided into three groupsbased on the similarities between the spectra. Prilocaine andcd sa esws witha wert theyu n inT er),t t theahcb (summ dowo anci forc foc
TC entedi
C
BCFAPED
3.3. Analytical procedure
Five replicates of the sample solution were analysed onthe HPLC–DAD system. The peaks of the seven compoundswere baseline-separated in all chromatograms and there wasminimum retention time drift. For the PCA approach, theHPLC–DAD data were exported from Chromeleon to MS Exceland then imported to Simca-P, where PCA calculations weremade. The PCA calculations were made without any scaling orpre-treatment of the data.
For the MCR-ALS analysis, the HPLC–DAD data of onepeak at a time were imported into Matlab, i.e. importing theDAD data of the time window where each peak eluted. Sep-arate MCR-ALS analyses where thus made for all peaks. Foreach peak analysed, a vector containing ones was used as aninitial guess since in this DAD data only one compound eluted.The constraints applied were non-negativity on both the chro-matograms and spectra.
The score chromatograms from the PCA approach, the esti-mated concentration profiles from the MCR-ALS analyses andthe chromatograms at different wavelengths were then importedinto Matlab, where integration using the “trapz” function wasperformed. All integrations were thus carried out in exactly thesame way. The results obtained for the five samples were thesame and the results presented here come from the first of thefive samples.
4
inedf gths,w f thei tiona own.A deedp ak ofc allera 0 nm,wr erentw e areao eak,i l-
TR -t
I alue
BCFAED
Tc
ompounds C and A have very similar spectra (Fig. 7a), aso compounds E, D and F (Fig. 7b), while compound B haunique spectrum (Fig. 7c). Prilocaine and the six impuritiere supplied by AstraZeneca Bulk Production Sodertalje. Theamples were prepared by weighing into stock solutionscalibrated balance, Sartorius MC5. The stock solutions
hen further diluted and mixed in a ratio according to howsually appear. The content of the sample solution is showable 2(with the compounds presented in the elution ordogether with estimated molar absorption coefficients absorbance maximum wavelength (εmax). The value ofεmaxas been estimated byεmax = ∑
Aλmax/lc, wherel = 1 cm andare the concentrations given inTable 2in M.
∑Aλmax has
een estimated by summing the absorbance of each peaking the absorbance at each time point in the elution winf the peak) at the wavelength where the maximum absorb
s, i.e. 230 nm for prilocaine, compounds A and C, 242 nmompound F, 245 nm for compounds D and E and 232 nmompound B.
able 2ontent andεmaxof the compounds in the sample solution (compounds pres
n the elution order)
ompound Content (nmol ml−1) εmax (l M−1 cm−1)
18.82 78319.01 9914
11.07 2428910.14 8947
rilocaine 4566.21 100799.47 216507.93 27598
e
-
e
r
. Results and discussion
As previously mentioned, different peak sizes are obtaor the same compound with detection at different wavelenhich in turn can give serious under- or overestimates o
mpurities. InFig. 8, the chromatograms of the sample solut three different wavelengths (220, 240 and 260 nm) are shs can be seen, detection at different wavelengths does inroduce quite different chromatograms. For example, the peompound B is very large at 220 nm, while being much smt 260 nm, and compound F has a very high peak at 24hile the same peak at 220 nm is much smaller. InTable 3, the
elative area ratios are shown for chromatograms at diffavelengths. The relative area ratios are calculated as thf each impurity peak relative to the area of the prilocaine p
.e. 100× (areaimpurity peak/areaprilocaine peak). The reference va
able 3elative area ratios, 100× (areaimpurity peak/areaprilocaine peak), from the integra
ion at different wavelengths
mpurity 220 nm 240 nm 260 nm 280 nm Reference v
0.23 0.27 0.10 1.62 0.410.19 0.19 0.18 0.13 0.200.19 0.70 0.90 0.49 0.240.20 0.21 0.27 0.37 0.220.17 0.52 0.97 0.90 0.210.21 0.56 0.90 0.76 0.17
he reference value for each peak is also shown, i.e. 100× (contentimpurity/ontentprilocaine).

K. Wiberg / J. Chromatogr. A 1108 (2006) 50–67 59
Fig. 7. UV spectra and structures of prilocaine and the six impurities: (a) prilocaine and compounds A and C; (b) compounds D, E and F; (c) compound B.
ues are also shown, calculated as the ratio of the content (innmol ml−1) of each impurity relative to the prilocaine content,i.e. 100× (contentimpurity/contentprilocaine). As can be seen, thearea ratios vary considerably with the detection at differentwavelengths. The area ratio of compound B, for example, is0.23 at 220 nm, while at 280 nm it is 1.62. From the results inTable 3, it can be concluded that the best results are obtained
with detection at 220 nm. It could therefore be suggested fromthese results that, as a rule, detection at as low a wavelength aspossible should be used. This could perhaps in some sense serveas a general rule since many compounds absorb strongly in thelow UV range. There are, however, some serious obstacles tousing this rule. Many compounds show maximum absorbanceat higher wavelengths and gradient elution with organic solvents

60 K. Wiberg / J. Chromatogr. A 1108 (2006) 50–67
Fig. 8. Chromatogram of the sample containing prilocaine and the six impuritiesat 220, 240 and 260 nm.
such as methanol generally causes large background absorbancein the low UV range, making it impossible to use in the detec-tion. Finally, it is not possible to actually know beforehandwhat single wavelength will give the most accurate results interms of quantification with area ratios for a given chromatogramunlessε and the corresponding response factor are known for allpeaks.
In a typical analysis of chromatographic purity in the phar-maceutical industry, the chromatogram consists of one majorpeak, which is the active ingredient, and several much smallerpeaks, consisting of the impurities. The ratio of the main peakof the chromatogram to the other peaks may often be 500:1 ormore. This means that if PCA decomposition is done on thistype of HPLC–DAD data, the first PC will always be related tothe main peak, i.e.p1 will capture the spectrum of the activeingredient in the sample, the explanation being that the first PCwill be related to the largest variation in the HPLC–DAD data.When the first PC has been determined, the residual matrixE1is calculated according to:
E1 = X − t1p′1 (6)
Sincep1 will have the same shape as the spectrum of the majorpeak, this spectrum multiplied byt1 will be subtracted from theraw DAD data (X). Subsequent PCs will thus be related to thesmaller impurity peaks in the chromatogram.
ayH sixiF ADd alms bes th thec Da timea eachi theH ape
Fig. 9. Three-dimensional illustrations of the matrices from PCA decomposi-tion of the HPLC–DAD data of the sample containing prilocaine and the siximpurities: (a) raw DAD data (X); (b) first PC (t1p′
1) and (c) the residual matrixafter the first PC has been determined (E1).
with absorbance maxima at 232 and 283 nm, while the othercompounds have peaks with absorbance at a single absorbancemaximum. Compounds F, E and D have an absorbance maxi-mum around 245 nm, while compounds C, A and prilocaine havean absorbance maximum at about 230 nm.Fig. 9b shows a three-dimensional illustration of the first PC,t1p′
1. Sincep1 shows ashape similar to the UV spectrum of prilocaine, this spectrum is
In Fig. 9, the PCA decomposition of the two-wPLC–DAD data of a sample containing prilocaine and the
mpurities is illustrated with one PC according toX = t1p′1 + E1.
ig. 9 shows three-dimensional plots of the raw HPLC–Data,X (Fig. 9a), the first PC, i.e.t1p′
1 (Fig. 9b), and the residuatrix when the first PC has been calculated,E1 (Fig. 9c). The
cale inFig. 9has been chosen to allow all impurity peaks toeen, and all the peaks in the figure have been labelled wiompound name. InFig. 9a, the raw data of the HPLC–DAnalysis are shown with the absorbance as a function ofnd wavelength. As can be seen, the UV spectrum of
mpurity forms the three-dimensional shape of the peak inPLC–DAD data. Compound B shows a ‘double peak’ sh

K. Wiberg / J. Chromatogr. A 1108 (2006) 50–67 61
placed on all peaks in the first PC. PC1 gives a good descriptionof the impurity peaks with a similar UV spectrum as prilocaine,i.e. compounds C and A. This means that the first score vectort1 will give a good quantitative estimate of the actual content ofcompounds C and A. For the impurities with a UV spectrum dif-ferent from the main peak (compounds B, F, E and D), however,the situation is different since the prilocaine spectrum placed oneach peak in PC1 will lead to over- and underestimates of theseimpurities. It can clearly be seen inFig. 9b that PC1 underes-timates compound B since the absorbance around 270–320 nmis not accounted for in PC1, which in turn implies that the areaof compound B in the first score vectort1 will be too small.Moreover, overestimates of compound F, E and D take placesince these compounds do not absorb as strongly as prilocainein the wavelength range 220–245 nm. This can also be seen bycomparing the UV spectra inFig. 7. Thus,t1 overestimates thecontent of compounds F, E and D.
The under- and overestimates of compounds B, F, E and Din PC1 cause residual absorbance inE1 (Fig. 9c). In Fig. 9c itcan be seen that PC1 explains prilocaine, compounds C and Ato a very large extent since no residual absorbance is left inE1for these compounds, whereas compounds B, F, E and D, whichhave a UV spectrum different from that of prilocaine, clearly
have residual absorbance inE1. This means that further PCs areneeded in order to describe the remaining residual absorbancein E1 for these compounds.
Fig. 10shows the scores and loadings of the PCA decompo-sition using two PCs.Fig. 10a and b show the score and loadingvector of the first PC (t1 andp1) andFig. 10c and d the secondPC (t2 andp2). As can be seen inFig. 10a, the first score vectorlooks like a normal chromatogram with positive peaks for allcompounds. In fact,t1 resembles an average chromatogram of220–380 nm. The corresponding loading shown inFig. 10b hasa shape similar to the UV spectrum of prilocaine due to the dom-inant prilocaine peak in the chromatogram. The score vector forthe second PC,t2, however, has negative peaks for compoundsF, E and D, while the peak for compound B is positive (Fig. 10c).Furthermore, the peaks for prilocaine, compounds C and A arevery small since they have been sufficiently described by the firstPC. The loading for the second PC (Fig. 10d) shows that PC2 ismainly related to compounds F, E and D since the absorbancemaximum around 245 nm is seen inp2, which is characteris-tic of the UV spectra of these compounds (Fig. 7), although itis also related to compound B. It can therefore be concludedthat PC1 describes mainly prilocaine and compounds C and A,while PC2 describes compounds F, E, D and B. It should, how-
Fp
ig. 10. Scores and loadings of the PCA decomposition of the HPLC–DAD da
1; (c) scoret2; (d) loadingp2.
ta of the sample containing prilocaine and the six impurities: (a) scoret1; (b) loading
62 K. Wiberg / J. Chromatogr. A 1108 (2006) 50–67
ever, be pointed out that since all compounds absorb in the range220–300 nm, PC1 describes to some extent the spectral variationof every compound, while PC2 not describes prilocaine or com-pounds C and A. The loading of each PC shows which spectralinformation each PC is related to.
AsFig. 10illustrates, the score vectors from the PCA decom-position of the HPLC–DAD data can be seen as ‘score chro-matograms’. On the assumption thatεmax is approximately thesame in the peaks in the chromatogram, these can be used todetermine area ratios that correspond to the actual content of theimpurities, since the first PC describes the main compound andall impurities with a similar spectrum and PC2 the impuritieswith other spectra.
The results of the PCA decomposition of the HPLC–DADdata and the subsequent integration of the score chromatogramsas well as the corresponding results of the MCR-ALS anal-ysis are shown inTable 4. The integrated areas of thepeaks in each score chromatogram and the relative arearatios (100× (areaimpurity/areaprilocaine)) of each compound,summing the areas of the peaks in the score vectors, areshown for the PCA method on the left inTable 4. Therelative area ratios are thus calculated from the integratedareas by summing one and two score vectors, wherea, isthe index of PCs used. For compound B, the area ratios arethus calculated as follows:a = 1:100× (648/234990),a = 2:100× ((648 + 142)/234990-68). The integrated areas and rela-tA efc
t theac othec scoc d Ct suf-fi .C ins t PC
The area ratios of compounds C and A are the same using one ortwo score vectors, while the area ratios for the other compoundsobtains results closer to the reference values when both scorechromatograms are used. The area ratios of all compounds arethus more similar to the reference values when two score chro-matograms are utilised.
As can be seen on the right inTable 4, the MCR-ALS analysisgave relative area ratios for compounds B, C and A that werequite close to the reference values. The relative area ratios forcompounds F, E and D, however, were consequently higher thanthe reference values, which might be related to the higherεmaxvalues of these compounds (Table 2).
The results obtained with PCA illustrate how the proposedmethod can be used for quantitative impurity profiling, givingarea ratios that are quantitatively closer to the reference valuesthan any single wavelength chromatogram (Table 3). The signsof the peaks int2 are further discussed below in Section4.3.
To sum up, the key features that make this method work forquantitative impurity profiling without any calibration are:
(a) The general assumption that the chromatogram contains onemajor peak and several much smaller ones, all of which arecompletely separated.
(b) The additional assumption that the maximum molar absorp-tion coefficients (at the absorbance maximum of each peak),ε , are approximately the same. When all of the spectral
CAined
that
( aincoret ofthe
willehence
TR -ALS
C lue
)
BCFAPED
F mato cort S ana e relativea ence
ive area ratios (100× (areaimpurity/areaprilocaine)) using MCR-LS are shown on the right inTable 4. The reference valu
or each impurity peak is also shown: (100× (contentimpurity/ontentprilocaine)).
In the results of the PCA method, it can be seen tharea ratios obtained for compounds A and C fromt1 are verylose to the reference values, while the area ratios for theompounds are poorer. Looking at the areas of the secondhromatogram,t2, it can be seen that the compounds A anhat have a UV spectrum similar to that of prilocaine areciently described by PC1 since the area int2 is very smallompounds F, E, D and B, however, obtain large areast2ince their spectra was not sufficiently explained by the firs
able 4esults of the application of the proposed PCA approach as well as MCR
ompound PCA method
Integrated area Relative area ratio (%
t1 t2 a = 1 a = 2
648 142 0.28 0.34447 4 0.19 0.19
1192 −590 0.51 0.26491 −10 0.21 0.20
rilocaine 234990 −68937 −486 0.40 0.19941 −490 0.40 0.19
or the PCA approach, the integrated areas of the peaks in the score chrohe score chromatogram are shown (left). Number of PCs =a. For the MCR-ALrea ratios are calculated by 100× (areaimpurity peak/areaprilocaine peak). The refer
rre
.
maxdata from the HPLC–DAD analysis are utilised in the Pdecomposition, correct quantitative ratios can be determfrom the score chromatogram despite the fact thatεmax isnot exactly the same in the different peaks (somethingnot is possible using a single wavelength).
c) In impurity profiling, PC1 will always be related to the mcompound due to its much higher content and the svector of the first PC will accurately describe the contenpeaks with a UV spectrum similar to the main peak inchromatogram. Impurity peaks with different spectragive a residual absorbance inE1, which is captured in thsecond PC, and the use of score chromatograms cantake account of different spectra.
to the HPLC–DAD data of the prilocaine example
MCR-ALS Reference va
Integrated area Relative area ratio (%)
777 0.33 0.41447 0.19 0.20
1290 0.55 0.24483 0.21 0.22
2335501016 0.44 0.211083 0.46 0.17
grams as well as relative area ratios of each impurity using one and two se vectors inlyses, the integrated areas and relative area ratios are shown (right). Thvalue for each peak is also shown, i.e. 100× (contentimpurity/contentprilocaine).
K. Wiberg / J. Chromatogr. A 1108 (2006) 50–67 63
Table 5Results of the application of the proposed PCA approach as well as MCR-ALS to real pharmaceutical HPLC–DAD data, example 1
Compound PCA method MCR-ALS Best possible singlewavelength (220 nm)
Reference value
Integrated area Relative area ratio (%) Integrated area Relative area ratio (%) Relative area ratio (%)
t1 t2 a = 1 a = 2
Main peak 162580 1925 162160Impurity 1 303 268 0.19 0.35 513 0.32 0.38 0.32Impurity 2 315 376 0.19 0.42 1703 1.05 0.50 0.36Impurity 3 222 232 0.14 0.28 377 0.23 0.36 0.31Impurity 4 1277 480 0.79 1.07 1898 1.17 1.41 1.07
For the PCA approach, the integrated areas of the peaks in the score chromatograms as well as relative area ratios of each impurity using one and two scorevectors in the score chromatogram are shown (left). Number of PCs =a. For the MCR-ALS analyses, the integrated areas as well as relative area ratios areshown (middle). The relative area ratio of the best possible single wavelength chromatogram is included as well (right). The relative area ratios arecalculated by100× (areaimpurity peak/areaprilocaine peak). The reference value for each peak is also shown, i.e. 100× (contentimpurity/contentprilocaine).
One obvious limitation of the method proposed is the situa-tion where the general assumption that theεmax of all peaks isapproximately the same is not fulfilled. This could, for instance,occur when compounds with very different molar absorptioncoefficients are present in the same chromatogram, e.g. conju-gated carbonyl compounds together with nonconjugated. Theerrors in the area ratios obtained using score chromatogramswill then be large; however, the error using detection at a singlewavelength will most likely be even larger. Looking at the esti-mates of theεmax of prilocaine and the six impurities inTable 2,it can be seen that compounds B, C and A have slightly lower andcompounds F, E and D higherεmax values than prilocaine. Theεmax values of compound D and E showed the largest differencecompared to prilocaine, with about 2.8 and 2.1 times as highanεmax. The content estimates for these compounds were, how-ever, quite accurate using the proposed method (Table 4) despitethe differences in maximum molar absorption coefficients. It isimportant to note that in the example shown in this paper withprilocaine and its impurities, the chromatogram at 220 nm gavegood results, i.e. an area% that corresponded fairly closely to thetrue content of the impurities. In a real example, however, thereis no way of actually knowing what the best separate wavelengthis, for which reason the proposed method could be quite useful.
4.1. Analysis of additional datasets
The two methods used for quantitative impurity profiling(PCA and MCR-ALS) have also been tested on two otherpharmaceutical compounds and four of their impurities. Thedata in these two additional examples are real pharmaceuticalHPLC–DAD data coming from an analysis of related organicsubstances. The amounts of the four impurities in each examplewere known as in the prilocaine example shown above, sincesynthetic mixtures of the main component and the impuritieswere made. The analyses of the two additional datasets usingthe PCA approach as well as MCR-ALS were performed as pre-viously described in Section3.3, and the results are shown inTables 5 and 6. They are presented in the same way as in the prilo-caine example (Table 4) and the results using the PCA approachare shown on the left and the results of MCR-ALS are shown onthe right inTables 5 and 6. For the PCA approach, the integratedareas of the peaks in each score chromatogram are shown as wellas the relative area ratios (100× (areaimpurity/areamain peak)) ofeach compound, summing the areas of the peaks in the scorevectors (shown on the left). The relative area ratios are cal-culated from the integrated areas by summing one and twoscore vectors, wherea, is the index of PCs used. The integrated
Table 6R -ALS
C -ALS e
egrat
M 5I 9I 3I 8I 7
F chro and two scorv r the tios ares length1 is als
esults of the application of the proposed PCA approach as well as MCR
ompound PCA method MCR
Integrated area Relative area ratio (%) Int
t1 t2 a = 1 a = 2
ain peak 93178 66 9264mpurity 1 178 −36 0.19 0.15 12mpurity 2 163 6 0.17 0.18 12mpurity 3 216 1 0.23 0.23 17mpurity 4 172 4 0.18 0.19 8
or the PCA approach, the integrated areas of the peaks in the scoreectors in the score chromatogram are shown (left). Number of PCs =a. Fohown (middle). The relative area ratio of the best possible single wave00× (areaimpurity peak/areaprilocaine peak). The reference value for each peak
to real pharmaceutical HPLC–DAD data, example 2
Best possible singlewavelength (260 nm)
Reference valu
ed area Relative area ratio (%) Relative area ratio (%)
0.14 0.65 0.150.13 0.45 0.170.19 0.39 0.190.09 0.33 0.20
matograms as well as relative area ratios of each impurity using oneeMCR-ALS analyses, the integrated areas as well as relative area rachromatogram is included as well (right). The relative area ratios arecalculated by
o shown, i.e. 100× (contentimpurity/contentprilocaine).

64 K. Wiberg / J. Chromatogr. A 1108 (2006) 50–67
areas and relative area ratios using MCR-ALS are shown inthe centre ofTables 5 and 6. The results using the “best pos-sible” chromatogram of a single wavelength are also shown.This chromatogram has been found by calculating area ratiosof the chromatograms at different wavelengths and then usingthe results of the chromatogram that gave the best result (clos-est to reference values). In the first example (Table 5), it canbe seen that the first PC underestimates all of the four impu-rities. Adding the second score chromatogram, however, givesarea ratios that correspond fairly well with the reference val-ues. As can be seen the results obtained by adding the twoscore chromatograms are better than the results of integrationof a chromatogram at 220 nm (best possible single wavelength).As can be seen in the centre ofTable 5, the MCR-ALS anal-yses gave relative area ratios for impurities 1, 3 and 4 thatcorresponded fairly well with the reference values. The arearatio of impurities 3 and 4 were slightly less accurate than thearea ratios estimated with the PCA approach, while the arearatio of impurity 1 was slightly better. The relative are ratiofor impurity 2, however, was significantly less accurate thanthe corresponding ratio estimated with the PCA approach. Acomparison with the relative area ratios of the best possible sin-gle wavelength (220 nm) chromatogram shows that the ratiosobtained using the PCA approach is better for all four impuri-ties, while the ratios obtained using MCR-ALS are better fortwo of the impurities (1 and 4) and worse for the other two (2a
ata singo corec purit t PCI ativea etteer n bes parw t lesa Ther PCAa s. Ac ramu s thab a esm
pro-p is or accr caine asetu ADd ared chrom asesa ougn PCAa
4.2. Number of principal components
As shown in the five datasets analysed with the proposedmethod in this paper, two PCs were sufficient to give accuratequantitative area ratios in all cases. The first PC gives a goodestimate of all impurities with a spectrum similar to the mainpeak, while the second PC adds or subtracts area from the impu-rities with other spectra, the explanation being that most organiccompounds absorb strongly in the low UV range and the spectraof all peaks will have this absorbance in common. The first PCwill therefore to some extent describe all peaks, while the sec-ond PC will add or subtract area from peaks with spectra thatdiffer significantly from the spectrum of the major compound.This illustrates that two PCs are generally sufficient.
It might, however, in some cases be the case that the useof an additional PC will improve the quantitative estimates. Ifone impurity peak is much larger than the rest or if one impu-rity has a very different spectrum, are two possible situationswhere an additional PC might be needed. If a third PC is cal-culated in the prilocaine example, the relative area ratios ofcompounds F and B will improve to 0.24 and 0.39, respectively(reference values 0.24 and 0.41), while the ratios of the othercompounds will be the same. As was previously discussed inSection3.2, the UV–vis spectra of prilocaine and the six impu-rities can be divided into three groups based on the similaritiesbetween the spectra. This explains why the results in the prilo-c , somed osed.T ome-t t int , thel kingi ia-t signsot endedf
4
an-t f ano ationc ativep ogramo ina ever,i i.e.t ithouta ke itq rt
lingt n thei atedt vec-t hile
nd 3).Looking at the second example (Table 6), it can be seen th
ccurate content ratios are obtained for impurities 2–4 unly the first score chromatogram. Adding the second shromatogram gives a negligible area addition to these imies since they have been accurately described with the firsmpurity 1 in this example does, however, obtain a large negrea int2 and by adding the two score chromatograms a bstimate of this impurity is obtained. In the centre ofTable 6, theesults from the MCR-ALS analyses are shown, and it caeen that the area ratios obtained were quite accurate comith the reference values for impurities 1 and 3, somewhaccurate for impurity 2, and quite inaccurate for impurity 4.esults of the MCR-ALS analyses are comparable with thepproach, although less accurate for two of the impuritieomparison with the results of integration of a chromatogsing the best possible single wavelength (260 nm) showoth chemometric methods gave more accurate relative areates for all four impurities.These two examples of application of the PCA method
osed to real pharmaceutical HPLC–DAD data from analyselated organic substances shows that the method givesate content estimates in the same way as in the priloxample. Furthermore, from the analyses of the five datsed in this study (two simulated and three real HPLC–Datasets) the PCA approach gives more accurate relativeeterminations than the best possible single wavelengthatogram. The results using MCR-ALS are in most clso better than the best possible single wavelength, althot quite as accurate as the results obtained with thepproach.
-.
r
eds
tti-
fu-es
a-
h
aine case are better using three PCs. There are, howeverrawbacks in using more than two PCs in the method prophe determination of the number of spectral groups can s
imes be difficult if many slightly different spectra are presenhe HPLC–DAD data. Furthermore, for each PC calculatedoadings and contribution plots become more abstract, mat more difficult to decide the origin of the contributing varion. Calculating more PCs also increases the risk of wrongf the peaks in the score chromatograms (see Section4.3). For
hese reasons two PCs should be sufficient and recommor general use of the method.
.3. Verification of the sign of the areas in t2
As previously described,t1 can be regarded as the first quitative estimate of the impurities since it has the shape ordinary chromatogram. In the second score vector the situan be different since there might be both positive and negeaks. The signs of the integrated area in the score chromatf the second PC (t2) are generally correct (which is the casell of the five datasets analysed in this paper). It is, how
mportant to keep in mind the rotational freedom in PCA,he sign of the score and loading vector can be changed wffecting the fit of the PCA model to the data. This might mauestionable to use the sign of the peaks int2 to decide whethe
o add or subtract the areas without any verification.As previously discussed, in related organic impurity profi
he active ingredient is always much higher in content thampurities, which means that the first PC will always be relo this compound. In the first PC, therefore, the loadingor (p1) will resemble the spectrum of the major peak, w

K. Wiberg / J. Chromatogr. A 1108 (2006) 50–67 65
the score vector (t1) will resemble an average chromatogram. Itis therefore also clear how the first residual matrixE1 will bedetermined according to the equation,E1 = X − t1p′
1, which foreach impurity peak means, the spectrum of the impurity minusthe spectrum of the main peak. Since the second PC (t2p′
2) iscalculated onE1, it is thus possible to deduce the origin of thesigns of the peaks obtained int2. The signs of the areas obtainedin t2 can be verified: (1) by using score contribution plots, or (2)by comparison of the spectrum of the active ingredient with thespectrum of each impurity.
The sign of the score vectors int2 can be confirmed with scorecontribution plots, revealing the set of variables, which makesthe greatest contribution for a given range of score values. Scorecontributions are generally given as
Contribution scores= �X × p (7)
where�X is the score range chosen andp is the componentloading[17]. Score contribution plots can thus easily be deter-mined for each impurity peak in the score chromatograms (somechemometric software like for instance, Umetrics, Simca-P havea easily used ‘contribution tool’ that makes it possible to directlyin the score plot obtain the score contributions). Investigation ofthe spectral variables that contribute to the peak, together withcomparisons with the UV spectrum, can be used in order toc
c si-t s. InF ndsF inF inlyc -s so o‘ ounB veryl ere-fb ep
In Fig. 11b, the contribution plot for compound F can beseen, the contribution mainly coming in the wavelength range220–230 nm. Comparing the UV spectra of prilocaine and com-pound F (Fig. 7) makes it easy to see that this is ‘false residualabsorbance’, i.e. absorbance not caused by the presence of com-pound F (the absorbance for compound F is much less thanfor prilocaine in the wavelength range 220–230 nm). This areafor compound F should therefore be subtracted from the areaobtained for compound F in the first score chromatogram,t1,since it is false absorbance caused by the PCA decomposition.The same is true for compounds E and D since they have UVspectra very similar to that of compound F. The sign of the peaksof compounds F, E and D int2 are thus also correct.
Generally, a careful inspection of the UV spectra of the dif-ferent peaks in the chromatogram also gives an indication ofwhether over- or underestimates of the compounds are to beexpected in subsequent score chromatograms. Comparing thespectrum of prilocaine with the spectra of compounds F, E andD shows thatp1 (which has the same shape as the prilocainespectrum) will overestimate these compounds due to their muchlower absorption in the wavelength range 220–240 nm. Further-more,p1 will underestimate the absorption of compound B inthe range 270–320 nm. This simple visual inspection of the UVspectra thus indicates that the first PC will overestimate the con-tent of compounds F, E and D and underestimate compound B.
The verification of the signs of the areas int can also bec ay ass aki nd to‘ iduala
4
fol-l
( gthf theCAlarge
poun
onfirm the signs of the peaks int2.Returning to the prilocaine example (Table 4andFig. 10) it
an be seen inFig. 10that the peak for compound B was poive in t2, while compounds F, E and D had negative peakig. 11, the score contribution plot for the peaks of compouand B in score chromatogramt2 are shown. As can be seenig. 11a, the contribution for the peak of compound B maomes in the wavelength range 275–325 nm int2, which correponds to real absorbance from compound B (Fig. 7). The peakf compound B in the score chromatogramst2 are thus related t
real residual absorbance’, i.e. real absorbance from compin the wavelength range 275–325 nm, which is absent or
ow for prilocaine and thus not accounted for by PC1. Thore, the area of compound B in score chromatogramt2 shoulde added to the area of compound B int1 and the sign of theak of compound B int2 is correct.
Fig. 11. Score contribution plots for the peaks of com
d
2omplemented with a plot of the second PC (in the same whown for PC1 inFig. 9). This will then show how each pe
s described, i.e. negative peaks in PC2 should correspofalse residual absorbance’ and positive ones to ‘real resbsorbance’, as discussed above.
.4. Practical procedure
The practical procedure for the method proposed is asows:
1) Investigate the HPLC–DAD file and identify the wavelenand retention time windows to be used. Some parts oinitial HPLC–DAD data may have to be omitted in the Panalysis, e.g. if gradient elution has been used and
ds B and F int2: (a) compound B int2; (b) compound F int2.

66 K. Wiberg / J. Chromatogr. A 1108 (2006) 50–67
background absorbance of solvents is present at some wave-lengths, or if injection disturbances occur in the front of thechromatogram, creating ghost peaks.
(2) Perform PCA decomposition of the HPLC–DAD data usingtwo PCs.
(3) Calculate the summed score chromatogram oft1 + t2 andintegrate the peaks.
(4) Verify the signs of the peaks int2 by investigation of con-tribution plots and pure UV spectra.
(5) Calculate relative area ratios from the areas obtained. If thecontent of the main peak is known, the area ratios can beused to estimate the content of the impurities.
4.5. Relative content or relative response factors
The area ratios obtained from the score chromatogram canalso be used to determine the content of each impurity ifthe content of the main compound is known. In the prilo-caine example, the prilocaine content was 4566 nmol ml−1,which means that for compound C, the content will be:(0.19× 4566)/100 = 8.7 nmol ml−1. Estimates of the content ofall impurities in the prilocaine example can be seen inTable 7,together with the reference values. As can be seen, the relativearea ratios give content predictions that agree fairly closely withthe reference values for all of the impurities. This indicates thatt profi lara thaε
relat gthsTu ora chrom tios( u-r h cae rama con-t thaw
R
TC arear
I e
BCFAED
T
If, for example, the response factor for compound B at 220 nmis desired, the calculations would be as follows. The area of thepeak of compound B at 220 nm is 102 (mAU× min) and theprilocaine peak is 44,594. The area% ratio between the peaks isthen 100× (102/44594) = 0.23. The PCA estimated content ratio(%) for compound B is 0.34, which gives the response factor forcompound B at 220 nm: 0.34/0.23 = 1.48.The relative responsefactors determined in this way can also be used to find a suitablewavelength, where the peaks of interest in the chromatogramhave a response factor as close to one as possible.
5. Conclusion
This study shows that in a chromatogram containing onemajor peak and several much smaller ones, all of which arecompletely separated, given the assumption that the peaks haveapproximately the same maximum molar absorption coefficients(εmax), although these being unknown, PCA decomposition ofHPLC–DAD data can be applied in order to obtain score chro-matograms that can be used for quantitative related organicimpurity profiling. The first PC will give accurate quantitativeestimates of all impurities showing a spectrum similar to themain peak, while the second PC will add information on impu-rities with a spectrum different from the main peak. Throughintegration of the score chromatograms, a good estimate ofthe content of the smaller peaks in the chromatogram can beo thisp , twos froma s wereo ativem t wasn couldb elop-m btaina rs ofi
A
atA ainee
R
ities
001)
Anal.
atogr.
89.and
he method proposed can be used for quantitative impurityling without any calibration and without knowing the mobsorption coefficients of the impurities (on the assumptionmax is approximately the same for all peaks).
The method proposed can also be used to estimateive response factors for impurities at separate wavelenhis response factor is here calledrelative since c isnknown andεmax is assumed to be roughly similar fll peaks. The area ratios obtained using the scoreatograms (Table 4) can be seen as relative content ra
contentimpurity/contentmain compound). The area ratio of an impity peak and the main peak at a specific single wavelengtasily be calculated from the integration of the chromatogt that wavelength. By then dividing the PCA estimated
ent ratio by this area ratio, the relative response factor foravelength (λ) can be obtained.
elative response factorλ = PCA content ratio
area ratioλ(8)
able 7alculation of the predicted content of the six impurities from the estimated
atios in the score chromatogram (Table 4) using two PCs
mpurity Ratio Predicted content(nmol ml−1)
Reference valu(nmol ml−1)
0.34 15.5 18.80.19 8.7 9.00.26 11.9 11.10.20 9.5 10.10.19 8.8 9.50.19 8.8 7.9
he reference values are also shown.
-
t
-.
-
n
t
btained without any calibration. The method proposed inaper has been tested on five different HPLC–DAD datasetsimulated and three containing real pharmaceutical datanalysis of related organic substances, and accurate resultbtained in all cases. MCR-ALS was tested as an alternethod and it gave comparable results, although overall iot as accurate as the proposed PCA approach. The methode a convenient alternative in, for example, the early devent phase of new pharmaceutical compounds in order to ogood estimate of the content or relative response facto
mpurities without any prior knowledge.
cknowledgement
The author wishes to thank Jan-Olov SvenssonstraZeneca for kindly supplying the data used in the prilocxample.
eferences
[1] International Conference on Harmonisation (ICH), Guideline: Impurin New Drug Substances, CPMP/ICH/142/95, May 1995.
[2] S. Gorog, Anal. Bioanal. Chem. 377 (2003) 852.[3] S. Gorog, Trends Anal. Chem. 22 (2003) 407.[4] M.J. Hilhorst, G.W. Somsen, G.J. de Jong, Electrophoresis 22 (2
2542.[5] M.A. Nussbaum, S.W. Baertschi, P.J. Jansen, J. Pharm. Biomed.
27 (2002) 983.[6] K. Wiberg, M. Andersson, A. Hagman, S.P. Jacobsson, J. Chrom
A 1029 (2004) 13.[7] H. Martens, T. Naes, Multivariate Calibration, Wiley, New York, 19[8] R.G. Brereton, Chemometrics Data analysis for the Laboratory
Chemical Plant, Wiley, Chichester, 2003.

K. Wiberg / J. Chromatogr. A 1108 (2006) 50–67 67
[9] J. Mandel, Am. Stat. 36 (1982) 15.[10] J.E. Jackson, A User’s Guide to Principal Components, Wiley, New
York, 1991.[11] S. Wold, K. Esbensen, P. Geladi, Chemometr. Intell. Lab. Syst. 2 (1987)
37.[12] R. Bro, Chemometr. Intell. Lab. Syst. 38 (1997) 149.[13] W. Lindberg, J.Ohman, S. Wold, Anal. Chem. 58 (1986) 299.
[14] R. Tauler, Chemometr. Intell. Lab. Syst. 30 (1995) 133.[15] M. Maeder, A.D. Zuberbuehler, Anal. Chim. Acta 181 (1986)
287.[16] European Pharmacopoeia 5.0 01 (2005) 1362.[17] L. Eriksson, E. Johansson, N. Kettaneh-Wold, S. Wold, Multi- and
Megavariate Data Analysis, Principles and Applications, Umetrics,Umea, 2001.